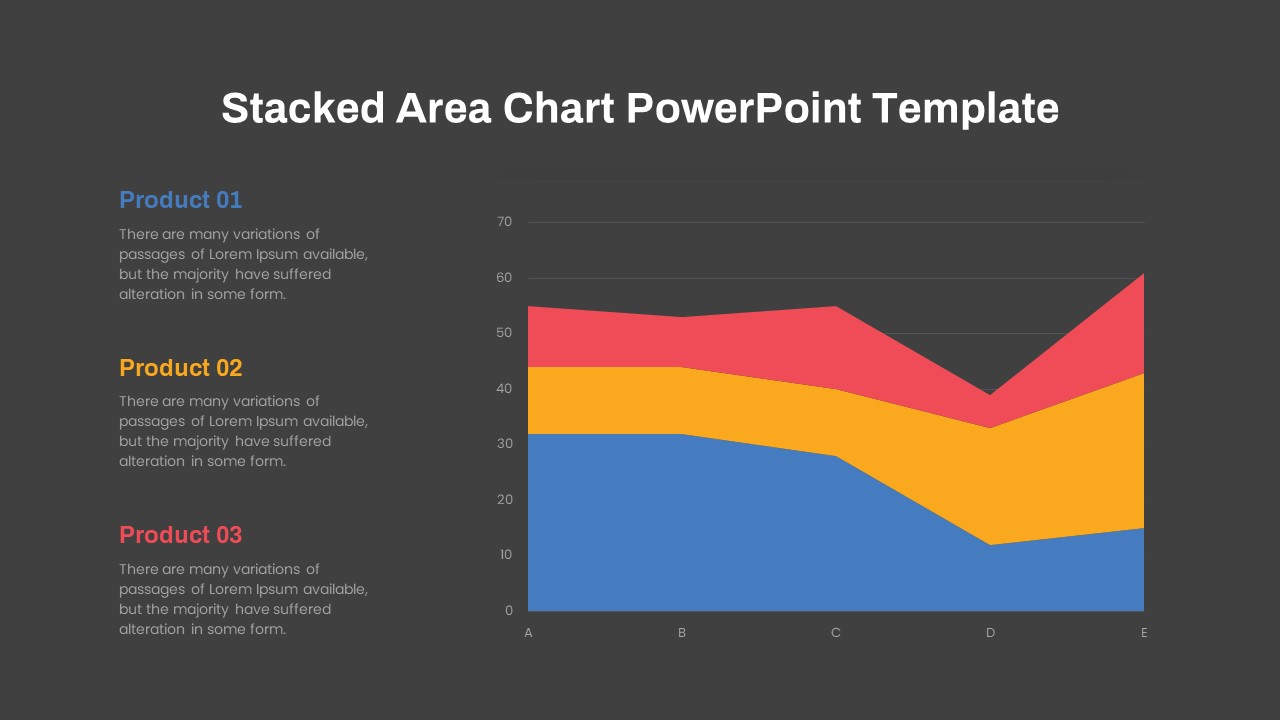
Dynamic Three-Series Stacked Area Chart Template for PowerPoint & Google Slides


Description
This slide features a three-series stacked area chart built entirely with editable vectors on a clean white master slide. The right side displays smooth, color-coded layers—blue (Product 01), yellow (Product 02), and red (Product 03)—stacked across five categories (A–E), with a customizable vertical axis up to 70. On the left, matching legend callouts include icon placeholders, headers, and text blocks for each series, all linked via theme fonts. Hidden guide layers let you adjust category labels, add or remove series, switch between flat and gradient fills, or toggle gridlines in seconds. Subtle drop shadows add depth, while grouped objects ensure bulk formatting of colors and fonts. Compatible with both PowerPoint and Google Slides, the chart preserves exact spacing, scaling, and formatting across platforms, making it ideal for visualizing comparative data trends over time.
Who is it for
Data analysts, marketing managers, and financial planners will leverage this stacked area chart to compare multi-product performance, revenue contributions, or survey results across categories. Business consultants and educators can also use it to illustrate cumulative trends and segment breakdowns.
Other Uses
Repurpose this template for resource-allocation overviews, budget vs. expense comparisons, demographic segment analyses, or any context requiring a clear view of combined data series. Simply relabel series, adjust colors, or modify category axes to suit your narrative.
Login to download this file

Item ID
SB03771
Related Templates

Multi-Series Stacked Bar Chart Template for PowerPoint & Google Slides
Bar/Column
Editable Multi-Series Peak Line Chart Template for PowerPoint & Google Slides
Comparison Chart
Multi-Series Line Chart with Icons Template for PowerPoint & Google Slides
Comparison Chart
Multi-Series Vertical Dot Chart Template for PowerPoint & Google Slides
Comparison Chart
Multi-Series Curved Line Graph Analytics Template for PowerPoint & Google Slides
Comparison Chart
Fishbone Timeline Infographic Series Template for PowerPoint & Google Slides
Manufacturing
Creative Dynamic Gantt Chart Timeline Template for PowerPoint & Google Slides
Timeline
Capital Structure Dynamic Split Chart Template for PowerPoint & Google Slides
Comparison Chart

Dynamic Marketing Radar Chart Analytics Template for PowerPoint & Google Slides
Comparison
Dynamic Benchmarking Comparison Chart Template for PowerPoint & Google Slides
Comparison Chart
Dynamic Sunburst Chart Visualization Template for PowerPoint & Google Slides
Charts
Dynamic Bar-of-Pie Chart Comparison Template for PowerPoint & Google Slides
Pie/Donut
Dynamic Financial Analysis Line Chart Template for PowerPoint & Google Slides
Finance
Free Stacked Column Chart Data Visualization Template for PowerPoint & Google Slides
Bar/Column
Free
Animated Stacked Bar Chart Template for PowerPoint & Google Slides
Bar/Column
Professional 100% Stacked Column Chart Template for PowerPoint & Google Slides
Bar/Column
Year-over-Year Stacked Gender Bar Chart Template for PowerPoint & Google Slides
Bar/Column
Stacked Waterfall Chart Template for PowerPoint & Google Slides
Bar/Column
Stacked Gantt Chart Timeline Slide Template for PowerPoint & Google Slides
Gantt Chart
Stacked Bar Chart for PowerPoint & Google Slides
Bar/Column
100% Stacked Bar Chart for PowerPoint & Google Slides
Bar/Column
Stacked Area Chart with Financial Highlights for PowerPoint & Google Slides
Finance
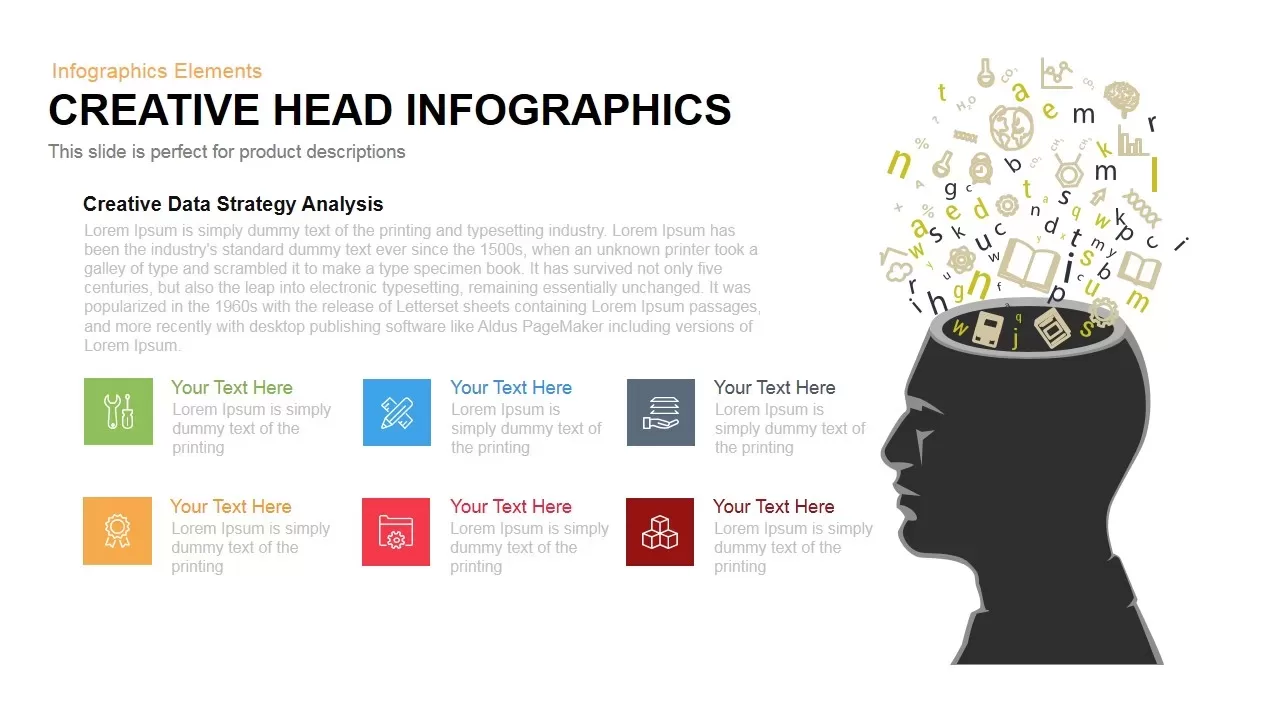
Dynamic Creative Head Infographics Template for PowerPoint & Google Slides
Circular
Dynamic Shield Process Flow Diagram template for PowerPoint & Google Slides
Process

Dynamic Circle Timeline Infographics template for PowerPoint & Google Slides
Timeline
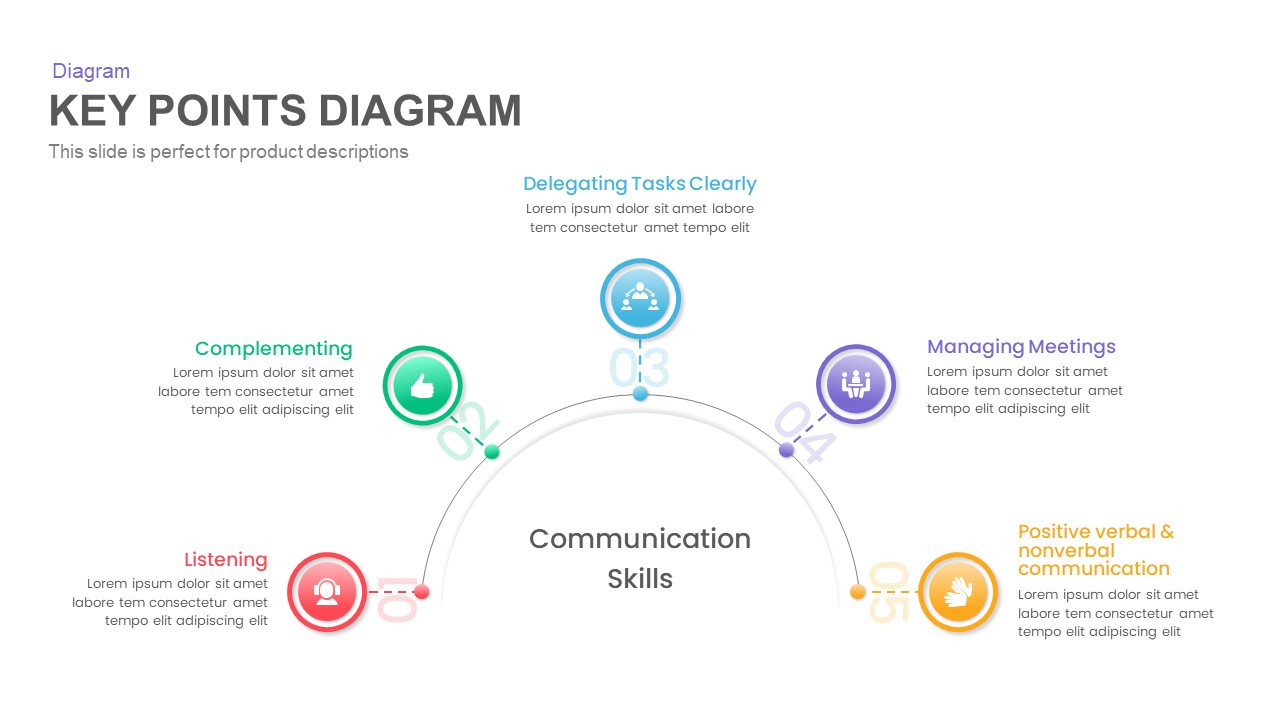
Key Points Diagram Presentation Template
Process

Dynamic Data Dashboard Infographic Template for PowerPoint & Google Slides
Bar/Column
Dynamic Arrow Process Template for PowerPoint & Google Slides
Process

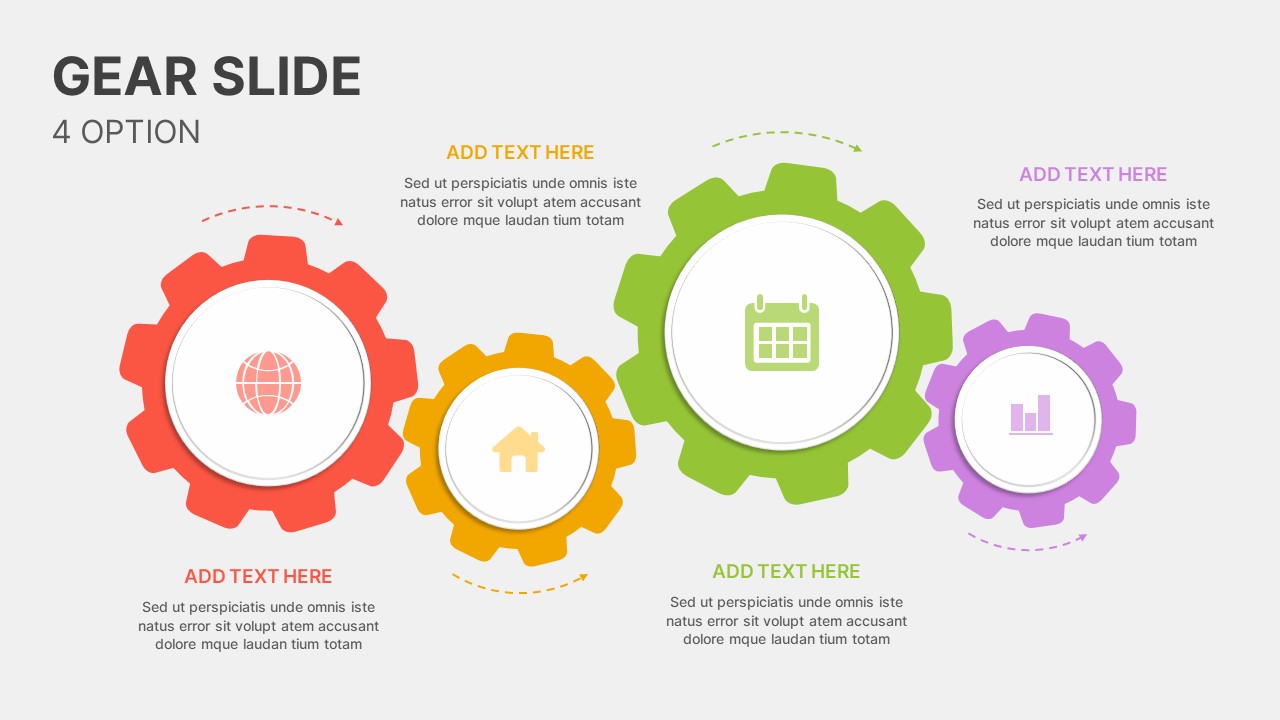
Dynamic 4 Gear Process Diagram Template for PowerPoint & Google Slides
Process
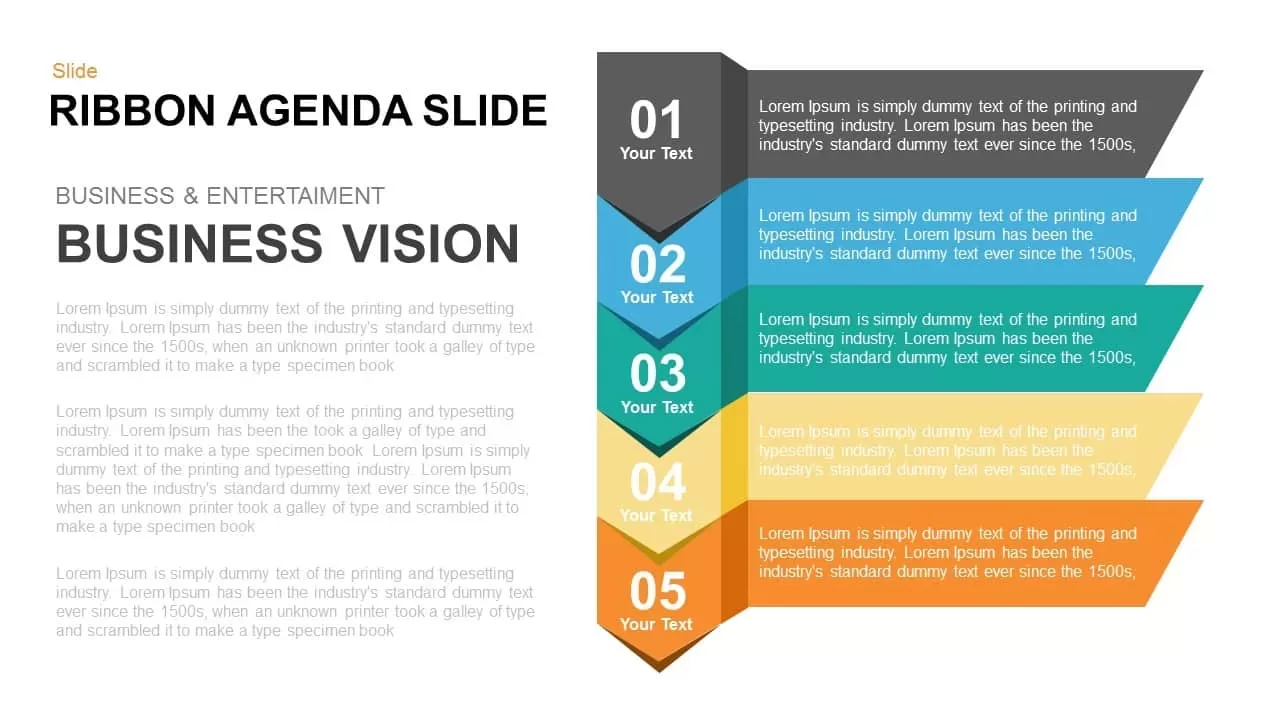
Dynamic Five-Step Ribbon Agenda Layout Template for PowerPoint & Google Slides
Agenda
Dynamic Multicolor Comparison Table Template for PowerPoint & Google Slides
Comparison
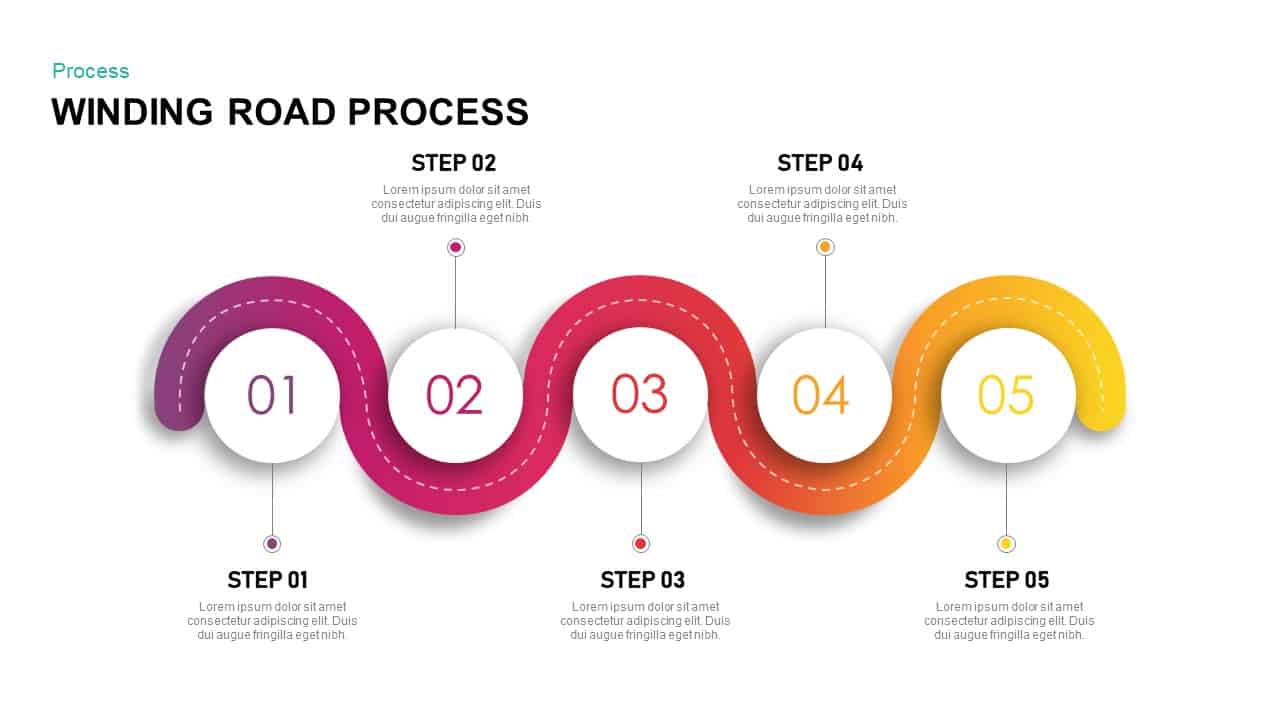
Dynamic Winding Road Process Timeline Template for PowerPoint & Google Slides
Process
Dynamic Winding Roadmap Infographic Template for PowerPoint & Google Slides
Roadmap
Dynamic AI Applications Infographic Template for PowerPoint & Google Slides
AI
Dynamic Growth Arrow Step Infographic Template for PowerPoint & Google Slides
Process
Dynamic Online Education Illustration Template for PowerPoint & Google Slides
Business Proposal
Dynamic Gear Diagram Infographics Template for PowerPoint & Google Slides
Process
Modern & Dynamic 6-Step Agenda Sequence Template for PowerPoint & Google Slides
Agenda
Dynamic Curved Arrow Process Roadmap Template for PowerPoint & Google Slides
Process
Dynamic Conveyor Belt Process Flow Template for PowerPoint & Google Slides
Process
Dynamic Statistics & Progress Charts Template for PowerPoint & Google Slides
Pie/Donut
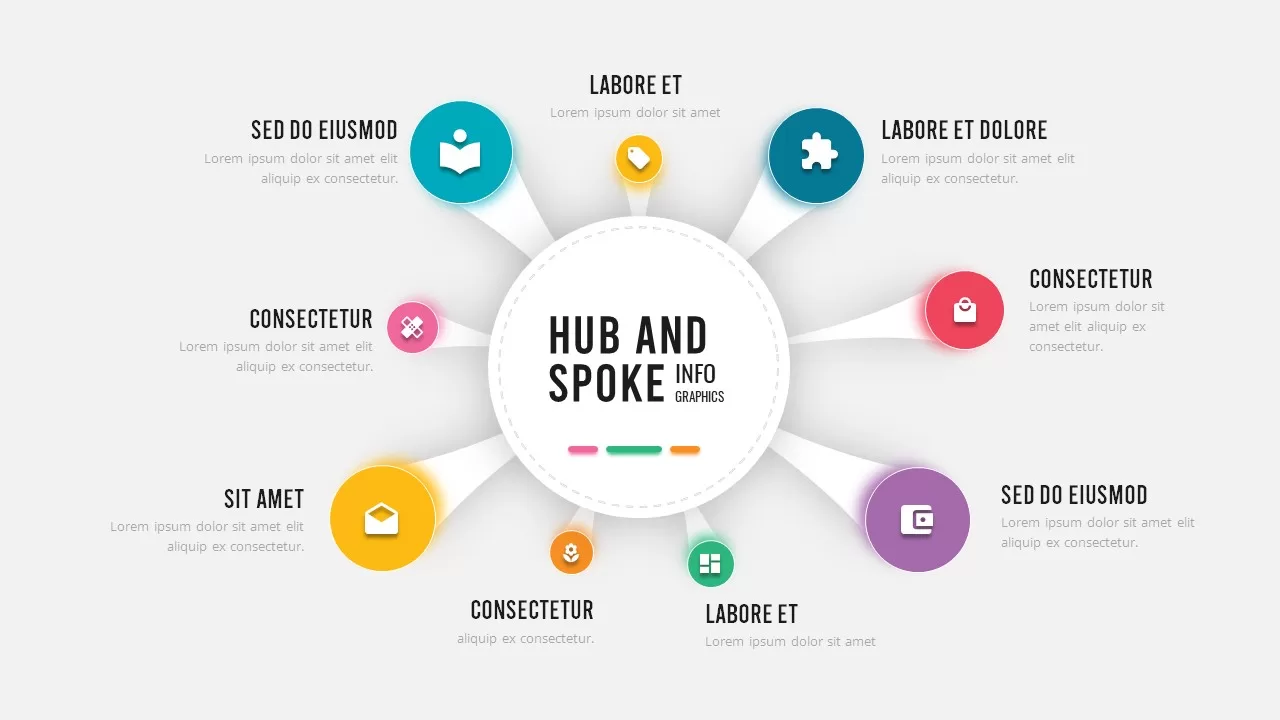
Dynamic Hub-and-Spoke Infographic Diagram Template for PowerPoint & Google Slides
Circular
Dynamic Circular Hub-and-Spoke Infographic Template for PowerPoint & Google Slides
Circular
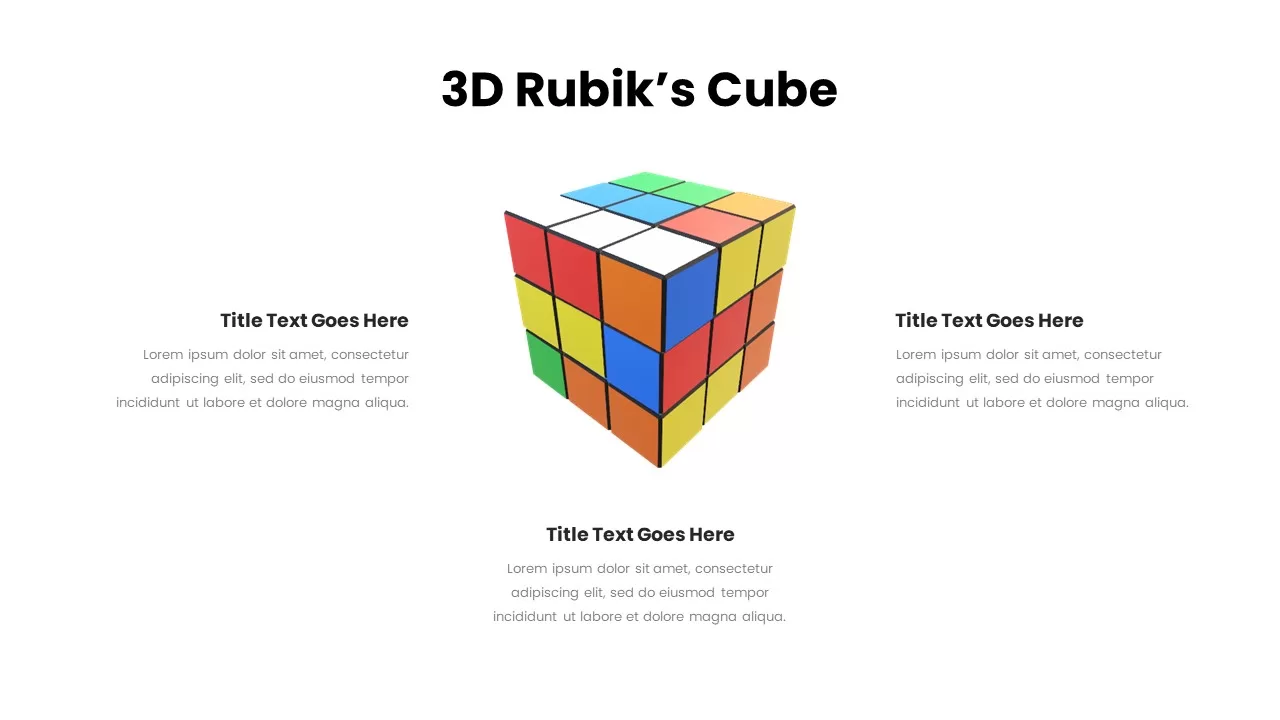
Dynamic 3D Rubik’s Cube Diagram Pack Template for PowerPoint & Google Slides
Infographics
Dynamic Four-Step Gear Process Template for PowerPoint & Google Slides
Process
Dynamic Basketball Training Promotion Template for PowerPoint & Google Slides
Advertising
Dynamic Hurdle Race Presentation Template for PowerPoint & Google Slides
Advertising
Dynamic Sprint Race Cover Slide Template for PowerPoint & Google Slides
Graphics
Dynamic Soccer Stadium Presentation Template for PowerPoint & Google Slides
Graphics
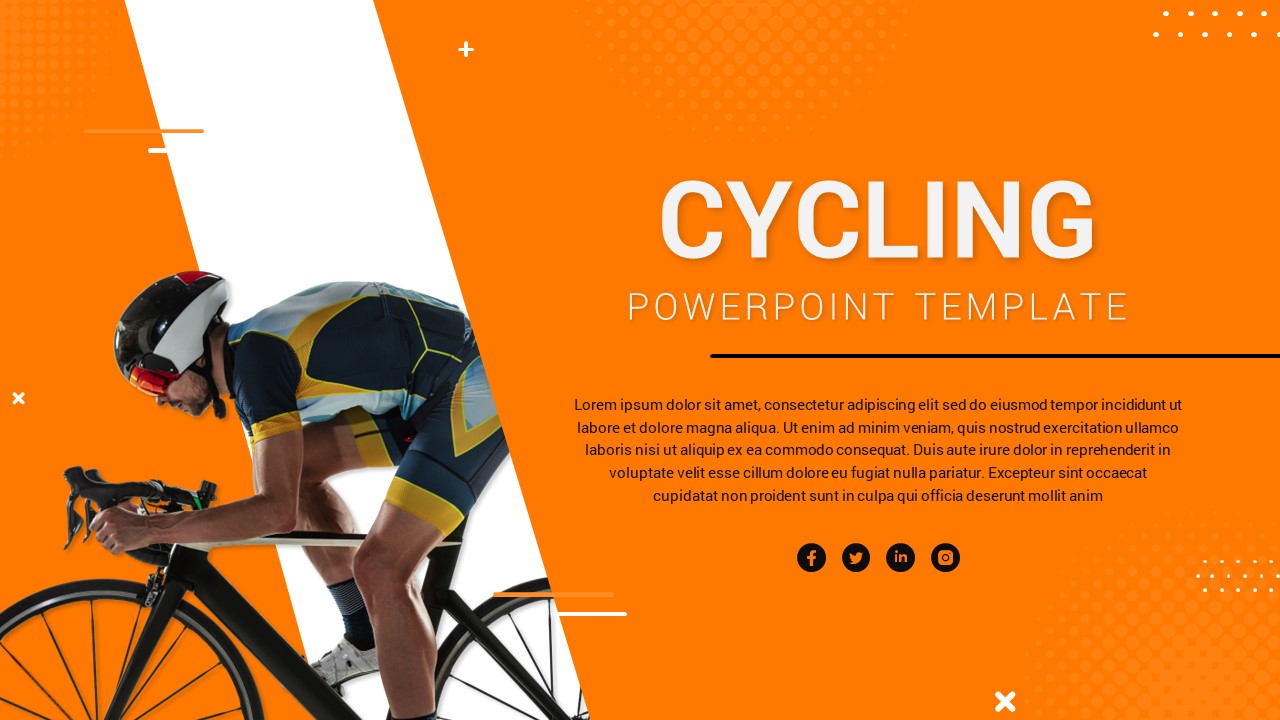
Dynamic Cycling Presentation Template for PowerPoint & Google Slides
Graphics
Dynamic Boxing Training Cover Slide Template for PowerPoint & Google Slides
Graphics
Dynamic Relay Race Presentation Slide Template for PowerPoint & Google Slides
Graphics
Dynamic Chevron Timeline Infographic Template for PowerPoint & Google Slides
Timeline
Dynamic Animated Question Mark Template for PowerPoint & Google Slides
Graphics
Dynamic Abstract Corporate Theme Template for PowerPoint & Google Slides
Decks
Dynamic Investment & Finance Growth Template for PowerPoint & Google Slides
Finance
Dynamic Fundraising Thermometer Slide Template for PowerPoint & Google Slides
Revenue

Dynamic Green Field Sports Presentation Template for PowerPoint & Google Slides
Decks
Dynamic Business Key Drivers Slide Template for PowerPoint & Google Slides
Process

Free Dynamic Global Warming Presentation Template for PowerPoint & Google Slides
Pitch Deck
Free
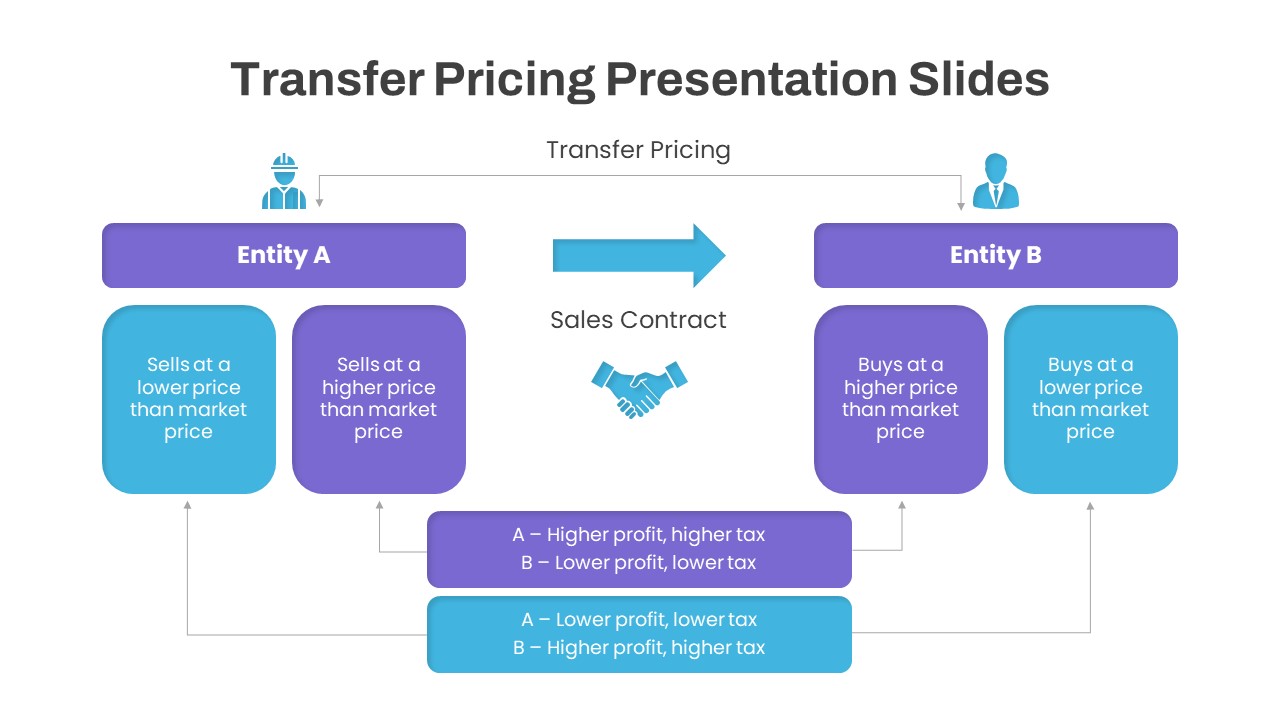
Dynamic Transfer Pricing Flow Diagram Template for PowerPoint & Google Slides
Finance
Dynamic Carousel Icon Hub Diagram Template for PowerPoint & Google Slides
Circular
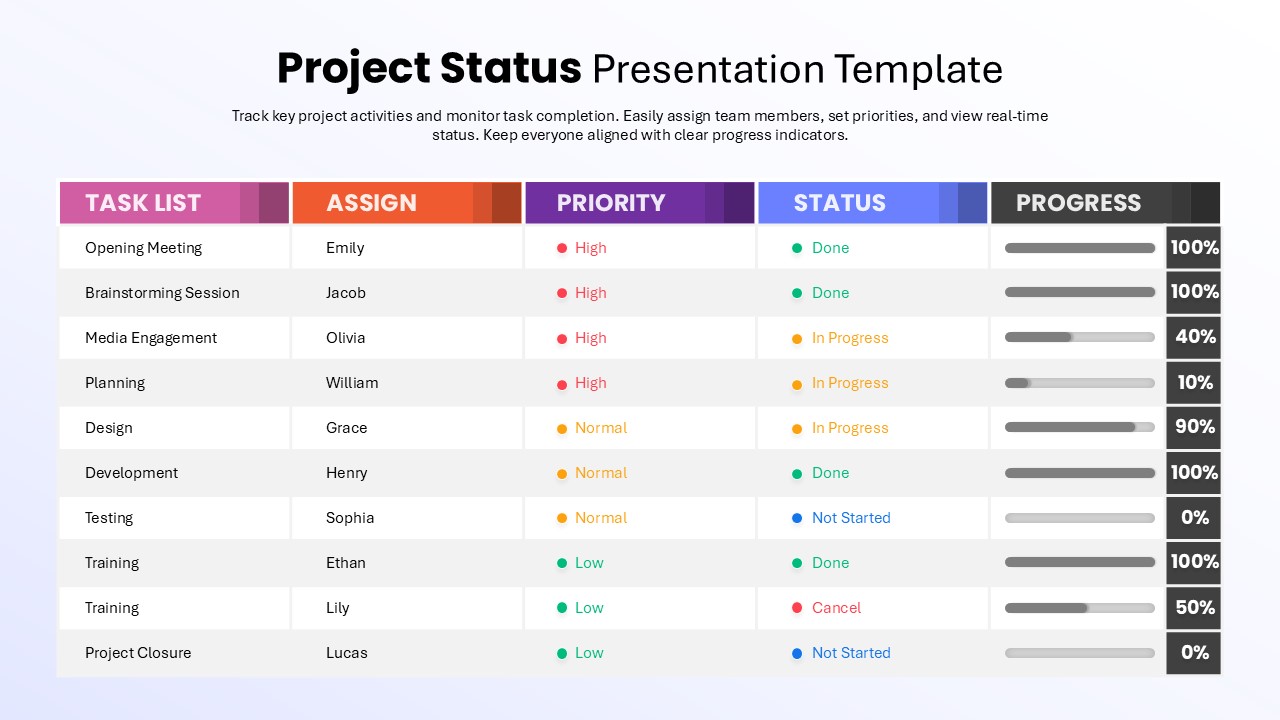
Dynamic Project Status Tracking Table Template for PowerPoint & Google Slides
Project Status
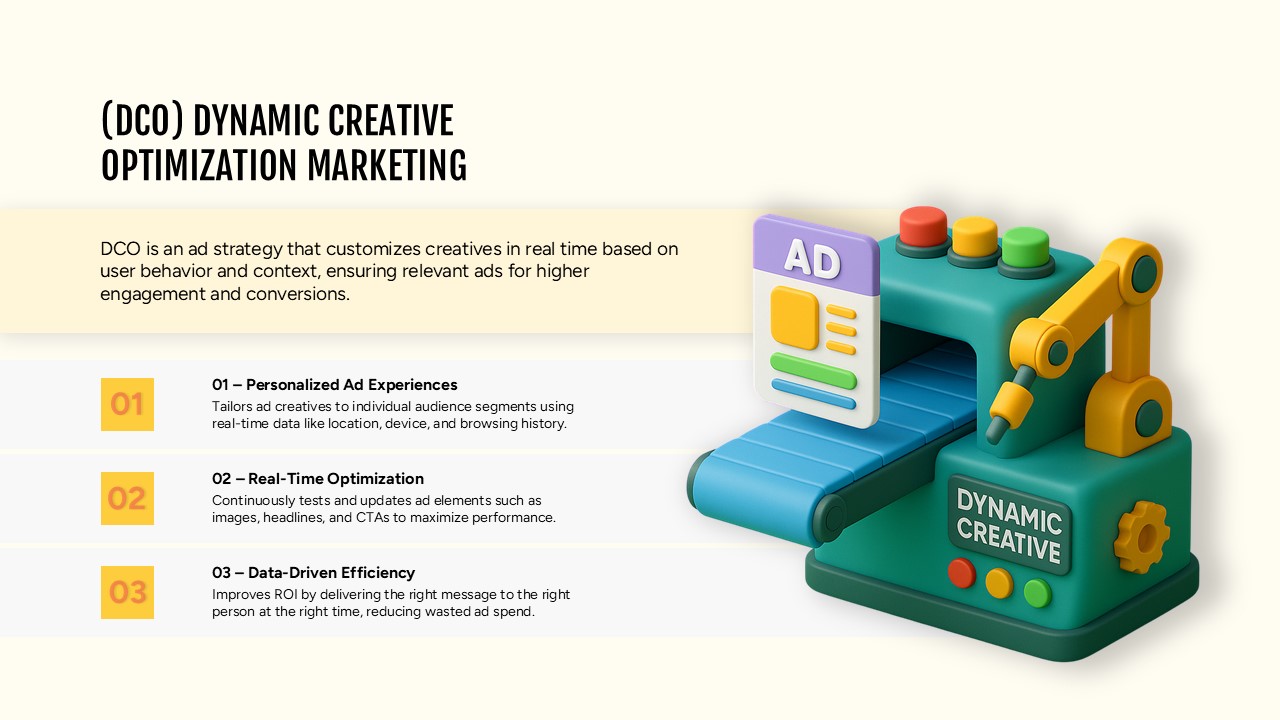
Dynamic Creative Optimization Marketing Template for PowerPoint & Google Slides
Digital Marketing
Dynamic Tennis Sports Theme Slide for PowerPoint & Google Slides
Graphics
3D Stacked Infographic Layers Data Template for PowerPoint & Google Slides
Pyramid

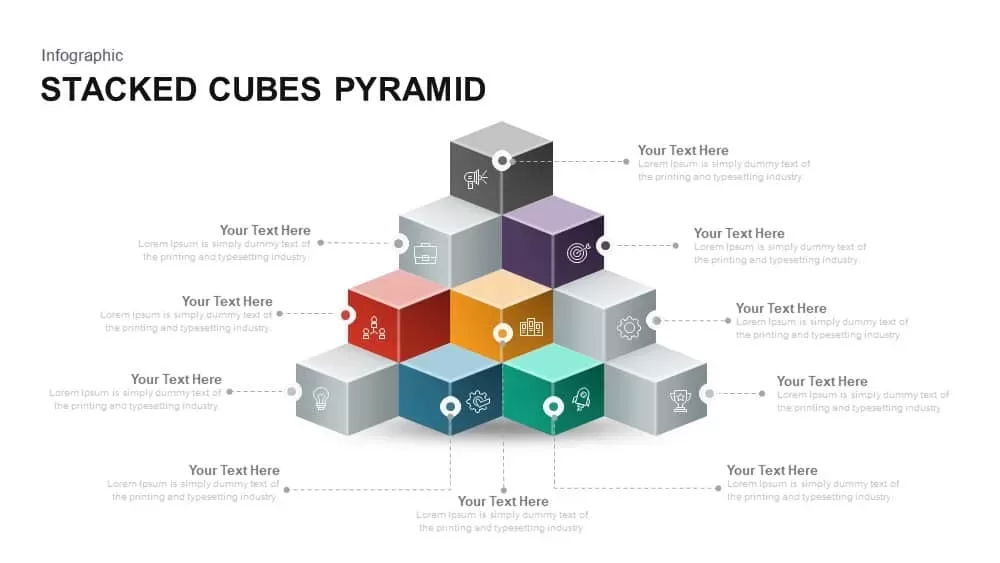
Stacked Cubes Pyramid Infographic Template for PowerPoint & Google Slides
Pyramid
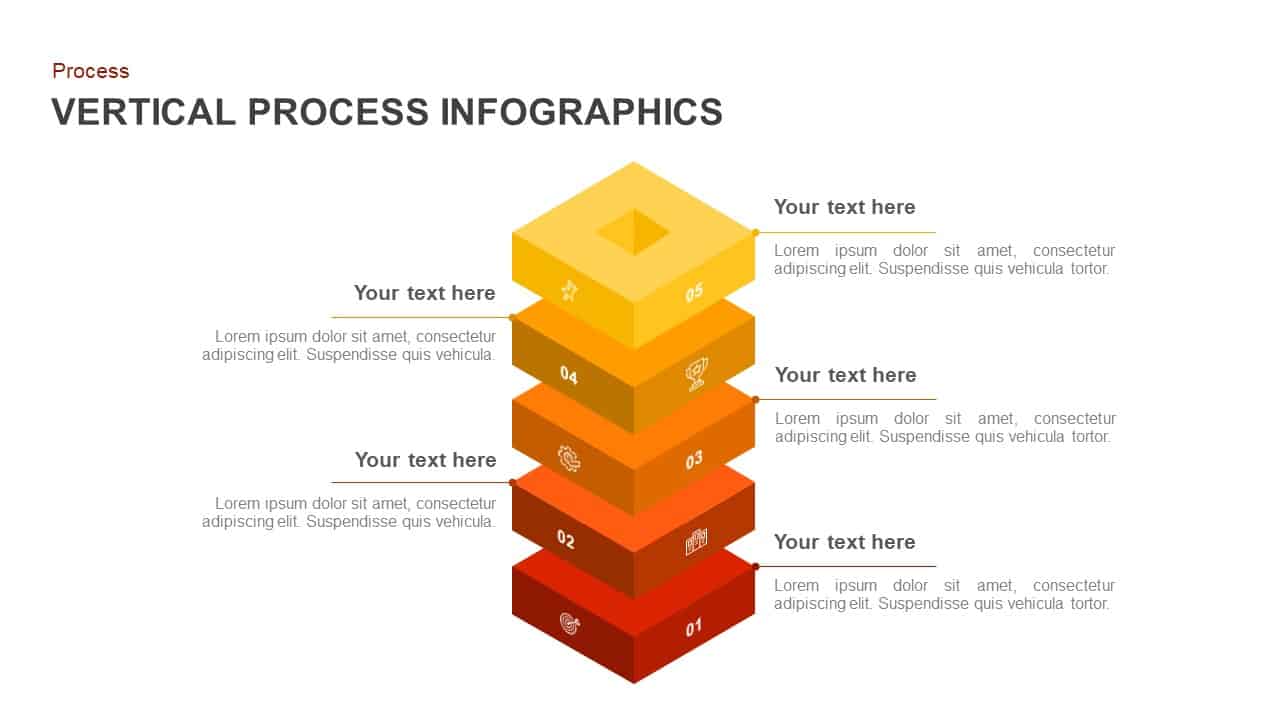
Vertical Stacked Process Infographic Template for PowerPoint & Google Slides
Process
Stacked Cubes Pyramid Six-Option Diagram Template for PowerPoint & Google Slides
Pyramid
Elegant Stacked Photo Collage Layout Template for PowerPoint & Google Slides
Graphics
Three-Year Bar Chart template for PowerPoint & Google Slides
Charts
Three-Stage Circular Options Chart Template for PowerPoint & Google Slides
Comparison
Five-Phase and Three-Phase Phases Chart Template for PowerPoint & Google Slides
Charts
Three Segment Donut Chart KPI Infographic Template for PowerPoint & Google Slides
Pie/Donut
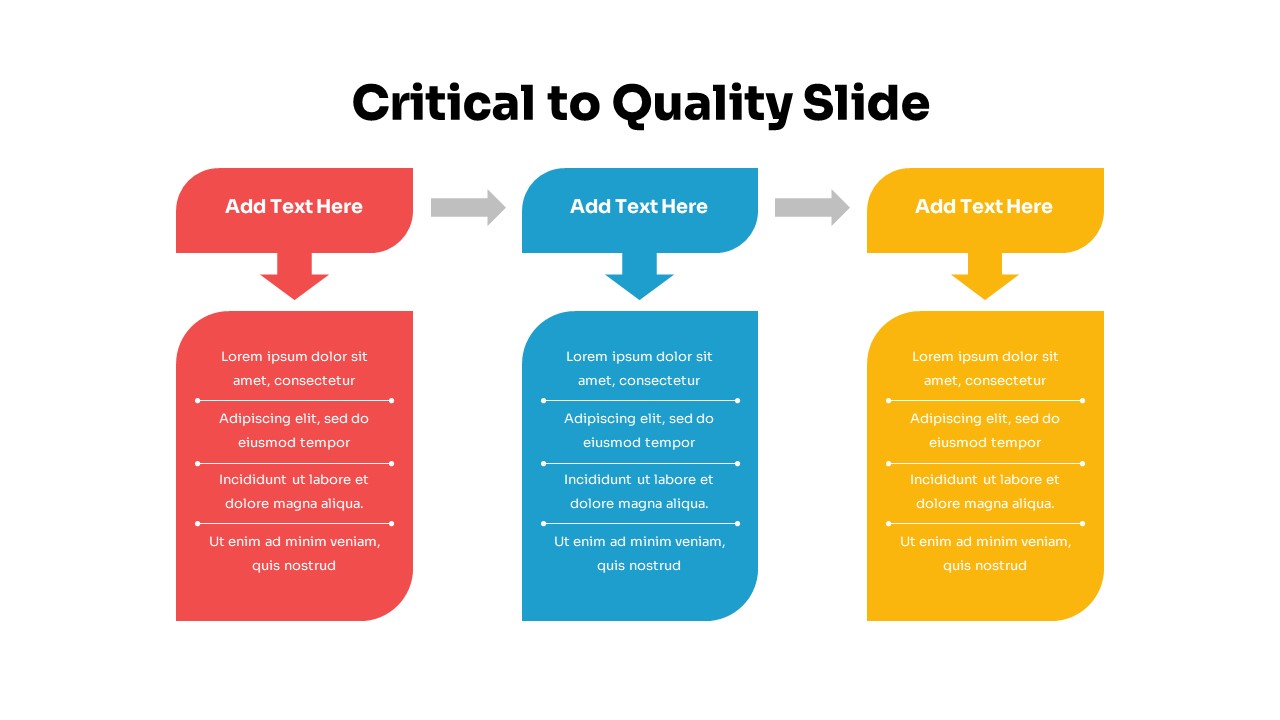
Three-Step Critical to Quality Slides Template for PowerPoint & Google Slides
Process
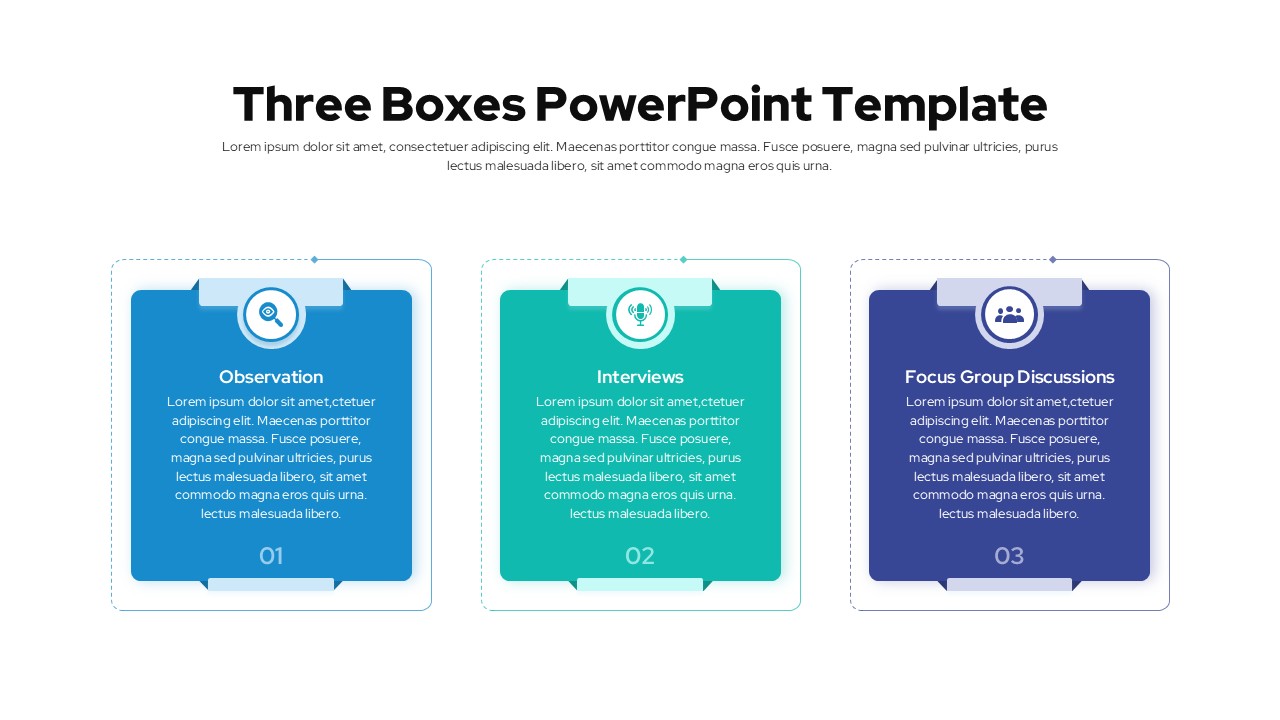
Three Boxes PowerPoint Template for PowerPoint & Google Slides
Business Report
Three Stage 3D Arrow Process Diagram Template for PowerPoint & Google Slides
Process
Engaging Three-Stage Process Diagram Template for PowerPoint & Google Slides
Process
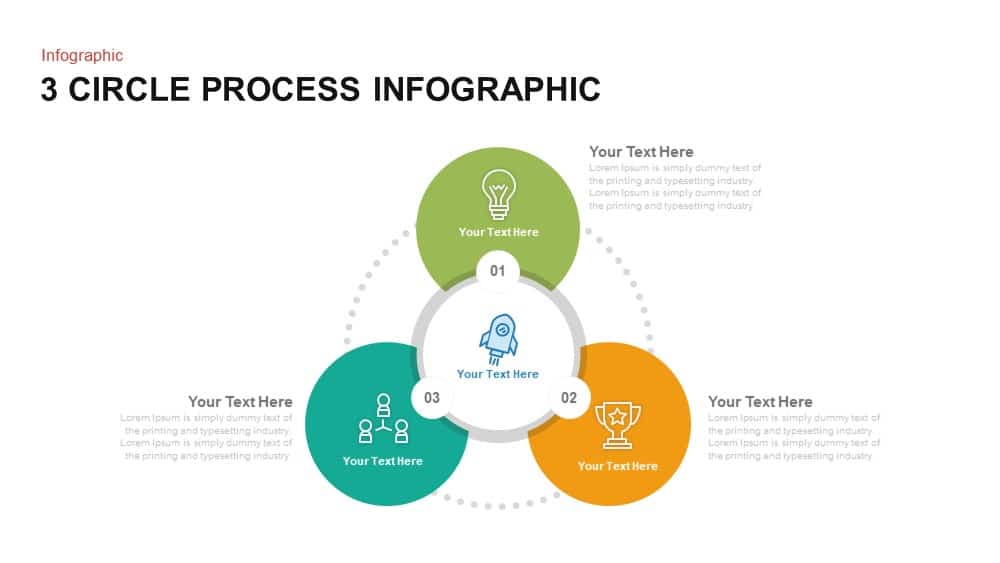
Three-Circle Process Infographic Template for PowerPoint & Google Slides
Circular
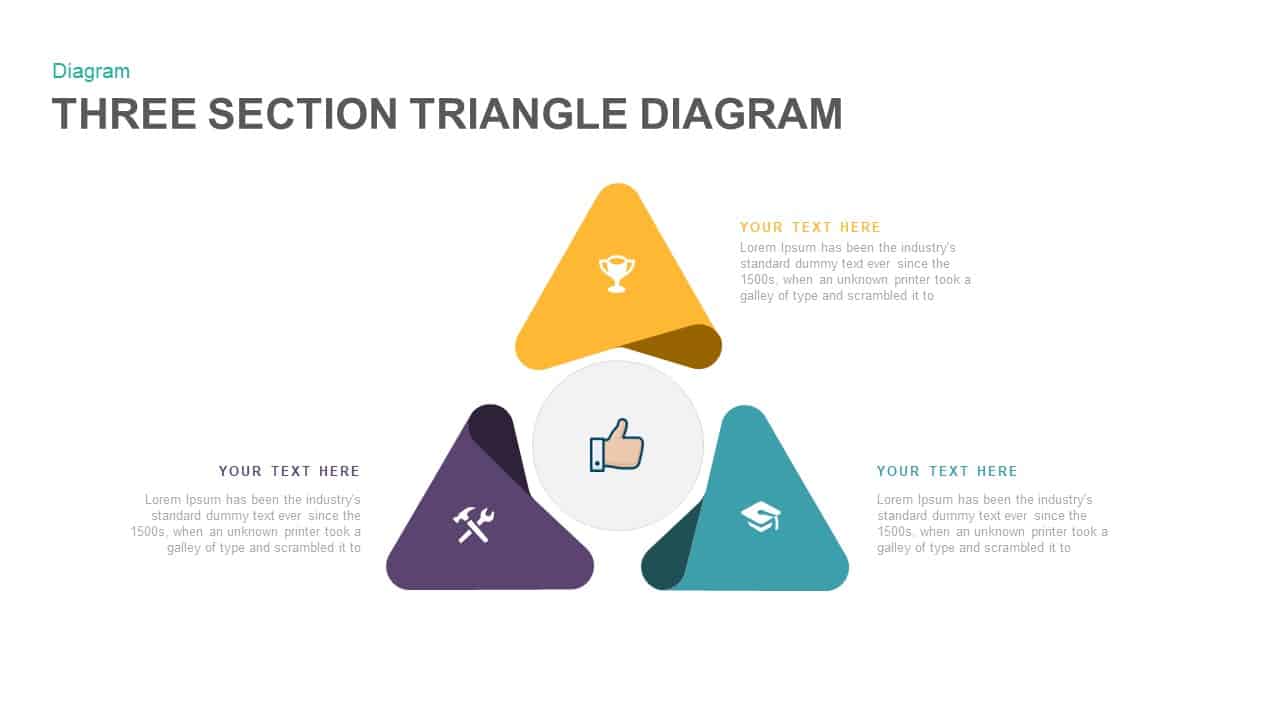
3 Section Triangle Diagram PowerPoint Template and Google Slide
Process
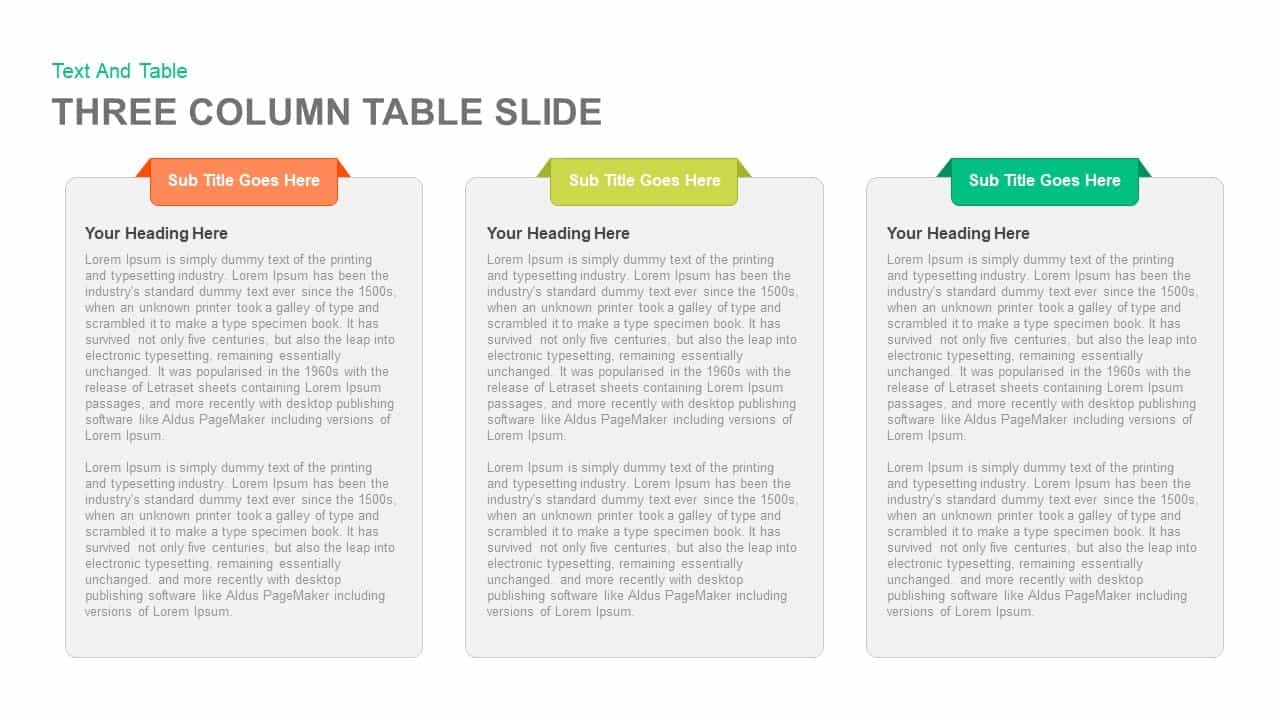
Clean Three-Four Column Table Slide Template for PowerPoint & Google Slides
Business Report
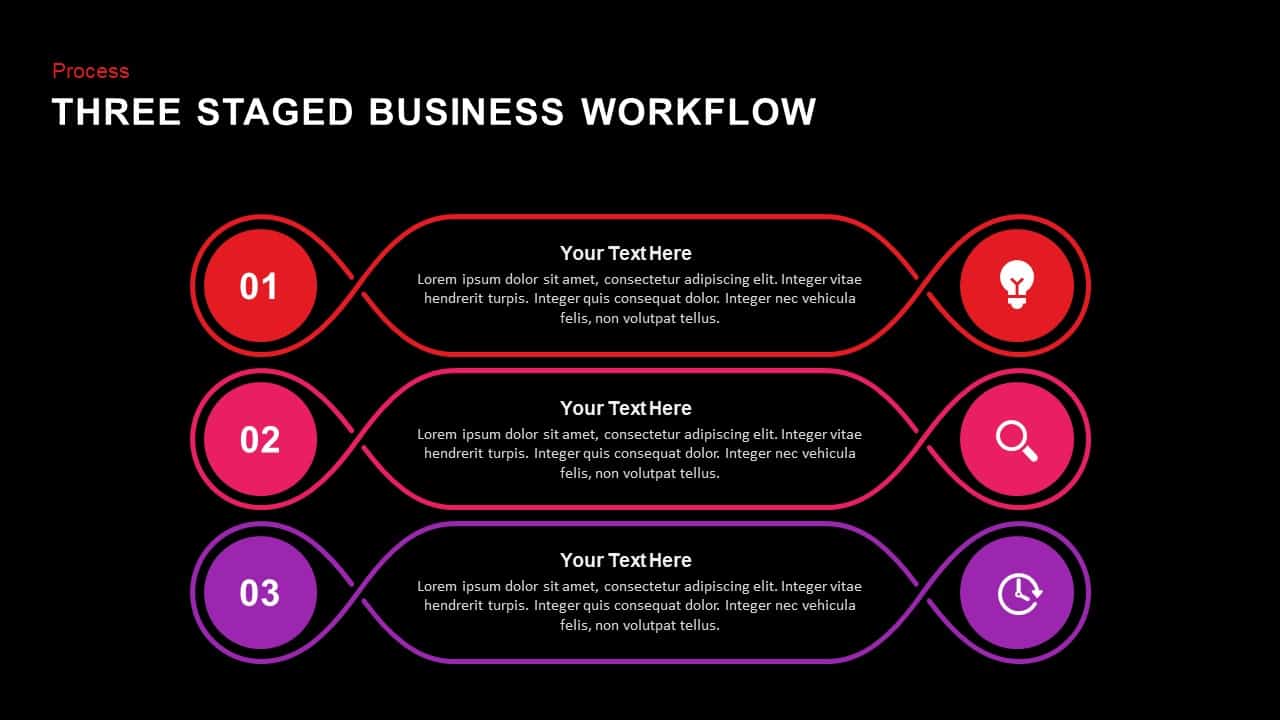
Three Staged Business Workflow template for PowerPoint & Google Slides
Business
Flow Chart Template For PowerPoint Presentations
Flow Charts
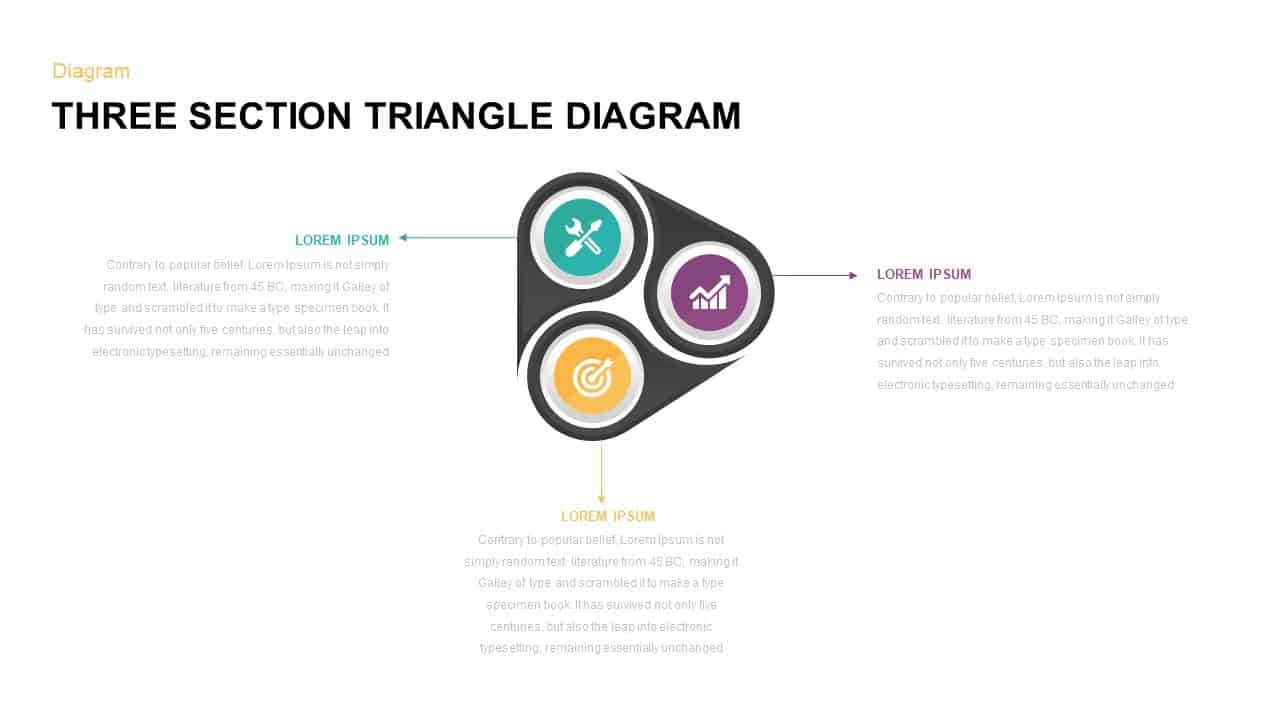
Three Section Triangle Diagram Template for PowerPoint & Google Slides
Process
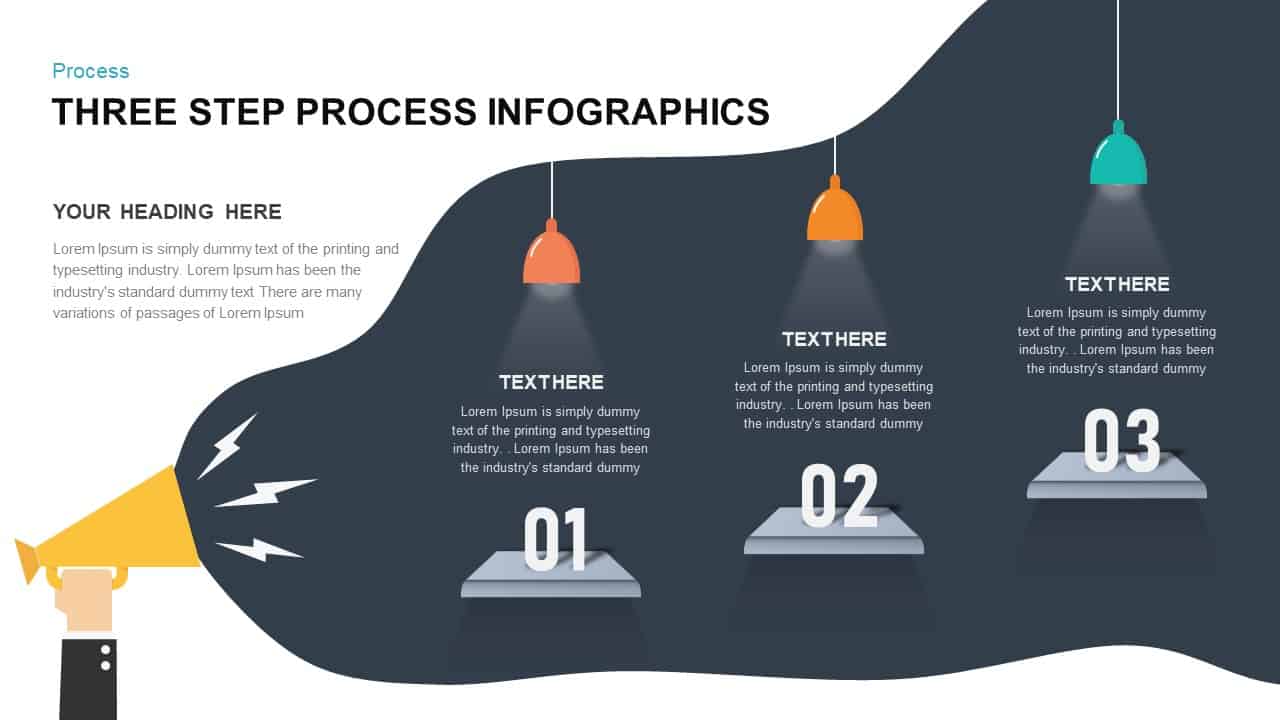
Three-Step Process Infographics Template for PowerPoint & Google Slides
Process
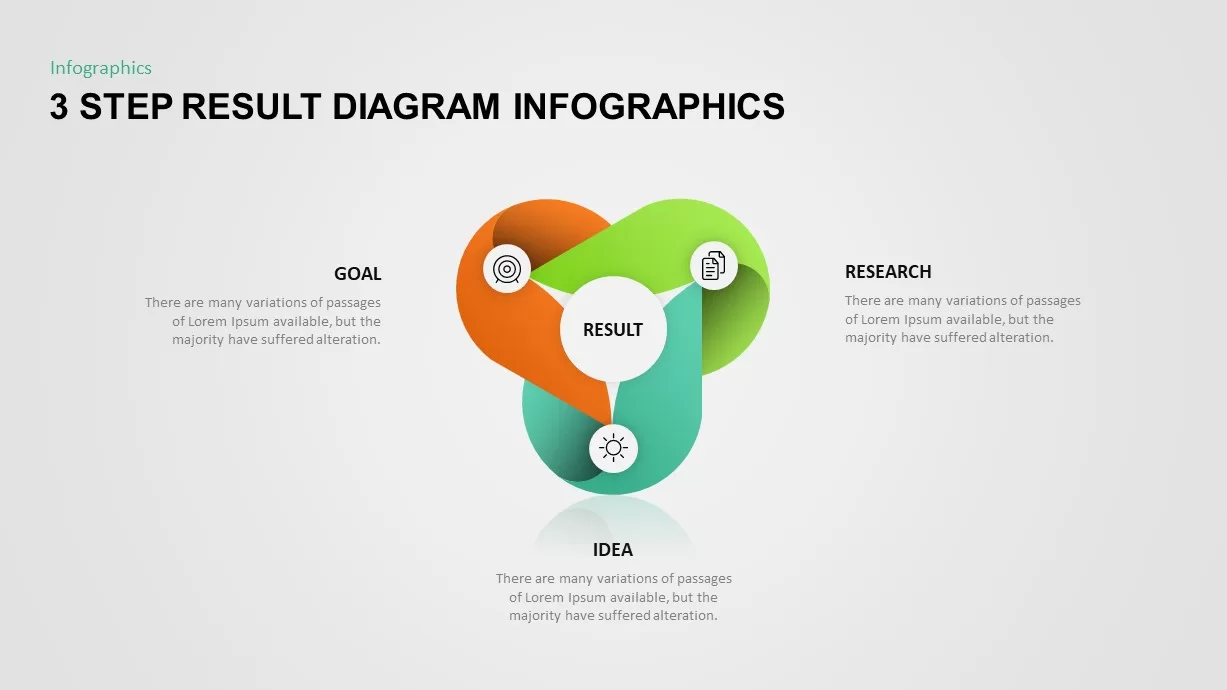
Three-Step Result Diagram Infographic Template for PowerPoint & Google Slides
Process
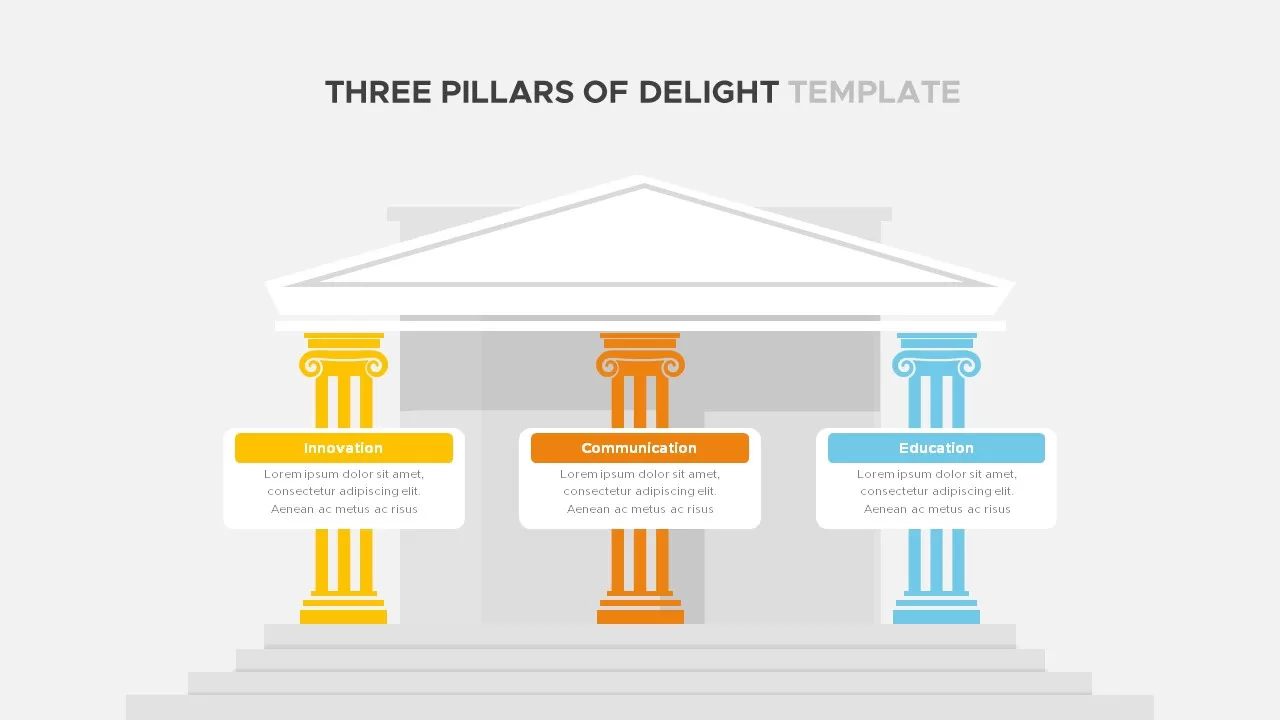
Three Pillars of Delight Template for PowerPoint & Google Slides
Business
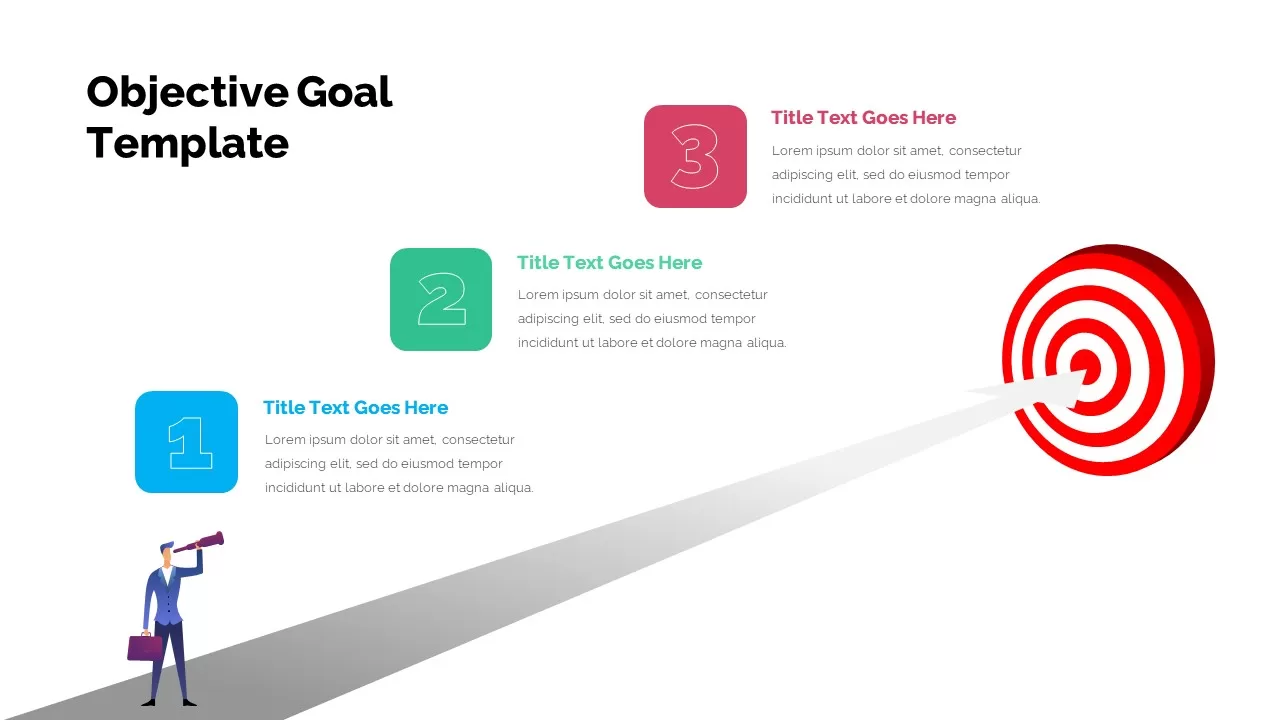
Three-Step Objective Goal Process Template for PowerPoint & Google Slides
Goals
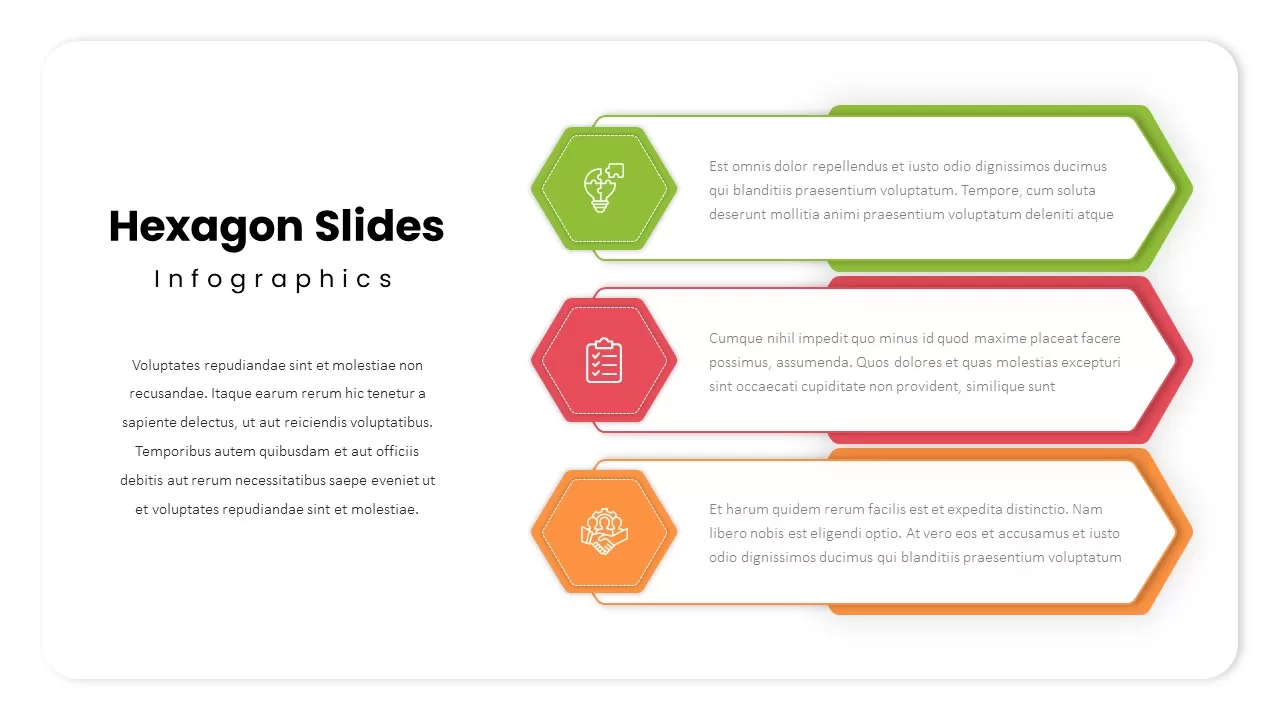
Three-Step Hexagon Infographic Process Template for PowerPoint & Google Slides
Process
Three-Step Hub and Spoke Diagram Template for PowerPoint & Google Slides
Circular
Three-Step Reference Slide Layout Template for PowerPoint & Google Slides
Infographics
Clean Three-Step Reference Slide Template for PowerPoint & Google Slides
Agenda
Three-Part Shield Infographics Template for PowerPoint & Google Slides
Comparison
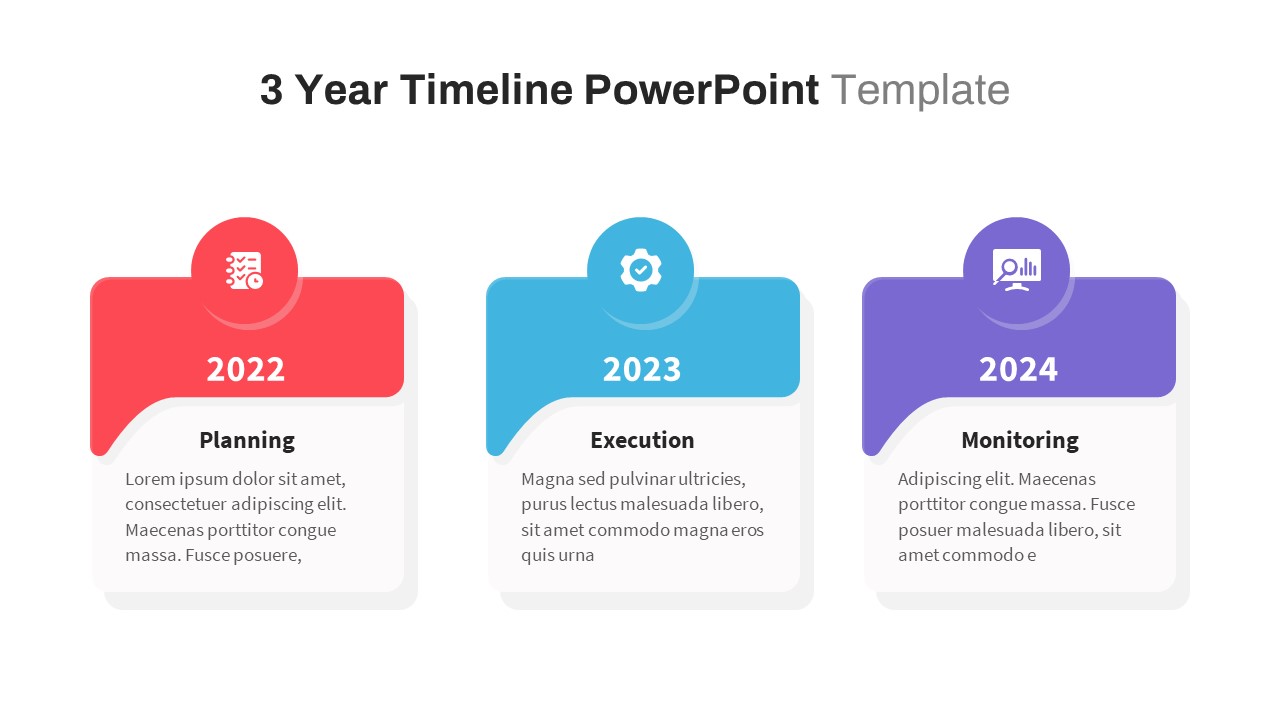
Three-Year Project Roadmap Timeline Template for PowerPoint & Google Slides
Timeline
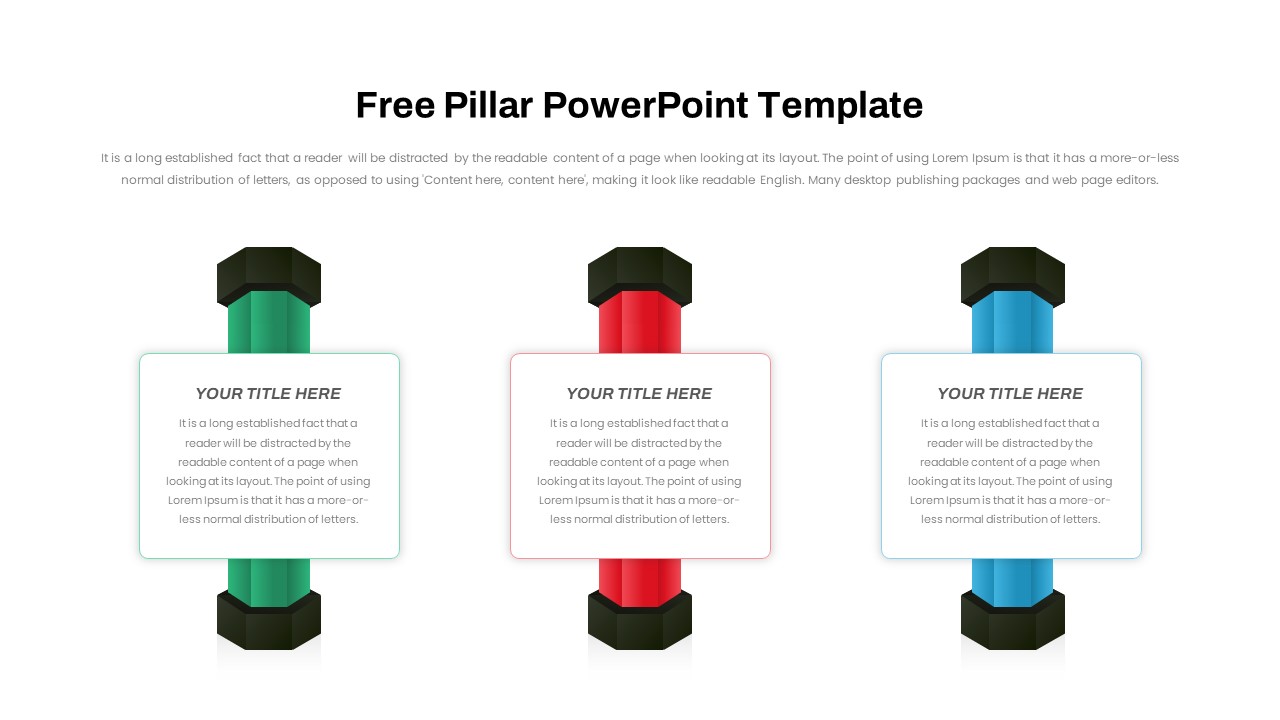
Free Three and Four Pillar Infographic Pack Template for PowerPoint & Google Slides
Process
Free
Open Door Policy Three-Step Process Template for PowerPoint & Google Slides
Process
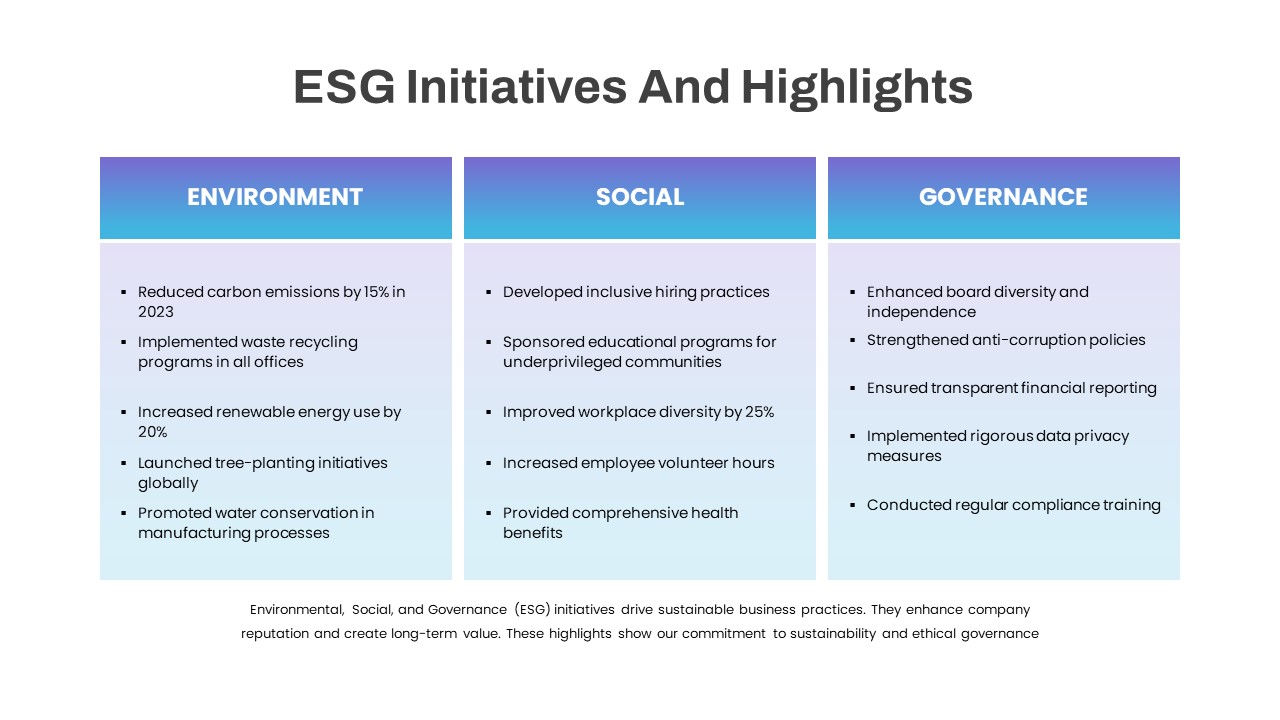
ESG Initiatives Three-Column Template for PowerPoint & Google Slides
Comparison
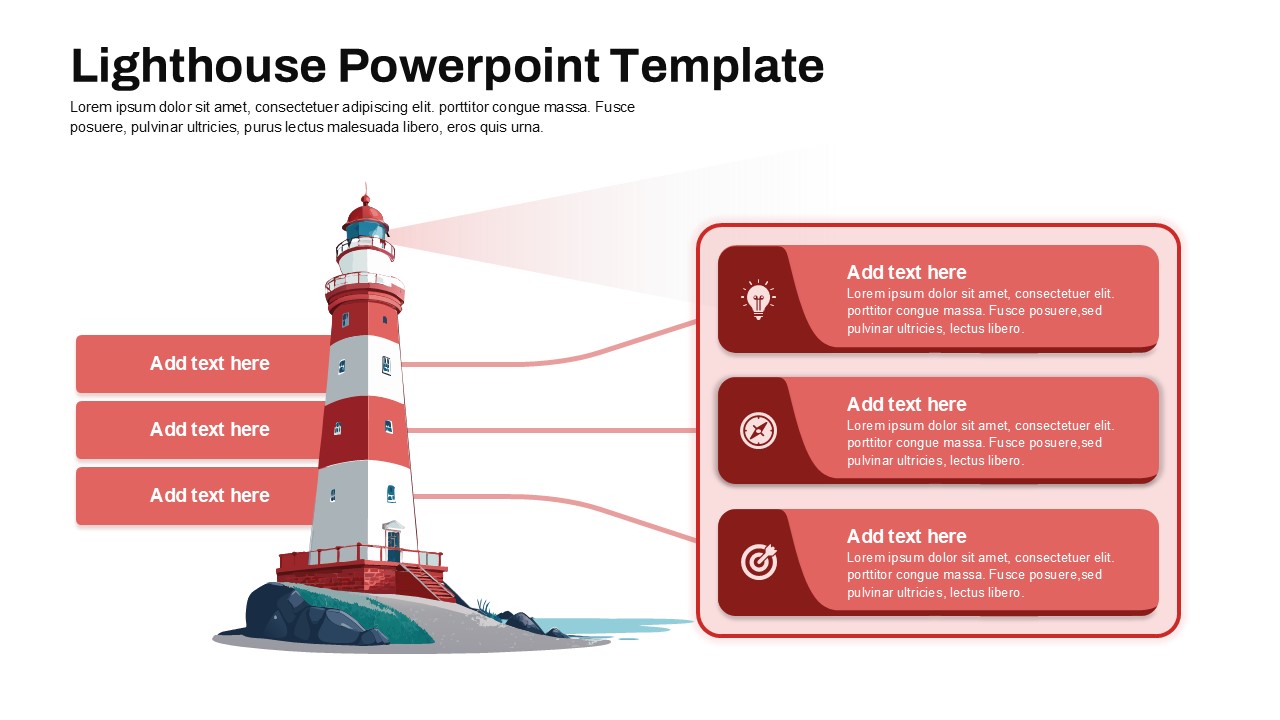
Lighthouse Three-Step Guidance Diagram Template for PowerPoint & Google Slides
Process
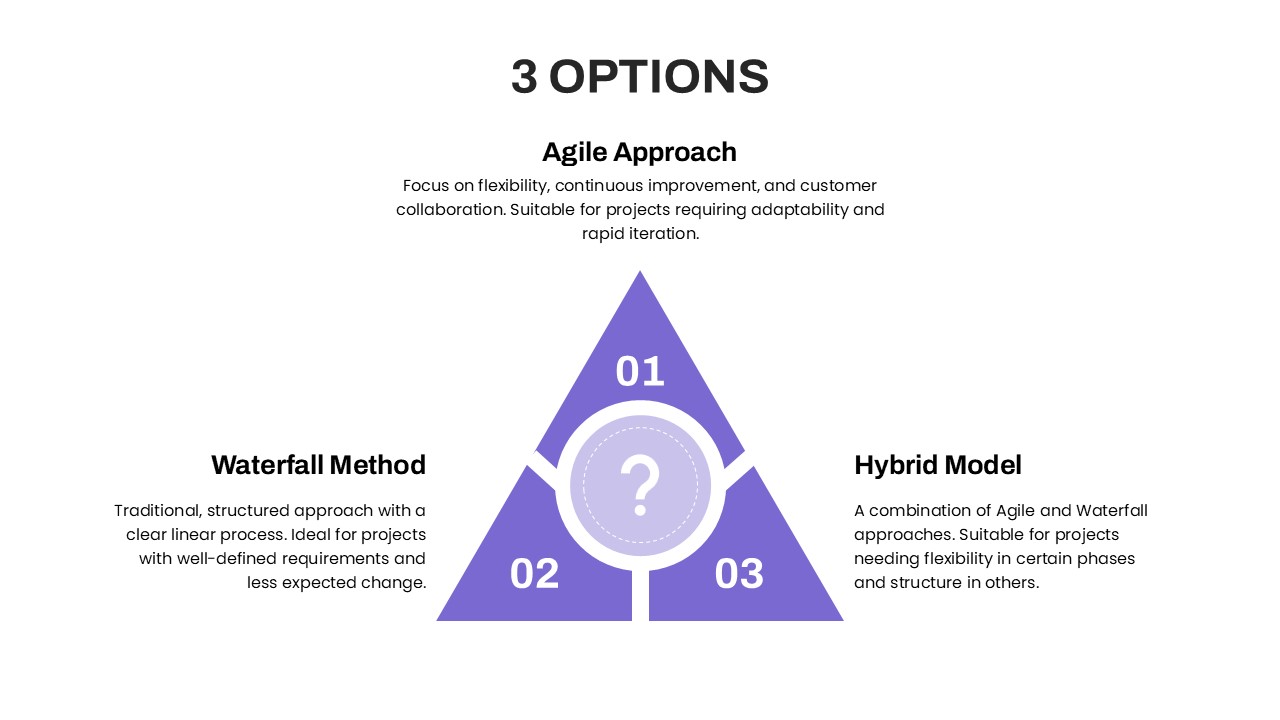
Three Options Infographic Pack Template for PowerPoint & Google Slides
Process
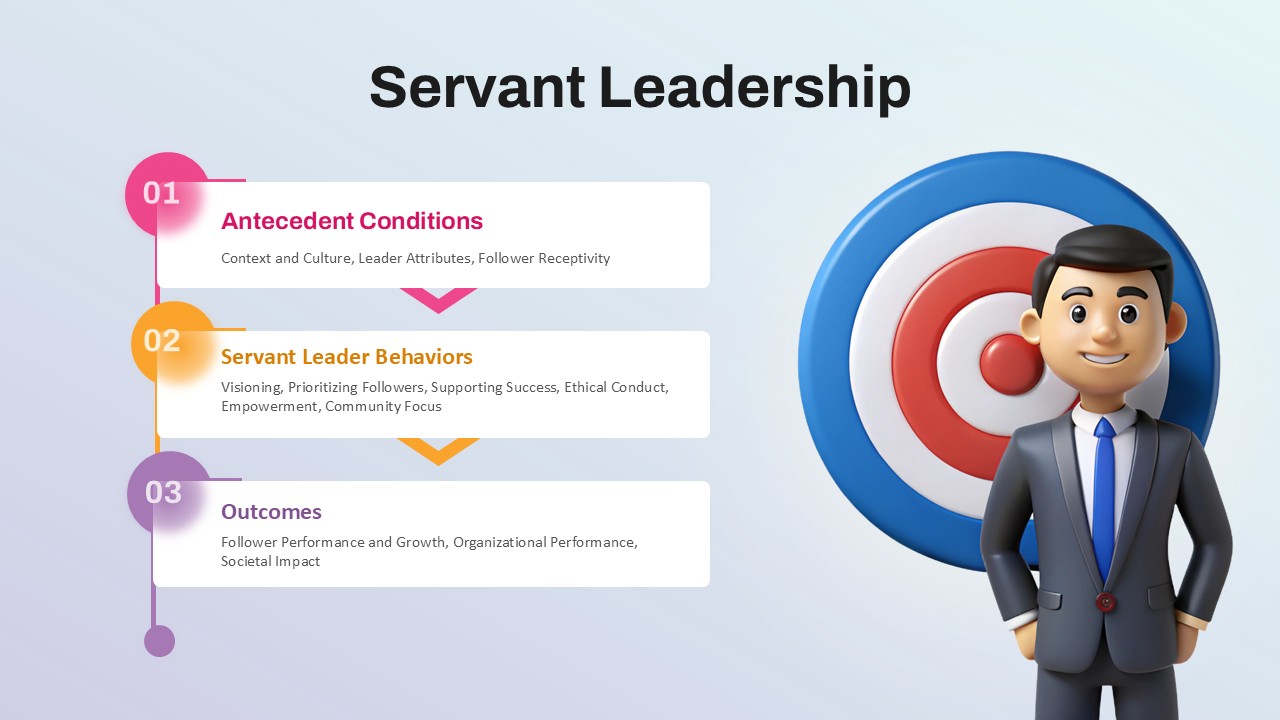
Three-Step Servant Leadership Framework Template for PowerPoint & Google Slides
Leadership