Arrow Line Chart Template for PowerPoint & Google Slides
Description
This Arrow Line Chart slide empowers you to illustrate data trends, growth trajectories, or performance metrics with clarity and visual impact. Featuring a bold red directional line complete with arrowhead endpoints, the chart is plotted against a clean, dotted grid background for maximum readability. Axis labels and tick marks are fully editable, enabling you to adjust timeframes, value ranges, and formatting to suit your dataset. Two customizable text callouts on the left-hand side let you add key insights, commentary, or highlights that draw attention to pivotal inflection points.
Built on master slides with layered vector shapes and smart guides, this template streamlines your workflow—simply swap data, change colors, or reposition elements in seconds. The minimalist design, with ample white space and subtle pastel grid borders, ensures your audience focuses on the trend line and critical annotations. Whether you’re plotting revenue growth, customer acquisition rates, or project milestones, the arrow line visualization drives home upward or downward movements with unambiguous directionality. For a wider selection of structured visual elements, explore additional arrow templates to enhance your presentations.
With full compatibility across PowerPoint and Google Slides, this slide maintains crisp resolution on any device or projector. Save time on formatting headaches by leveraging the preconfigured theme colors, axis styles, and placeholder text.
Who is it for
Analysts, financial planners, and project managers who need to present time-series data with clear directional cues. Marketing teams tracking campaign performance, executives reviewing quarterly results, and consultants illustrating forecasts will also find this chart indispensable.
Other Uses
Repurpose for sales pipeline progression, user engagement metrics, budget burn-rate analysis, risk-assessment trends, product adoption curves, academic research data, or even Gantt-style milestone tracking. To illustrate growth trends alongside a stepwise narrative, consider pairing this slide with the upward arrow infographic template or use the colorful arrow process diagram to depict multi-stage processes in vibrant detail.
Login to download this file

Item ID
SB03656
Related Templates

Line Chart Analysis template for PowerPoint & Google Slides
Charts

Application Revenue Line Chart KPI Template for PowerPoint & Google Slides
Revenue

Combination Bar and Line Chart Template for PowerPoint & Google Slides
Bar/Column
Editable Multi-Series Peak Line Chart Template for PowerPoint & Google Slides
Comparison Chart
Data Over Time Line Chart template for PowerPoint & Google Slides
Charts
Growth Curve Line Chart Visualization Template for PowerPoint & Google Slides
Charts
Evolution Line Chart with Milestones Template for PowerPoint & Google Slides
Timeline
Multiple Line Chart Comparison Template for PowerPoint & Google Slides
Comparison Chart
Multi-Series Line Chart with Icons Template for PowerPoint & Google Slides
Comparison Chart
Interactive Jump Line Data Chart Template for PowerPoint & Google Slides
Comparison Chart
Skimming Pricing Strategy Line Chart Template for PowerPoint & Google Slides
Business Strategy
Dynamic Financial Analysis Line Chart Template for PowerPoint & Google Slides
Finance
3D Line Chart for PowerPoint & Google Slides
Charts
Data-Driven Line Chart Diagram Template for PowerPoint
Comparison Chart
Line Graph Analysis template for PowerPoint & Google Slides
Charts
Multi-Series Curved Line Graph Analytics Template for PowerPoint & Google Slides
Comparison Chart
Sales Growth Dashboard: KPI Gauge & Line Template for PowerPoint & Google Slides
Revenue

Creative Clothing Line Presentation Template for PowerPoint & Google Slides
Pitch Deck
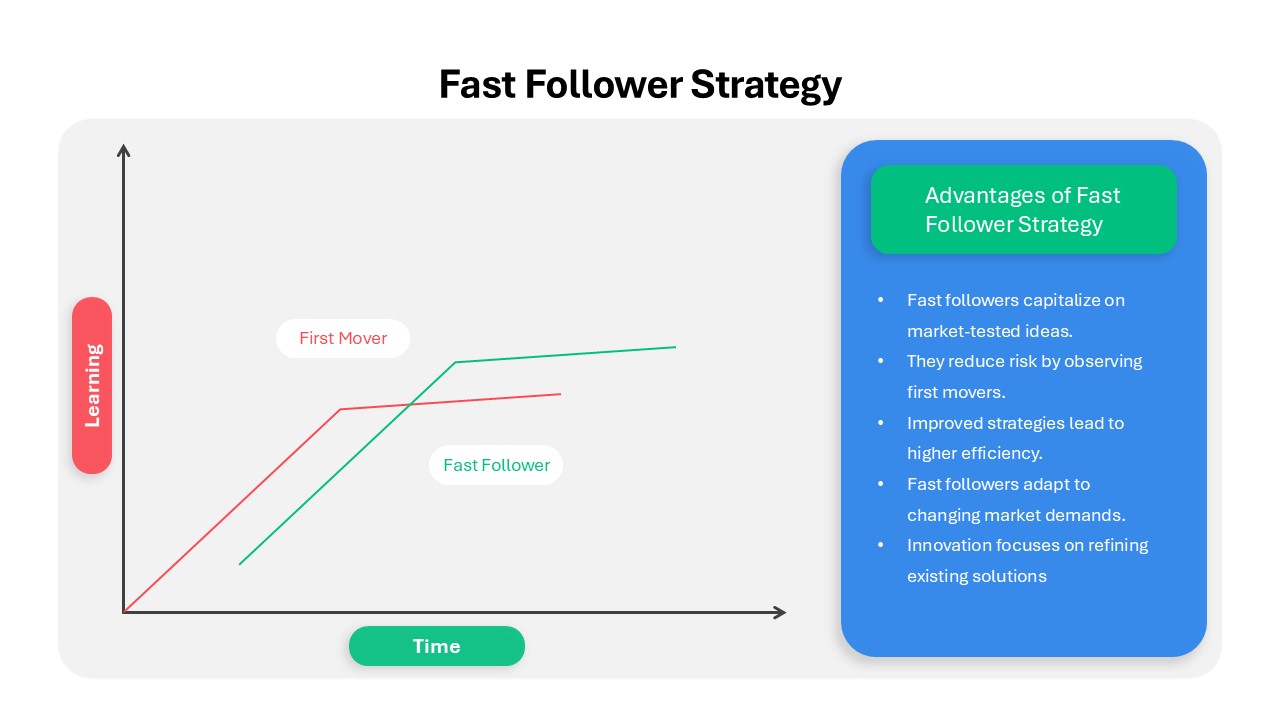
Fast Follower Strategy Line Graph Template for PowerPoint & Google Slides
Comparison Chart
3Ps Triple Bottom Line Venn Diagram Template for PowerPoint & Google Slides
Circular
4 People Racing to Finish Line Template for PowerPoint & Google Slides
Accomplishment
Curved Line Graph for PowerPoint & Google Slides
Timeline
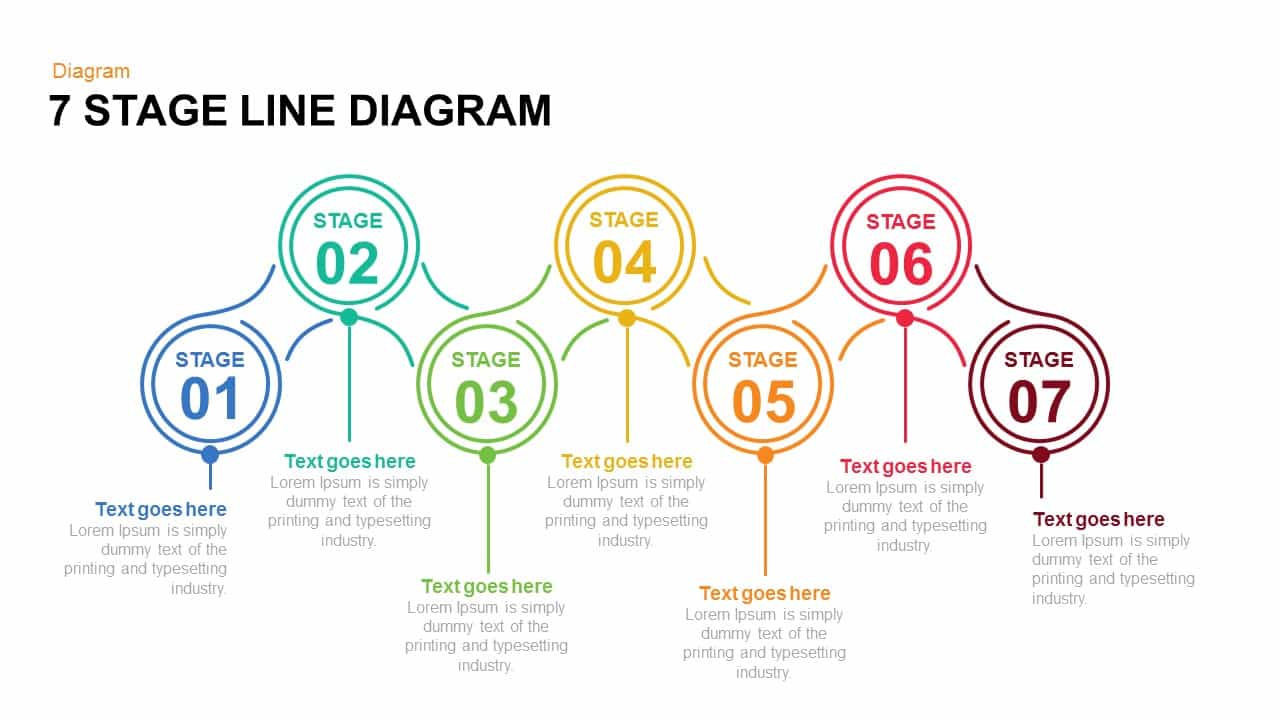
7 and 6 Stage Line Diagram Overview for PowerPoint & Google Slides
Infographics
Five and Six Step Line Linear Stage Diagram for PowerPoint & Google Slides
Infographics
Free Curved Arrow Progress Chart template for PowerPoint & Google Slides
Project
Free
4 Step Arrow Diagram template for PowerPoint & Google Slides
Arrow
3D Arrow Infographics Circular Flow Template for PowerPoint & Google Slides
Arrow
5 Arrow Process Diagram Template for PowerPoint & Google Slides
Infographics
Six Arrow Radial Process Diagram template for PowerPoint & Google Slides
Infographics
6-Step Arrow Process Diagram Template for PowerPoint & Google Slides
Process
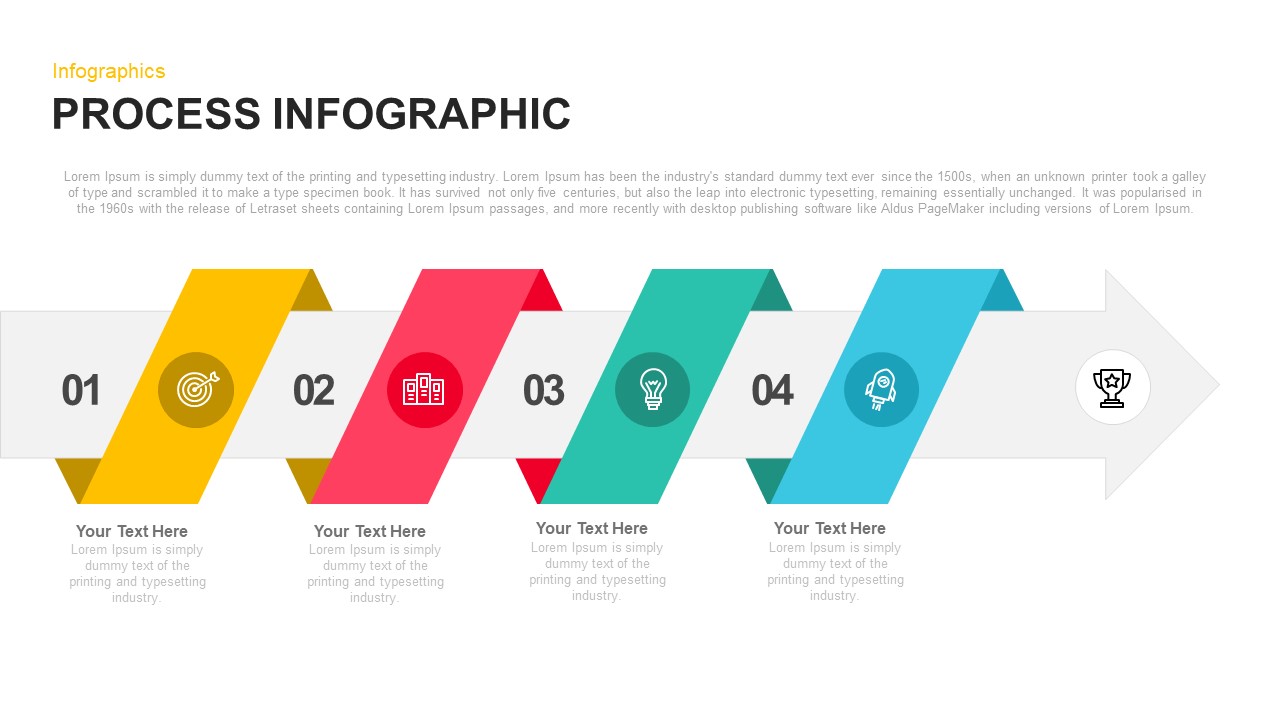
Colorful Arrow Process Diagram Template for PowerPoint & Google Slides
Arrow
Four Arrow Square Infographics Template for PowerPoint & Google Slides
Arrow
Five 3D Growth Arrow Infographic Slide Template for PowerPoint & Google Slides
Arrow
Three Circle Arrow Process Diagram template for PowerPoint & Google Slides
Circular
Five Up Arrow Infographic Diagram Template for PowerPoint & Google Slides
Arrow
3D Arrow Directional template for PowerPoint & Google Slides
Arrow
3D Sphere Arrow Process Diagram template for PowerPoint & Google Slides
Arrow
Animated Arrow Timeline and Planning PowerPoint Presentation Template
Timeline

Three Stage 3D Arrow Process Diagram Template for PowerPoint & Google Slides
Process

Arrow Infographic Template for PowerPoint & Google Slides
Arrow
Dynamic Arrow Process Template for PowerPoint & Google Slides
Process
Arrow Stage Process Diagram template for PowerPoint & Google Slides
Arrow
Two Directional Arrow Infographic Template for PowerPoint & Google Slides
Arrow

Strategy Arrow and Gear Icons Template for PowerPoint & Google Slides
Infographics
3D Four-Directional Arrow Infographics Template for PowerPoint & Google Slides
Arrow
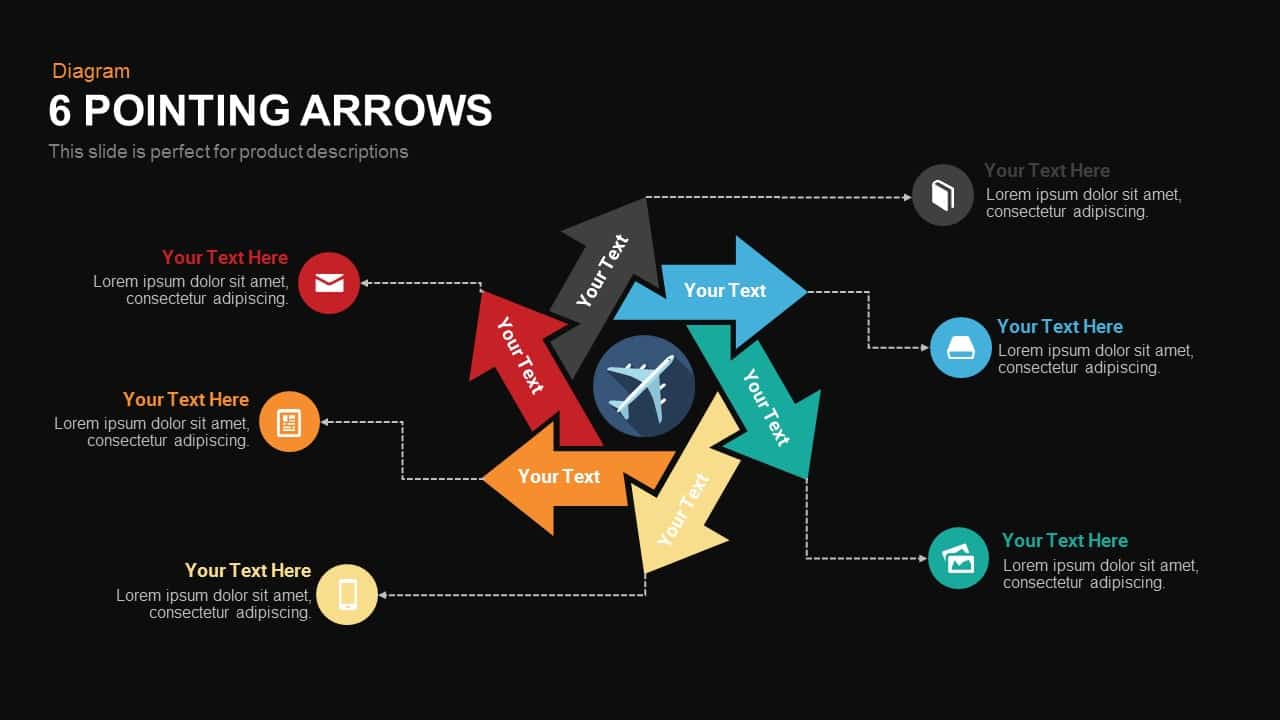
Six Pointing Arrow Process Diagram Template for PowerPoint & Google Slides
Arrow
Improvement Growth Arrow Metaphor Template for PowerPoint & Google Slides
Bar/Column
Five-Stage Zig-Zag Arrow Diagram Template for PowerPoint & Google Slides
Process
Five-Stage Direct Flow Arrow Process Template for PowerPoint & Google Slides
Arrow
Five-Stage Circle Arrow Diagram Template for PowerPoint & Google Slides
Circular
Timeline Arrow Infographics Diagram Template for PowerPoint & Google Slides
Timeline
Six-Stage Time Arrow Infographics Template for PowerPoint & Google Slides
Arrow
Seven-Segment Circular Arrow Diagram Template for PowerPoint & Google Slides
Arrow
8-Step Circular Arrow Diagram Template for PowerPoint & Google Slides
Arrow
Six-Process Circular Arrow Diagram Template for PowerPoint & Google Slides
Circular
8 Steps Arrow Process Diagram Template
Process
Pros & Cons Arrow Diagram template for PowerPoint & Google Slides
Comparison Chart

Elegant Process Support Arrow Diagram Template for PowerPoint & Google Slides
Arrow
Four-Section Arrow Infographic Diagram Template for PowerPoint & Google Slides
Arrow
Five-Stage Growth Arrow Infographic Template for PowerPoint & Google Slides
Arrow
Four-Point Arrow Cycle Diagram Template for PowerPoint & Google Slides
Arrow
Six-Step Two-Sided Arrow Diagram Template for PowerPoint & Google Slides
Process
Four-Staged Business Arrow Diagram Template for PowerPoint & Google Slides
Process
Five-Stage Cyclic Process Arrow Diagram Template for PowerPoint & Google Slides
Process
Eight-Stage Zigzag Arrow Diagram Template for PowerPoint & Google Slides
Process
Four-Step Arrow Process Infographic Template for PowerPoint & Google Slides
Arrow
Eight-Step Inward Arrow Diagram Template for PowerPoint & Google Slides
Arrow
Five Stage Circular Arrow Diagram Template for PowerPoint & Google Slides
Process
Agile Work Streams Arrow Diagram Template for PowerPoint & Google Slides
Process
Technology Arrow Infographic Template for PowerPoint & Google Slides
Pitch Deck
Upward Arrow infographic template for PowerPoint & Google Slides
Infographics
Arrow infographic template for PowerPoint & Google Slides
Business
Free Timeline Infographic Template
Timeline
Free
Curved Arrow Process Flow Infographic Template for PowerPoint & Google Slides
Process
Multi-Color Five-Step Curved Arrow Template for PowerPoint & Google Slides
Process
Curved Arrow Process Flow Diagram Template for PowerPoint & Google Slides
Arrow
Curved Arrow Flow Diagram template for PowerPoint & Google Slides
Business
5-Step Curved Arrow Infographic Template for PowerPoint & Google Slides
Arrow
Concentric Circular Arrow Cycle Diagram Template for PowerPoint & Google Slides
Process
Dual-Stage Circular Arrow Cycle Template for PowerPoint & Google Slides
Process
Four-Step Curved Arrow Process Template for PowerPoint & Google Slides
Process
Three-Step Wavy Arrow Flow Template for PowerPoint & Google Slides
Process
Three-Path Curved Arrow Infographic Template for PowerPoint & Google Slides
Arrow
Curved Arrow Process Flow template for PowerPoint & Google Slides
Process
Curved Arrow Process Flow template for PowerPoint & Google Slides
Process
Circle Arrow Process Flow template for PowerPoint & Google Slides
Process
Circle Arrow Process Flow template for PowerPoint & Google Slides
Process
Four-Stage Circle Arrow Infographic Template for PowerPoint & Google Slides
Circular
Three-Step Curved Arrow Process Diagram Template for PowerPoint & Google Slides
Arrow
Four-Arrow Curved Hub-and-Spoke Diagram Template for PowerPoint & Google Slides
Arrow
Accomplishment Arrow Infographic Template for PowerPoint & Google Slides
Accomplishment
Hand-Drawn Four-Step Curved Arrow Diagram Template for PowerPoint & Google Slides
Arrow
Four-Stage Circle Arrow Infographic Template for PowerPoint & Google Slides
Circular
Four-Step Curved Arrow Diagram Template for PowerPoint & Google Slides
Arrow
Circular Arrow Process Diagram Template for PowerPoint & Google Slides
Circular
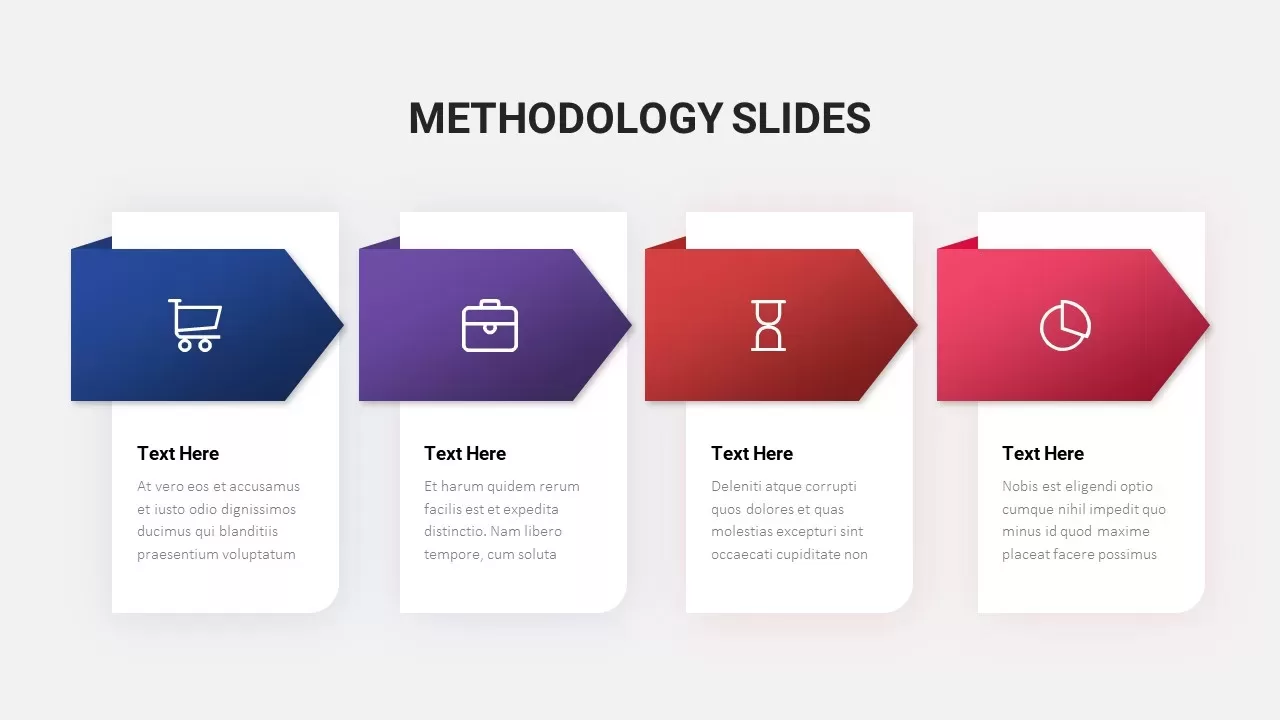
Colorful Arrow Methodology Steps Template for PowerPoint & Google Slides
Process
Pentagon Arrow Process Diagram Template for PowerPoint & Google Slides
Process
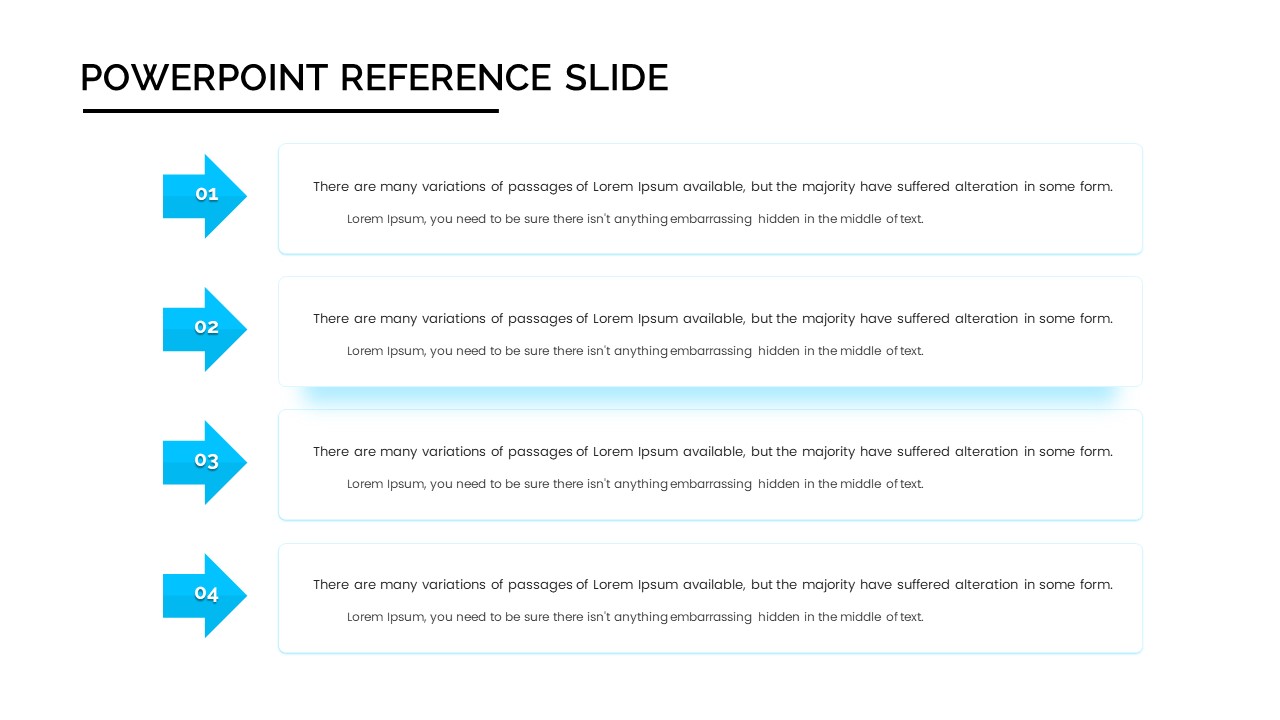
Four-Step Arrow Reference Diagram Slide Template for PowerPoint & Google Slides
Arrow
Arrow Types PowerPoint Template
Arrow
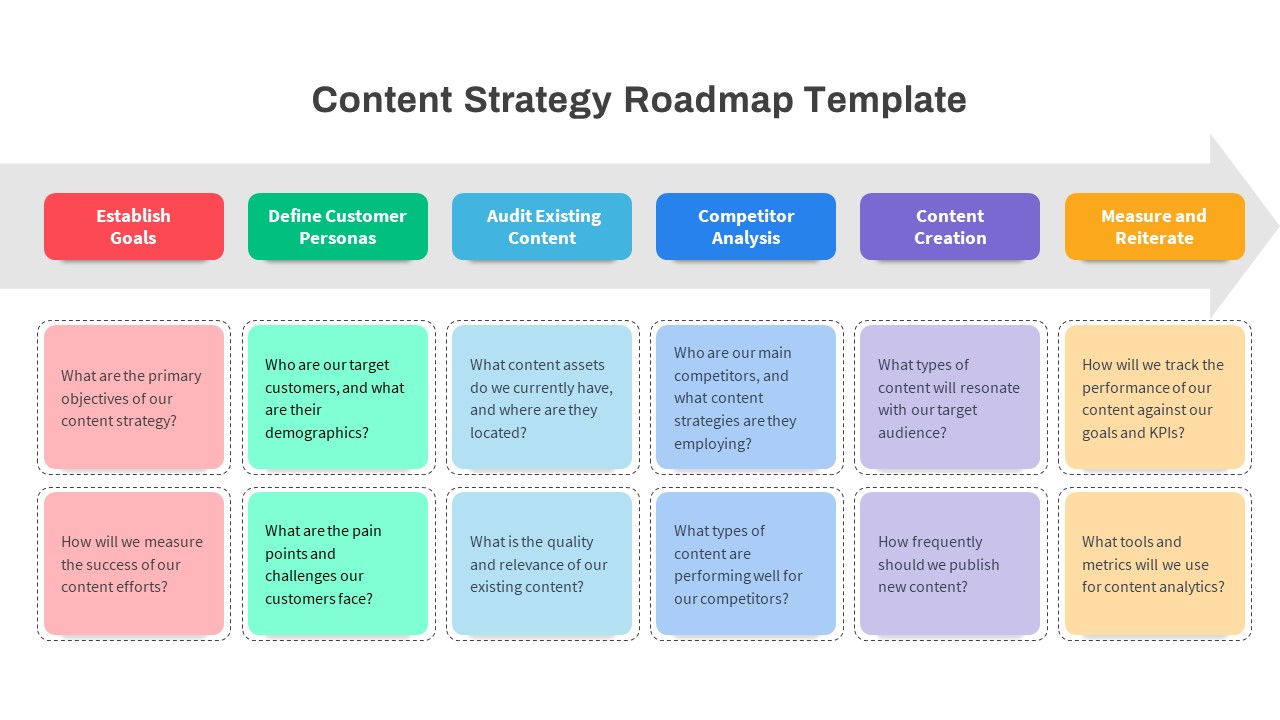
Content Strategy Roadmap Arrow Template for PowerPoint & Google Slides
Roadmap