Multi-Series Line Chart with Icons Template for PowerPoint & Google Slides

Description
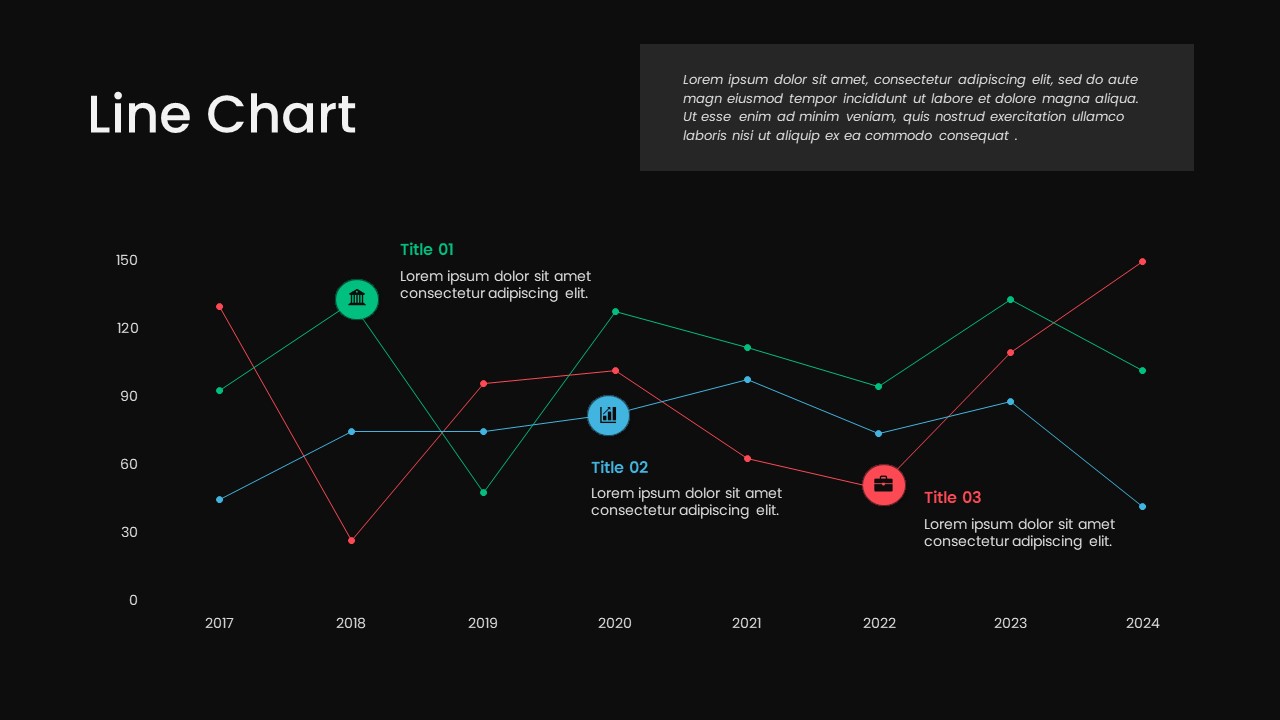
Visualize complex data trends across time with this multi-series line chart slide, enhanced by three distinct icon callouts. Featuring a clean white background and three colored lines—green, blue, and red—this design clearly differentiates your metrics from 2017 through 2024. Each series includes a vector icon marker (bank, bar chart, briefcase) at a key data point, paired with editable text callouts for contextual insights. A predefined gray text box at the top right offers space for an executive summary or key takeaways. Built on master slides, every element—from axes and gridlines to line colors and marker shapes—can be customized in seconds. Simply swap out icons, adjust data point coordinates, or change label positions without disrupting the overall layout.
Optimized for both PowerPoint and Google Slides, this line chart maintains pixel-perfect fidelity across devices and aspect ratios. Intuitive layer names and grouping simplify editing, and the slide supports right-to-left languages for global presentations. Whether you’re reporting financial KPIs, comparing product performance, or illustrating market trends, this slide empowers you to convey insights with clarity. Preconfigured text styles and chart templates ensure consistency, while the minimal design keeps focus on your data. Advance your narrative further by adding entrance animations to each line or callout, creating a dynamic reveal that highlights turning points.
Who is it for
Financial analysts, marketing managers, and business strategists will benefit from this line chart slide when presenting performance comparisons, forecasting trends, or highlighting critical milestones. Consultants, educators, and project leads can also leverage its clean design to teach data literacy or illustrate research findings.
Other Uses
Beyond trend analysis, repurpose this slide for sales pipeline tracking, competitive benchmarking, user engagement metrics, or as a component within a broader dashboard. Swap icons and color schemes to tailor the visual to any industry or presentation topic.
Login to download this file

Item ID
SB03711
Related Templates

Editable Multi-Series Peak Line Chart Template for PowerPoint & Google Slides
Comparison Chart
Multi-Series Curved Line Graph Analytics Template for PowerPoint & Google Slides
Comparison Chart
Multi-Series Stacked Bar Chart Template for PowerPoint & Google Slides
Bar/Column
Multi-Series Vertical Dot Chart Template for PowerPoint & Google Slides
Comparison Chart
Dynamic Three-Series Stacked Area Chart Template for PowerPoint & Google Slides
Comparison Chart
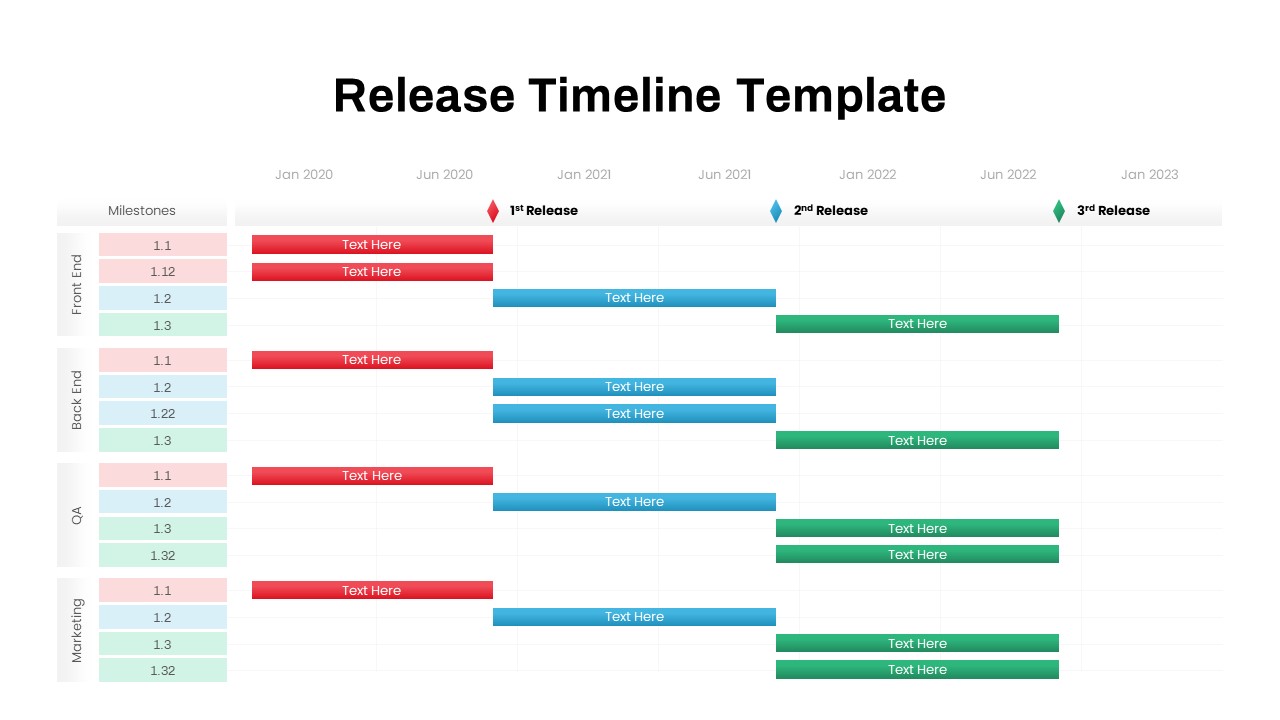
Multi-Team Multi-Phase Release Timeline Template for PowerPoint & Google Slides
Timeline
Fishbone Timeline Infographic Series Template for PowerPoint & Google Slides
Manufacturing
Horizontal Multi-Level Hierarchy Chart template for PowerPoint & Google Slides
Org Chart
Free Circular Multi-Step Flow Chart Diagram Template for PowerPoint & Google Slides
Flow Charts
Free
Minimal Multi-Year Column Chart Template for PowerPoint & Google Slides
Bar/Column
Multi-Variation Thermometer Chart Template for PowerPoint & Google Slides
Bar/Column
Multi-Style Clock Chart Diagram Template for PowerPoint & Google Slides
Circular
Multi-Variation Circular Chart Diagram Template for PowerPoint & Google Slides
Circular
Modern Multi-Color Polar Chart Diagram Template for PowerPoint & Google Slides
Charts
Multi-Level Wheel Chart Diagram template for PowerPoint & Google Slides
Pie/Donut
Multi-Level Colorful Pyramid Chart Template for PowerPoint & Google Slides
Pyramid

Line Chart Analysis template for PowerPoint & Google Slides
Charts

Application Revenue Line Chart KPI Template for PowerPoint & Google Slides
Revenue
Combination Bar and Line Chart Template for PowerPoint & Google Slides
Bar/Column
Arrow Line Chart Template for PowerPoint & Google Slides
Comparison Chart
Data Over Time Line Chart template for PowerPoint & Google Slides
Charts
Growth Curve Line Chart Visualization Template for PowerPoint & Google Slides
Charts
Evolution Line Chart with Milestones Template for PowerPoint & Google Slides
Timeline
Multiple Line Chart Comparison Template for PowerPoint & Google Slides
Comparison Chart
Interactive Jump Line Data Chart Template for PowerPoint & Google Slides
Comparison Chart
Skimming Pricing Strategy Line Chart Template for PowerPoint & Google Slides
Business Strategy
Dynamic Financial Analysis Line Chart Template for PowerPoint & Google Slides
Finance
3D Line Chart for PowerPoint & Google Slides
Charts
Horizontal Bar Chart Slide with Icons Template for PowerPoint & Google Slides
Bar/Column
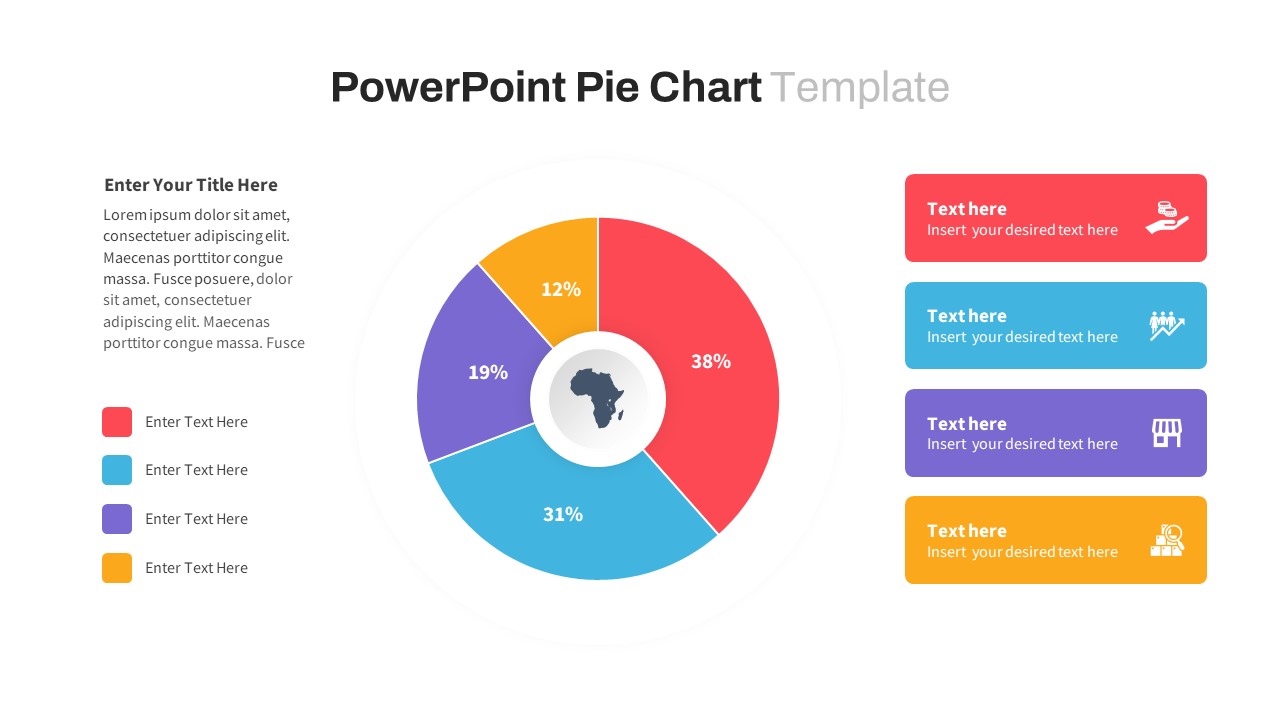
Segmented Pie Chart Infographic with Icons for PowerPoint & Google Slides
Pie/Donut
Data-Driven Line Chart Diagram Template for PowerPoint
Comparison Chart
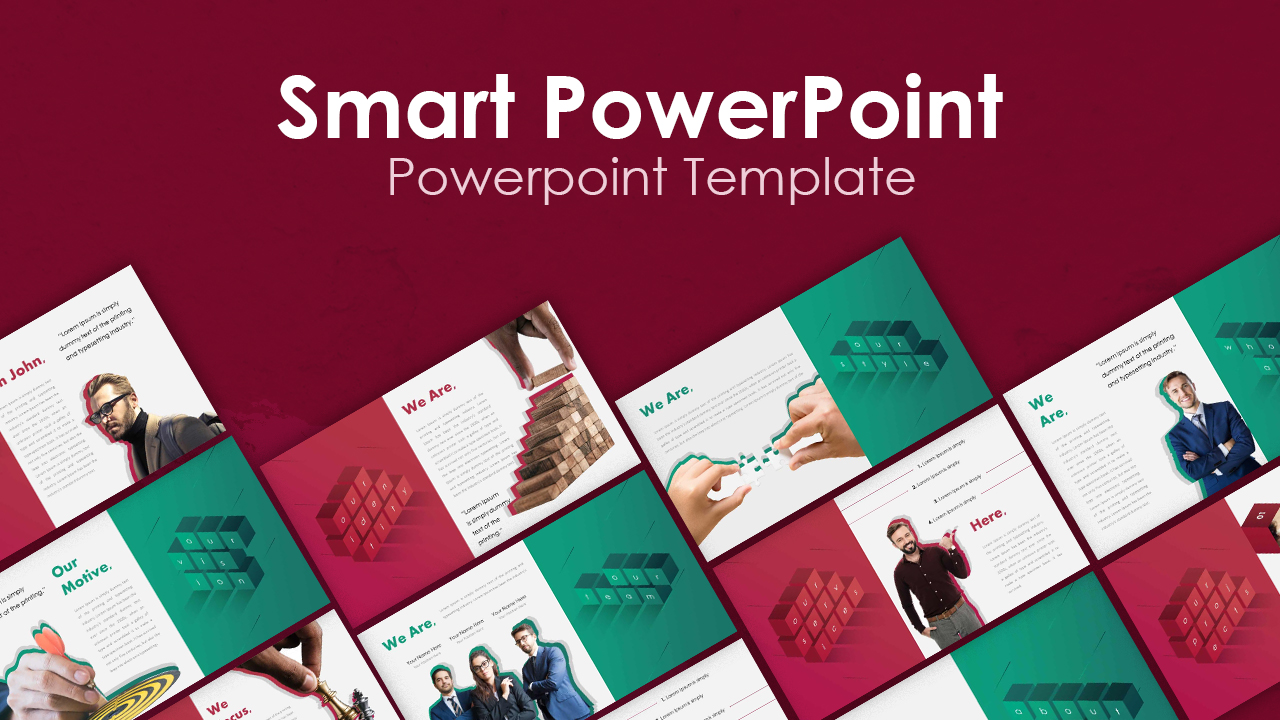
Smart Multi-Purpose PowerPoint Template for PowerPoint & Google Slides
Company Profile
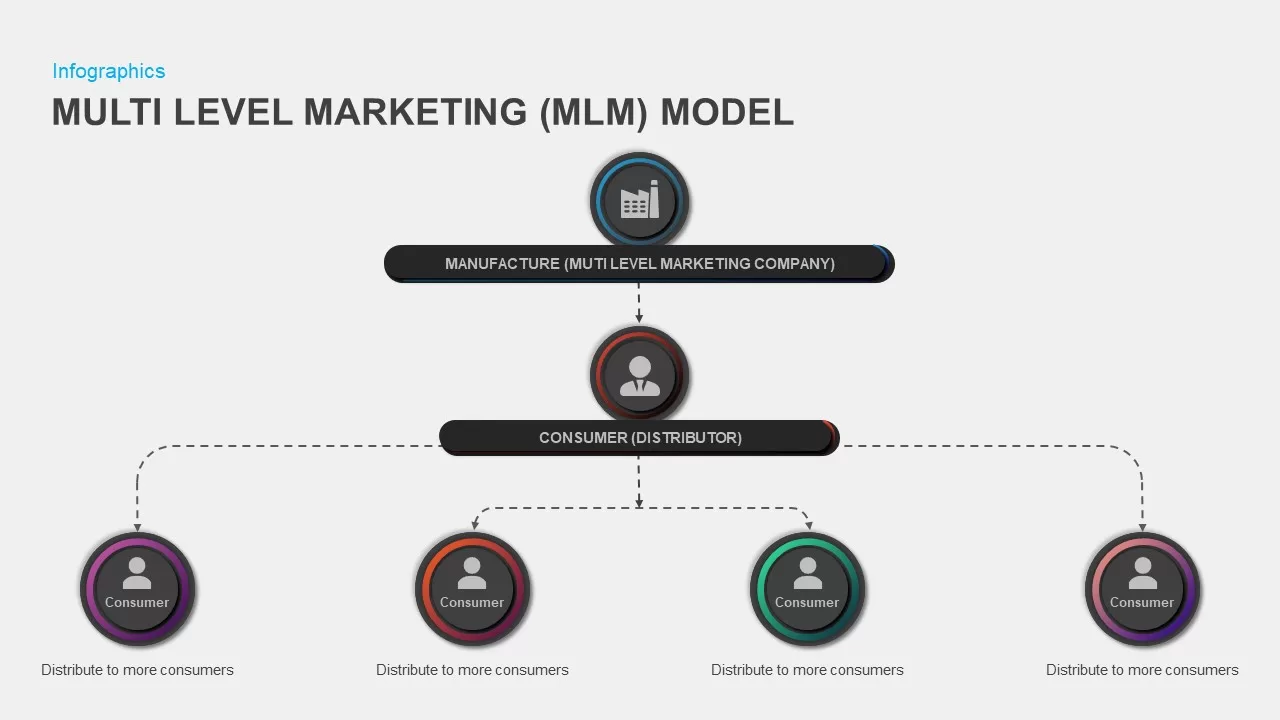
Multi-Level Marketing PowerPoint Template for PowerPoint & Google Slides
Business Models
Multi-Segment Circle Split Diagram template for PowerPoint & Google Slides
Circular

Simple Multi-Branch Mind Map Template for PowerPoint & Google Slides
Mind Maps
Multi-layout Circle Spoke Diagram Template for PowerPoint & Google Slides
Circular
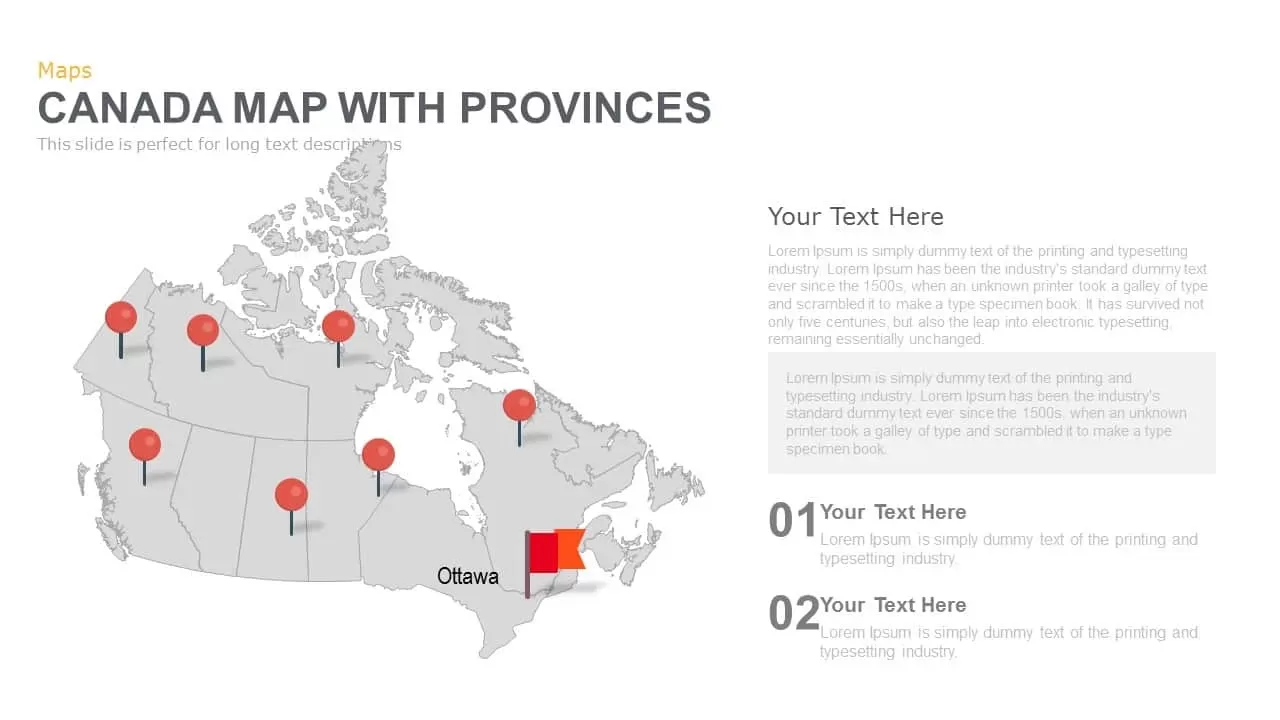
Canada Provinces Map Multi-Layout Template for PowerPoint & Google Slides
World Maps
Multi-Stage Timeline Infographics Template for PowerPoint & Google Slides
Timeline
Modern Multi-Section Circle Diagram Template for PowerPoint & Google Slides
Circular
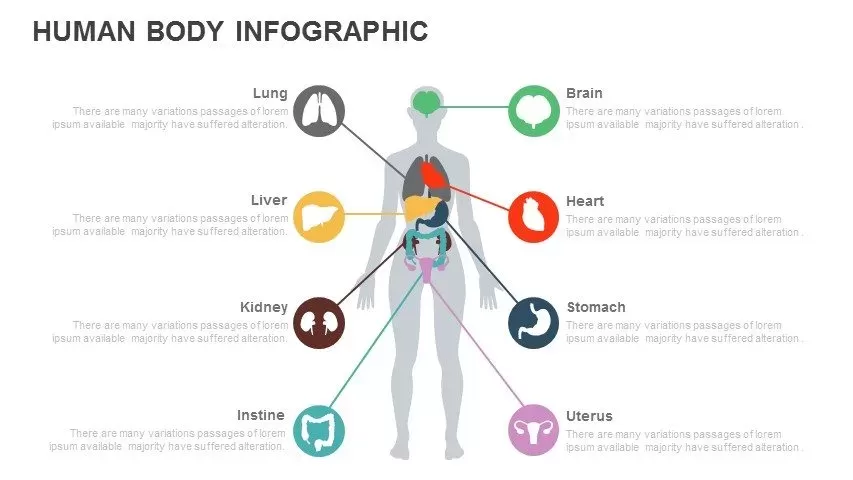
Multi-Organ Human Body Infographic Template for PowerPoint & Google Slides
Comparison
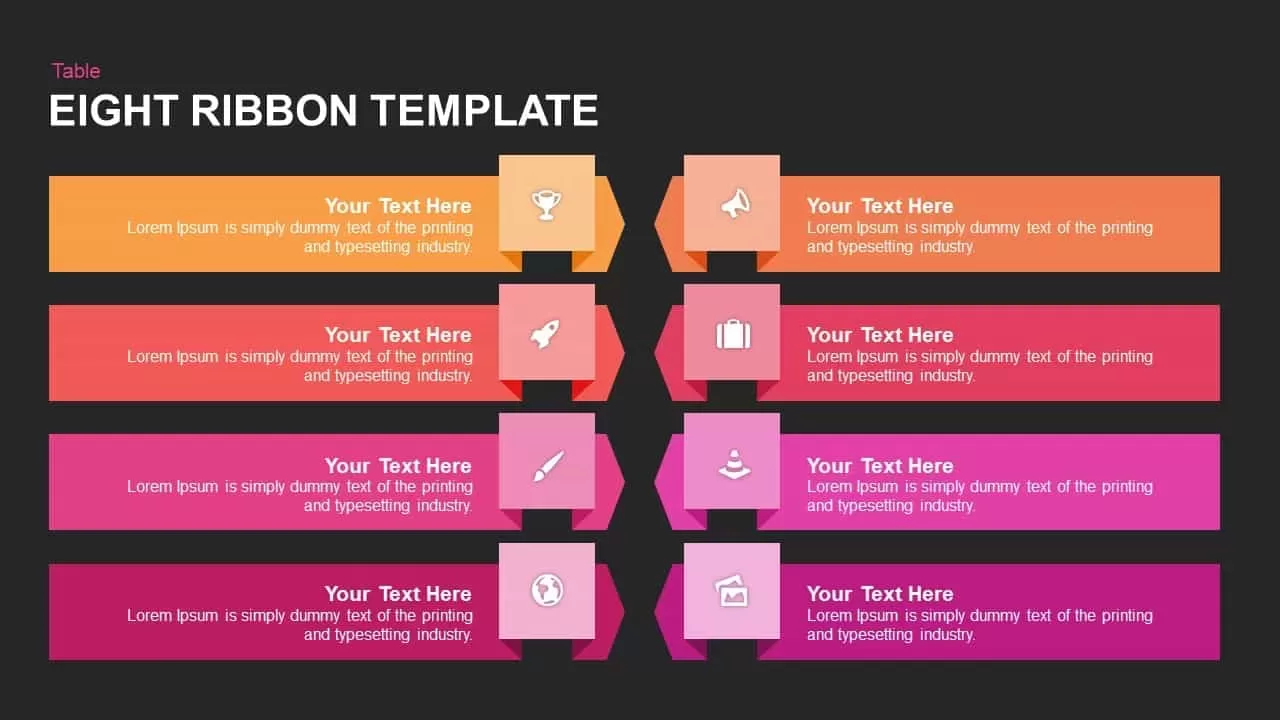
Multi-Color Eight-Step Ribbon Diagram Template for PowerPoint & Google Slides
Process
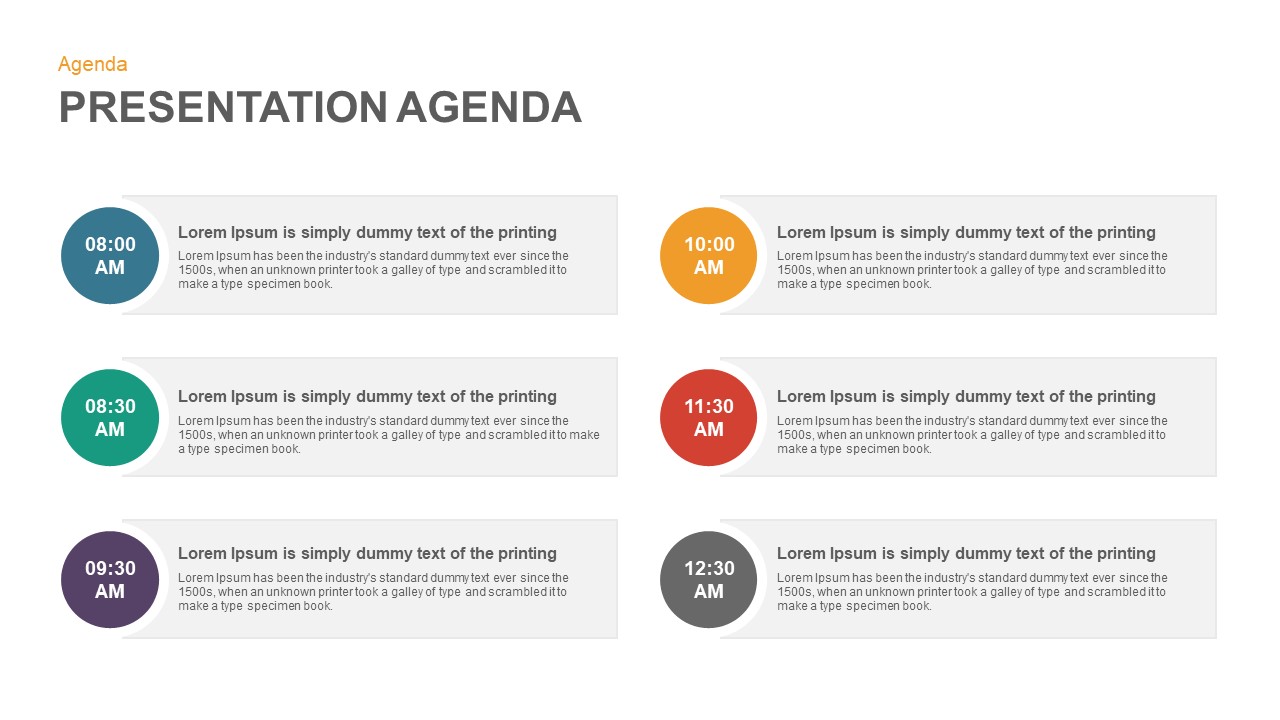
Multi-Style Presentation Agenda Template for PowerPoint & Google Slides
Agenda
Multi-Year Timeline Infographic Template for PowerPoint & Google Slides
Timeline

Multi-Cluster Mind Map Infographic Template for PowerPoint & Google Slides
Mind Maps
Multi-Style Project Life Cycle Diagram Template for PowerPoint & Google Slides
Process
Multi-Functional Presentation Template for PowerPoint & Google Slides
Pitch Deck
Multi-Purpose Corporate Infographic Template for PowerPoint & Google Slides
Company Profile
Free
Multi-Color Enneagram Circular Diagram Template for PowerPoint & Google Slides
Circular
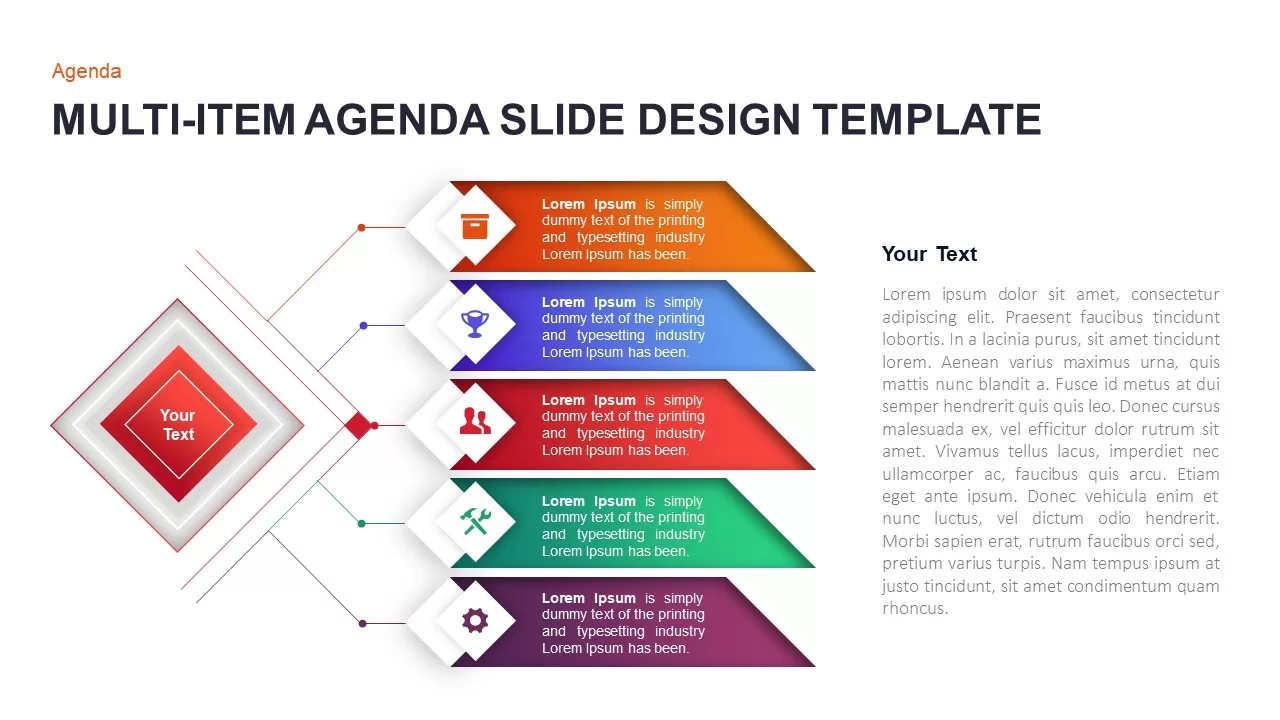
Multi-Item Agenda Hub-and-Spoke Diagram Template for PowerPoint & Google Slides
Agenda
Doodle Multi Presentation Template for PowerPoint & Google Slides
Company Profile
Free Timeline Infographic Template
Timeline
Free
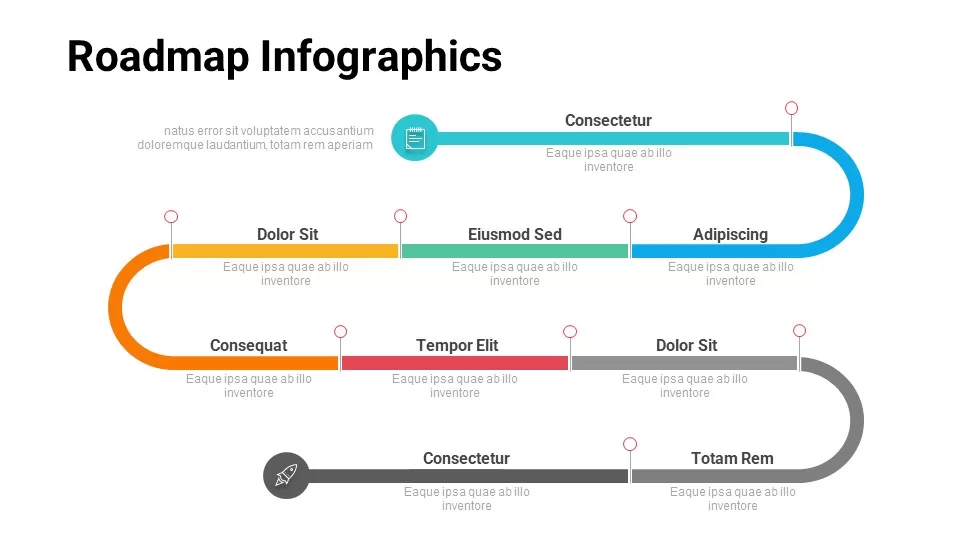
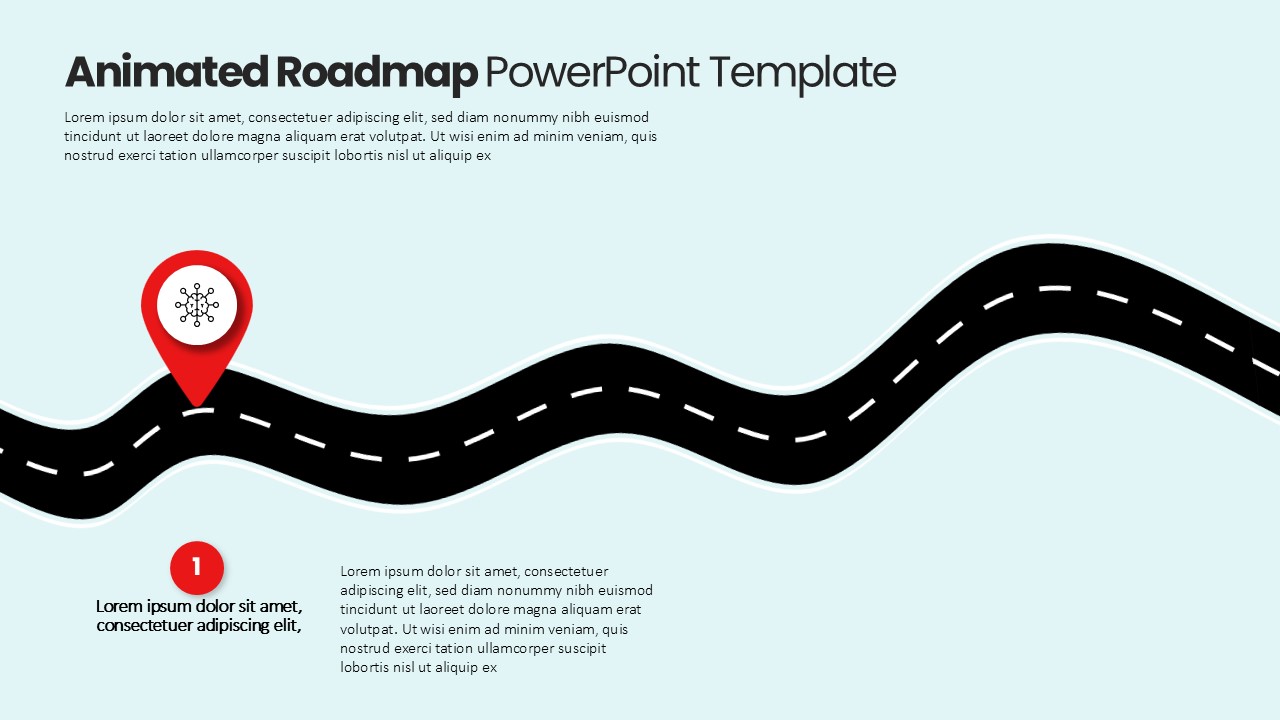
Free Multi-Level Roadmap Infographic Template for PowerPoint & Google Slides
Roadmap
Free
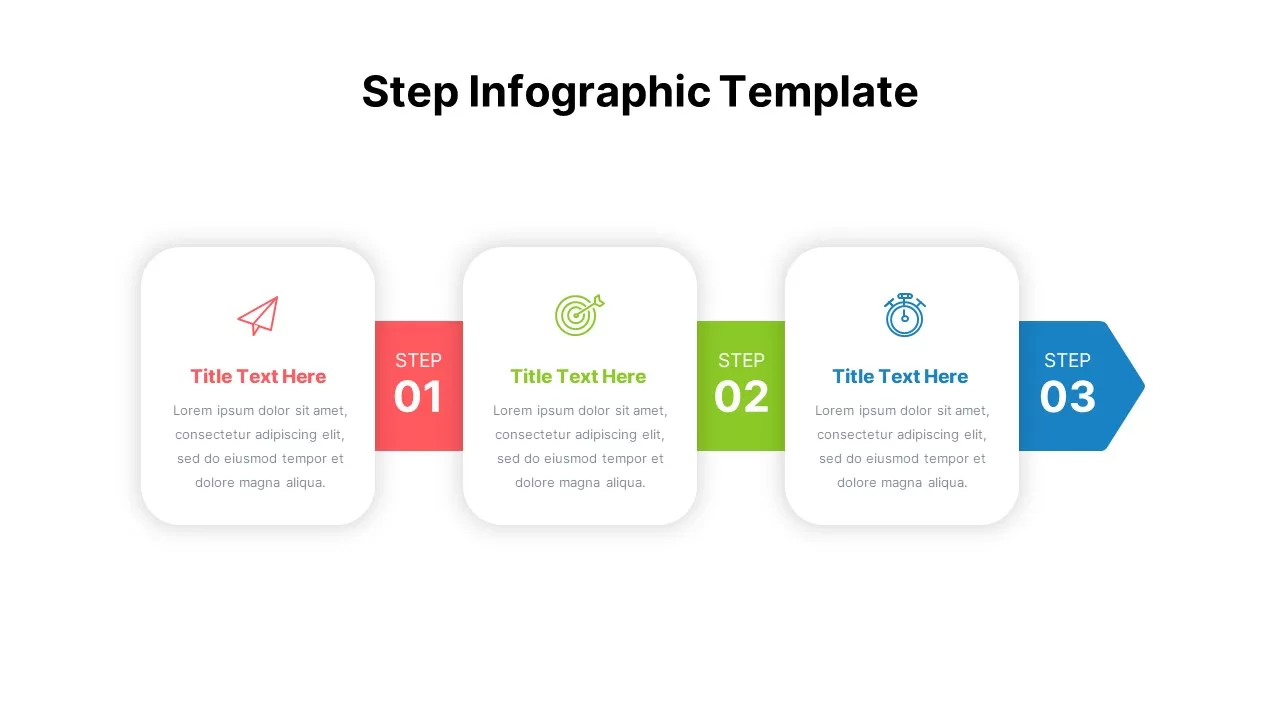
Multi-Step Infographic Process Layout Template for PowerPoint & Google Slides
Process
Multi-Style Flow Infographic Slide template for PowerPoint & Google Slides
Process
Multi-Color Five-Step Curved Arrow Template for PowerPoint & Google Slides
Process
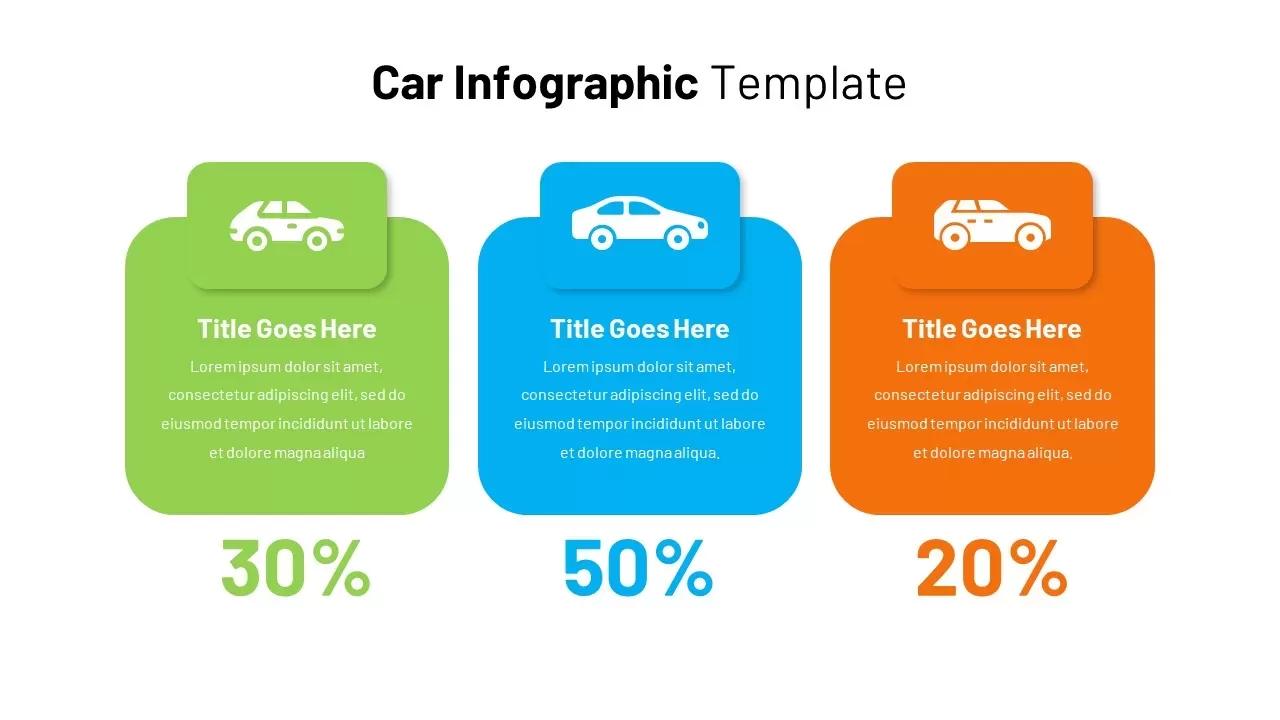
Automotive Infographic Multi-Layout Template for PowerPoint & Google Slides
Comparison
Animated Multi-Gear Cluster Infographic Template for PowerPoint & Google Slides
Process
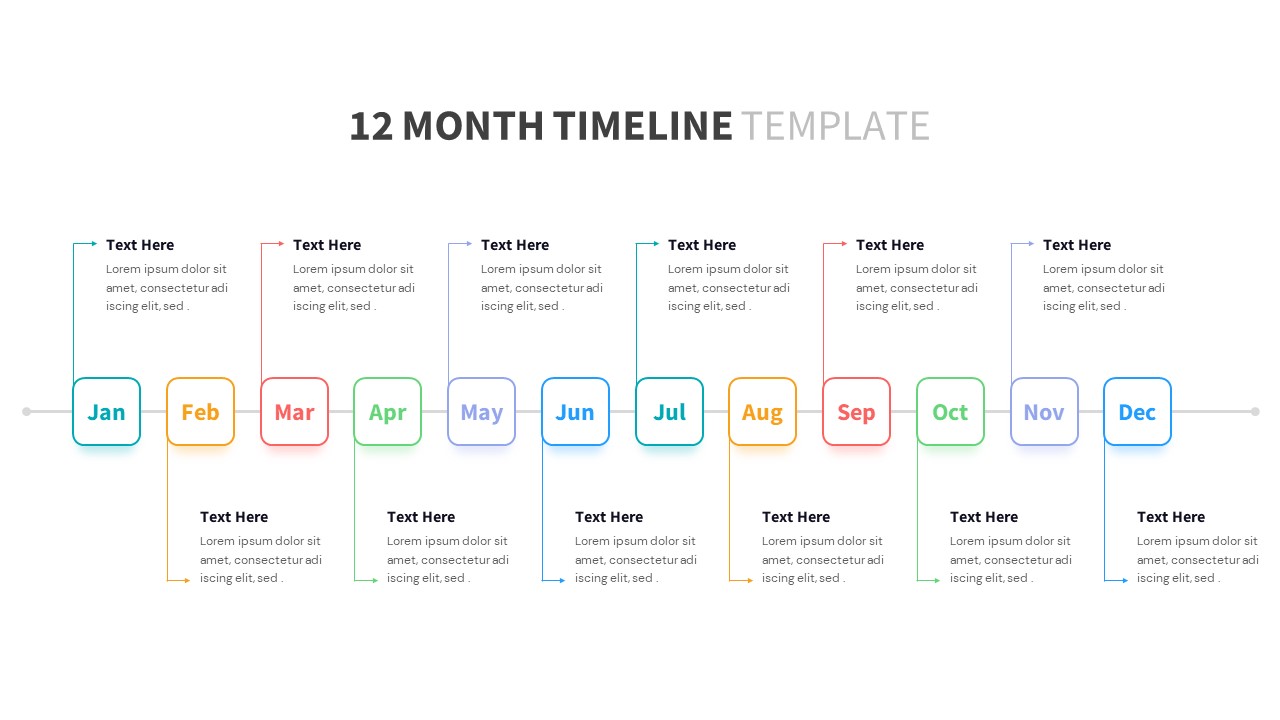
January to December 12 Month Timeline PowerPoint Template
Timeline
Multi-Color Milestone Timeline Layout Template for PowerPoint & Google Slides
Timeline
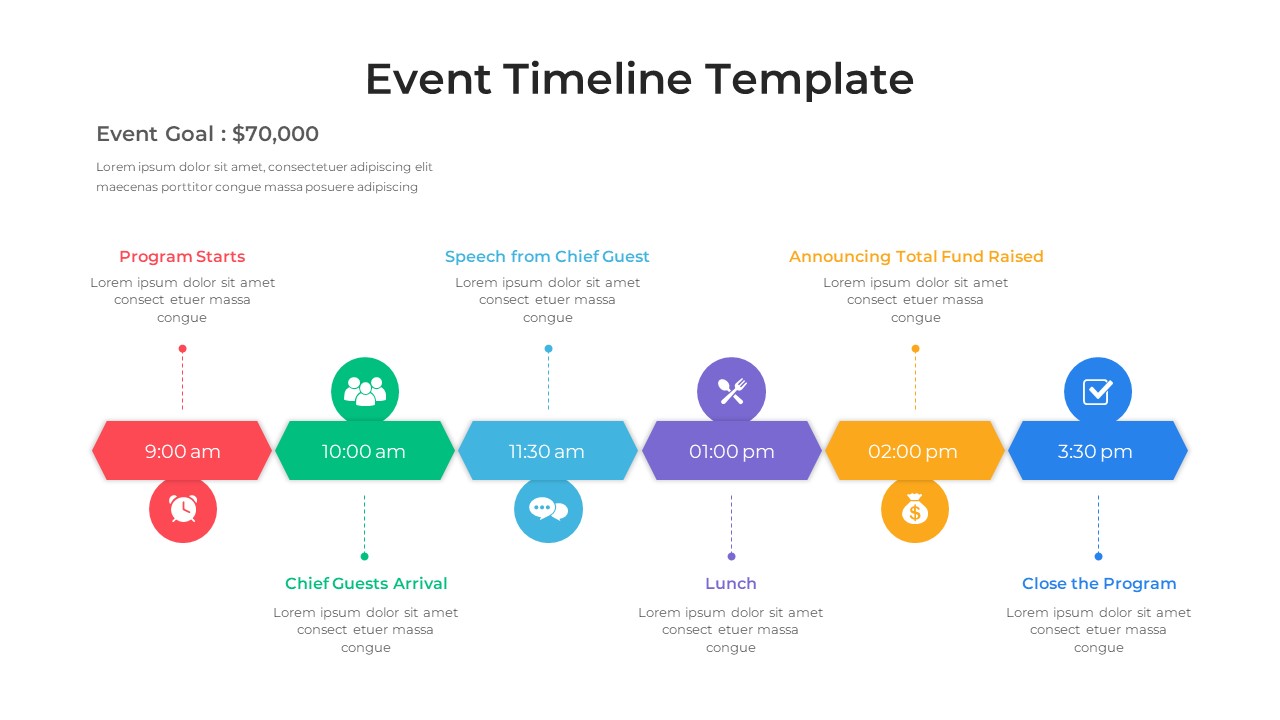
Event Timeline Template for PowerPoint & Google Slides
Timeline
Delivery Timeline Multi-Row Template for PowerPoint & Google Slides
Timeline
Interactive Multi-Use Cost Comparison Template for PowerPoint & Google Slides
Comparison
Free Editable Multi-Step Ribbon Agenda Slide Template for PowerPoint & Google Slides
Agenda
Free
Multi-Phase Research Roadmap Infographic Template for PowerPoint & Google Slides
Roadmap
Multi-Color Technology Roadmap Template Pack for PowerPoint & Google Slides
Roadmap
Free Elegant Multi-Day Travel Timeline Template for PowerPoint & Google Slides
Timeline
Free
Free Multi-Step Funnel Infographic Slide Pack Template for PowerPoint & Google Slides
Funnel
Free
Free Table Of Contents PowerPoint Slides Template
Agenda
Free
Colorful Multi-Branch Mind Map Slide Template for PowerPoint & Google Slides
Mind Maps
Multi-color Curved Timeline Roadmap Template for PowerPoint & Google Slides
Timeline
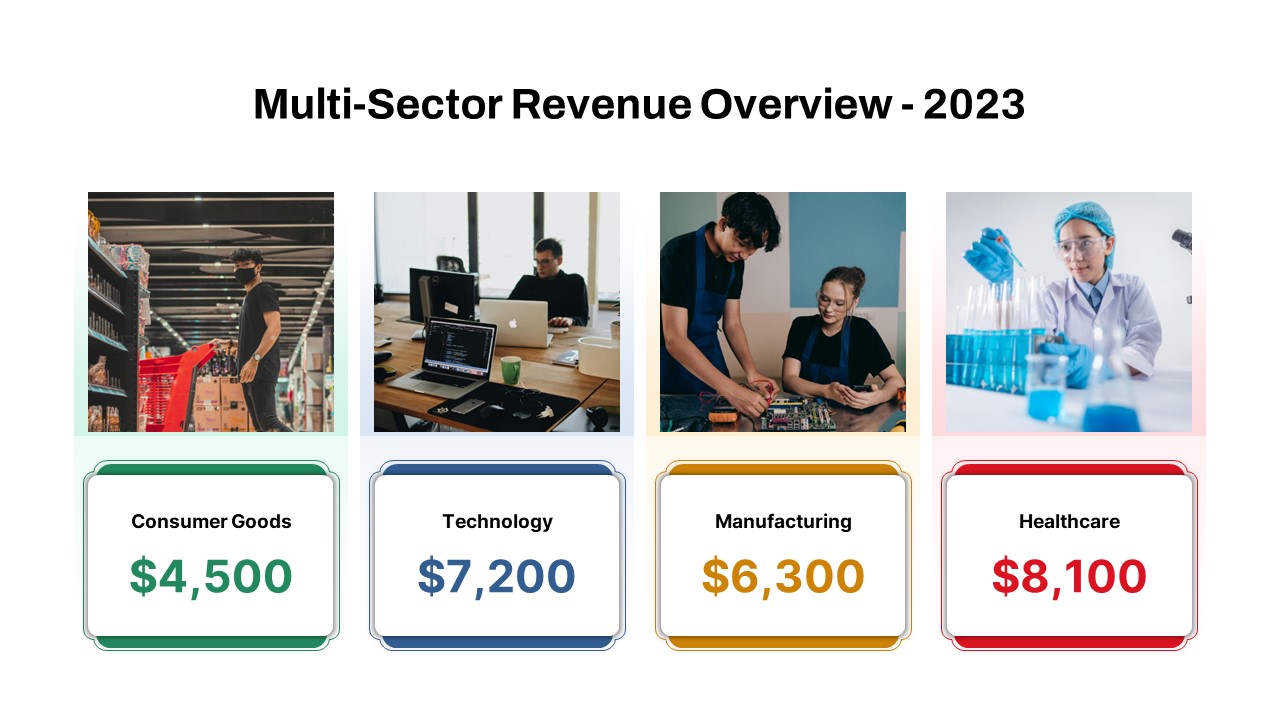
Multi-Sector Revenue Breakdown Cards Template for PowerPoint & Google Slides
Comparison
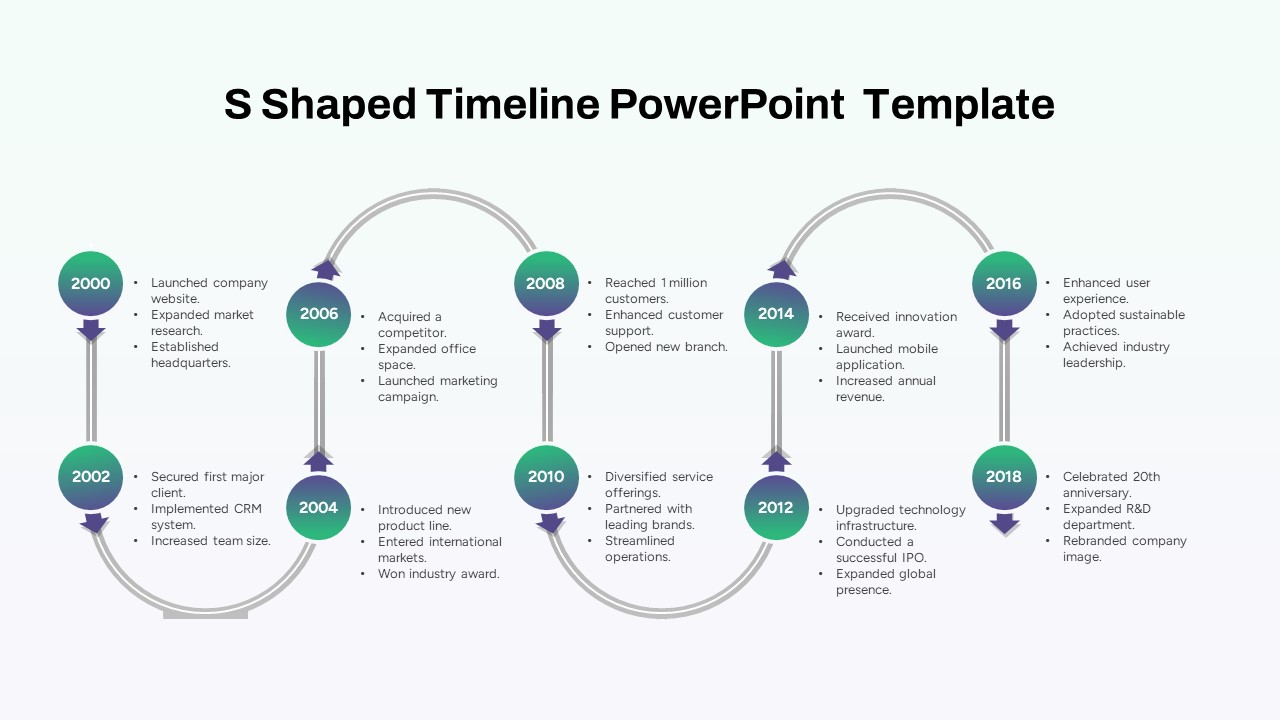
Multi-Year S-Shaped Roadmap Timeline Template for PowerPoint & Google Slides
Timeline
Multi-Style Board of Directors Profile Template for PowerPoint & Google Slides
Our Team
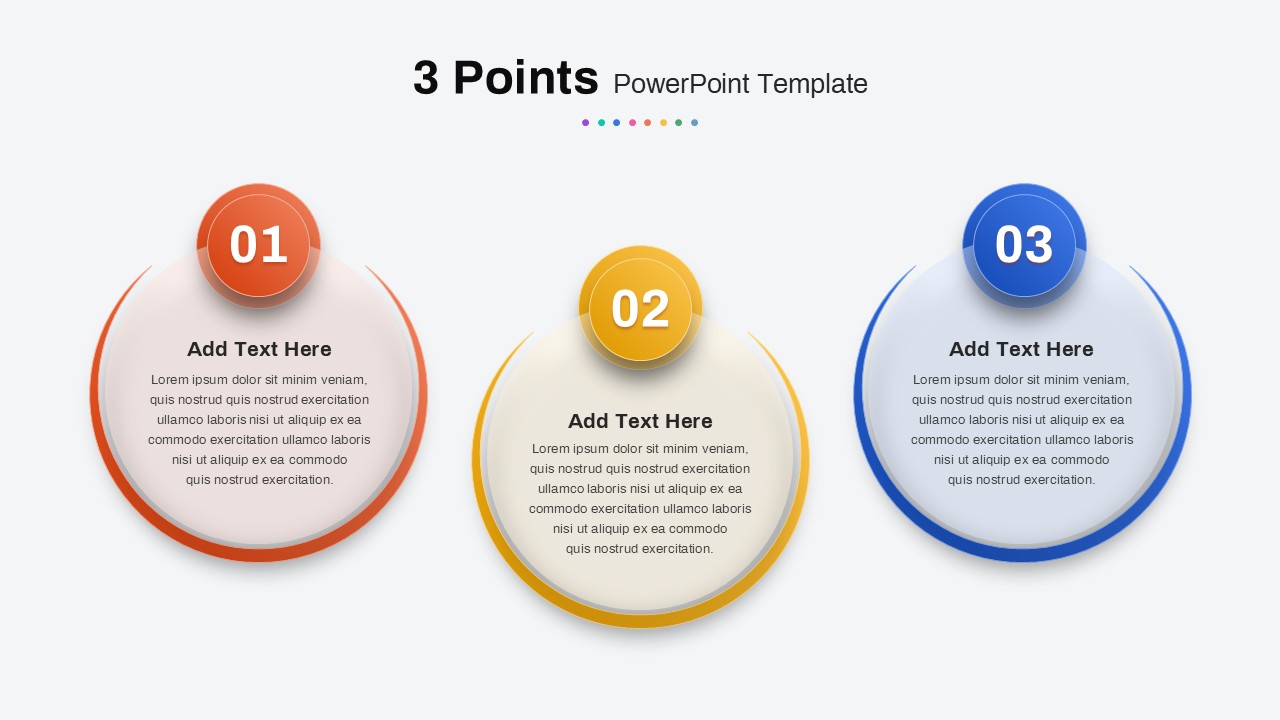
Multi-Point Diagram Presentation Template for PowerPoint & Google Slides
Process
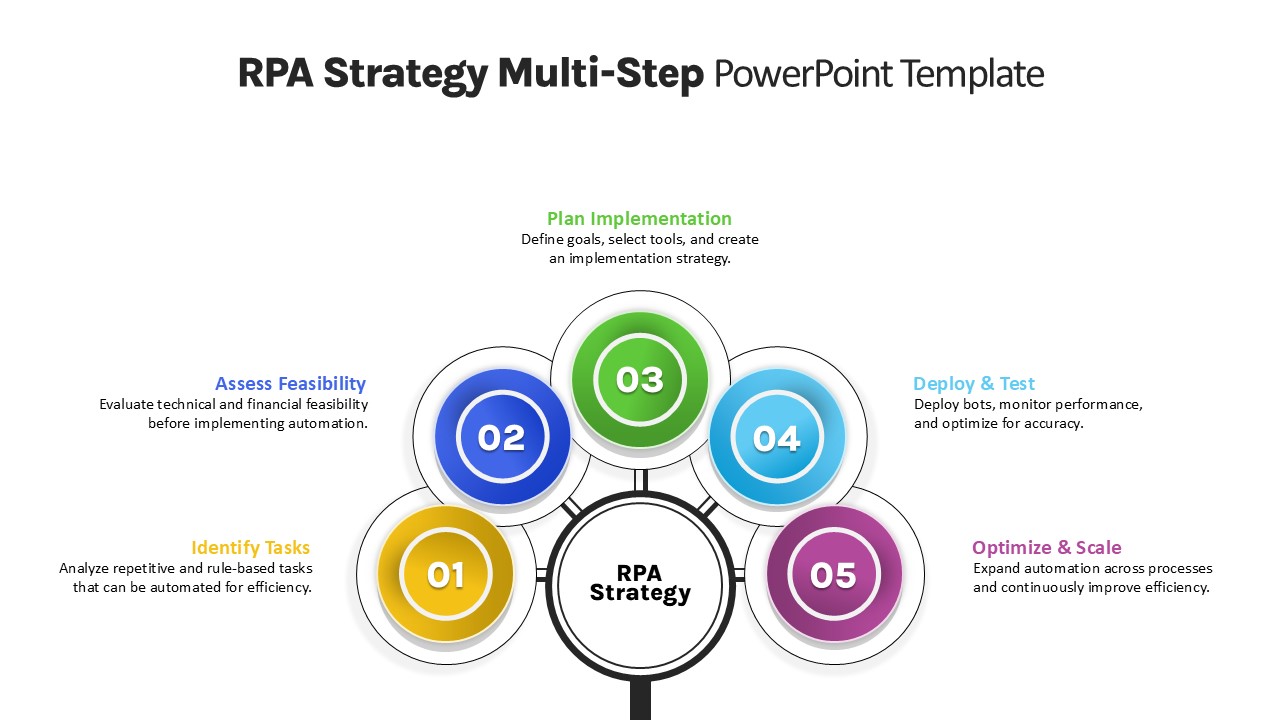
RPA Strategy Multi-Step Diagram Template for PowerPoint & Google Slides
Process
Animated Multi-Milestone Roadmap Template for PowerPoint & Google Slides
Roadmap
Multi-Column Table Presentation Template for PowerPoint & Google Slides
Table
Six-Row Multi-Column Table Presentation Template for PowerPoint & Google Slides
Table
Multi Color SWOT Analysis Quadrant Template for PowerPoint & Google Slides
SWOT
Line Graph Analysis template for PowerPoint & Google Slides
Charts
Sales Growth Dashboard: KPI Gauge & Line Template for PowerPoint & Google Slides
Revenue

Creative Clothing Line Presentation Template for PowerPoint & Google Slides
Pitch Deck
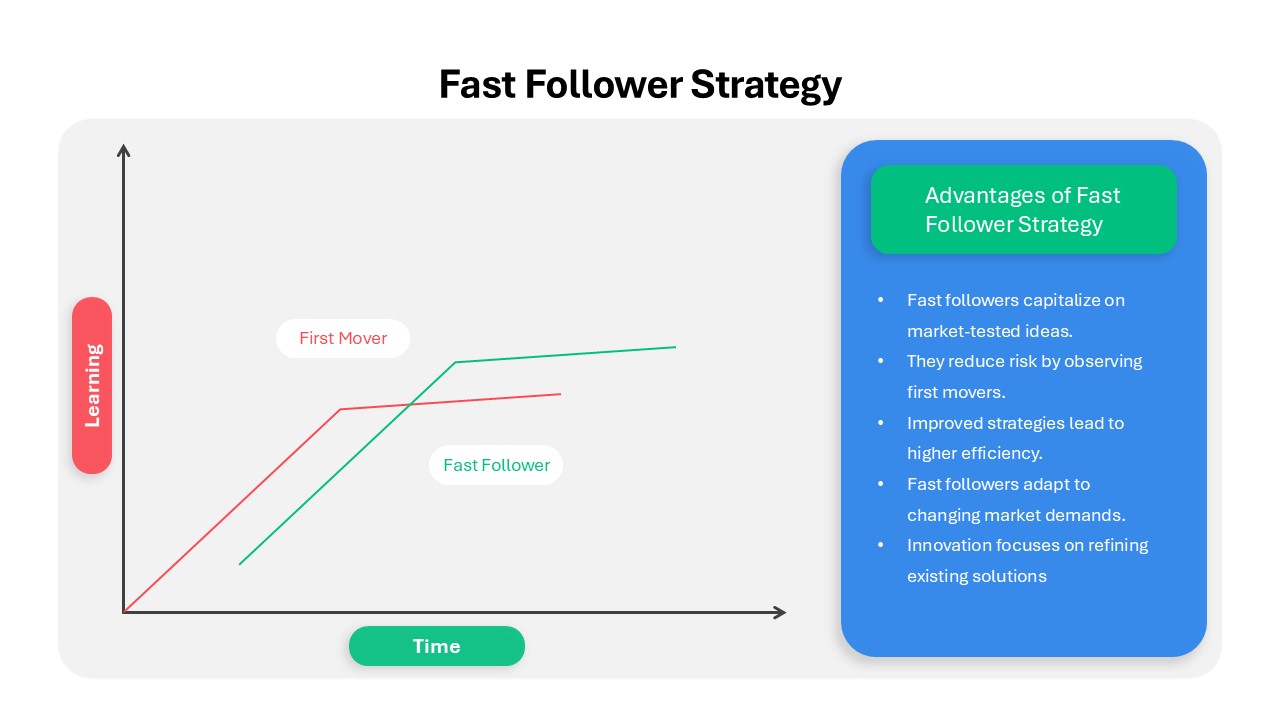
Fast Follower Strategy Line Graph Template for PowerPoint & Google Slides
Comparison Chart
3Ps Triple Bottom Line Venn Diagram Template for PowerPoint & Google Slides
Circular
4 People Racing to Finish Line Template for PowerPoint & Google Slides
Accomplishment
Curved Line Graph for PowerPoint & Google Slides
Timeline
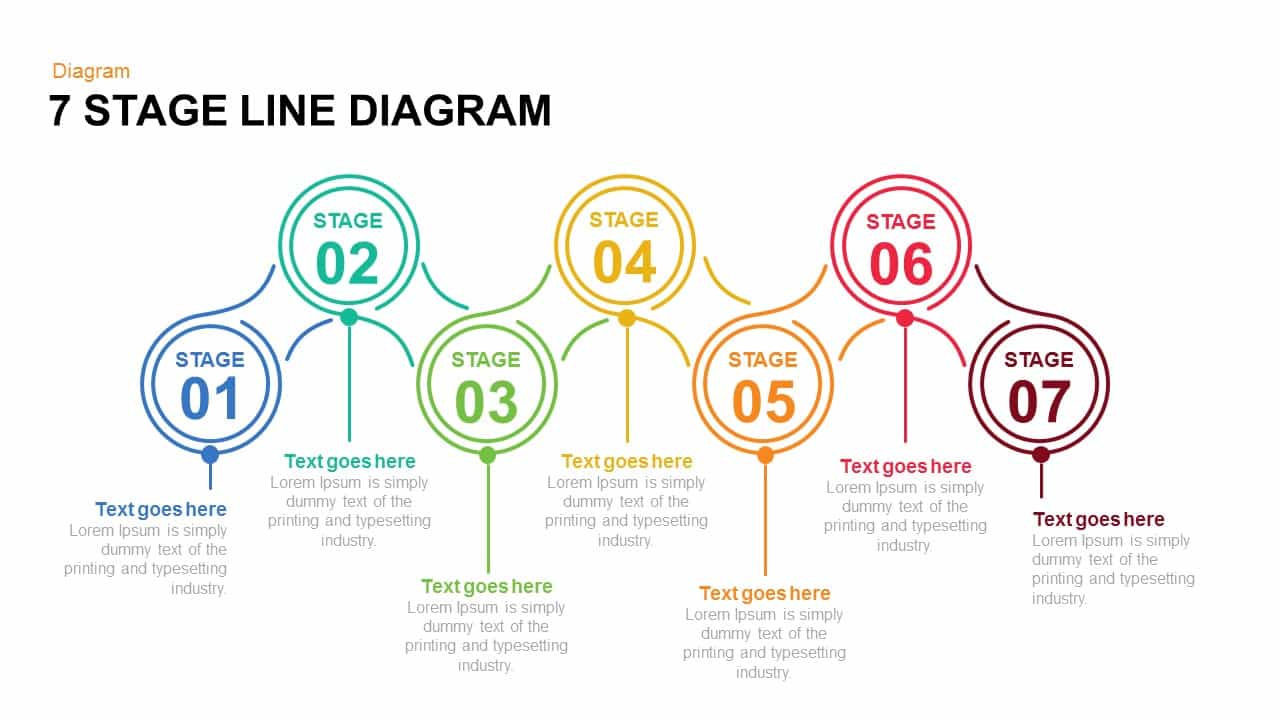
7 and 6 Stage Line Diagram Overview for PowerPoint & Google Slides
Infographics
Five and Six Step Line Linear Stage Diagram for PowerPoint & Google Slides
Infographics
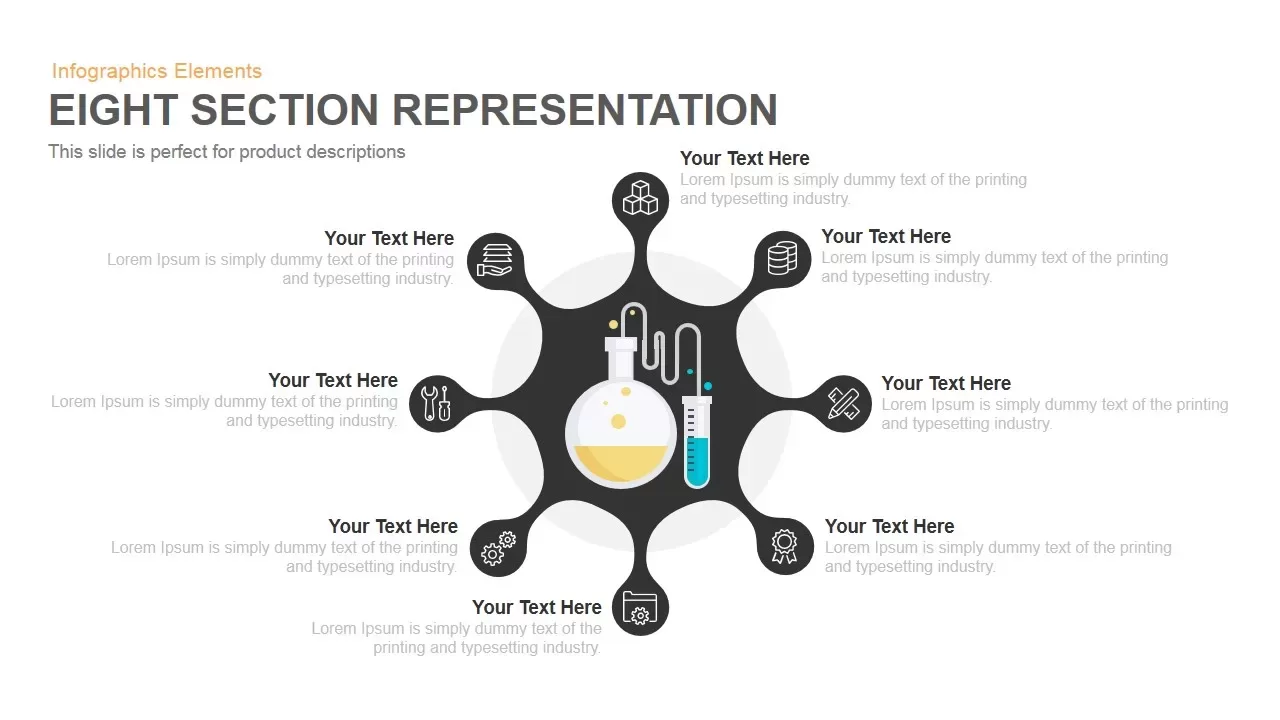
Eight Section Lab Infographic with Icons Template for PowerPoint & Google Slides
Circular
Comprehensive Social Media Icons Slide Template for PowerPoint & Google Slides
Advertising
Six-Stage Semi-Circle Diagram with Icons Template for PowerPoint & Google Slides
Circular
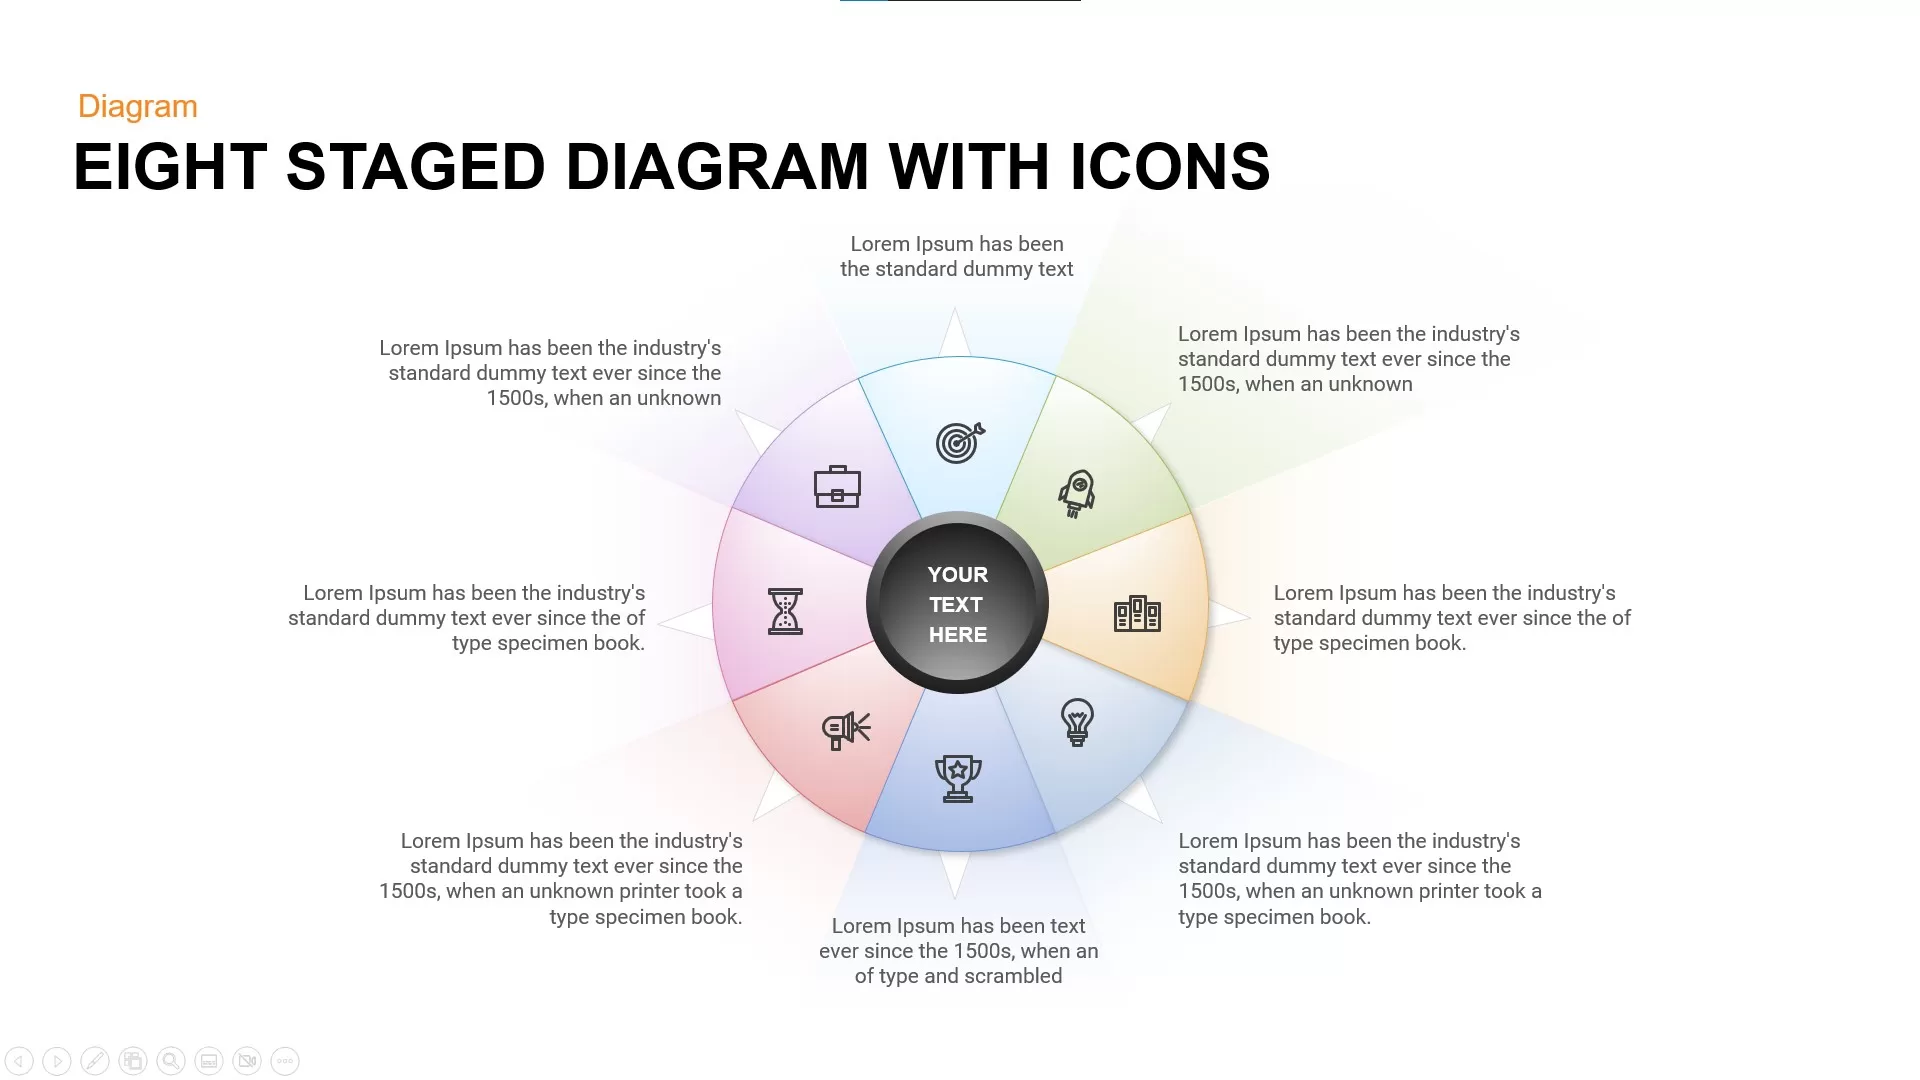
Eight Staged Diagram with Icons template for PowerPoint & Google Slides
Process
Free
Six Stage Circular Diagram with Icons Template for PowerPoint & Google Slides
Circular
Developer Icons Metaphor Slide Template for PowerPoint & Google Slides
Software Development
Umbrella & Rain Icons Infographic Template for PowerPoint & Google Slides
Goals
Internet Marketing Megaphone with Icons Template for PowerPoint & Google Slides
Process
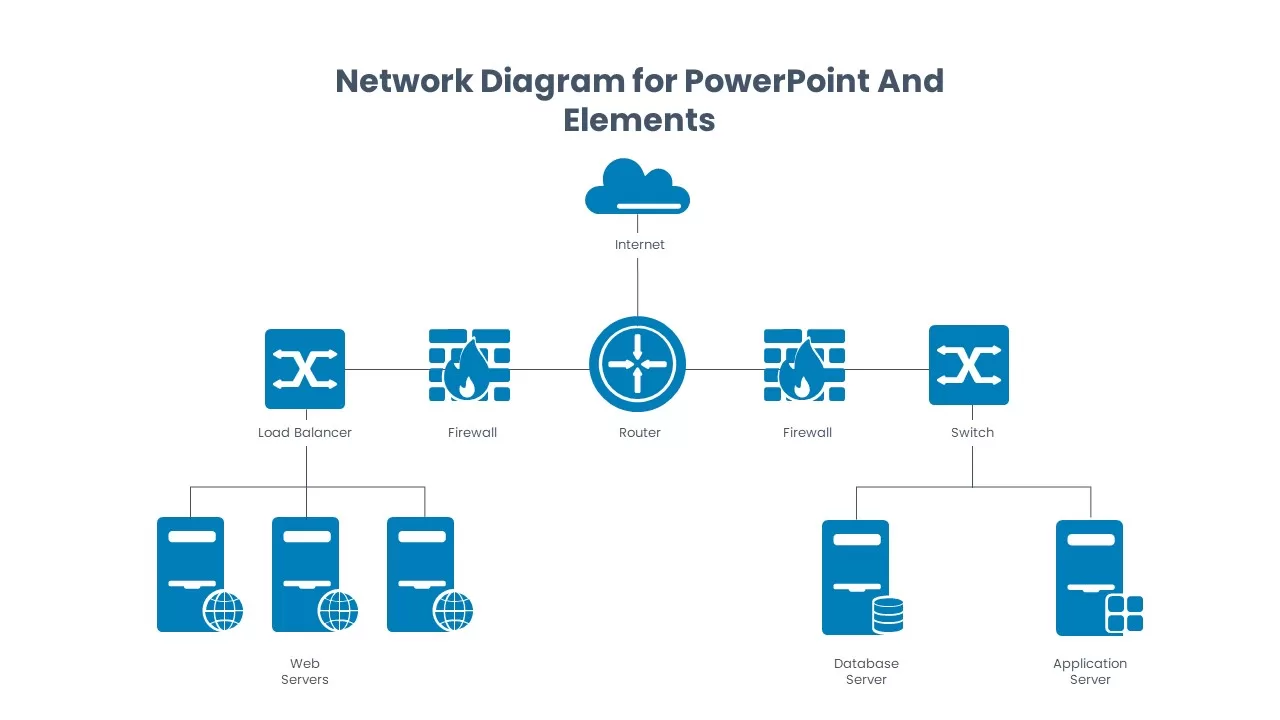
Network Diagram Elements and Icons Pack Template for PowerPoint & Google Slides
Information Technology
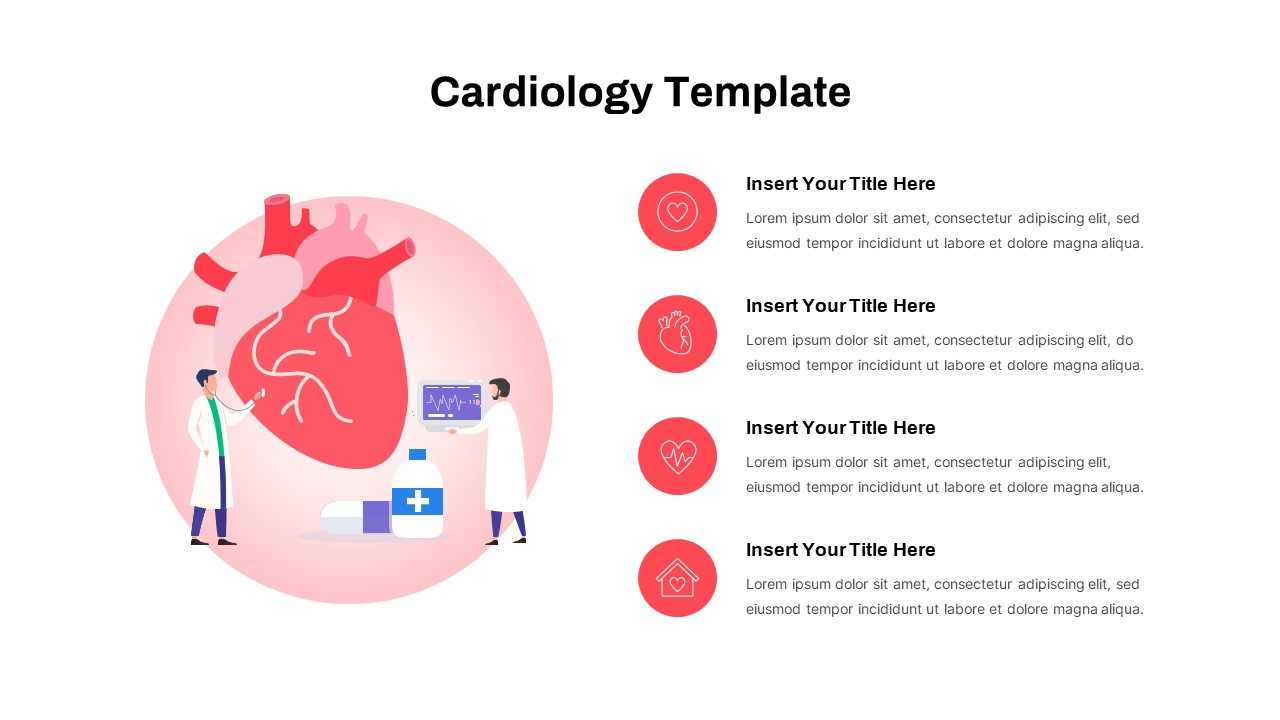
Cardiology Icons & Illustration Slide Template for PowerPoint & Google Slides
Health
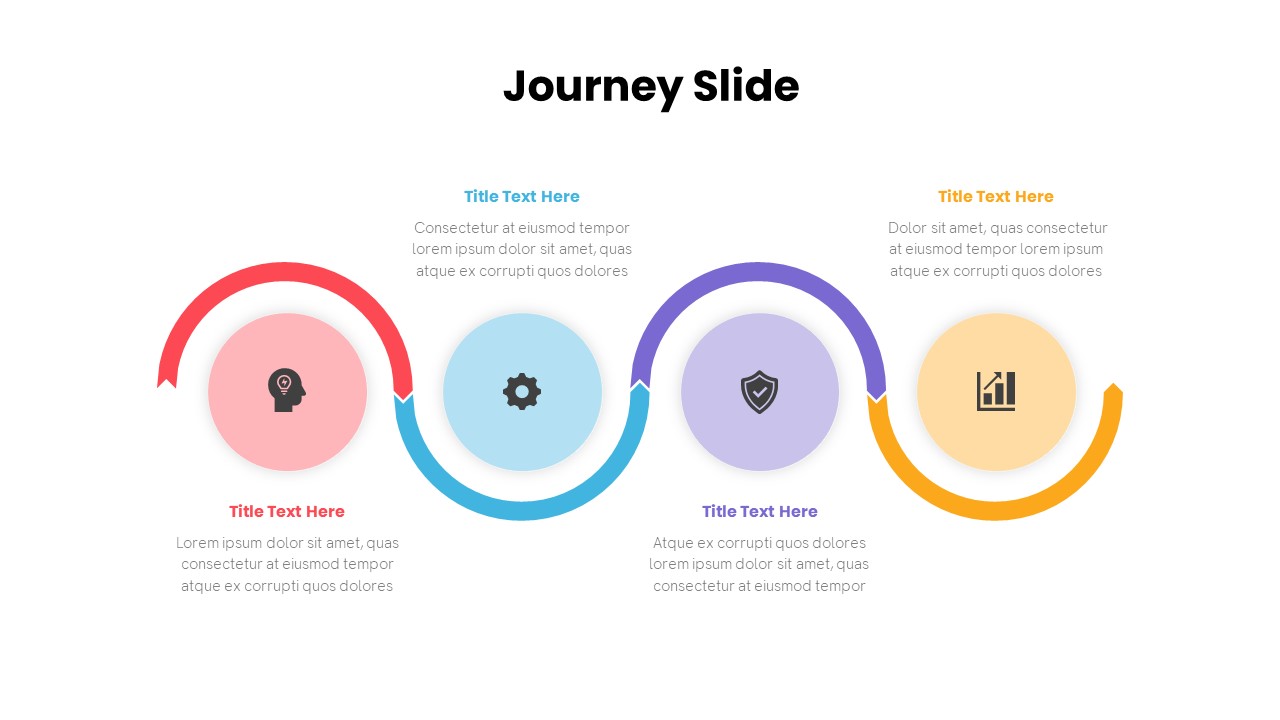
Free Journey Slide PowerPoint Presentation Template
Process
Free
Our Principles Slide with Icons Layout Template for PowerPoint & Google Slides
Vision and Mission