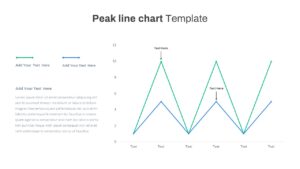
Editable Multi-Series Peak Line Chart Template for PowerPoint & Google Slides


Description
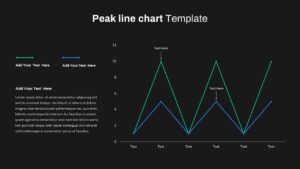
Drive deeper insights with this editable multi-series peak line chart slide, designed to showcase comparative data trends and key performance indicators with precision. The slide features two distinct line series—one in vibrant green and another in crisp blue—each marked with diamond endpoints to highlight data points. Vertical annotations at peak values provide clear callouts for critical milestones, while a simple horizontal axis labeled with customizable categories ensures your audience can easily follow fluctuations over time. A clean white background, subtle gridlines, and minimalist typography combine to create a professional and distraction-free canvas for your data narrative.
Leveraging master slides and fully editable elements, you can quickly adjust line colors, swap data labels, or reposition annotations to fit your brand guidelines. The left panel includes a dedicated text placeholder for contextual summaries or insights, making it easy to pair visuals with narrative explanations. Whether you need to emphasize seasonal peaks, compare product performance, or track resource utilization, this slide’s adaptable structure empowers you to present complex data in a straightforward, visually engaging manner.
Optimized for both PowerPoint and Google Slides, this asset maintains high resolution clarity and consistent formatting across platforms. Simply duplicate the slide within your deck, update your data series, and customize axis labels to align with your reporting period.
Who is it for
Business analysts, marketing managers, and financial planners will value this slide for tracking trends, comparing performance metrics, and highlighting critical data points. Project managers, consultants, and C-suite executives can leverage the clear visual hierarchy to support data-driven decision-making in team meetings, board presentations, and stakeholder briefings.
Other Uses
Beyond KPI tracking, repurpose this layout for project timeline highlights, sales funnel overviews, budget vs. actual comparisons, and resource allocation reviews. Use the dual-series format to contrast year-over-year data, benchmark departmental outputs, or showcase A/B test results with equal clarity.
Login to download this file

Item ID
SB03618
Related Templates

Multi-Series Line Chart with Icons Template for PowerPoint & Google Slides
Comparison Chart
Multi-Series Curved Line Graph Analytics Template for PowerPoint & Google Slides
Comparison Chart
Multi-Series Stacked Bar Chart Template for PowerPoint & Google Slides
Bar/Column
Multi-Series Vertical Dot Chart Template for PowerPoint & Google Slides
Comparison Chart
Dynamic Three-Series Stacked Area Chart Template for PowerPoint & Google Slides
Comparison Chart
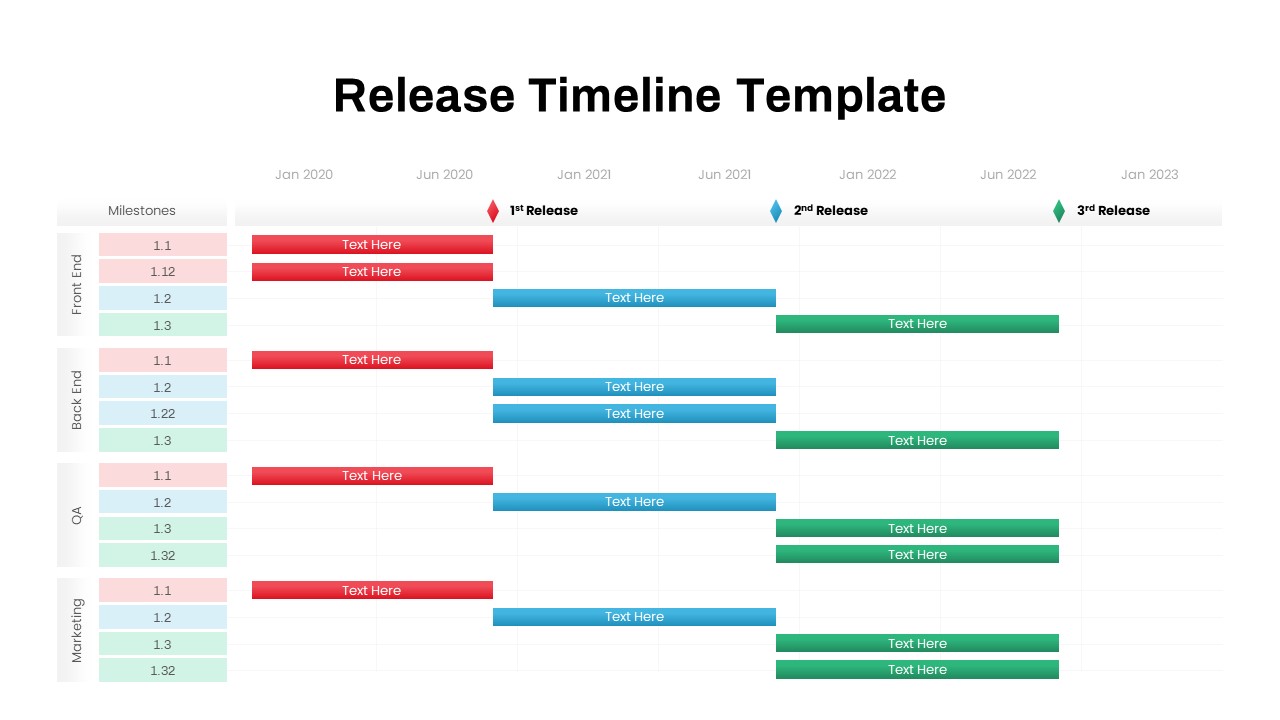
Multi-Team Multi-Phase Release Timeline Template for PowerPoint & Google Slides
Timeline
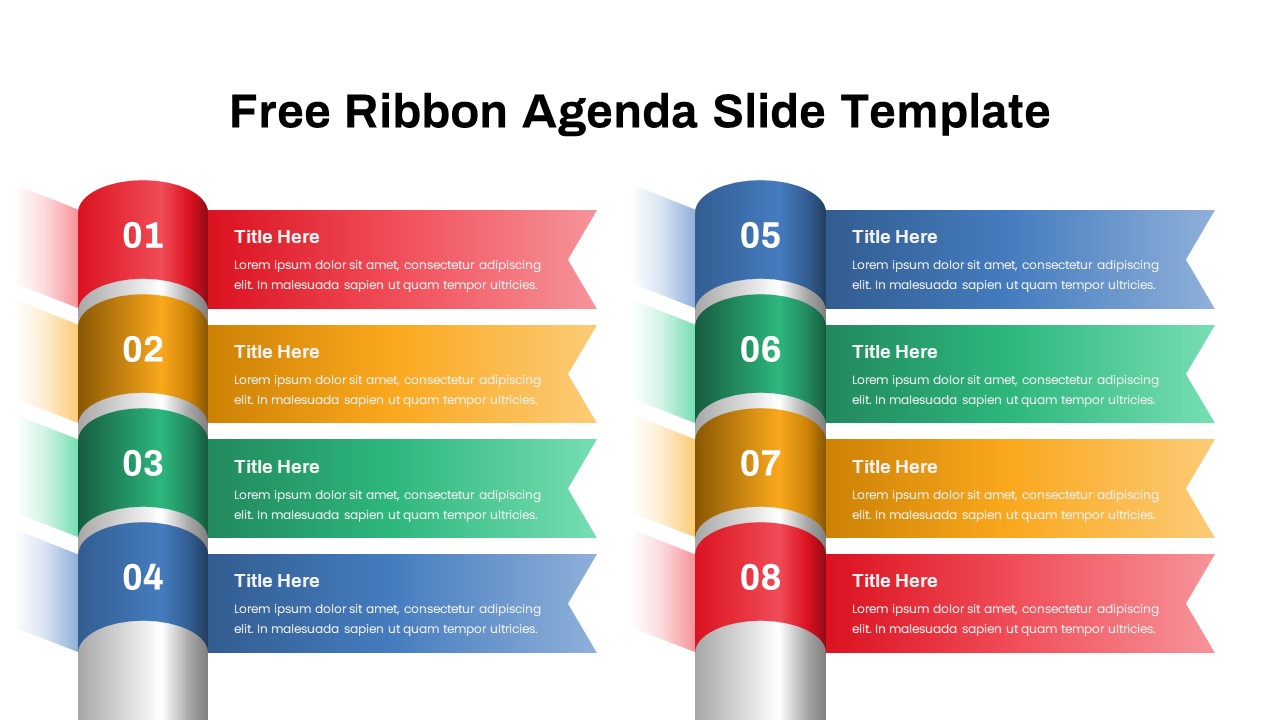
Free Ribbon Agenda PowerPoint Template
Agenda
Free
Fishbone Timeline Template
Manufacturing
Horizontal Multi-Level Hierarchy Chart template for PowerPoint & Google Slides
Org Chart
Free Circular Multi-Step Flow Chart Diagram Template for PowerPoint & Google Slides
Flow Charts
Free
Minimal Multi-Year Column Chart Template for PowerPoint & Google Slides
Bar/Column
Multi-Variation Thermometer Chart Template for PowerPoint & Google Slides
Bar/Column
Multi-Style Clock Chart Diagram Template for PowerPoint & Google Slides
Circular
Multi-Variation Circular Chart Diagram Template for PowerPoint & Google Slides
Circular
Modern Multi-Color Polar Chart Diagram Template for PowerPoint & Google Slides
Charts
Wheel Chart PowerPoint Templates
Pie/Donut
Multi-Level Colorful Pyramid Chart Template for PowerPoint & Google Slides
Pyramid

Line Chart Analysis template for PowerPoint & Google Slides
Charts

Application Revenue Line Chart KPI Template for PowerPoint & Google Slides
Revenue
Combination Bar and Line Chart Template for PowerPoint & Google Slides
Bar/Column
Arrow Line Chart Template for PowerPoint & Google Slides
Comparison Chart
Data Over Time Line Chart template for PowerPoint & Google Slides
Charts
Growth Curve Line Chart Visualization Template for PowerPoint & Google Slides
Charts
Evolution Line Chart with Milestones Template for PowerPoint & Google Slides
Timeline
Multiple Line Chart PowerPoint Template
Comparison Chart
Interactive Jump Line Data Chart Template for PowerPoint & Google Slides
Comparison Chart
Skimming Pricing Strategy Line Chart Template for PowerPoint & Google Slides
Business Strategy
Dynamic Financial Analysis Line Chart Template for PowerPoint & Google Slides
Finance
3D Line Chart for PowerPoint & Google Slides
Charts

Fully Editable Gantt Chart Timeline template for PowerPoint & Google Slides
Gantt Chart
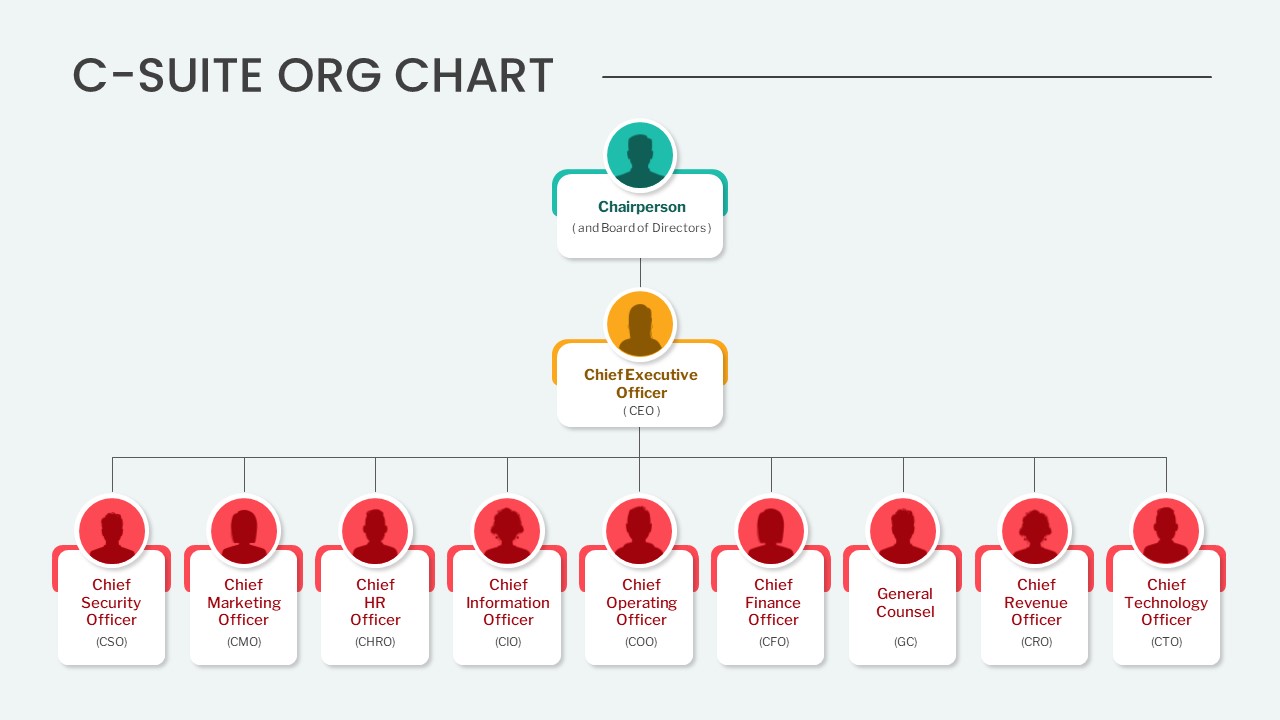
C-Suite Org Chart PowerPoint Template
Org Chart
Free Editable Simple Column Chart Slide Template for PowerPoint & Google Slides
Bar/Column
Free
Data-Driven Line Chart Diagram Template for PowerPoint
Comparison Chart
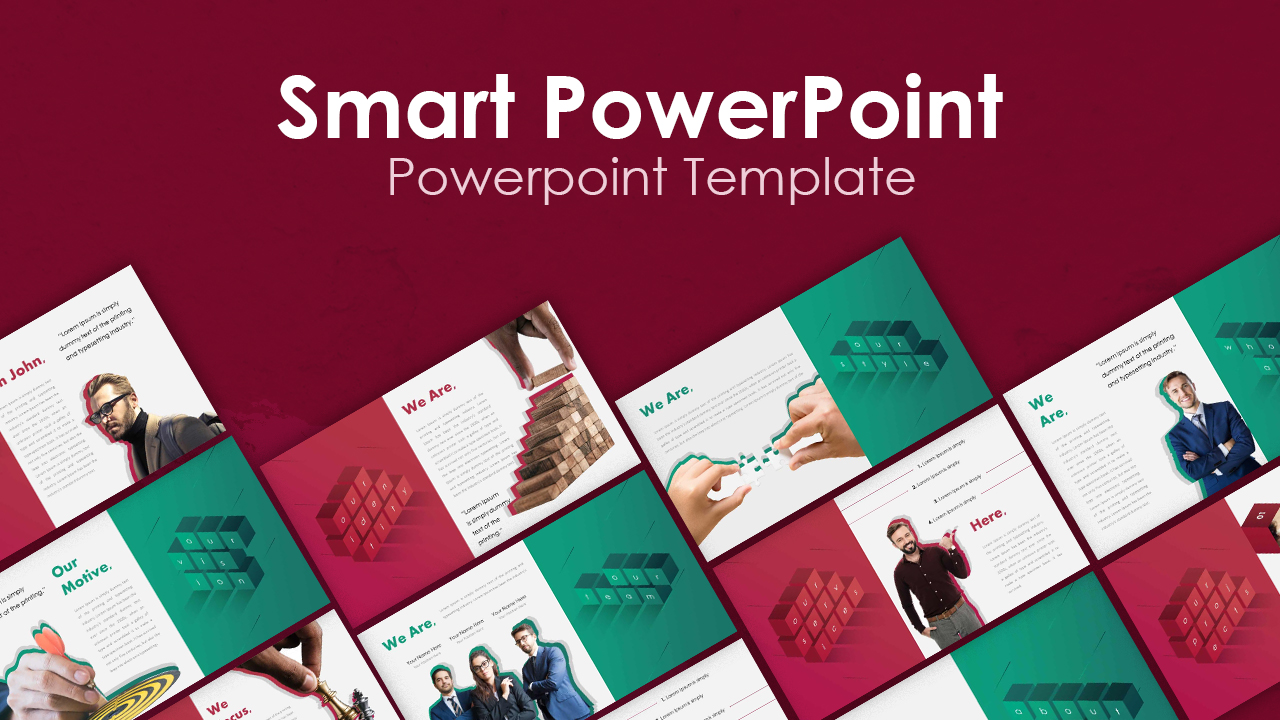
Smart Multi-Purpose PowerPoint Template for PowerPoint & Google Slides
Company Profile
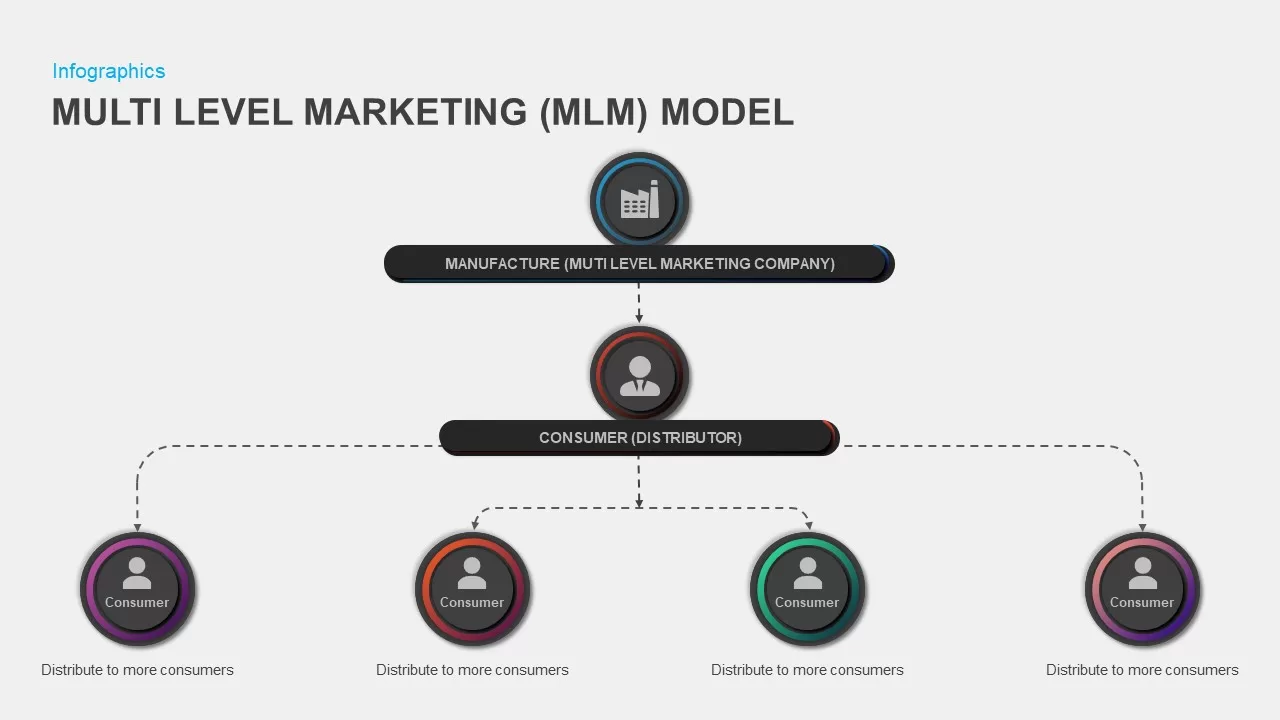
Multi-Level Marketing PowerPoint Template for PowerPoint & Google Slides
Business Models
Multi-Segment Circle Split Diagram template for PowerPoint & Google Slides
Circular

Simple Multi-Branch Mind Map Template for PowerPoint & Google Slides
Mind Maps
Multi-layout Circle Spoke Diagram Template for PowerPoint & Google Slides
Circular
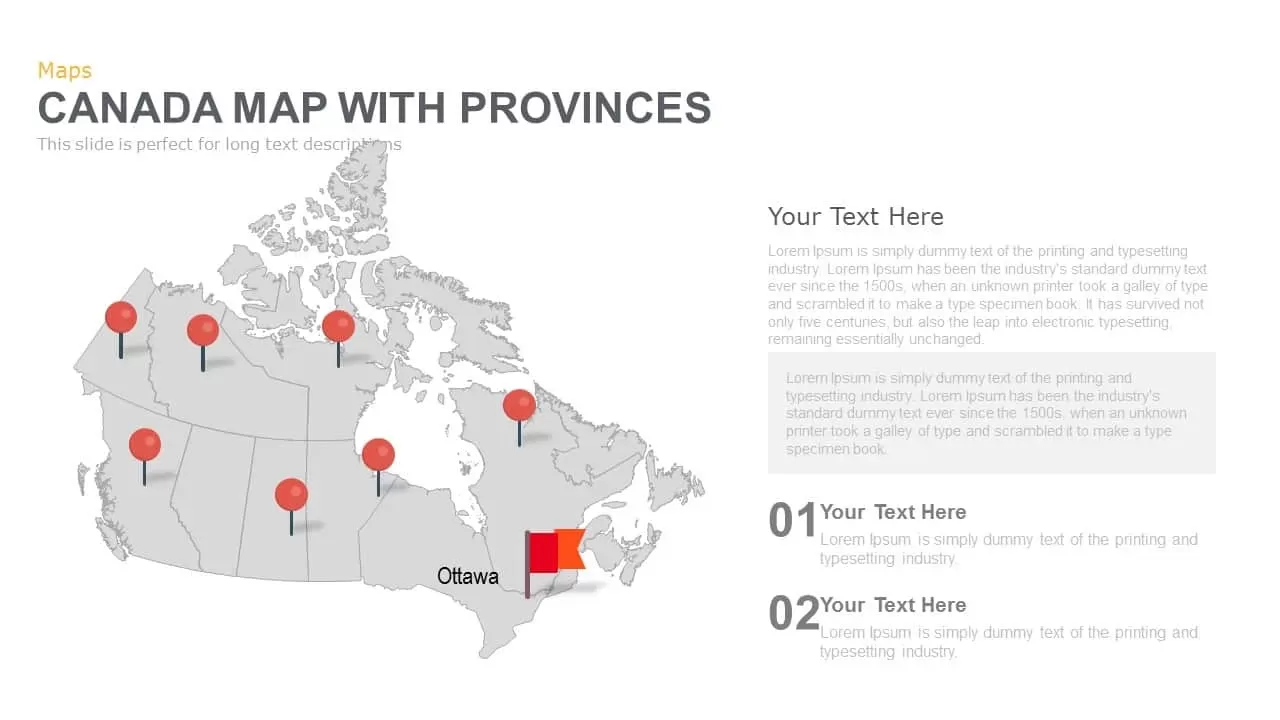
Canada Provinces Map Multi-Layout Template for PowerPoint & Google Slides
World Maps
Multi-Stage Timeline Infographics Template for PowerPoint & Google Slides
Timeline
Modern Multi-Section Circle Diagram Template for PowerPoint & Google Slides
Circular
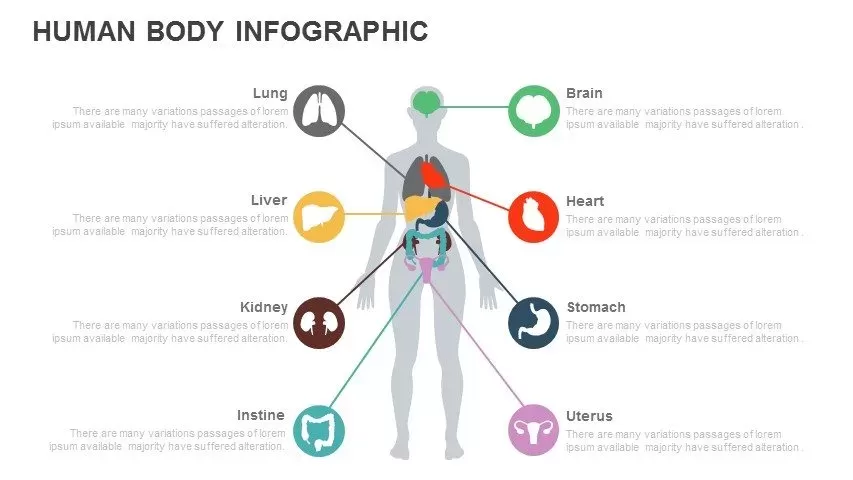
Multi-Organ Human Body Infographic Template for PowerPoint & Google Slides
Comparison
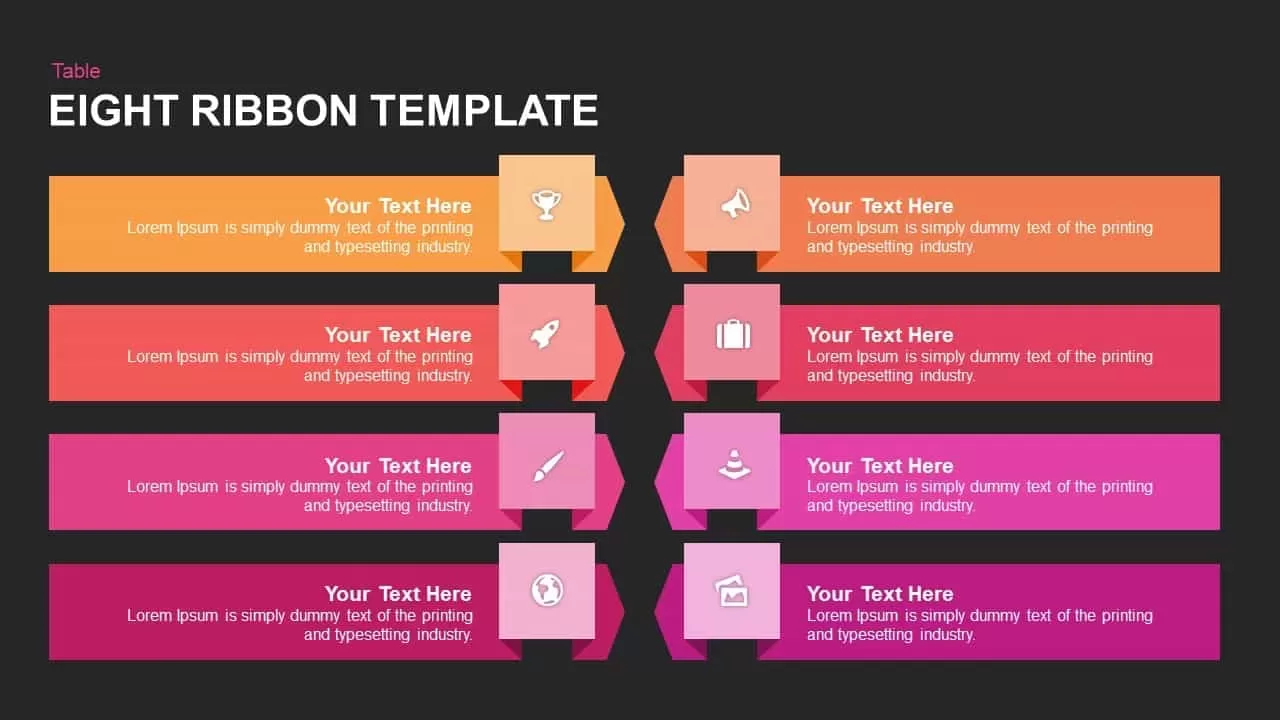
Multi-Color Eight-Step Ribbon Diagram Template for PowerPoint & Google Slides
Process
Multi-Style Presentation Agenda Template for PowerPoint & Google Slides
Agenda
Multi-Year Timeline Infographic Template for PowerPoint & Google Slides
Timeline

Multi-Cluster Mind Map Infographic Template for PowerPoint & Google Slides
Mind Maps
Project Life Cycle Diagram Template
Process
Multi-Functional Presentation Template for PowerPoint & Google Slides
Pitch Deck
Multi-Purpose Corporate Infographic Template for PowerPoint & Google Slides
Company Profile
Free
Multi-Color Enneagram Circular Diagram Template for PowerPoint & Google Slides
Circular
Multi-Item Agenda Hub-and-Spoke Diagram Template for PowerPoint & Google Slides
Agenda
Doodle Multi Presentation Template for PowerPoint & Google Slides
Company Profile
Free Timeline Infographic Template
Timeline
Free
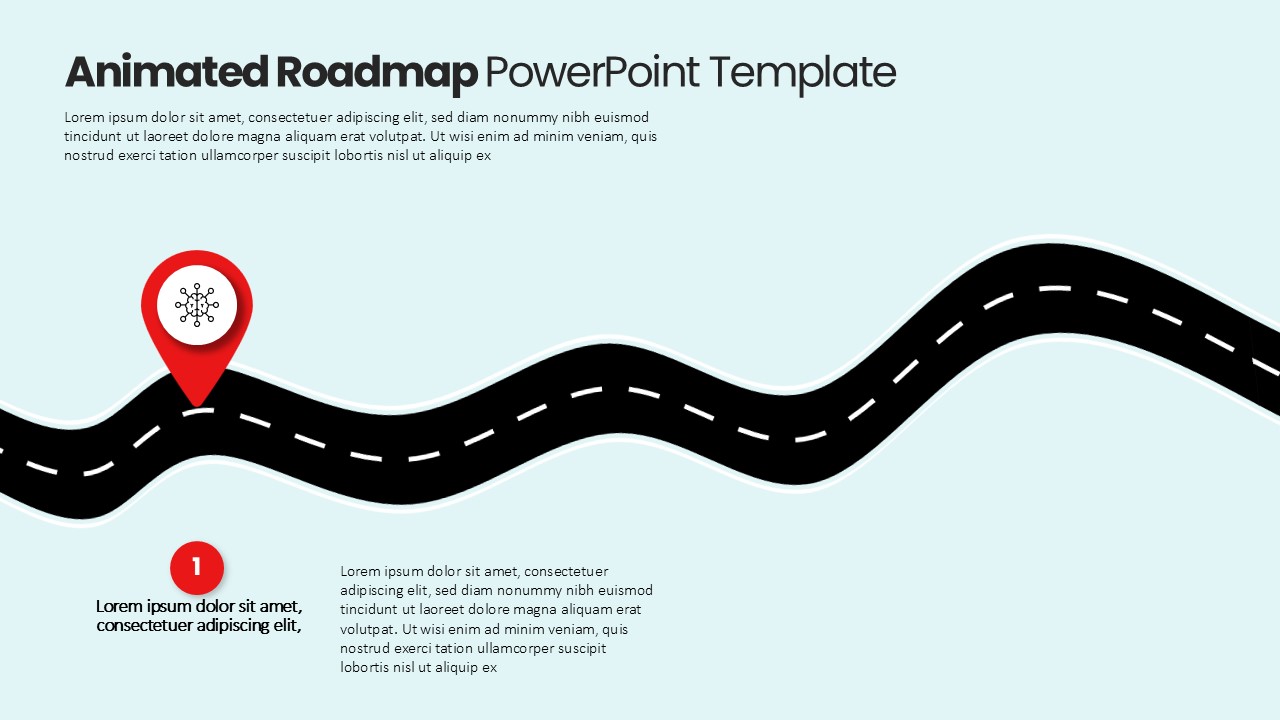
Free Multi-Level Roadmap Infographic Template for PowerPoint & Google Slides
Roadmap
Free
Multi-Step Infographic Process Layout Template for PowerPoint & Google Slides
Process
Multi-Style Flow Infographic Slide template for PowerPoint & Google Slides
Process
Multi-Color Five-Step Curved Arrow Template for PowerPoint & Google Slides
Process
Automotive Infographic Multi-Layout Template for PowerPoint & Google Slides
Comparison
Animated Multi-Gear Cluster Infographic Template for PowerPoint & Google Slides
Process
January to December 12 Month Timeline PowerPoint Template
Timeline
Multi-Color Milestone Timeline Layout Template for PowerPoint & Google Slides
Timeline
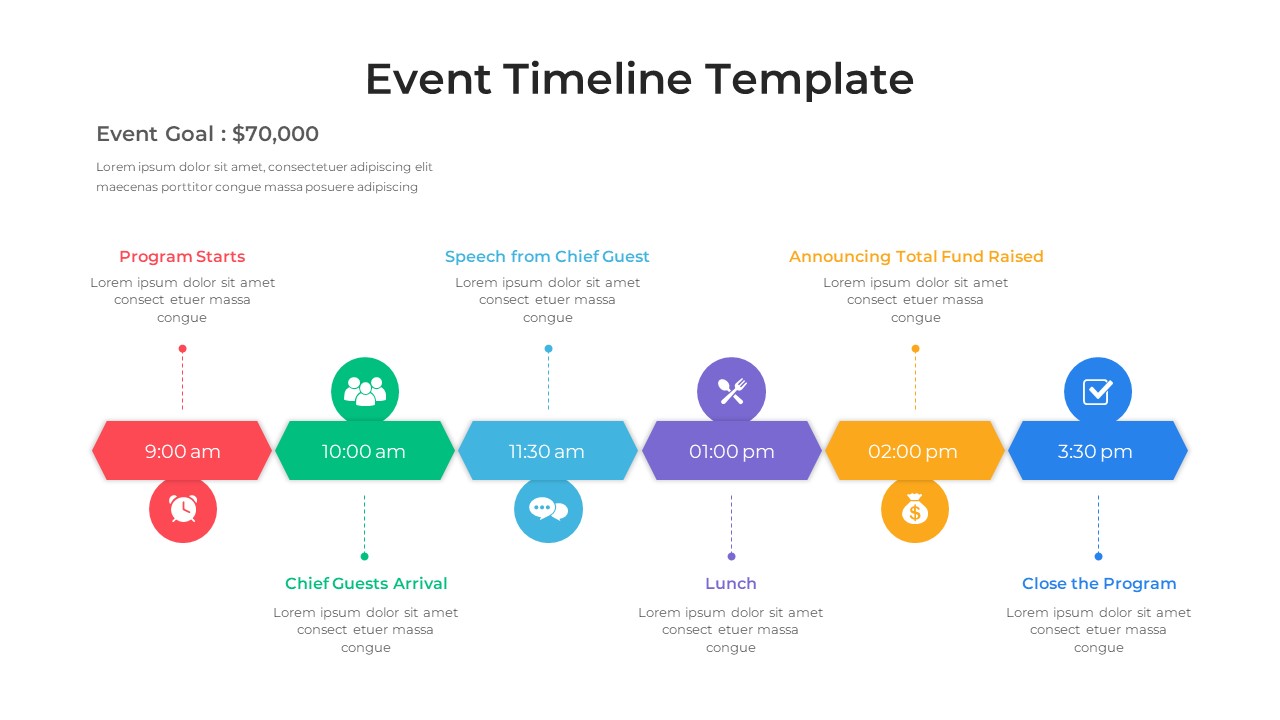
Event Timeline Template for PowerPoint & Google Slides
Timeline
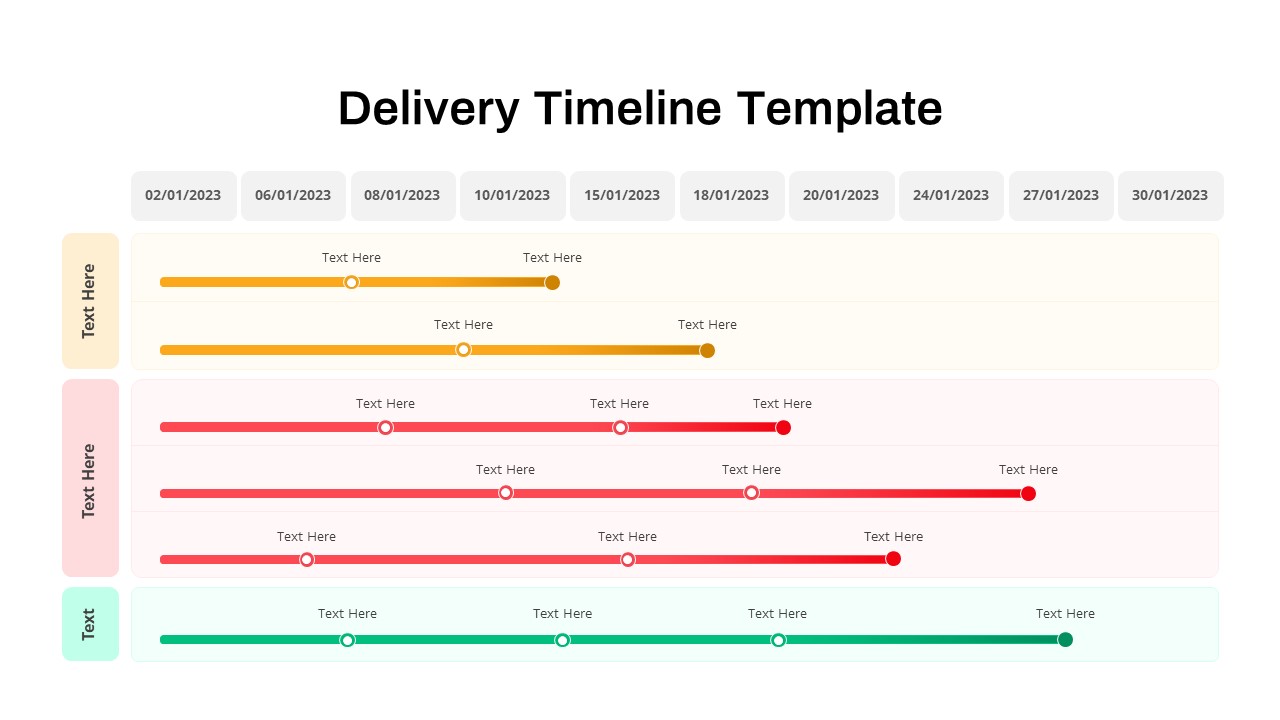
Delivery Timeline PowerPoint Template
Timeline
Cost Comparison PowerPoint Template
Comparison
Multi-Phase Research Roadmap Infographic Template for PowerPoint & Google Slides
Roadmap
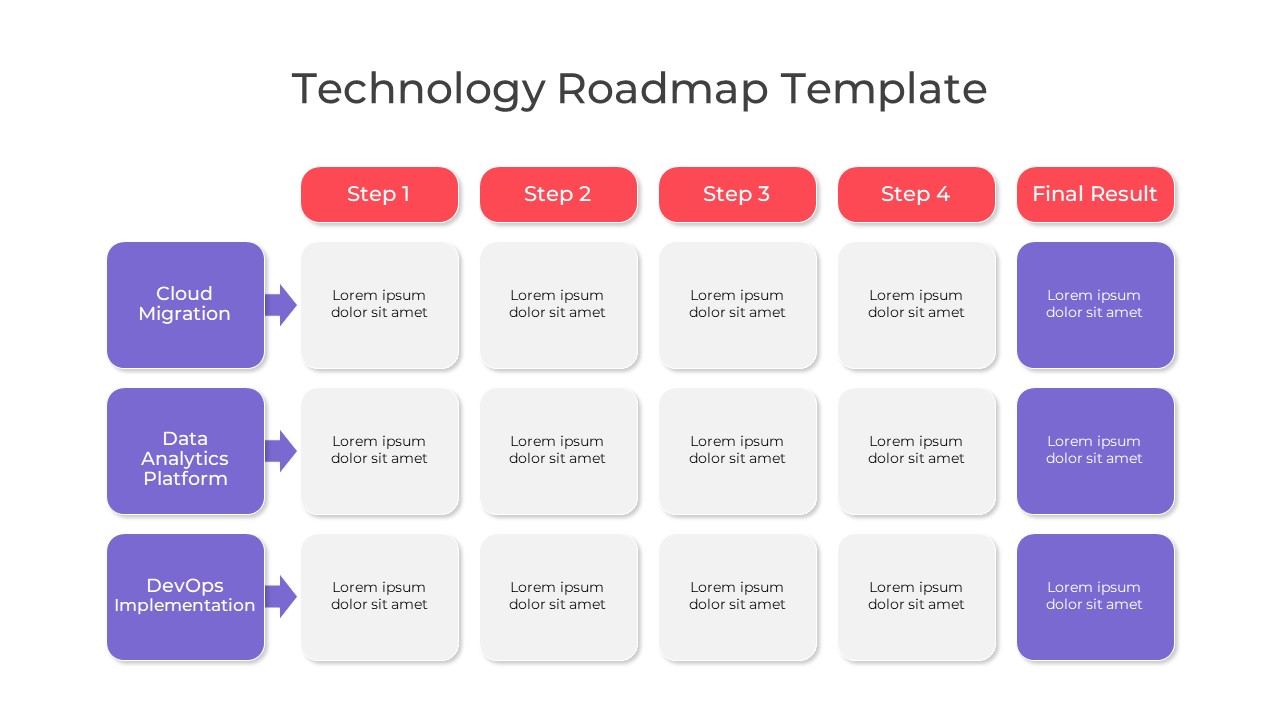
Technology Roadmap PowerPoint Template
Roadmap
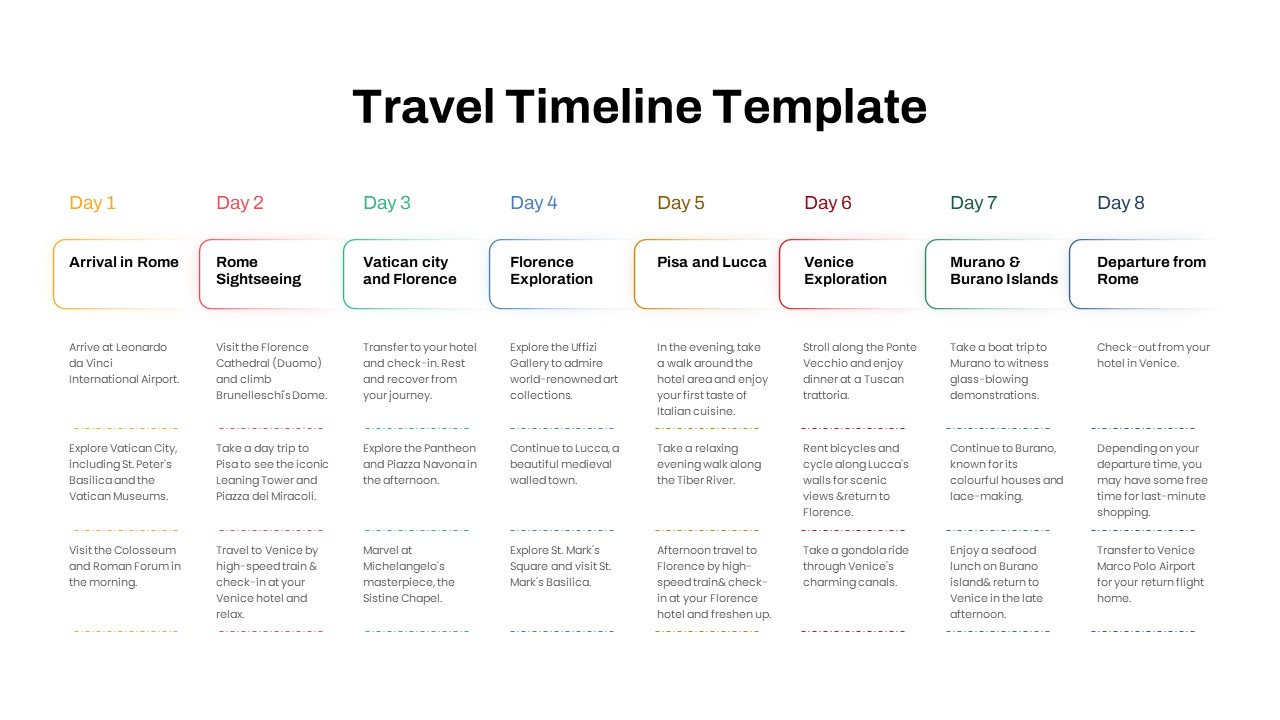
Free Elegant Multi-Day Travel Timeline Template for PowerPoint & Google Slides
Timeline
Free
Free Multi-Step Funnel Infographic Slide Pack Template for PowerPoint & Google Slides
Funnel
Free
Free Table Of Contents PowerPoint Slides Template
Agenda
Free
Colorful Multi-Branch Mind Map Slide Template for PowerPoint & Google Slides
Mind Maps
Multi-color Curved Timeline Roadmap Template for PowerPoint & Google Slides
Timeline
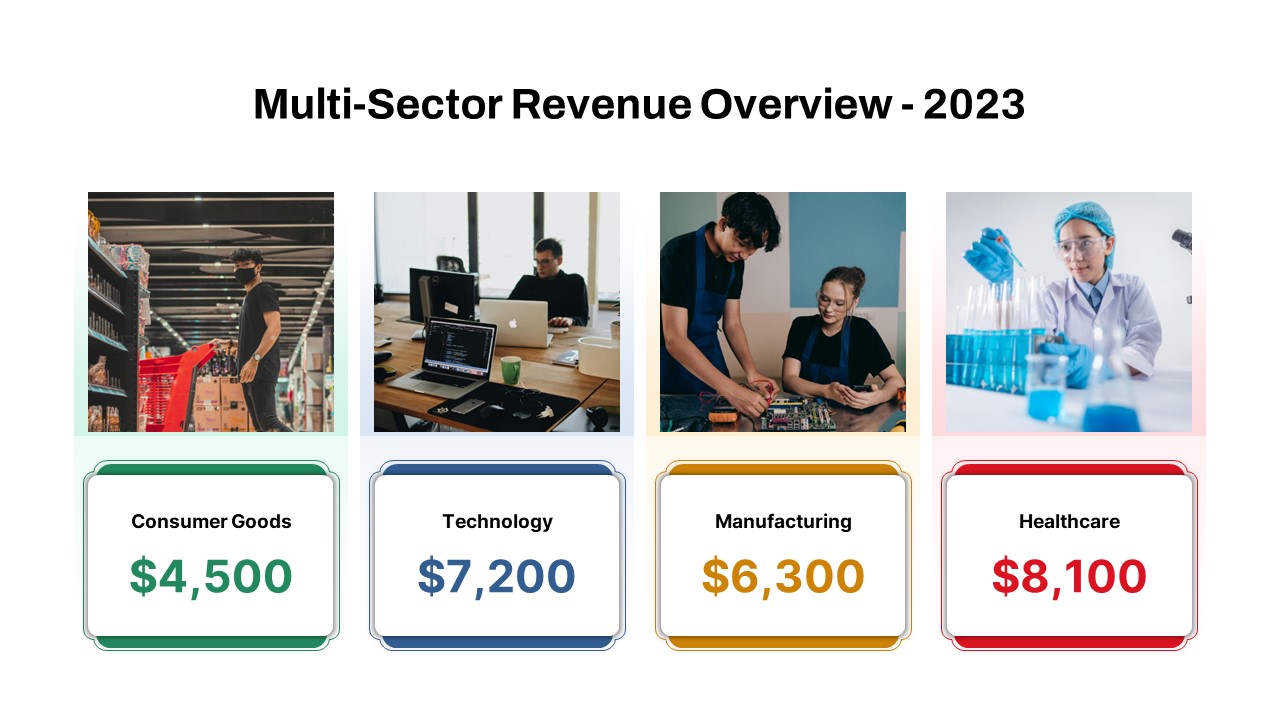
Multi-Sector Revenue Breakdown Cards Template for PowerPoint & Google Slides
Comparison
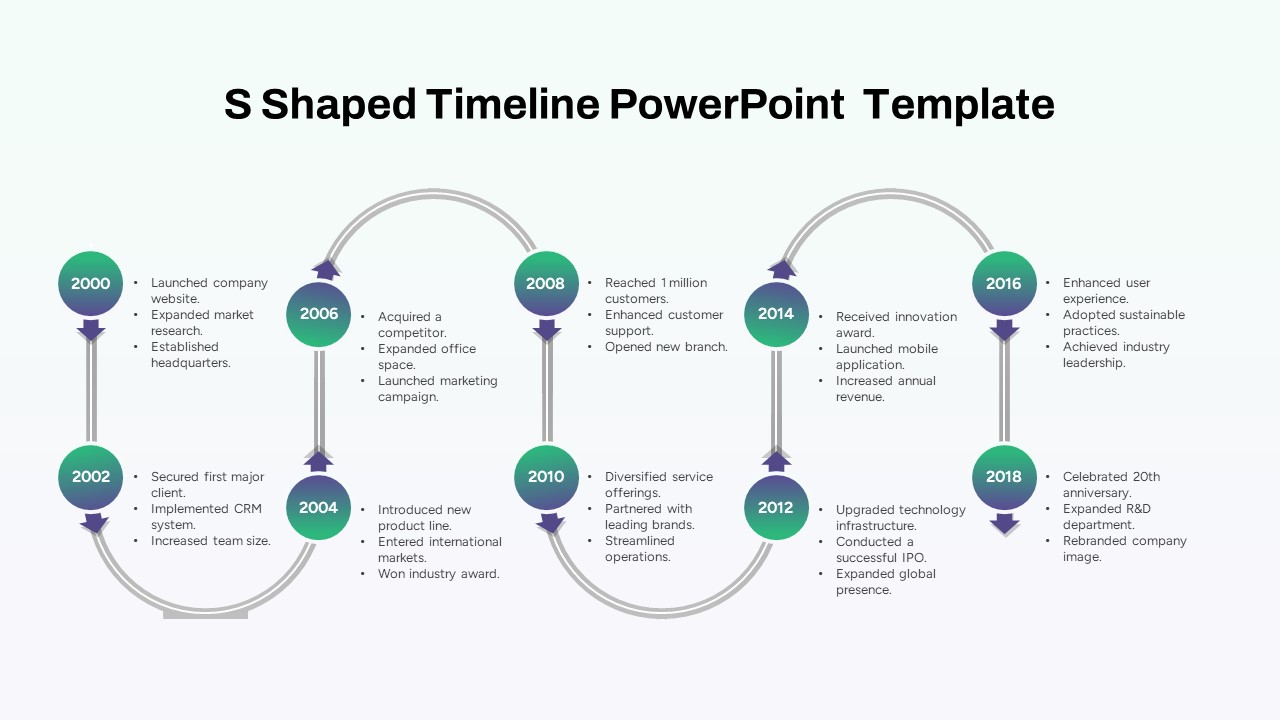
Multi-Year S-Shaped Roadmap Timeline Template for PowerPoint & Google Slides
Timeline
Multi-Style Board of Directors Profile Template for PowerPoint & Google Slides
Our Team
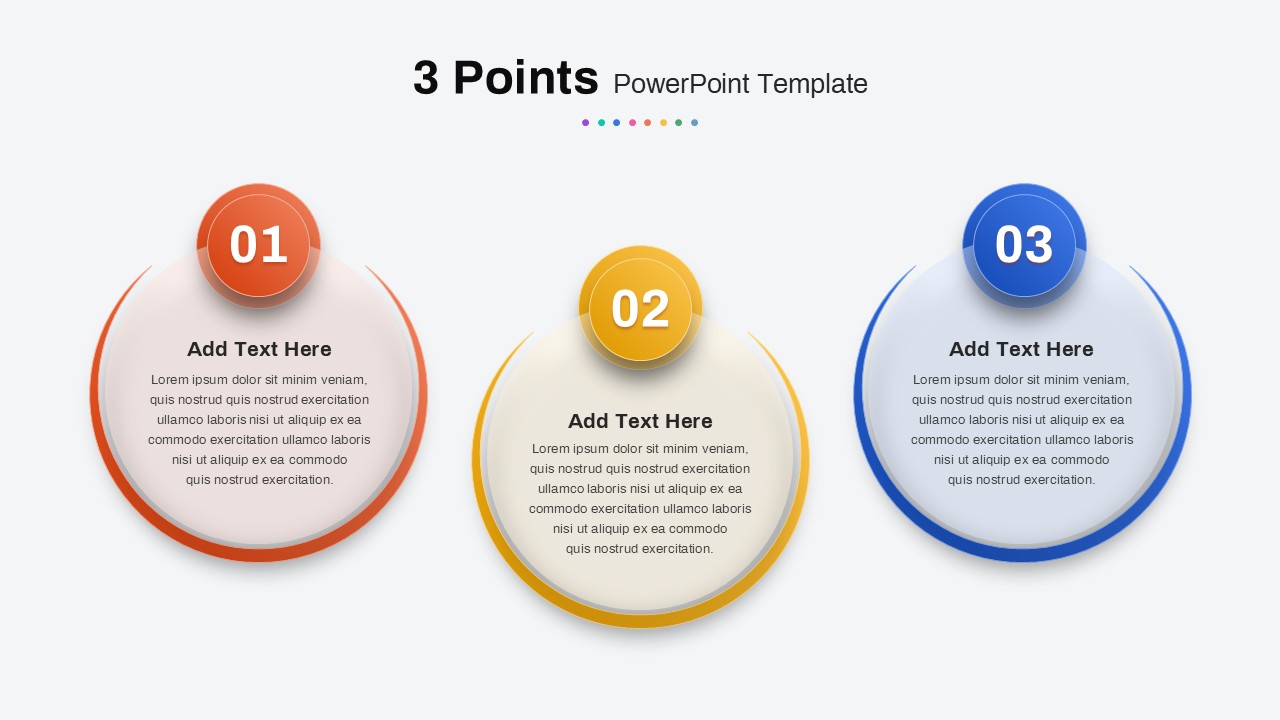
Multi-Point Diagram Presentation Template for PowerPoint & Google Slides
Process
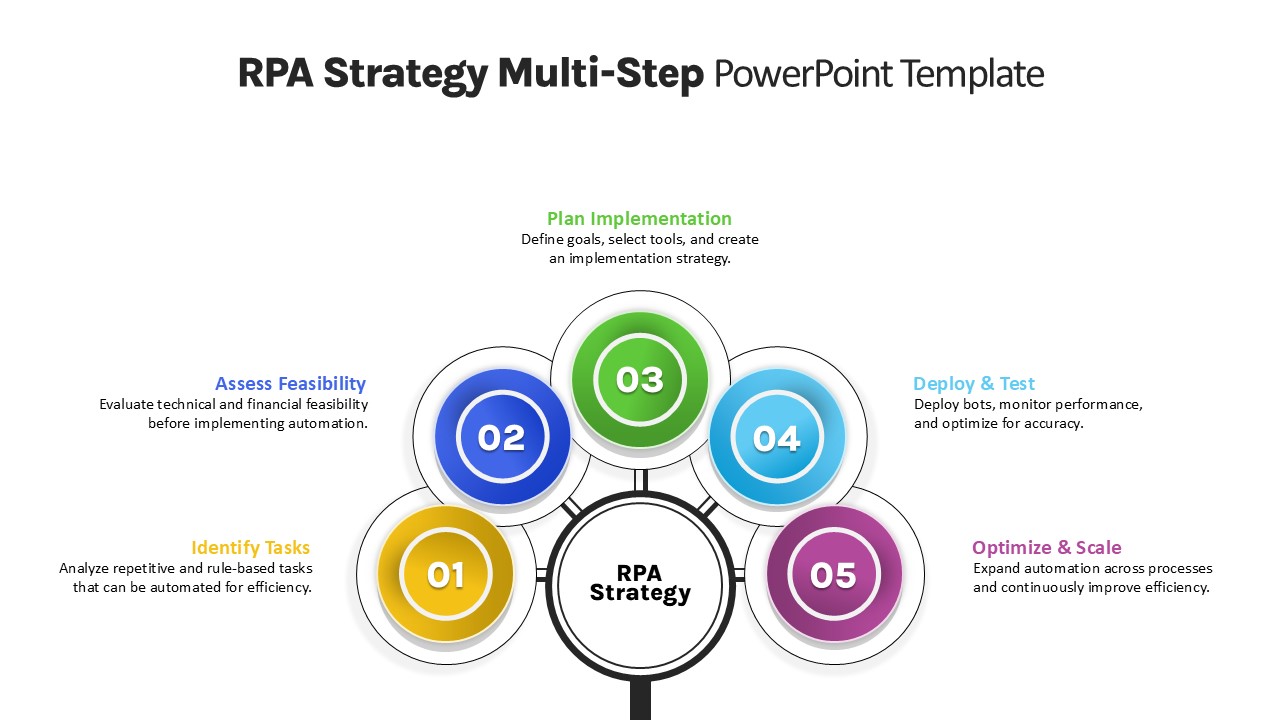
RPA Strategy Multi-Step Diagram Template for PowerPoint & Google Slides
Process
Animated Multi-Milestone Roadmap Template for PowerPoint & Google Slides
Roadmap
Multi-Column Table Presentation Template for PowerPoint & Google Slides
Table
Six-Row Multi-Column Table Presentation Template for PowerPoint & Google Slides
Table
Multi Color SWOT Analysis Quadrant Template for PowerPoint & Google Slides
SWOT
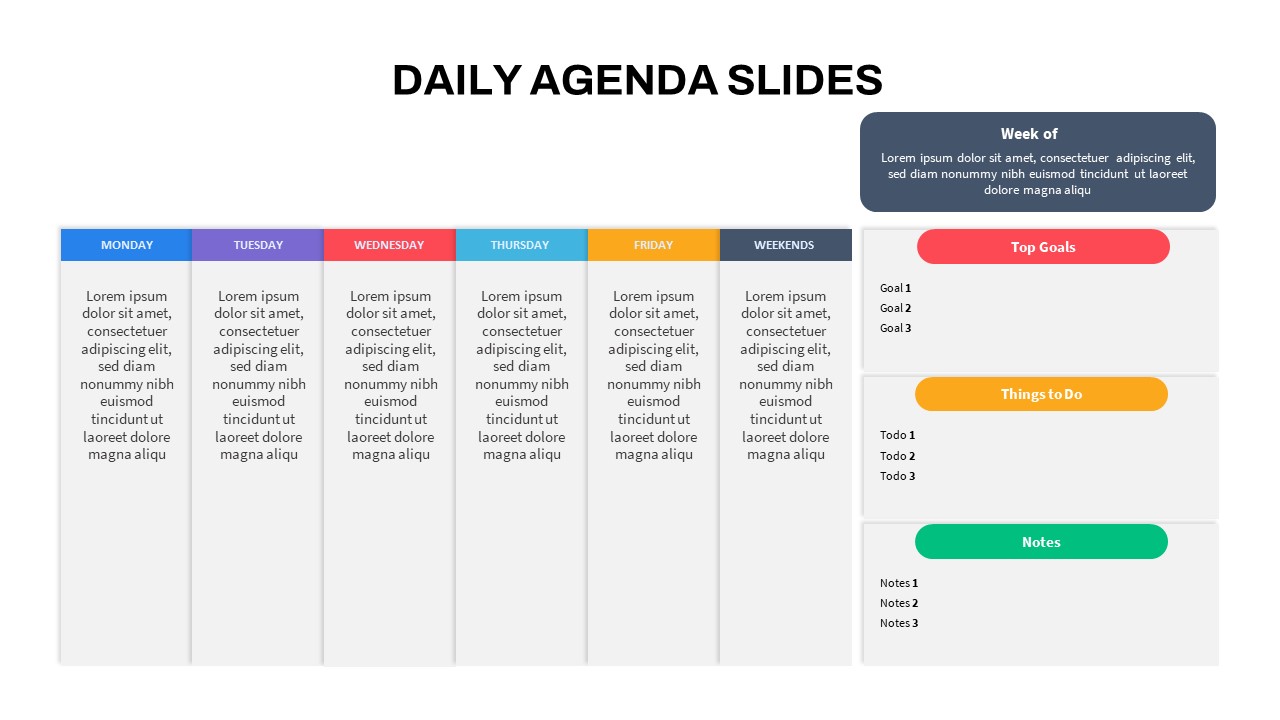
Editable Colorful Daily Agenda Slides Template for PowerPoint & Google Slides
Agenda
Line Graph Analysis template for PowerPoint & Google Slides
Charts
Sales Growth Dashboard: KPI Gauge & Line Template for PowerPoint & Google Slides
Revenue

Creative Clothing Line Presentation Template for PowerPoint & Google Slides
Pitch Deck
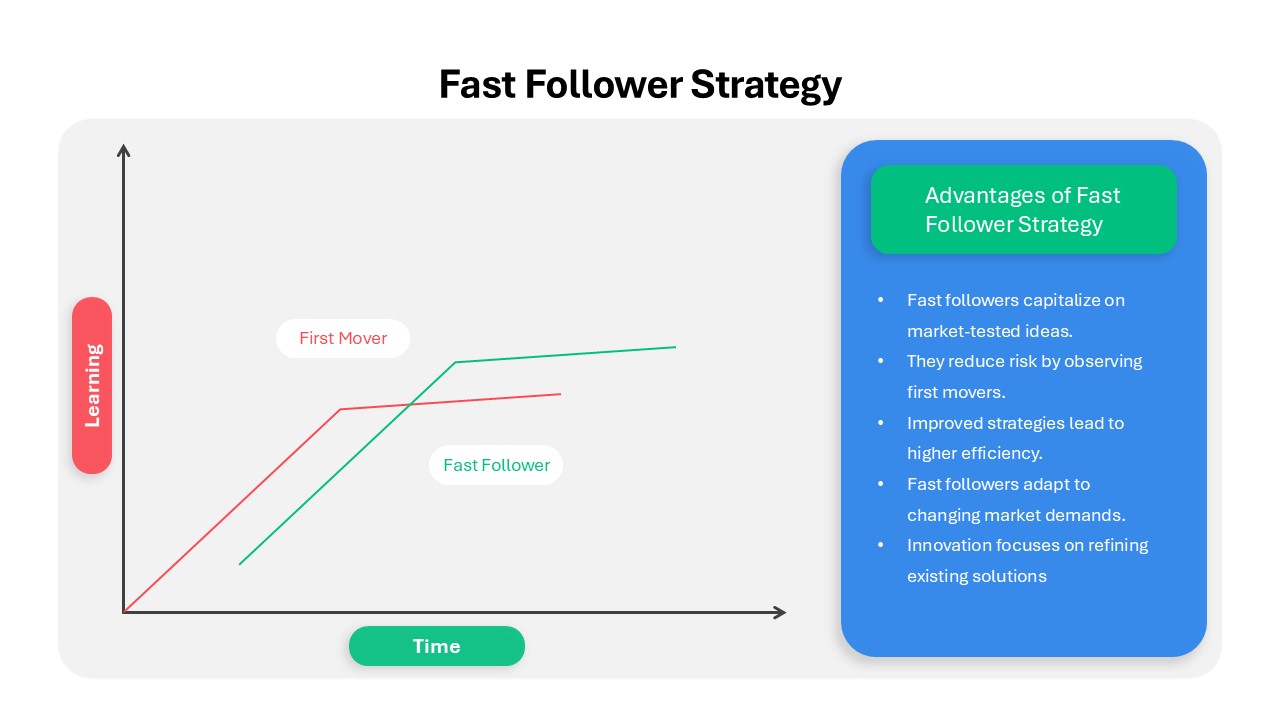
Fast Follower Strategy Line Graph Template for PowerPoint & Google Slides
Comparison Chart
3Ps Triple Bottom Line Venn Diagram Template for PowerPoint & Google Slides
Circular
4 People Racing to Finish Line Template for PowerPoint & Google Slides
Accomplishment
Curved Line Graph for PowerPoint & Google Slides
Timeline
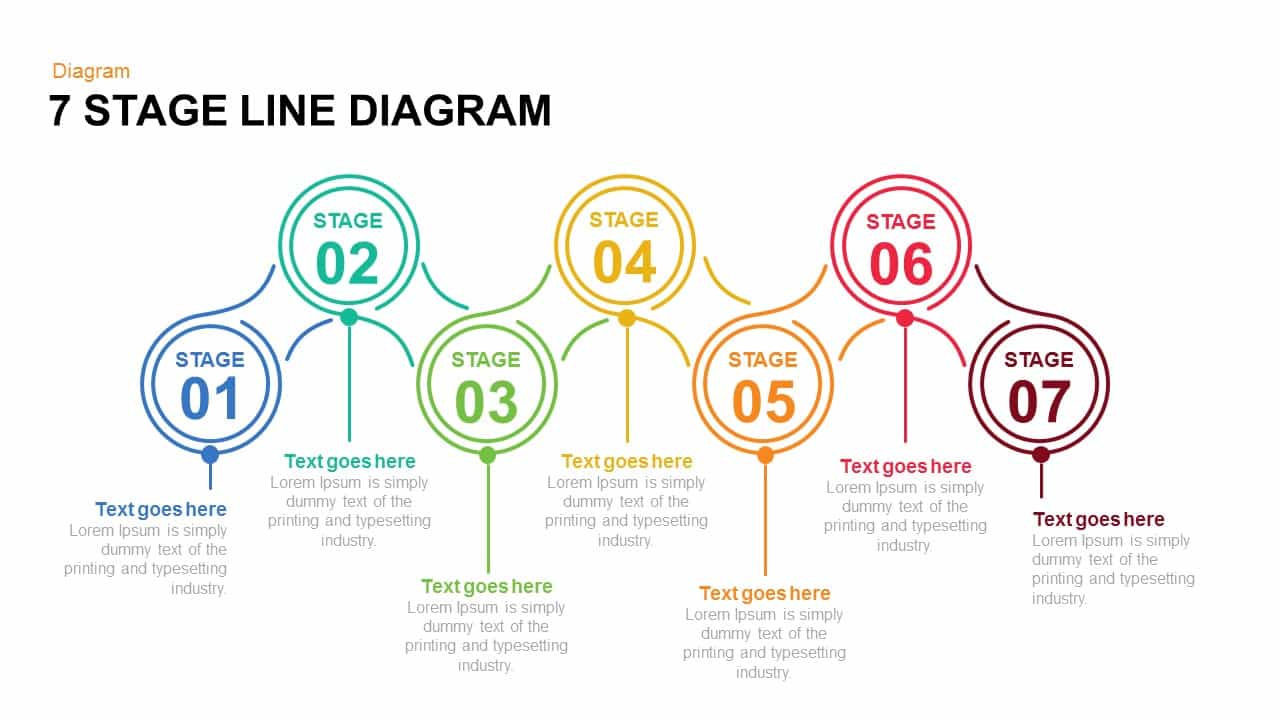
7 and 6 Stage Line Diagram Overview for PowerPoint & Google Slides
Infographics
Five and Six Step Line Linear Stage Diagram for PowerPoint & Google Slides
Infographics
Editable Colombia Map PowerPoint Template for PowerPoint & Google Slides
Business Models
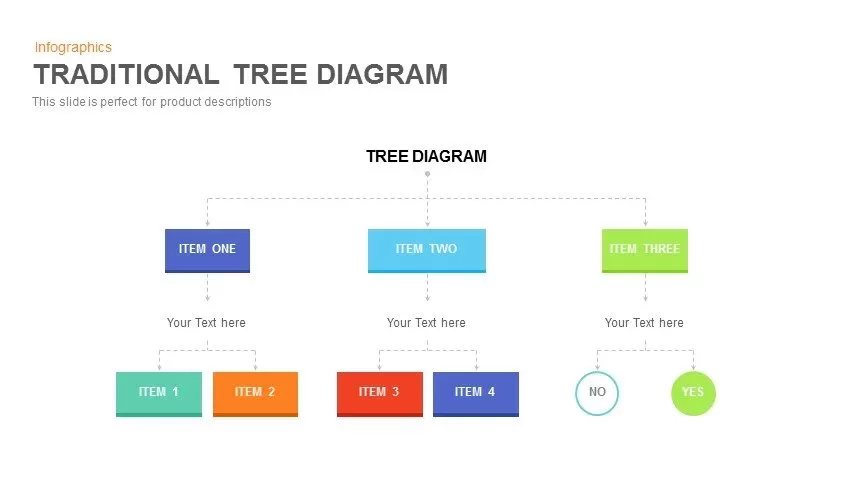
Editable Hierarchical Tree Diagram Template for PowerPoint & Google Slides
Decision Tree
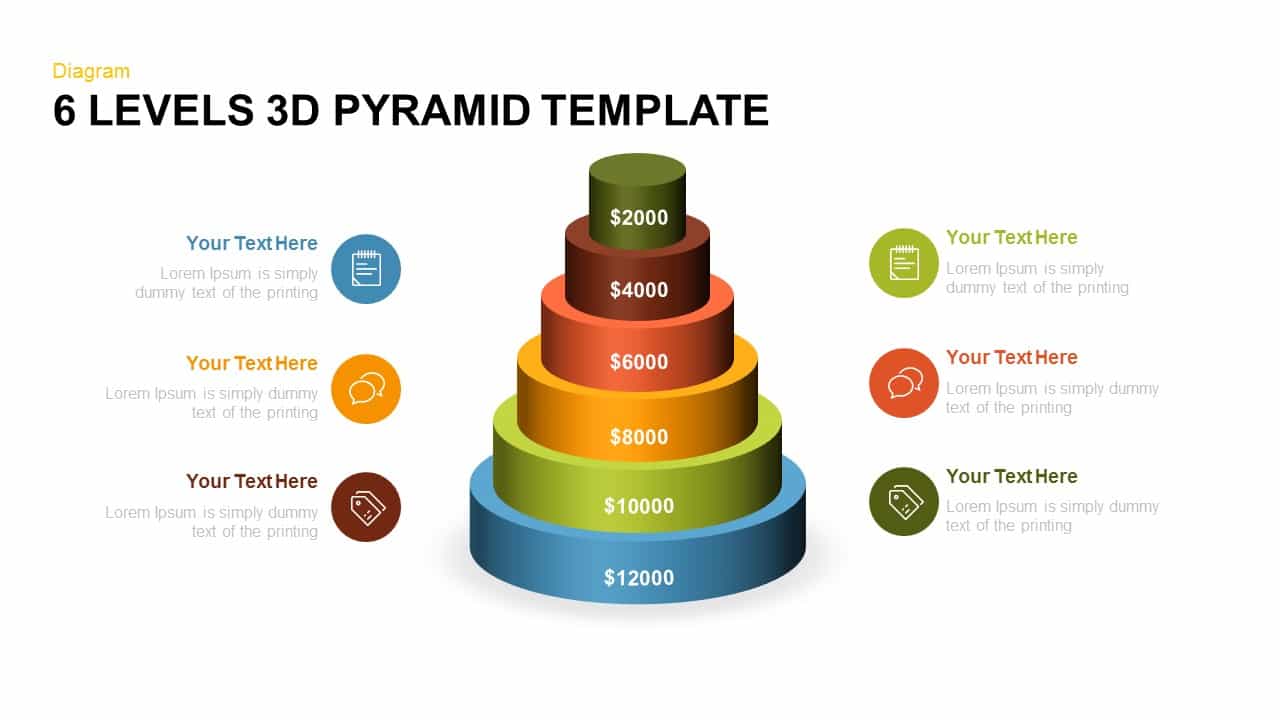
Editable Six-Level 3D Pyramid Diagram Template for PowerPoint & Google Slides
Pyramid
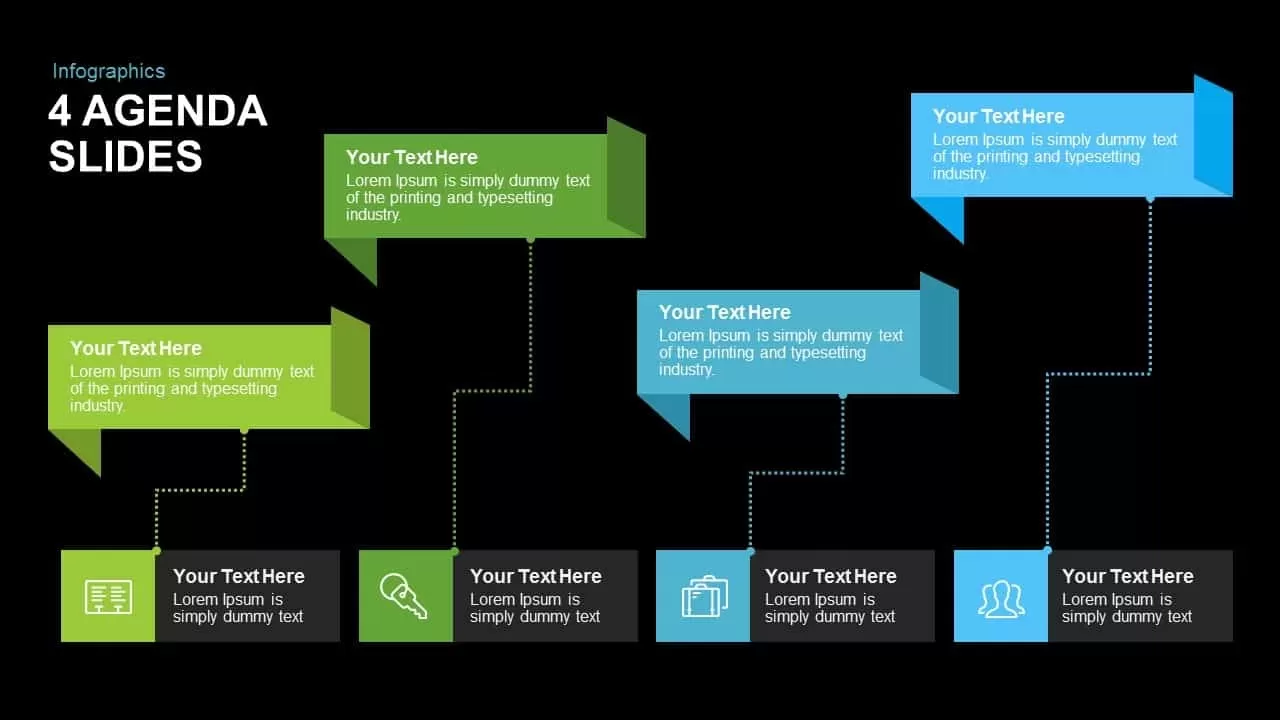
Editable Four-Point Timeline Agenda Template for PowerPoint & Google Slides
Agenda
Free Check Box PowerPoint Presentation Template
Infographics
Free
Fully Editable World Map Infographic Template for PowerPoint & Google Slides
World Maps
Free Editable Saudi Arabia Map Template for PowerPoint & Google Slides
World Maps
Editable Africa Map Infographic Data Template for PowerPoint & Google Slides
World Maps
Free Family Tree PowerPoint Template
Org Chart
Free
Editable 3D Spiral Strategy Diagram Template for PowerPoint & Google Slides
Process