Free Professional Gantt Chart Pack – 4 Slides Template for PowerPoint & Google Slides


Description
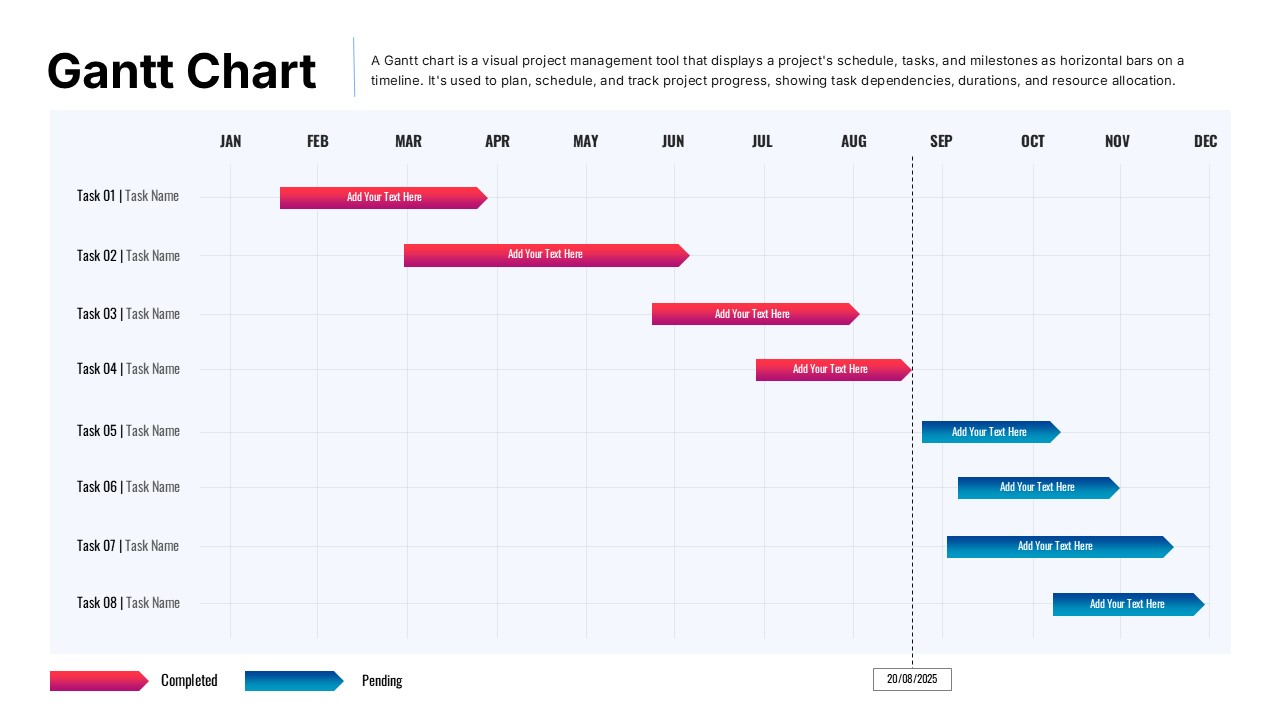
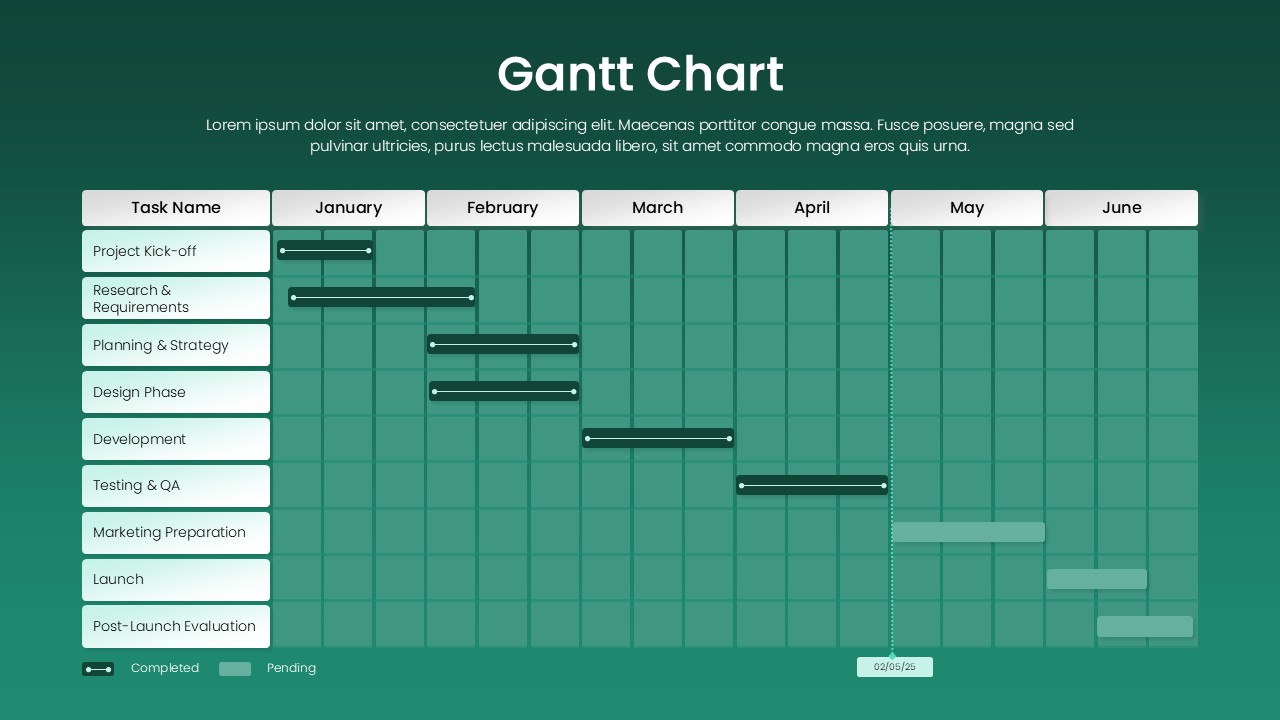
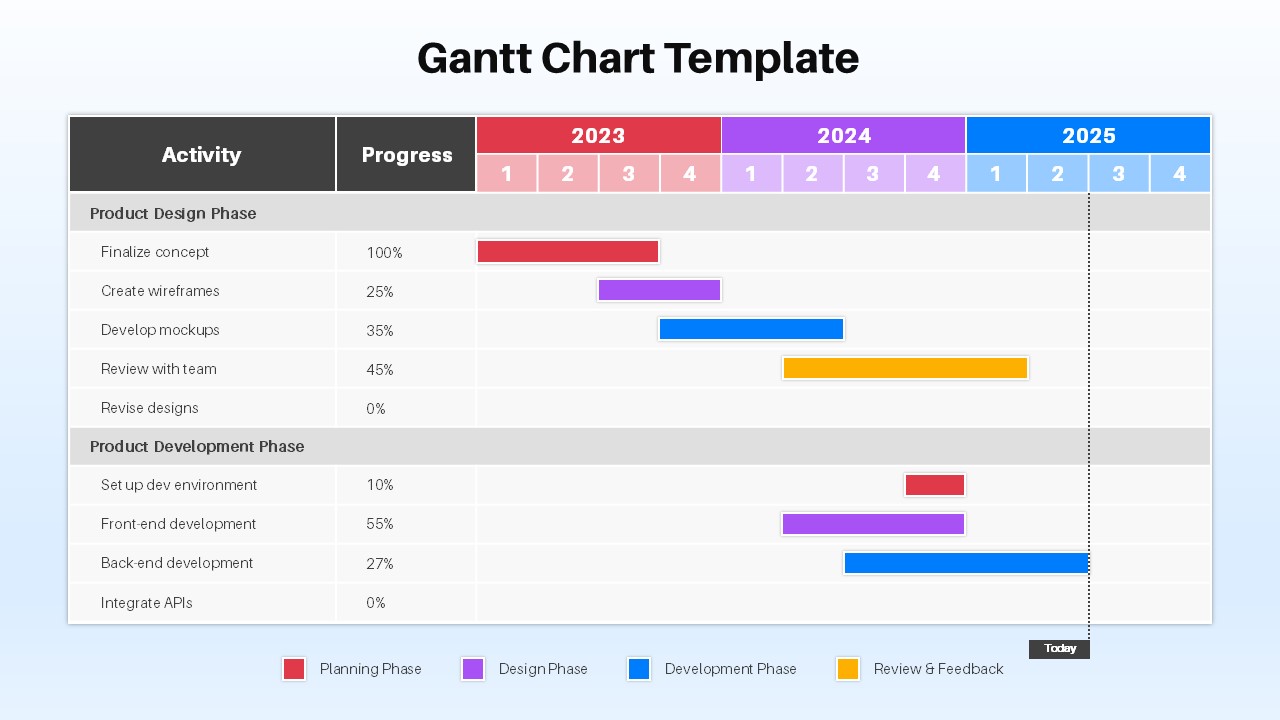
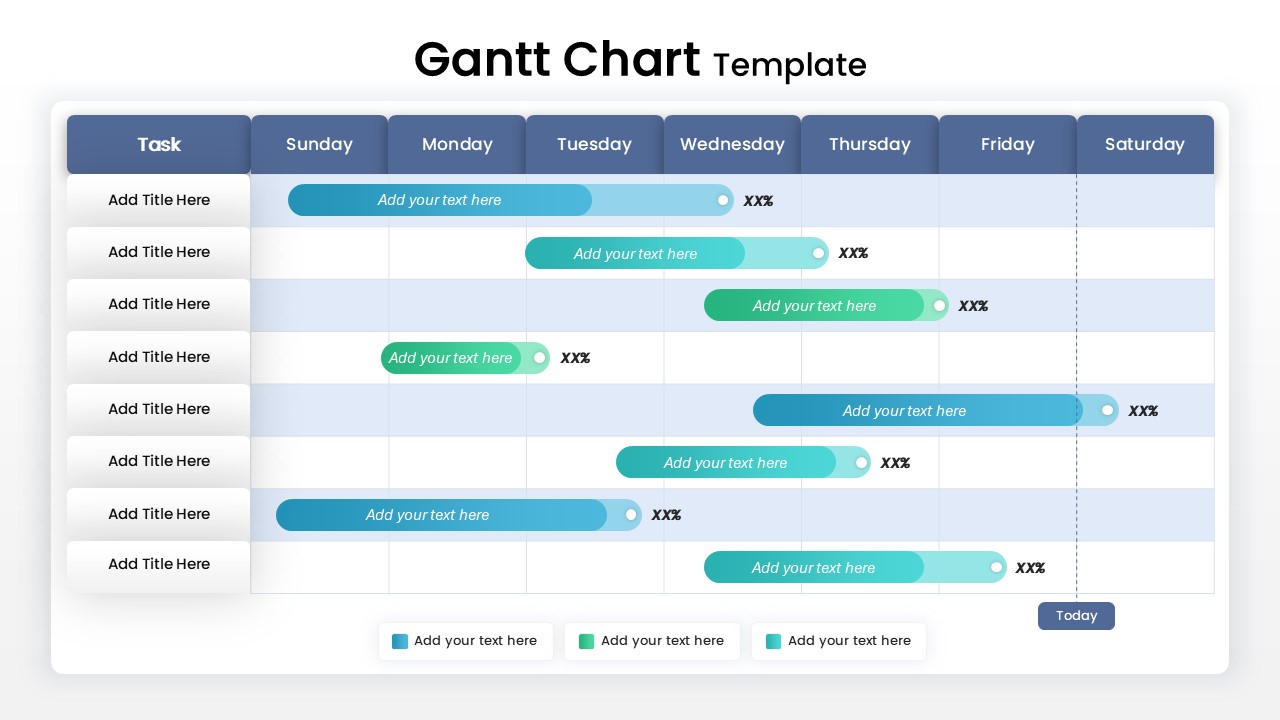
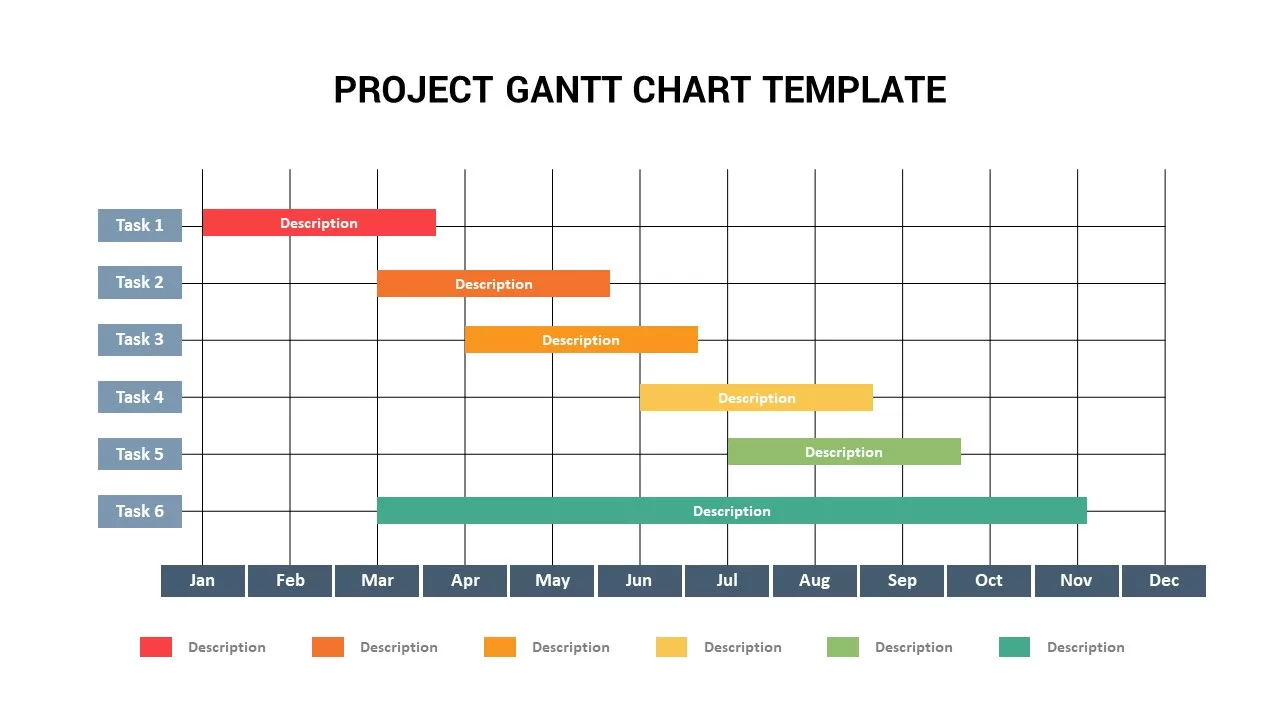
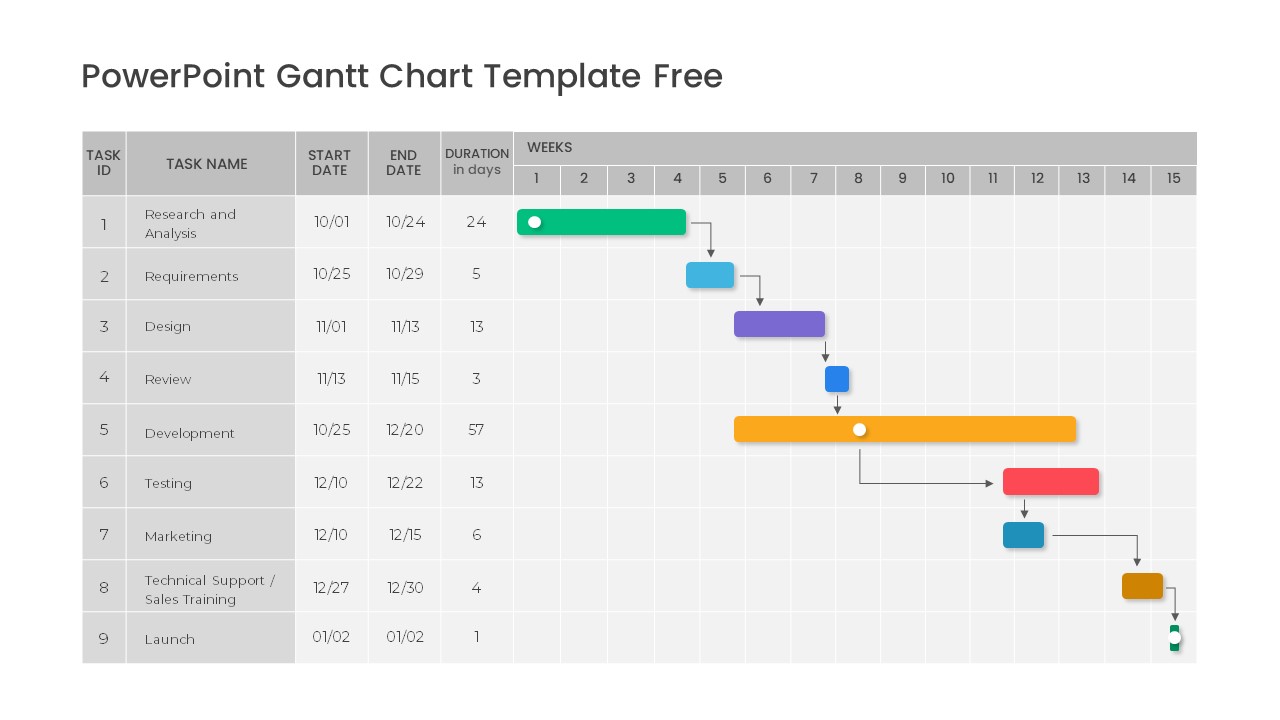
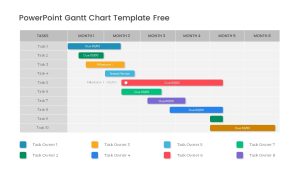
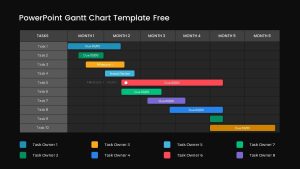
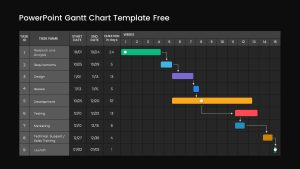
Streamline project planning with this four-slide Gantt chart pack featuring diverse timeline layouts and customizable color-coded bars. Slide one offers a six-month horizontal timeline with task rows and “Due” call-outs, paired with a legend for up to eight task owners. Slide two introduces a detailed weekly view: a left-aligned table lists Task ID, name, start/end dates, and duration, while the right side displays colored bars, milestone markers, and dependency arrows. The remaining two slides present alternative visuals—one focusing on milestone-only layouts with date markers and the other on baseline vs. actual comparison bars—each fully editable via master slides. All shapes, dates, and task labels are drag-and-drop; theme colors, fonts, and grid intervals can be adjusted in seconds. Optimized for PowerPoint and Google Slides, this pack preserves crisp resolution across devices and removes formatting headaches, so you can concentrate on delivering clear, professional project timelines.
Login to download this file

Item ID
SB03874
Related Templates

Quad Chart Infographic Pack of 8 Slides Template for PowerPoint & Google Slides
Comparison Chart
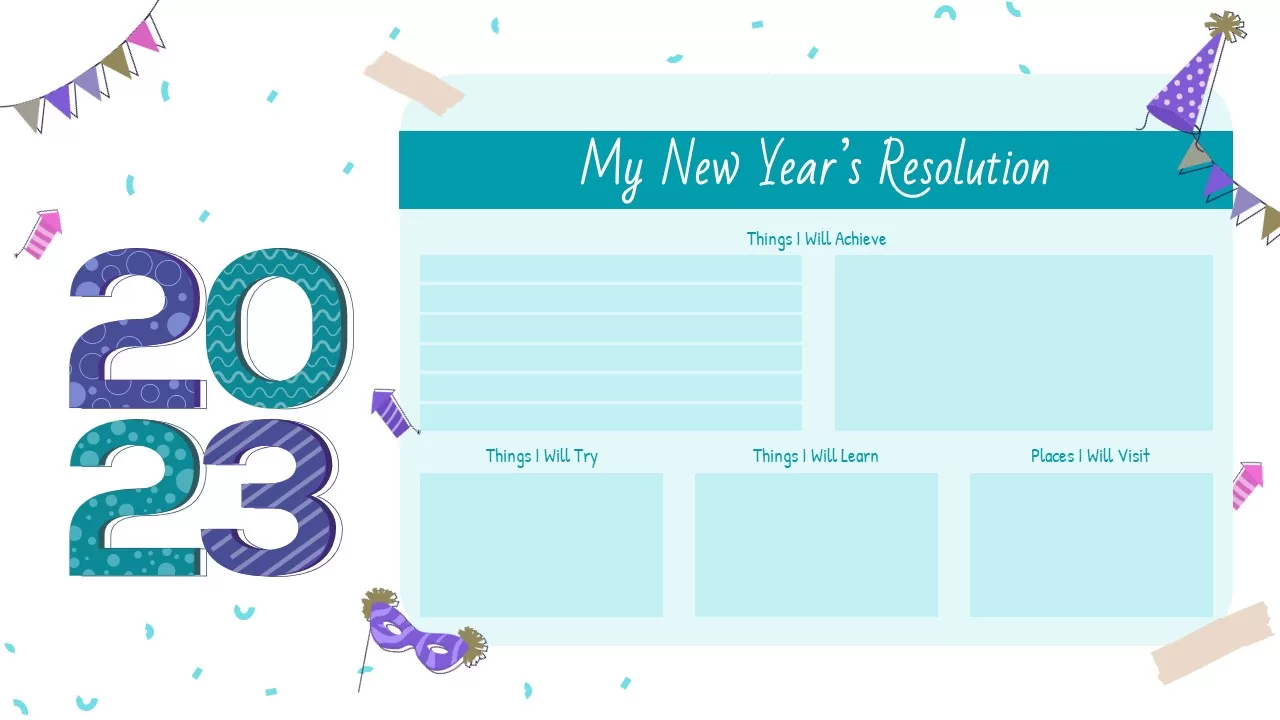
Free New Year’s Resolution Slides Pack for PowerPoint & Google Slides 2023
Graphics
Free
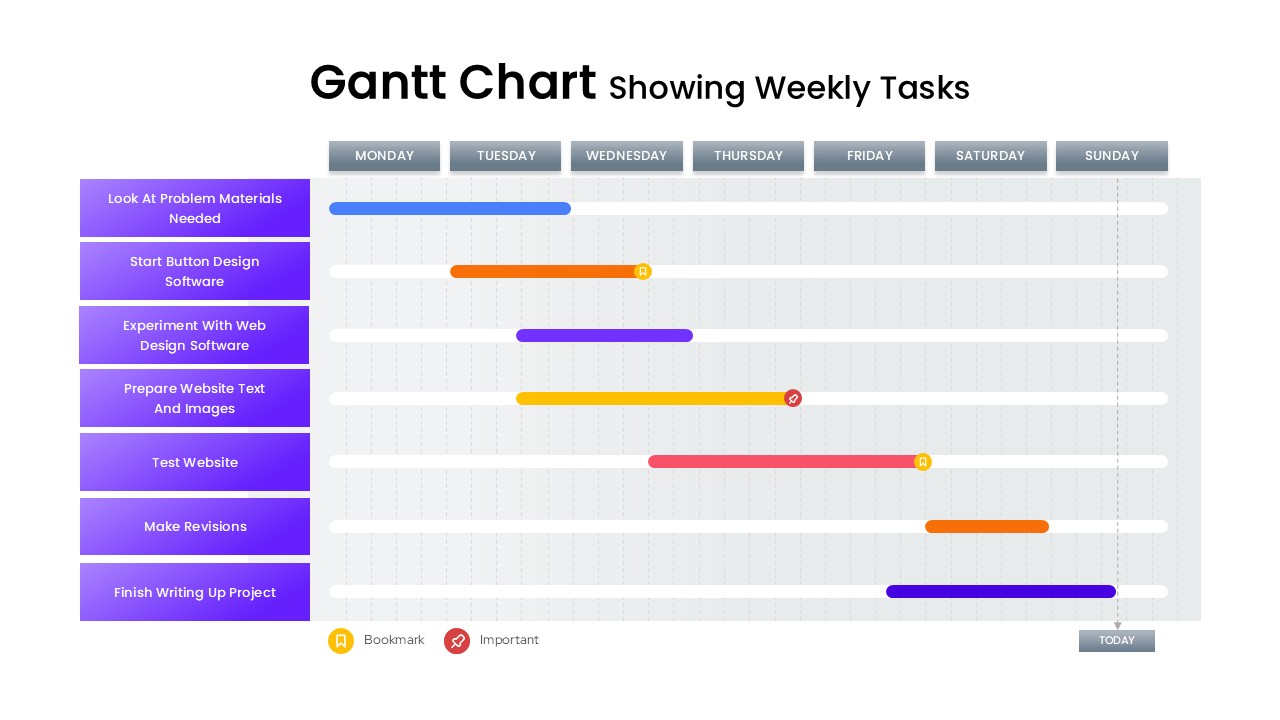
Gantt Chart Template Showing Weekly Tasks Template for PowerPoint & Google Slides
Gantt Chart

Free Infographic Deck PowerPoint Pack for PowerPoint & Google Slides
Infographics
Free
Creative Dynamic Gantt Chart Timeline Template for PowerPoint & Google Slides
Timeline

Fully Editable Gantt Chart Timeline template for PowerPoint & Google Slides
Gantt Chart

Product Roadmap Gantt Chart Timeline template for PowerPoint & Google Slides
Gantt Chart
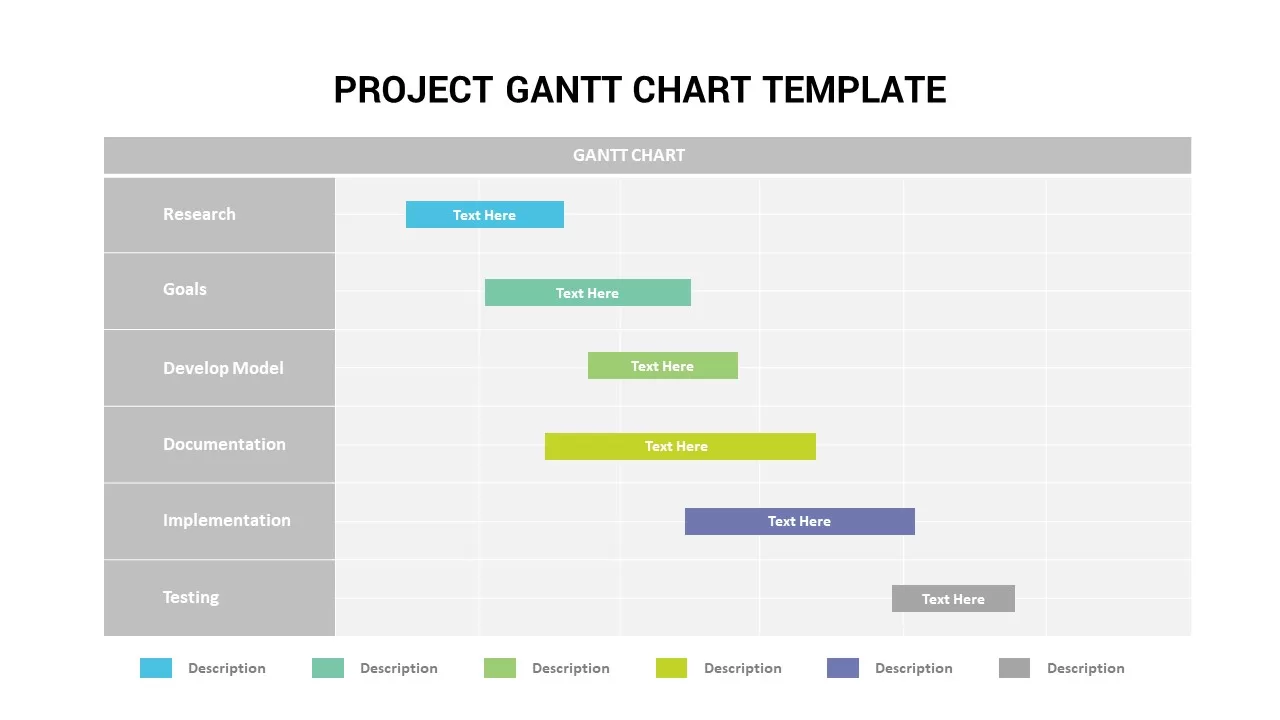
Project Gantt Chart template for PowerPoint & Google Slides
Gantt Chart
Interactive Project Gantt Chart Timeline Template for PowerPoint & Google Slides
Gantt Chart
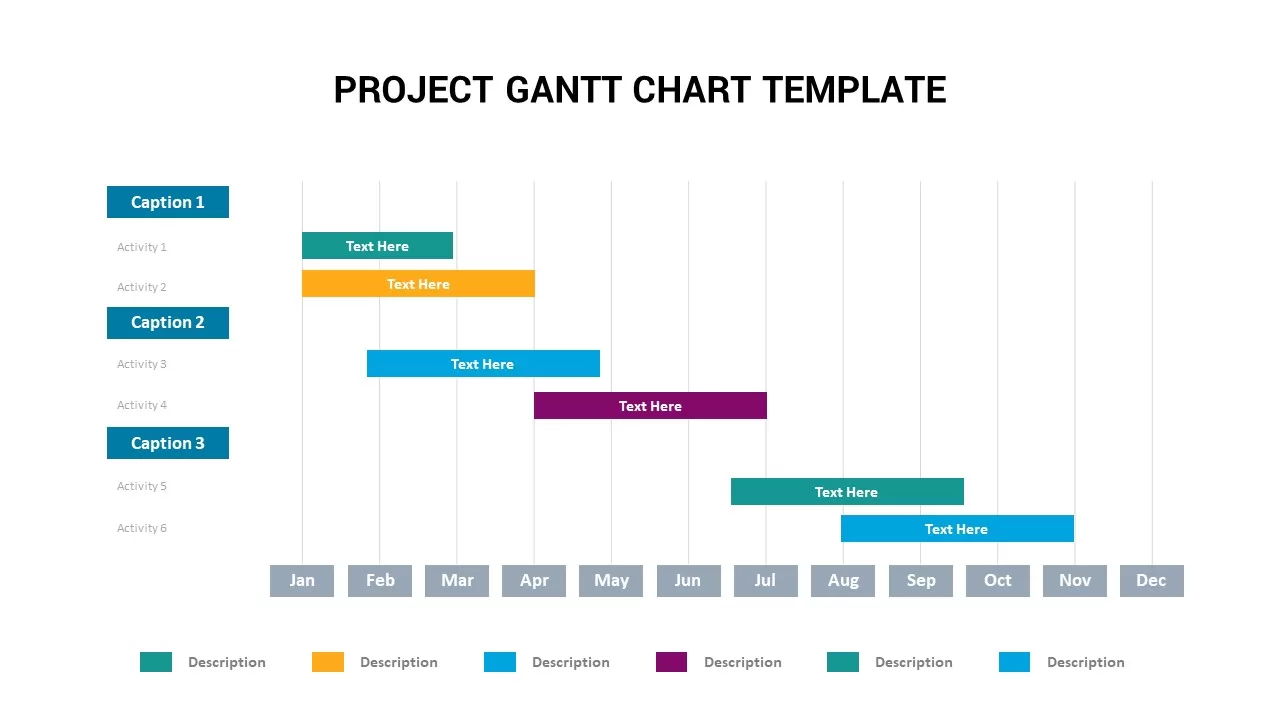
Project Gantt Chart Template for PowerPoint & Google Slides
Gantt Chart
Overlapping Timeline Gantt Chart Diagram Template for PowerPoint & Google Slides
Timeline
Project Tracker Timeline Gantt Chart Template for PowerPoint & Google Slides
Project Status
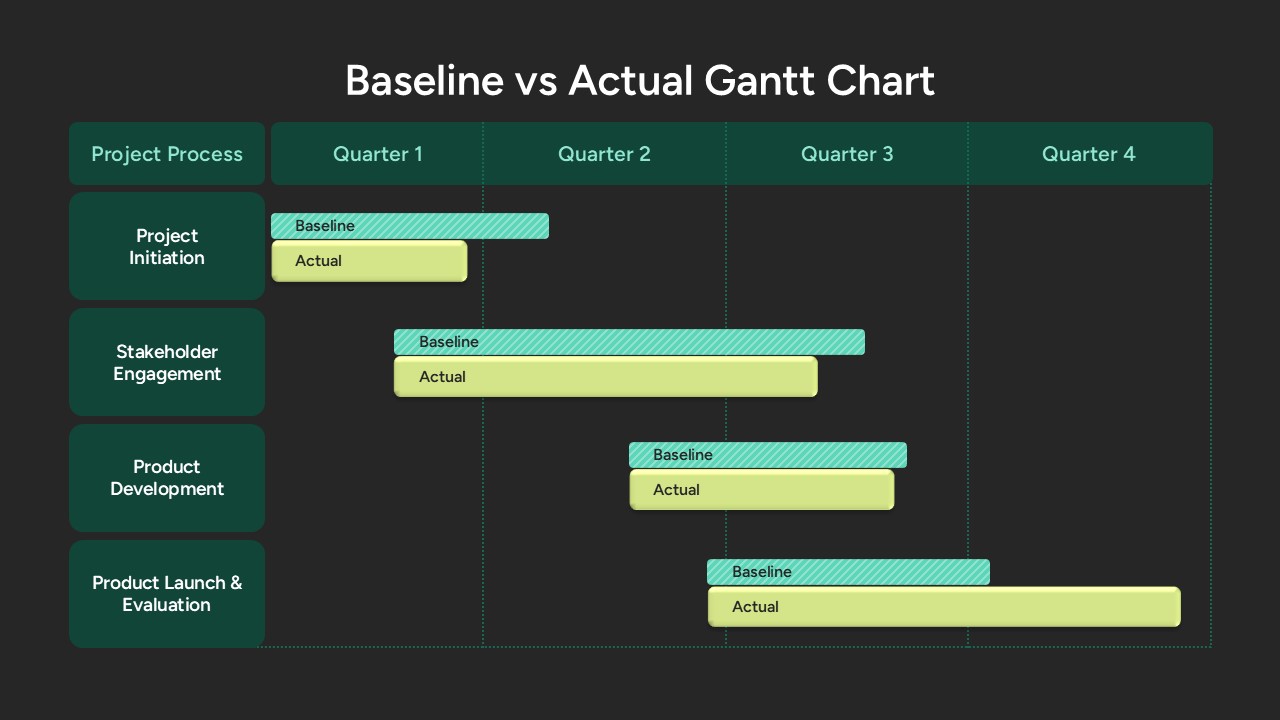
Baseline vs Actual Gantt Chart Template for PowerPoint & Google Slides
Gantt Chart
Weekly Gantt Chart Project Timeline Template for PowerPoint & Google Slides
Gantt Chart
Event Planning Gantt Chart template for PowerPoint & Google Slides
Business
Color-Coded Gantt Chart template for PowerPoint & Google Slides
Business
Team Gantt Chart Overview template for PowerPoint & Google Slides
Project Status
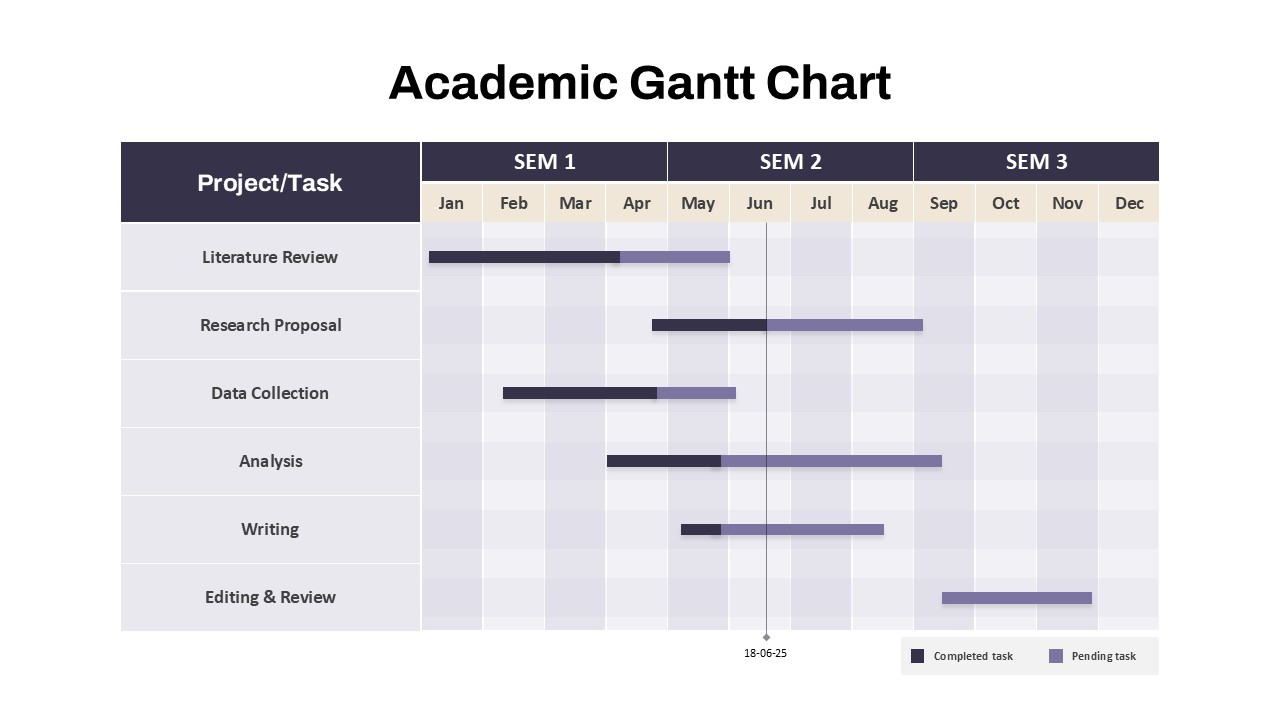
Academic Gantt Chart template for PowerPoint & Google Slides
Business
Stacked Gantt Chart Timeline Slide Template for PowerPoint & Google Slides
Gantt Chart
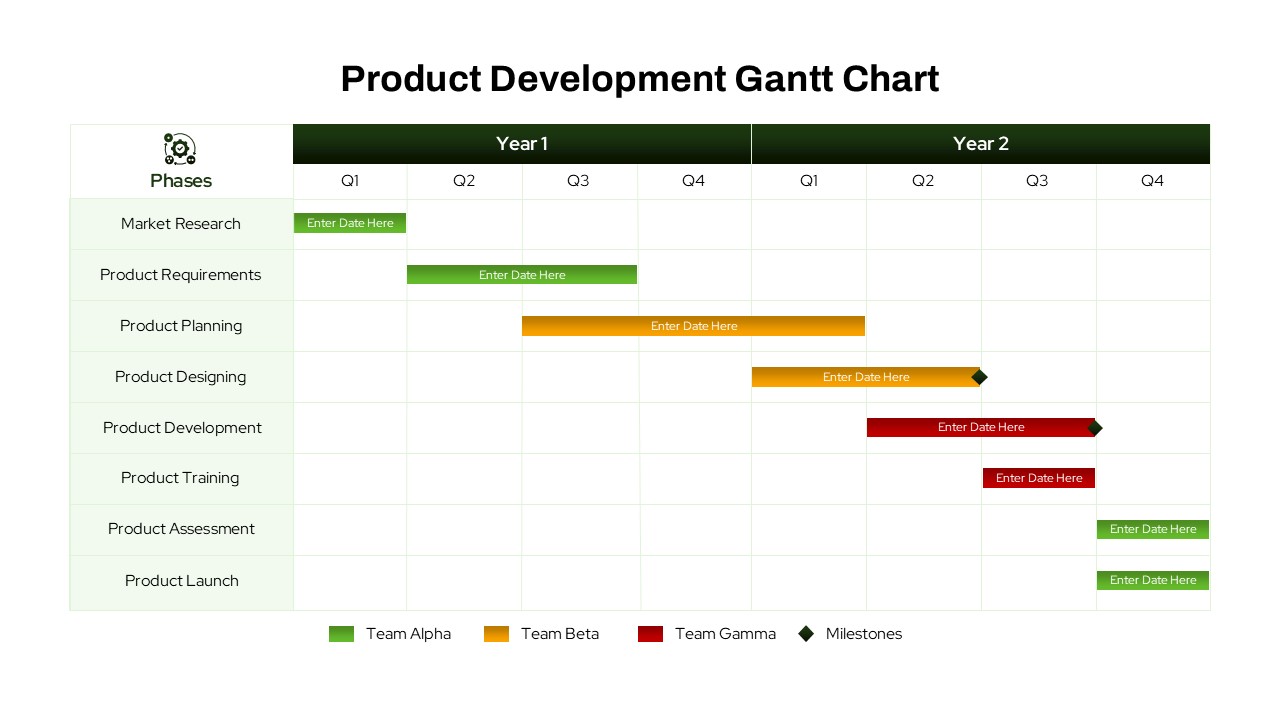
Product Development Gantt Chart template for PowerPoint & Google Slides
Gantt Chart
Static Gantt Chart Overview template for PowerPoint & Google Slides
Project Status
Bar Gantt Chart Template for PowerPoint & Google Slides
Gantt Chart
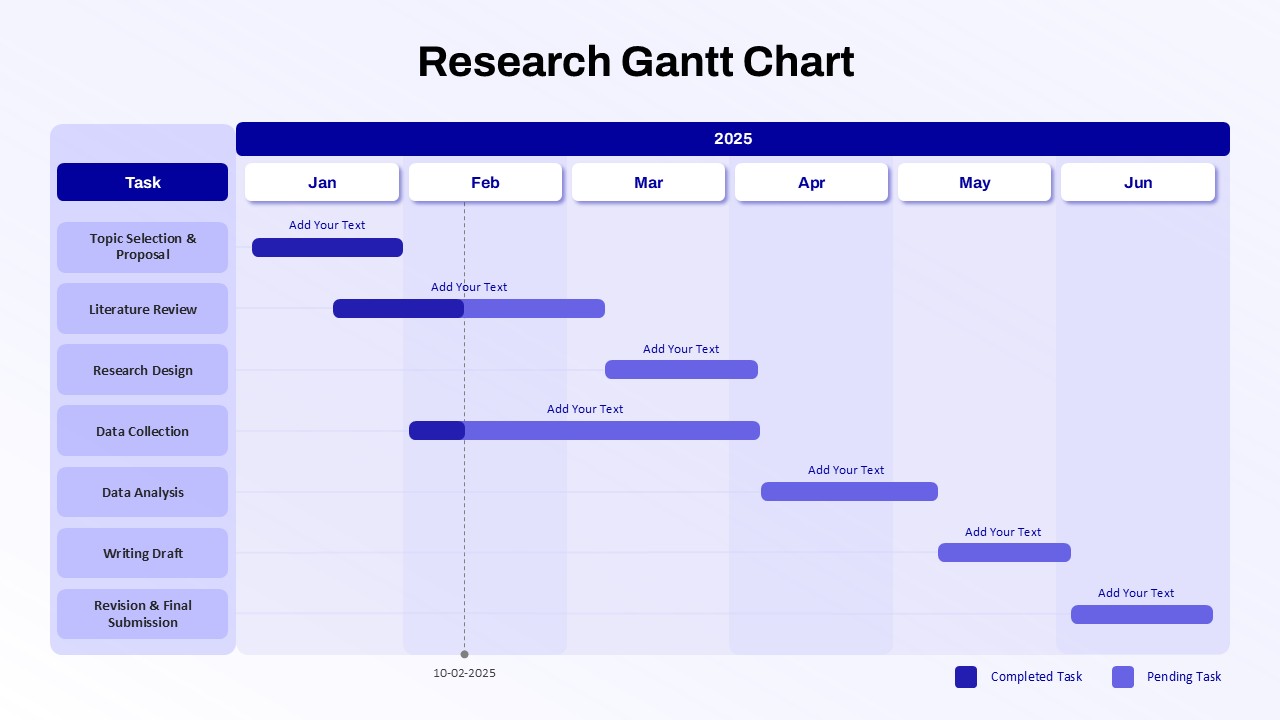
Research Gantt Chart template for PowerPoint & Google Slides
Project
Project Gantt Chart Template for PowerPoint & Google Slides
Gantt Chart
Green Gantt Chart Template for PowerPoint & Google Slides
Gantt Chart
Project Timeline Gantt Chart Template for PowerPoint & Google Slides
Gantt Chart
Colorful Annual Gantt Chart Project Planner Template for PowerPoint & Google Slides
Gantt Chart
Weekly Gantt Chart with Milestones Template for PowerPoint & Google Slides
Gantt Chart
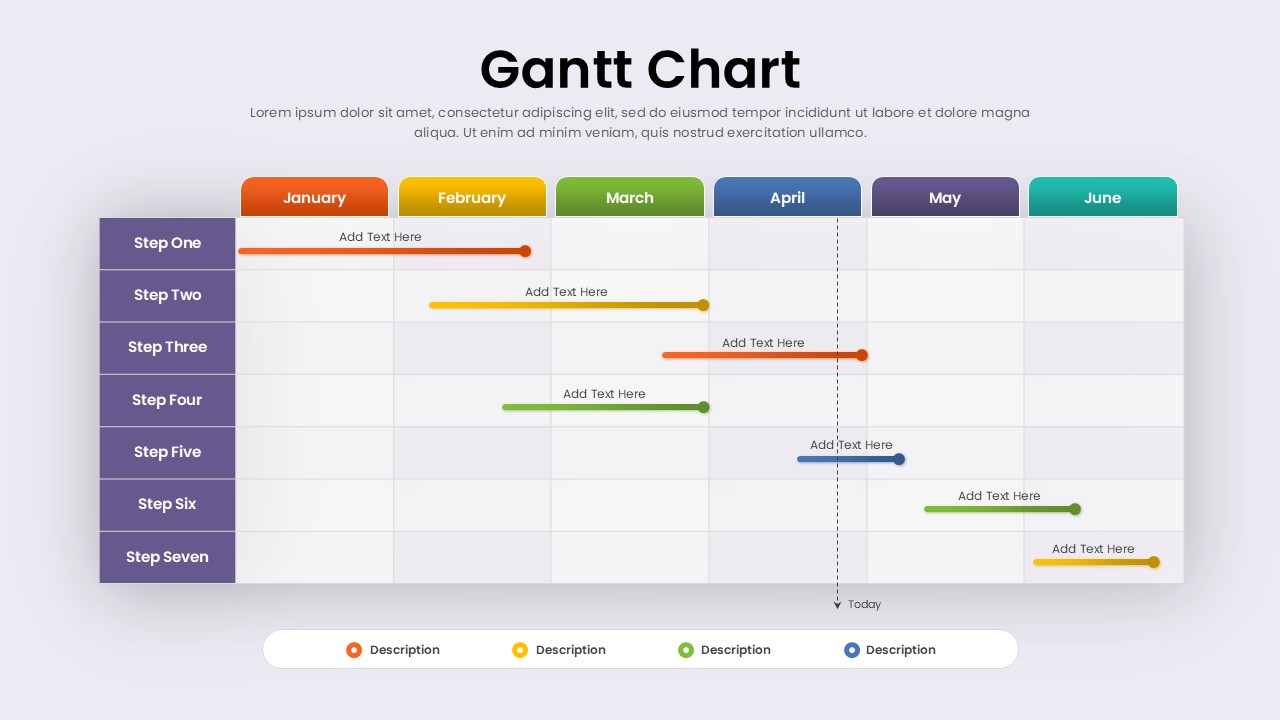
7 Step 6 Month Gantt Chart Timeline Template for PowerPoint & Google Slides
Gantt Chart
Yearly Gantt Chart with Presentation Template for PowerPoint & Google Slides
Gantt Chart
Quarterly Gantt Chart with Today Marker Template for PowerPoint & Google Slides
Gantt Chart
Colorful Annual Gantt Chart Timeline Template for PowerPoint & Google Slides
Gantt Chart

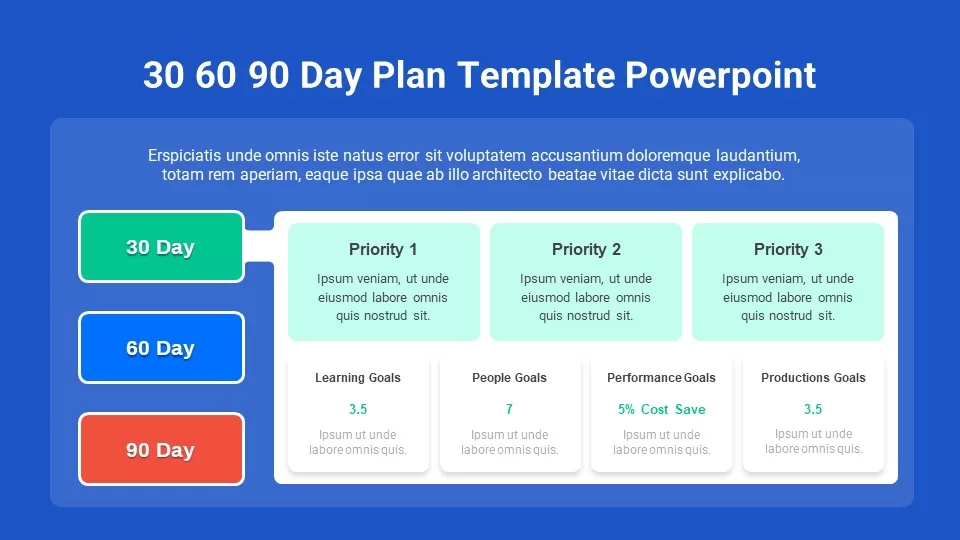
Free 30-60-90 Day Plan Slide Pack Template for PowerPoint & Google Slides
Project Status
Free
Free Veterans Day Patriotic Slide Pack Template for PowerPoint & Google Slides
Graphics
Free
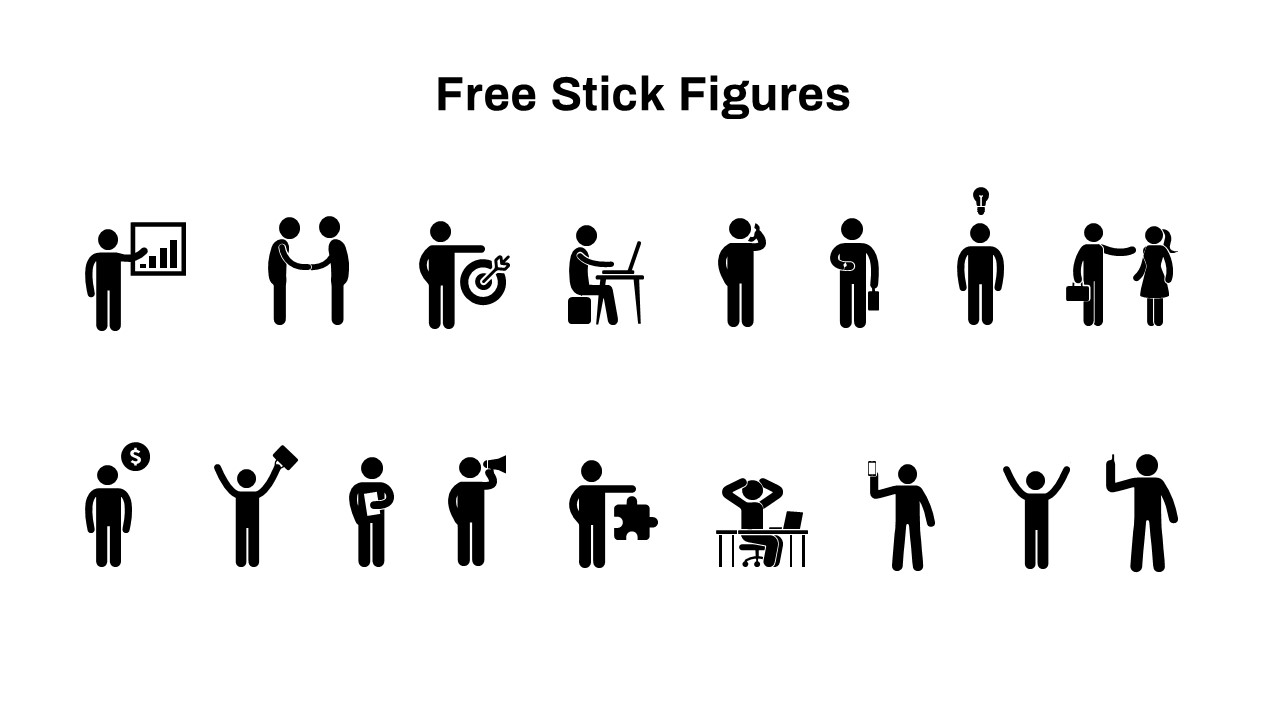
Free Stick Figure Icon Pack Slide Template for PowerPoint & Google Slides
Graphics
Free
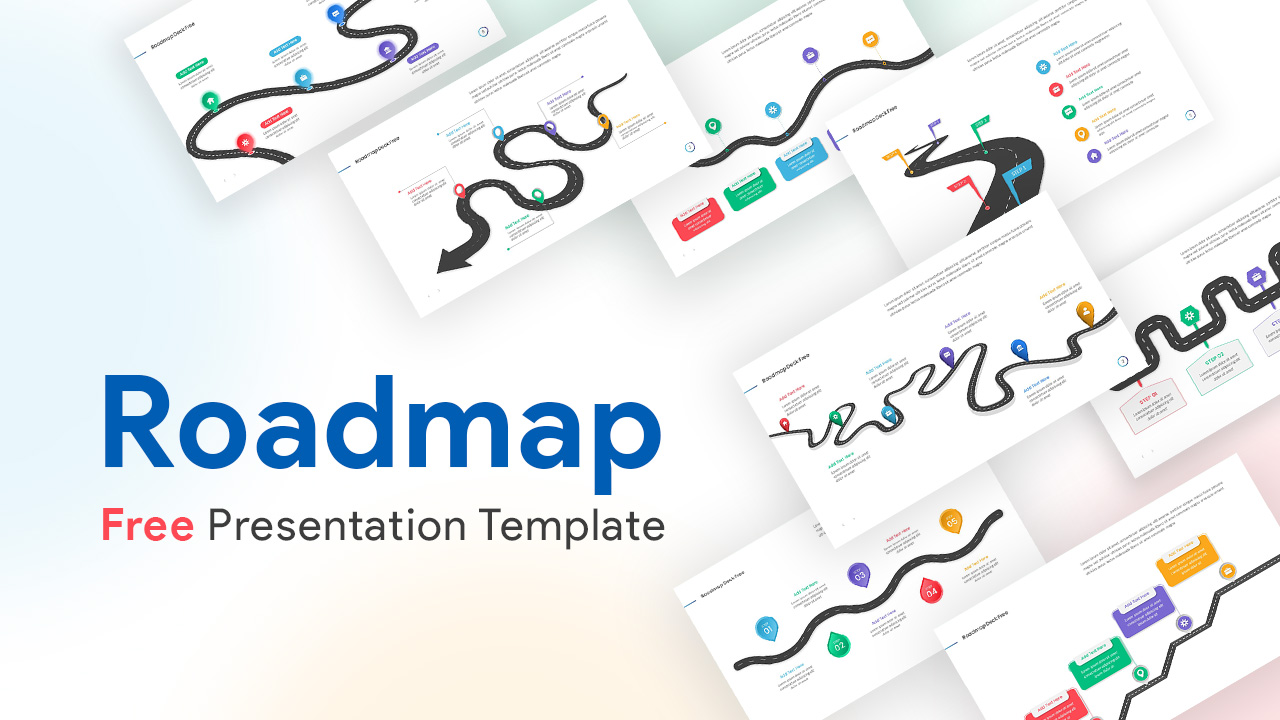
Free Roadmap Infographics Pack Template for PowerPoint & Google Slides
Pitch Deck
Free
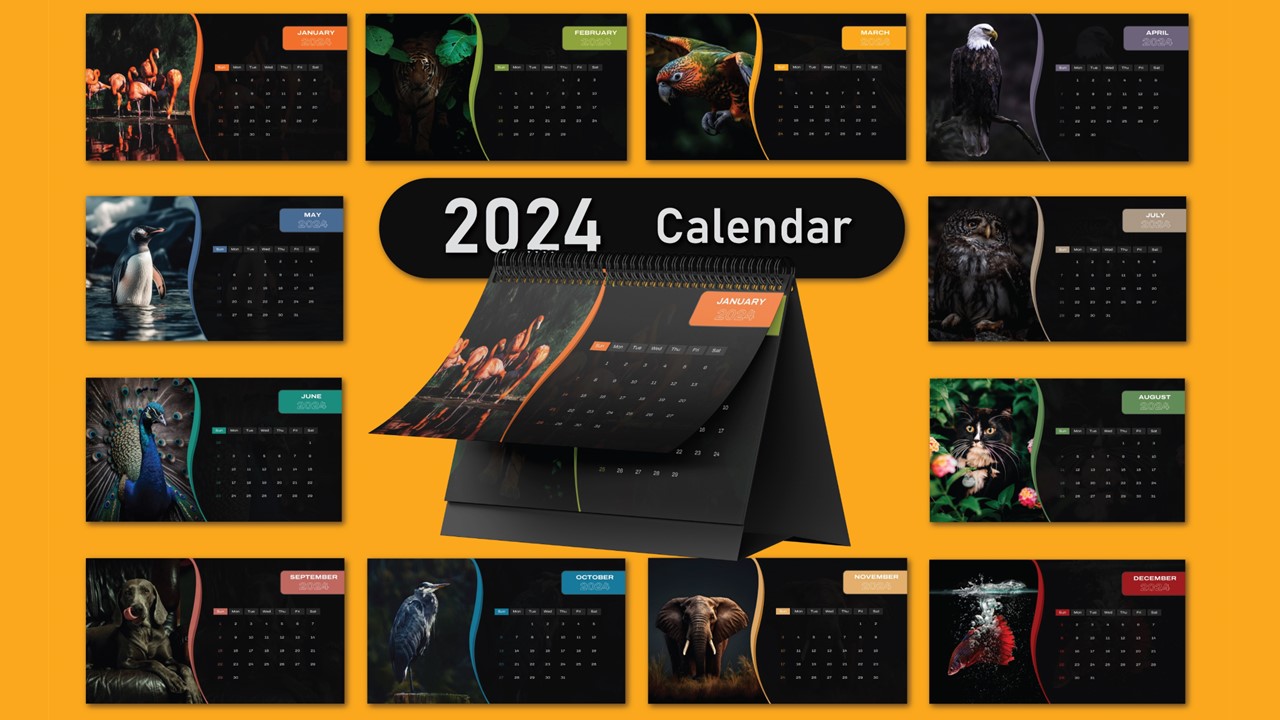
Free Colorful Animal 2024 Calendar Slide Pack Template for PowerPoint & Google Slides
Infographics
Free

Free Colorful Infographic Slide Pack Template for PowerPoint & Google Slides
Roadmap
Free
Free Multi-Step Funnel Infographic Slide Pack Template for PowerPoint & Google Slides
Funnel
Free
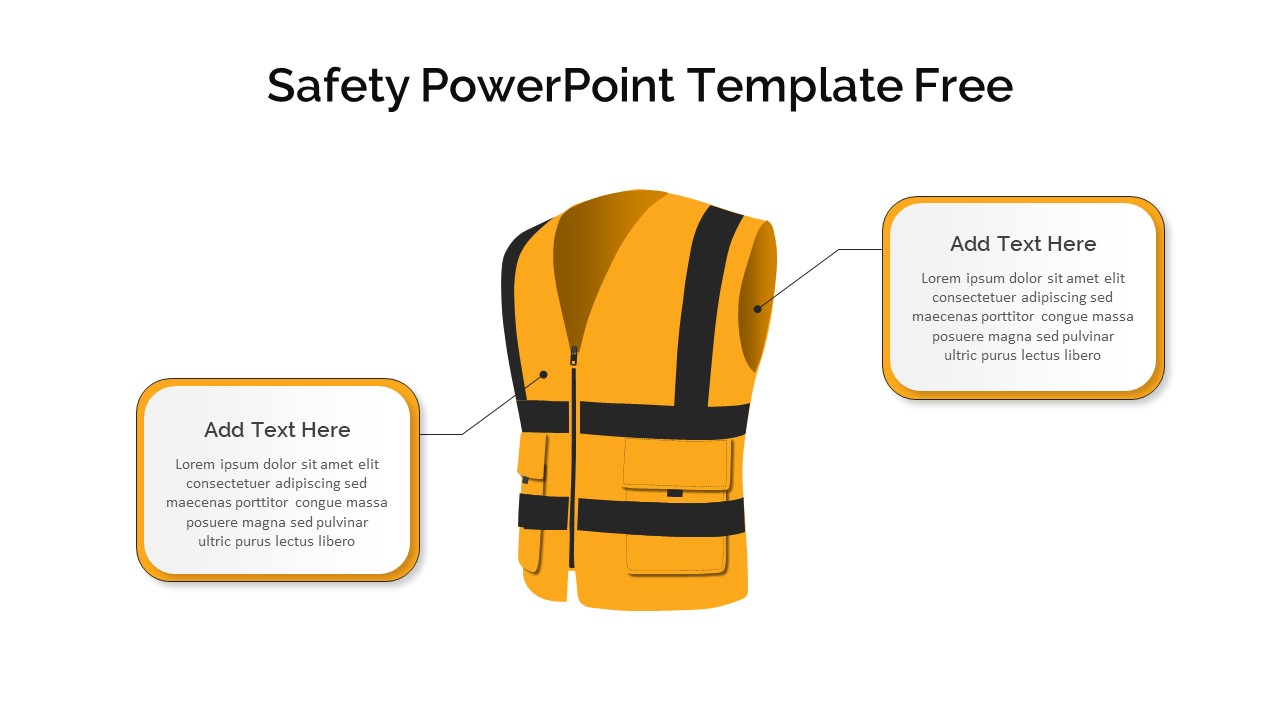
Free 4 Safety Equipment Infographic Pack Template for PowerPoint & Google Slides
Pitch Deck
Free
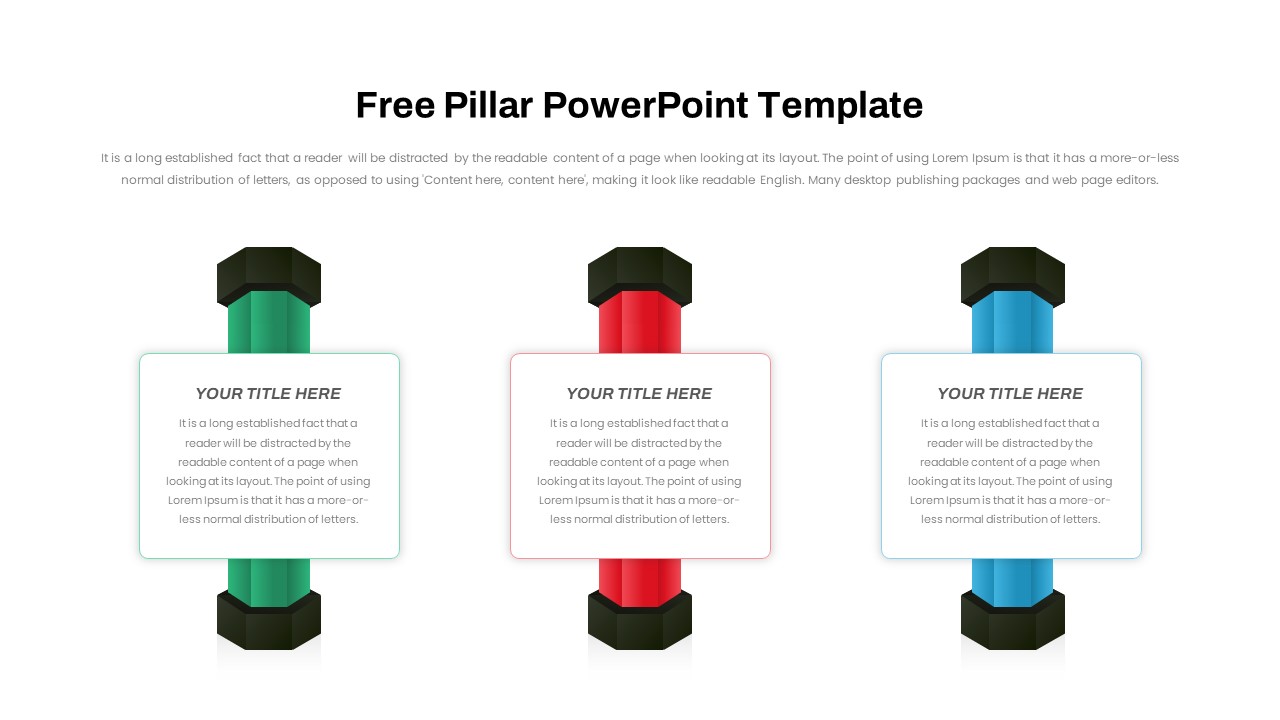
Free Three and Four Pillar Infographic Pack Template for PowerPoint & Google Slides
Process
Free
Half Year Gantt Chart Templat for PowerPoint & Google Slides
Gantt Chart
Professional Organizational Chart Diagram Template for PowerPoint & Google Slides
Org Chart
Professional Clustered Column Chart Template for PowerPoint & Google Slides
Bar/Column
Professional 100% Stacked Column Chart Template for PowerPoint & Google Slides
Bar/Column
Professional Quad Chart Layout Template for PowerPoint & Google Slides
Pie/Donut
Milestone Chart PowerPoint
Timeline
Professional Table of Organization Chart Template for PowerPoint & Google Slides
Org Chart
Snake Diagram PowerPoint Template and Google Slide Template
Process
Agenda Infographic Pack of 2 Slides Template for PowerPoint & Google Slides
Agenda
Game Plan Infographic Slides Pack Template for PowerPoint & Google Slides
Infographics
Annual Project Gantt Chart Template PPT
Gantt Chart
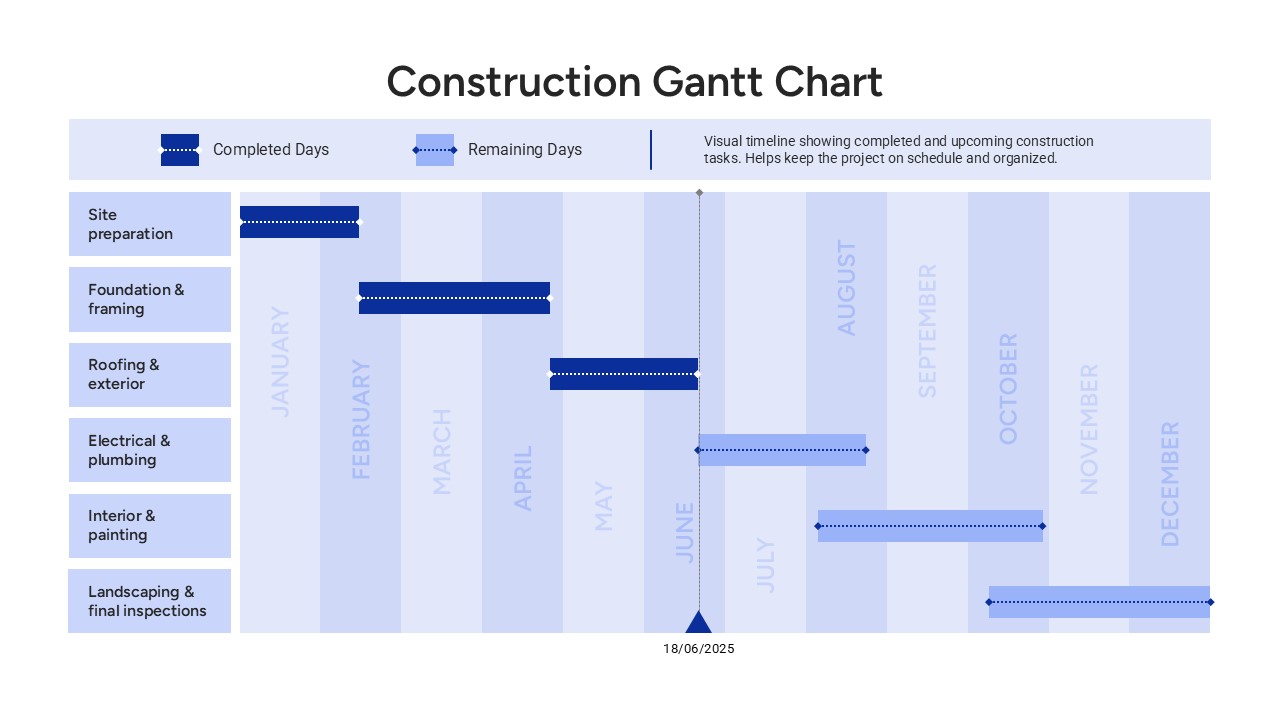
Construction Gantt Chart Template
Gantt Chart
Free Professional Cloud Infographics Template for PowerPoint & Google Slides
Process
Free
Free Professional Event Planner Slide Deck Template for PowerPoint & Google Slides
Business
Free
Free Professional Carnival Pitch Deck Template for PowerPoint & Google Slides
Pitch Deck
Free
Free Forest PowerPoint Template
Company Profile
Free
Philippines Map with Provinces Pack Template for PowerPoint & Google Slides
Maps
Singapore Map Pack Template for PowerPoint & Google Slides
Maps
Sri Lanka Map Infographic Pack Template for PowerPoint & Google Slides
Maps
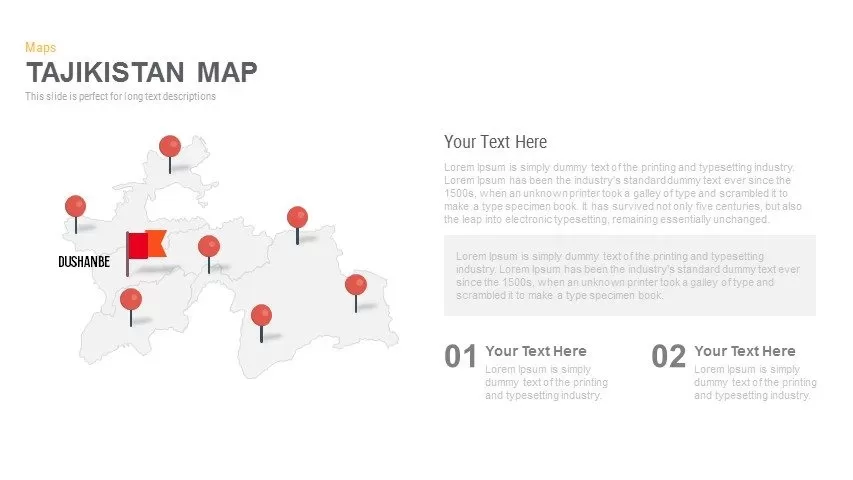
Editable Tajikistan Provinces Map Pack Template for PowerPoint & Google Slides
Maps
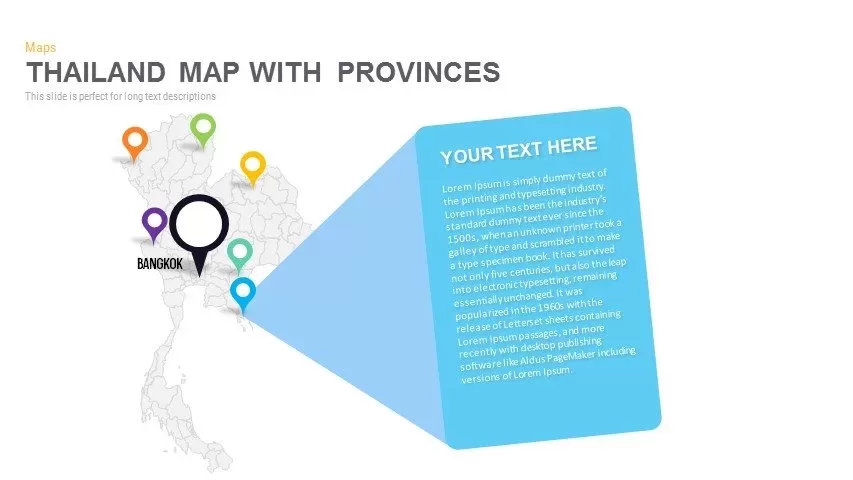
Thailand Provinces Map Infographic Pack Template for PowerPoint & Google Slides
Maps
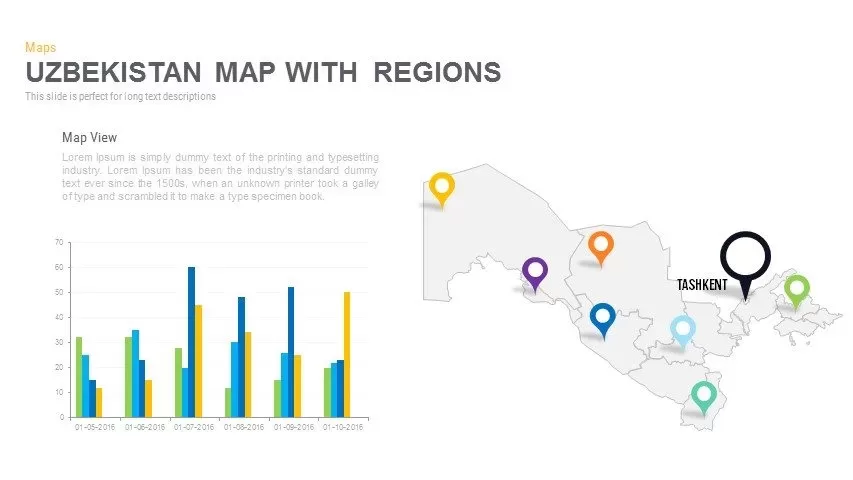
Uzbekistan Map with Regions Pack Template for PowerPoint & Google Slides
Maps
Vietnam Provinces Map Infographic Pack Template for PowerPoint & Google Slides
Maps
Angola Map with Provinces Slide Pack Template for PowerPoint & Google Slides
World Maps
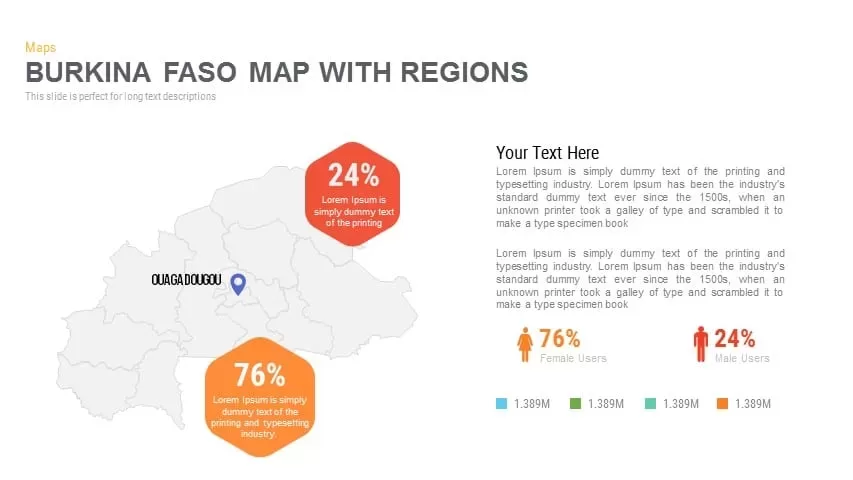
Burkina Faso Map with Regions Slide Pack Template for PowerPoint & Google Slides
World Maps
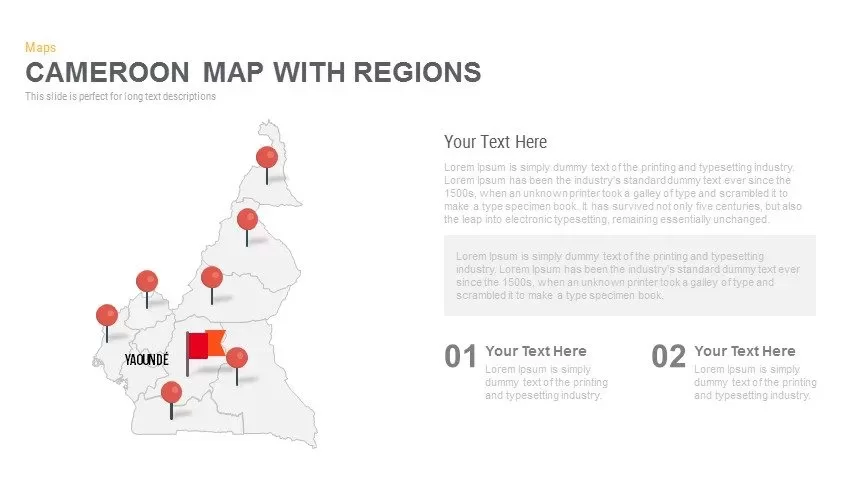
Cameroon Map with Regions Slide Pack Template for PowerPoint & Google Slides
World Maps
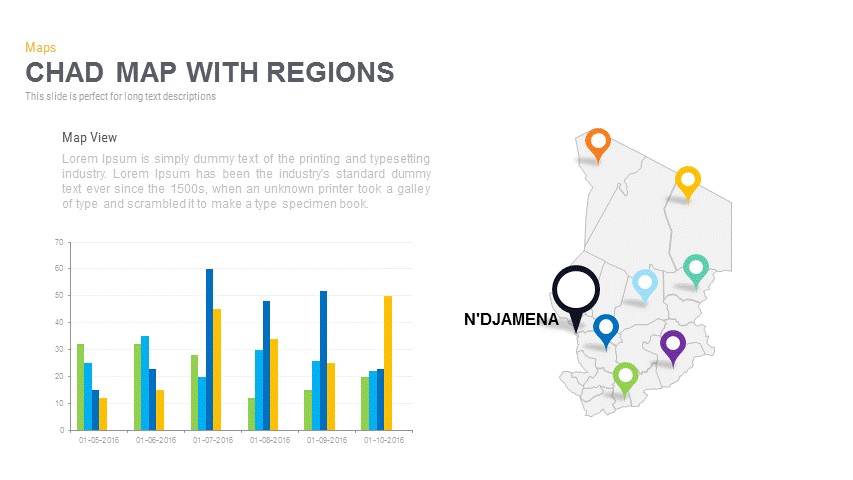
Chad Map with Regions Slide Pack Template for PowerPoint & Google Slides
World Maps
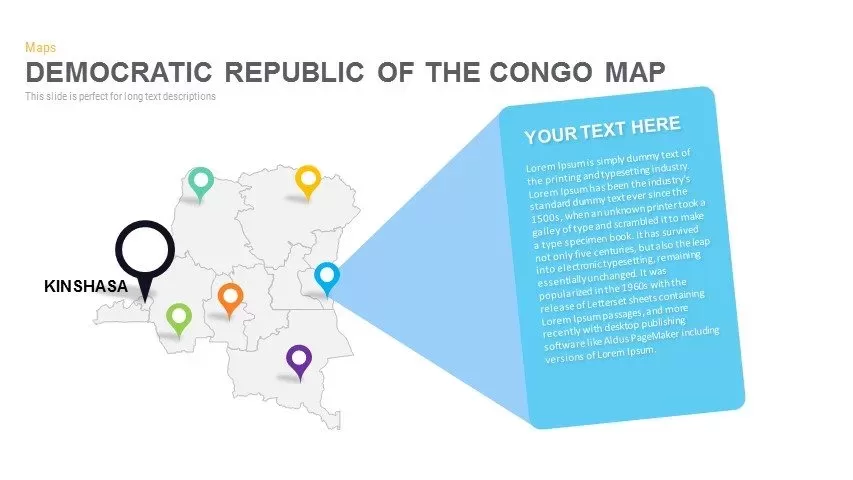
DR Congo Prefecture Map Slide Pack Template for PowerPoint & Google Slides
World Maps
Egypt Regional Map Slide Pack Template for PowerPoint & Google Slides
World Maps
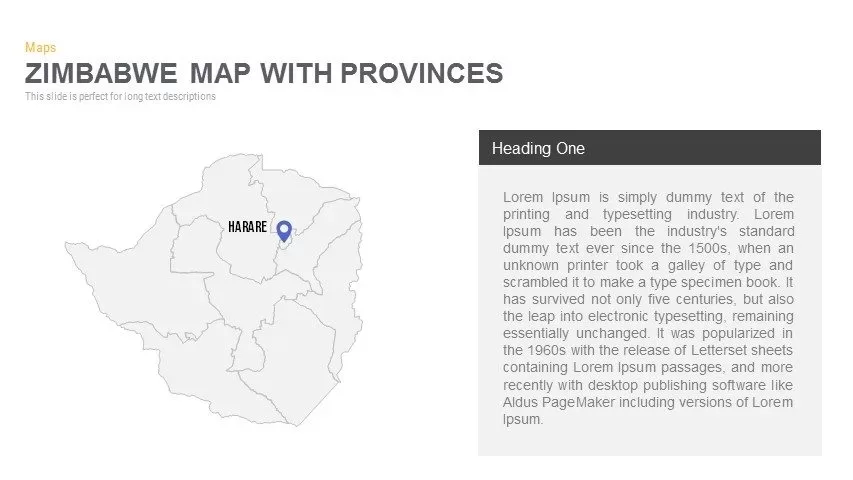
Zimbabwe Map with Provinces Slide Pack Template for PowerPoint & Google Slides
World Maps
Venn Diagram PPT Template and Google Slides
Circular
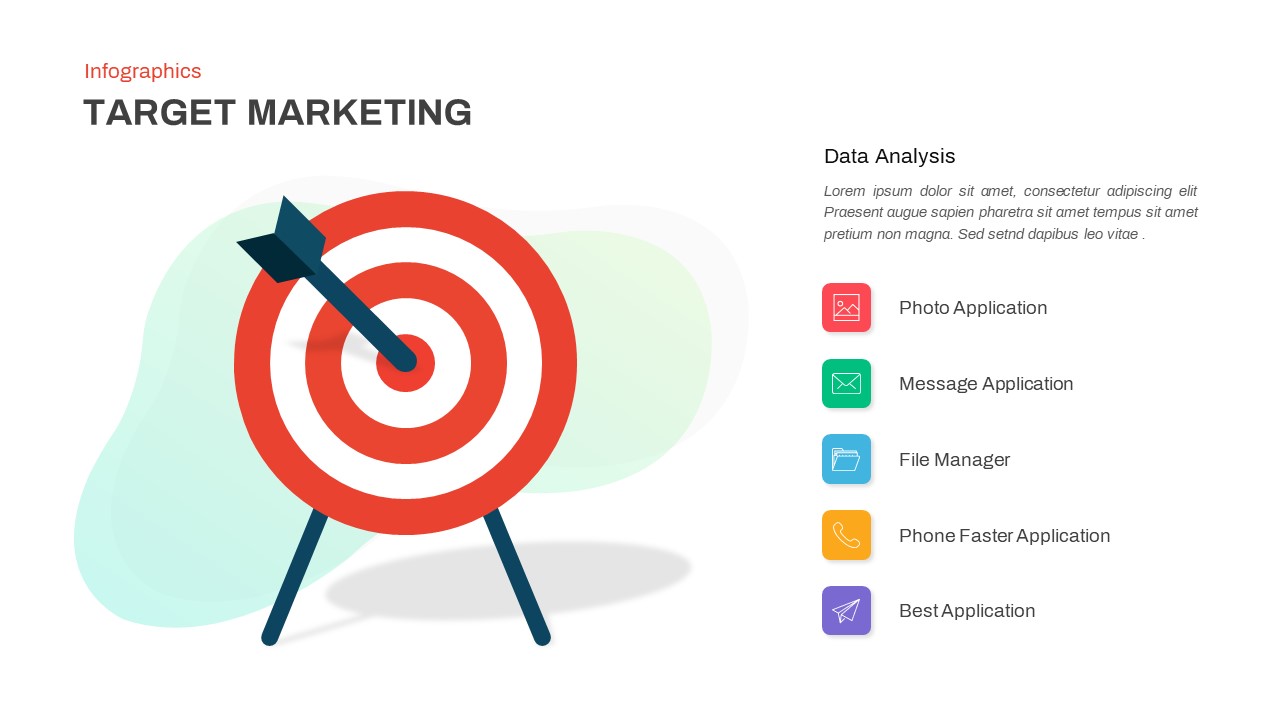
Target Market Infographic Slide Pack Template for PowerPoint & Google Slides
Infographics
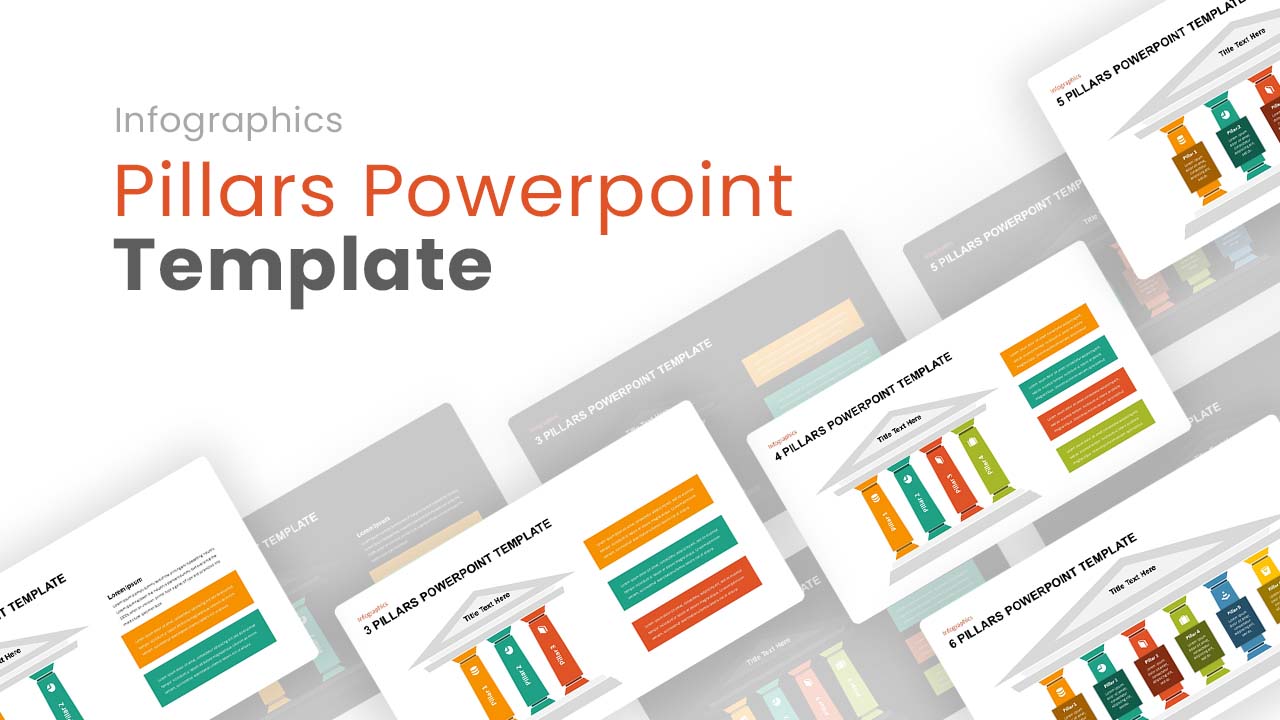
Editable Pillars Infographics Pack Template for PowerPoint & Google Slides
Infographics
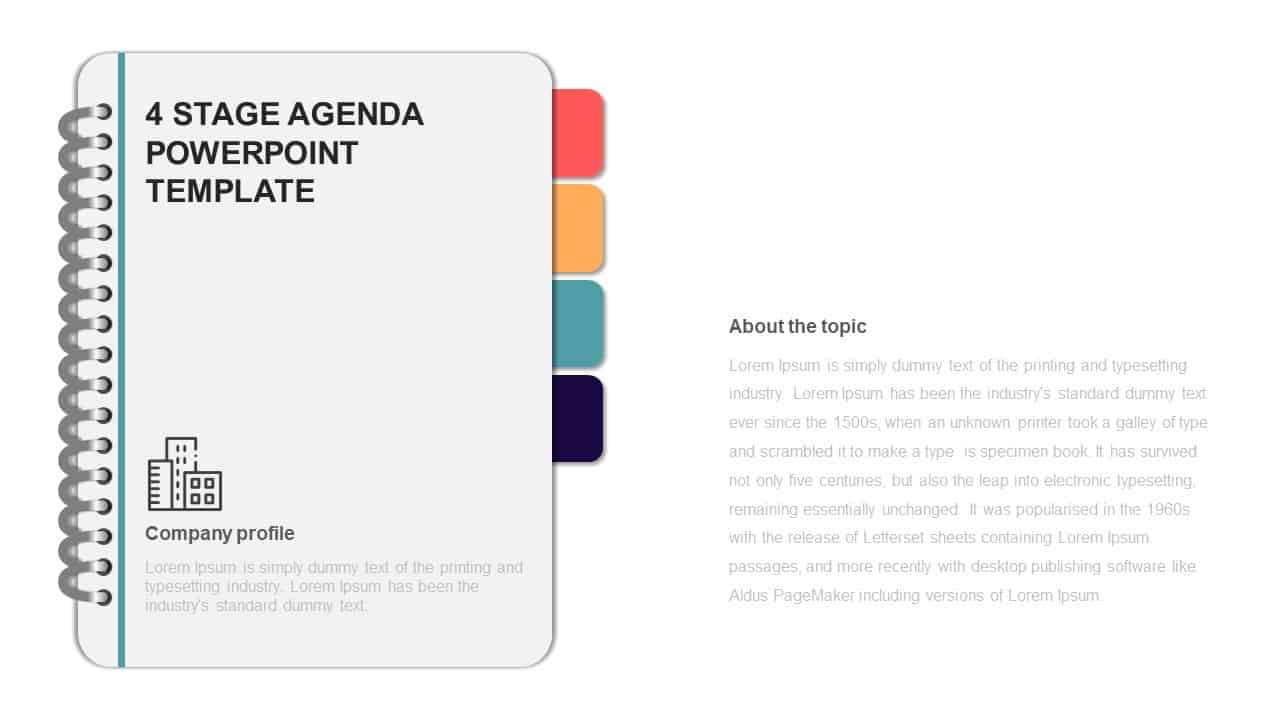
4-Stage Agenda Slide Pack Template for PowerPoint & Google Slides
Agenda
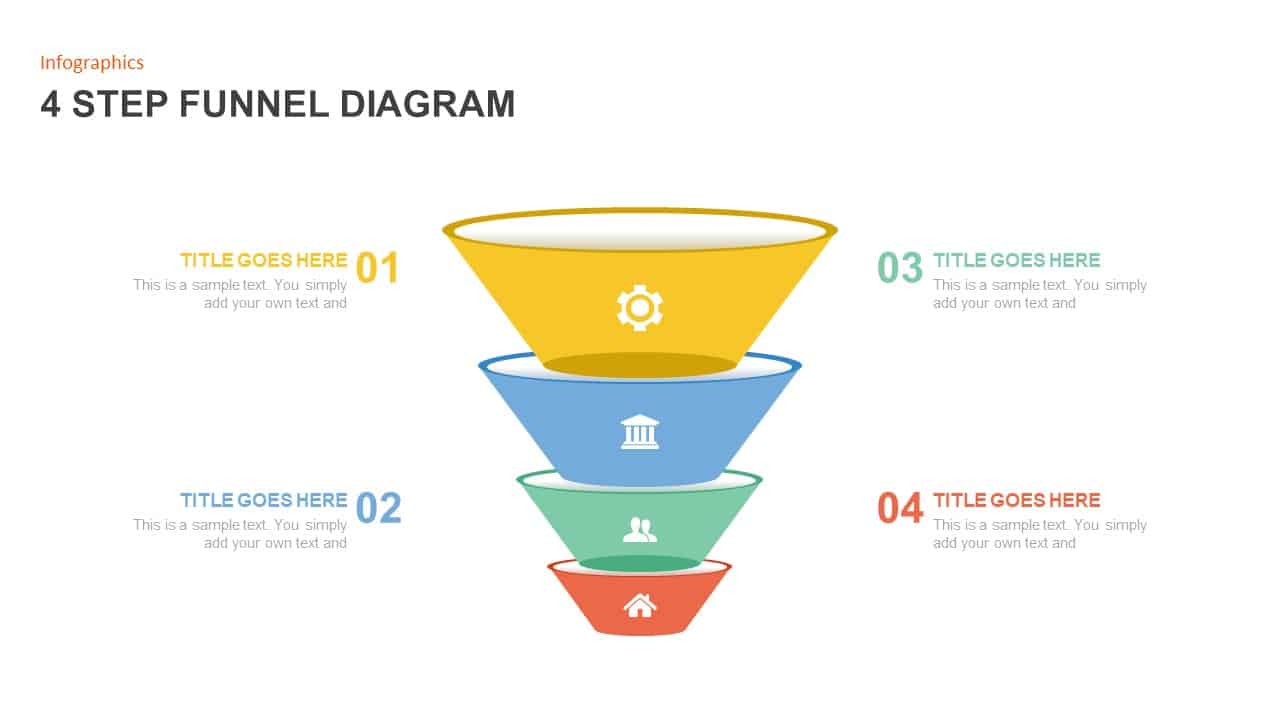
Four-Step Funnel Infographic Pack Template for PowerPoint & Google Slides
Funnel

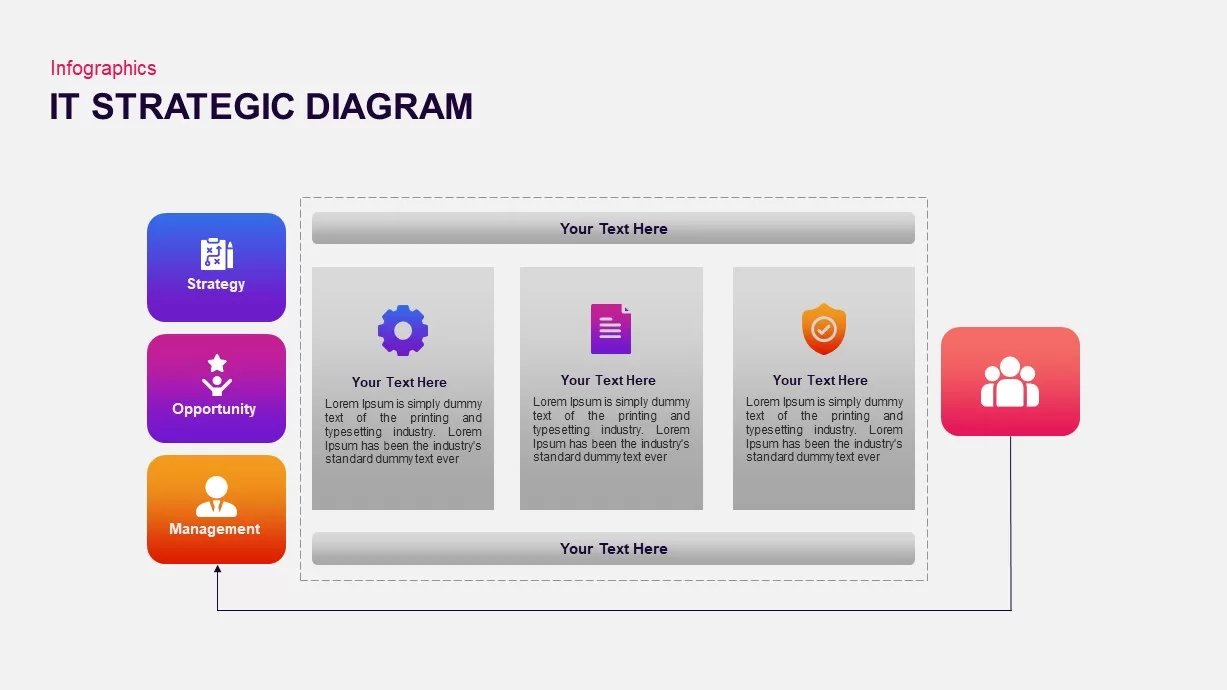
IT Strategic Diagram Infographic Pack Template for PowerPoint & Google Slides
Business Strategy
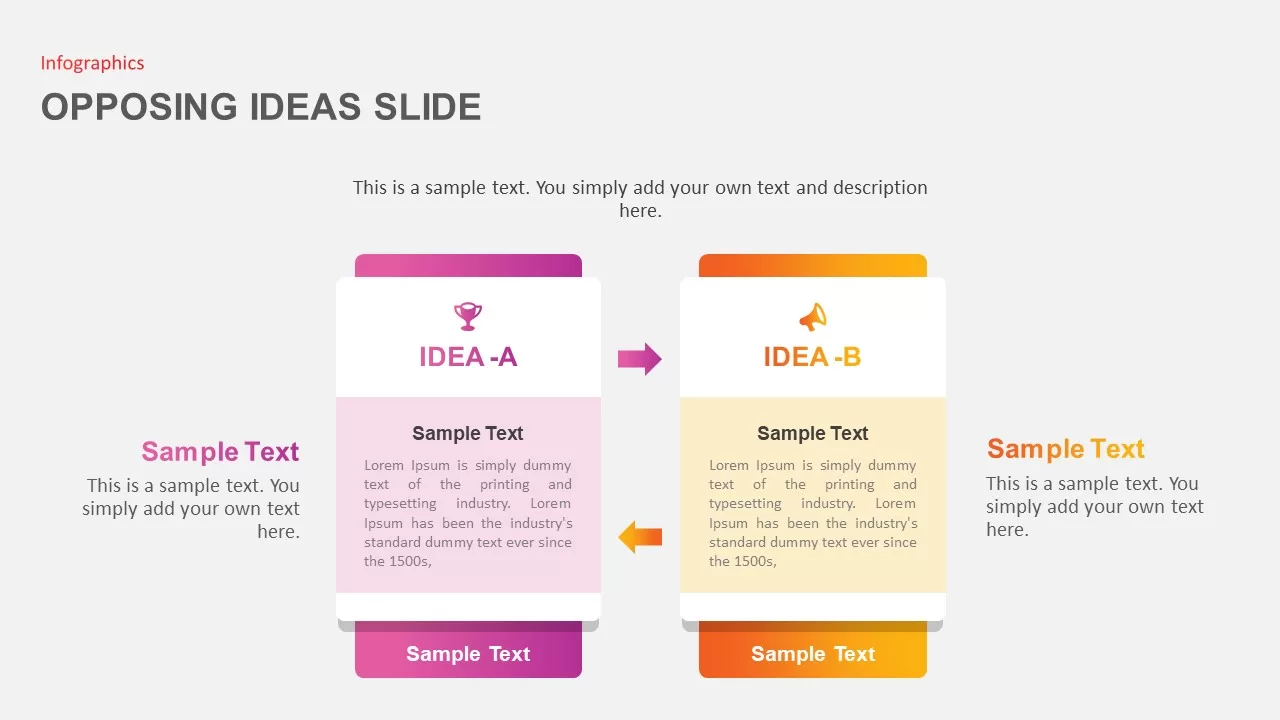
Opposing Ideas Infographics Pack Template for PowerPoint & Google Slides
Comparison
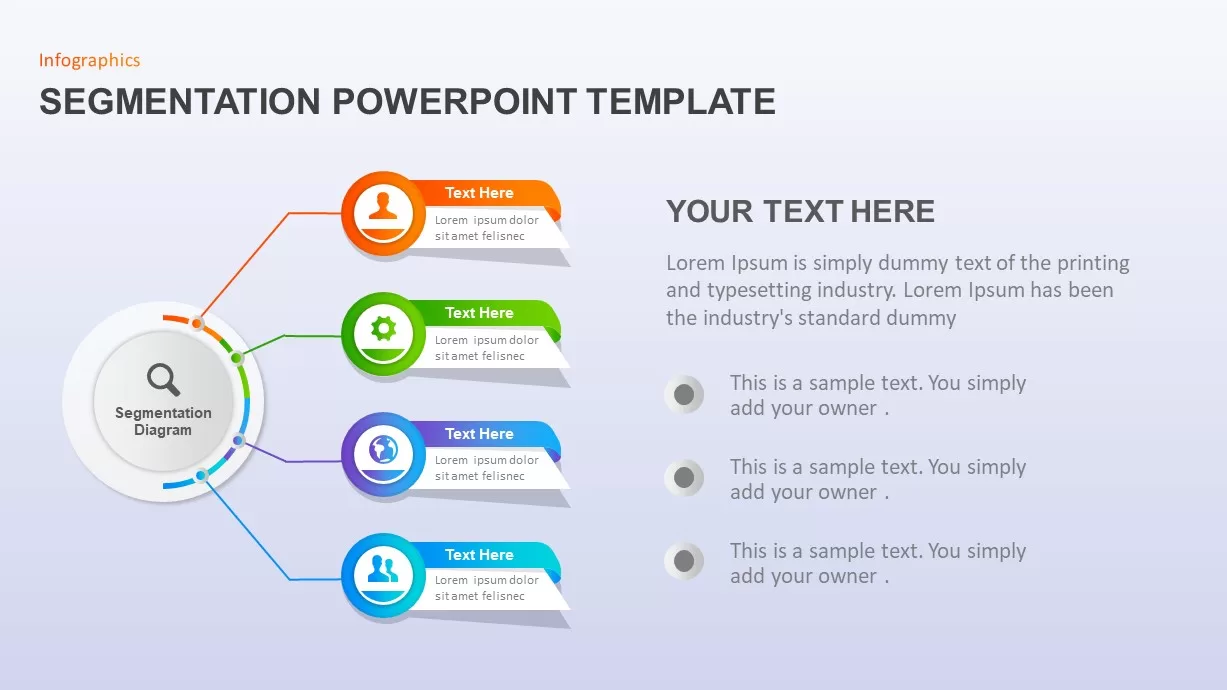
Market Segmentation & STP Infographics Pack Template for PowerPoint & Google Slides
Marketing
Business Growth Plant Infographics Pack Template for PowerPoint & Google Slides
Process
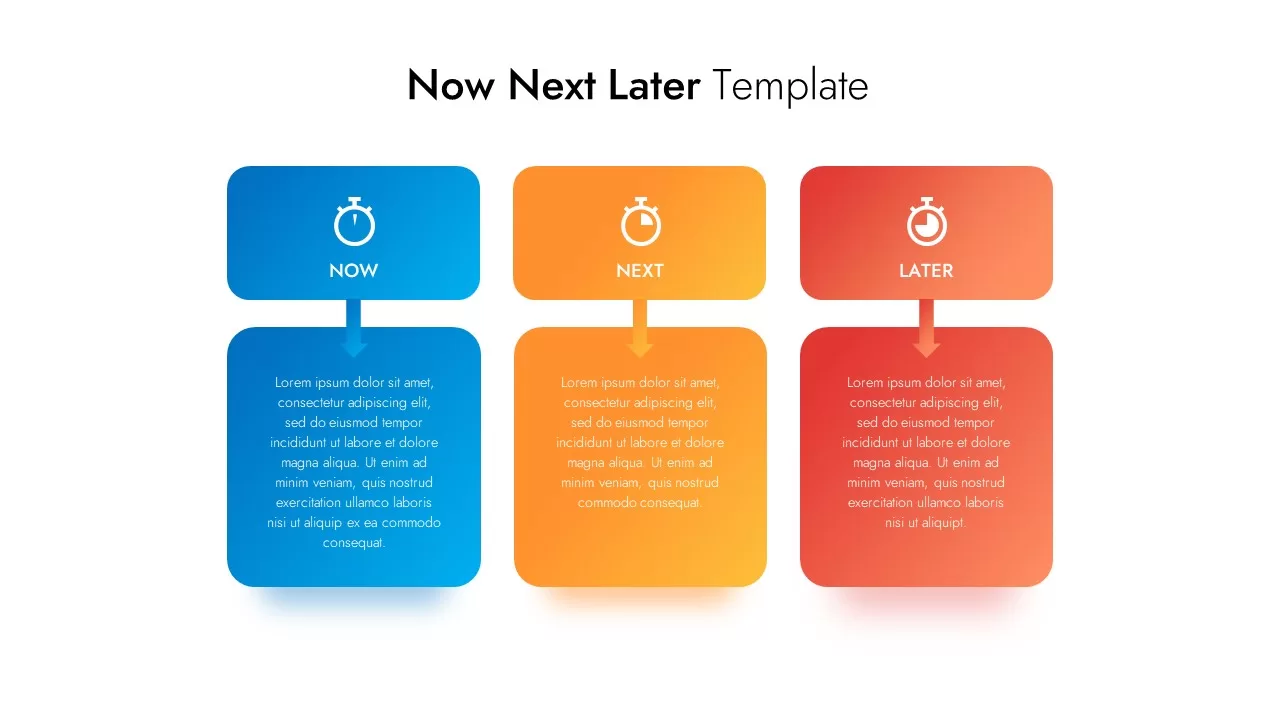
Now Next Later Template
Process
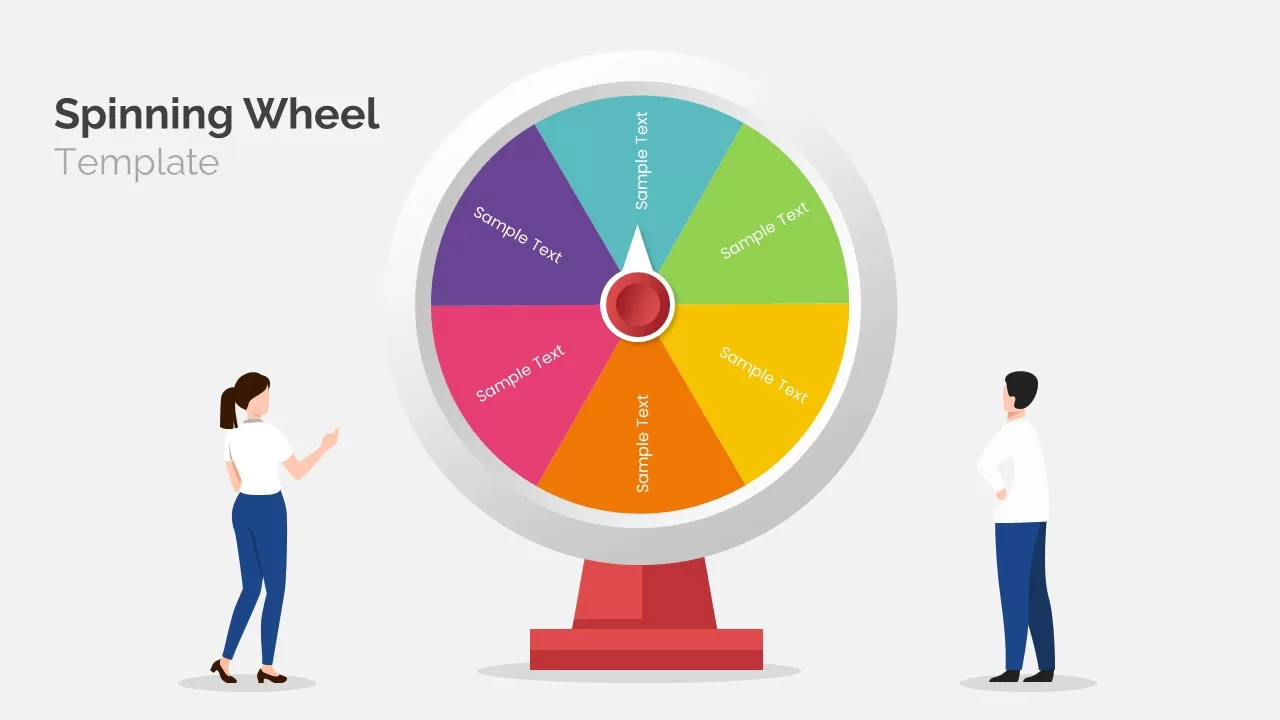
Animated spinning wheel PowerPoint Template
Circular
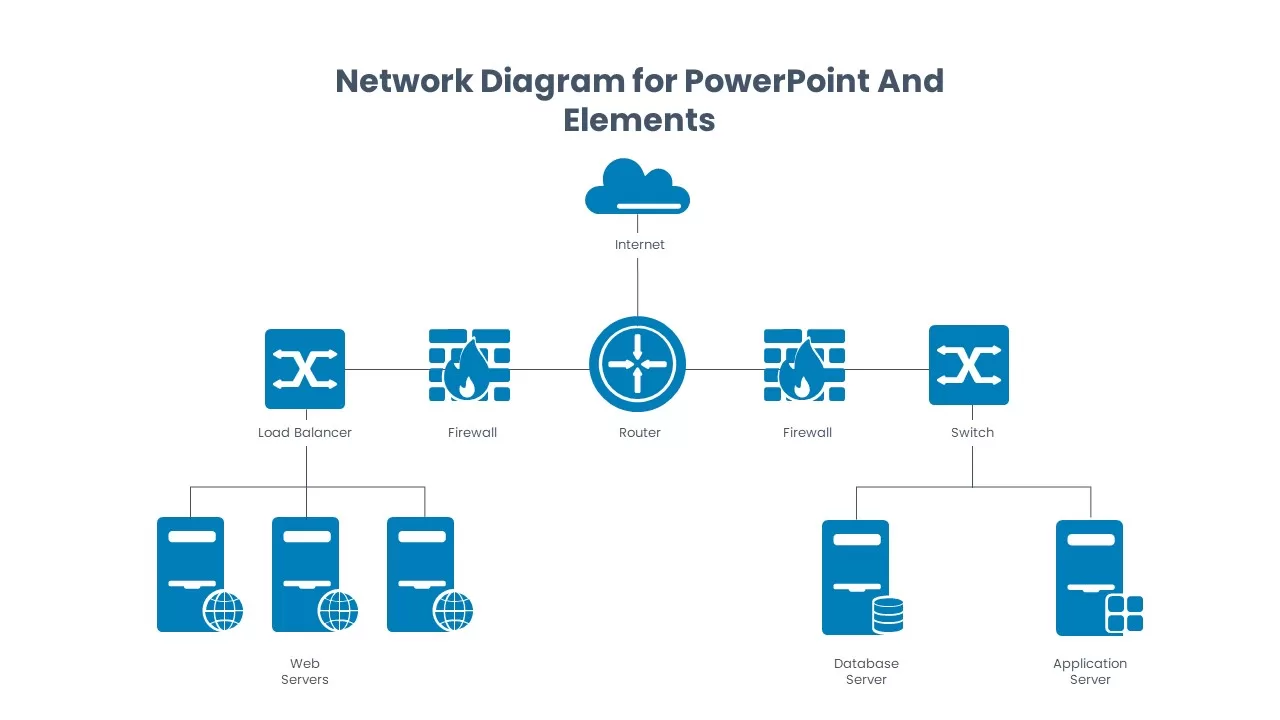
Network Diagram Template and Elements
Information Technology
Data-driven GDP Growth Infographic Pack Template for PowerPoint & Google Slides
Infographics
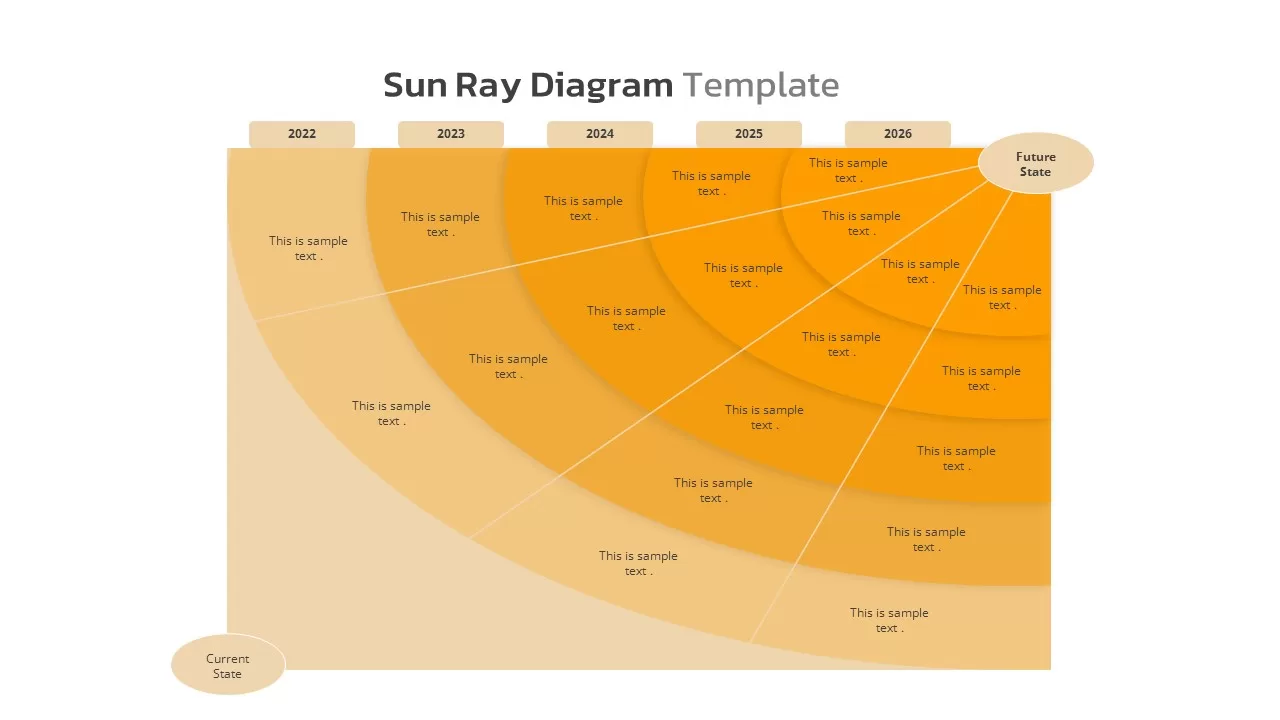
Sun Ray Diagram Template
Timeline
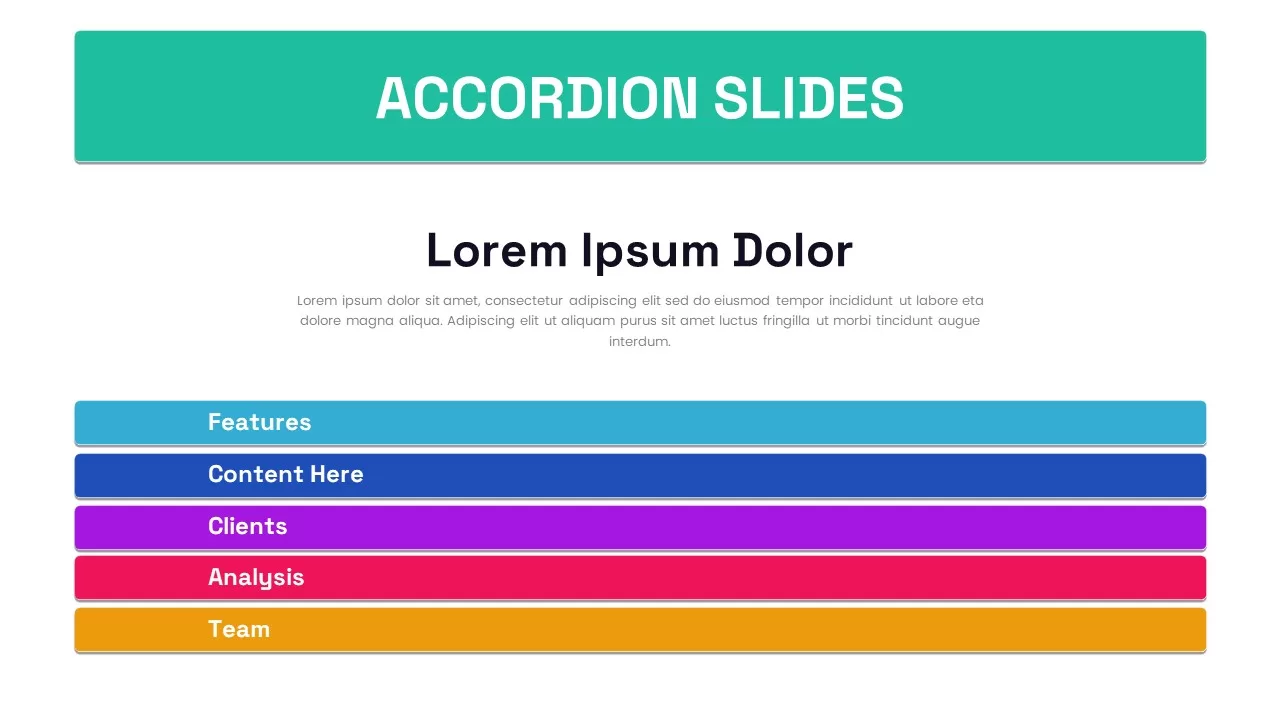
Six-Slide Animated Accordion Pack Template for PowerPoint & Google Slides
Business
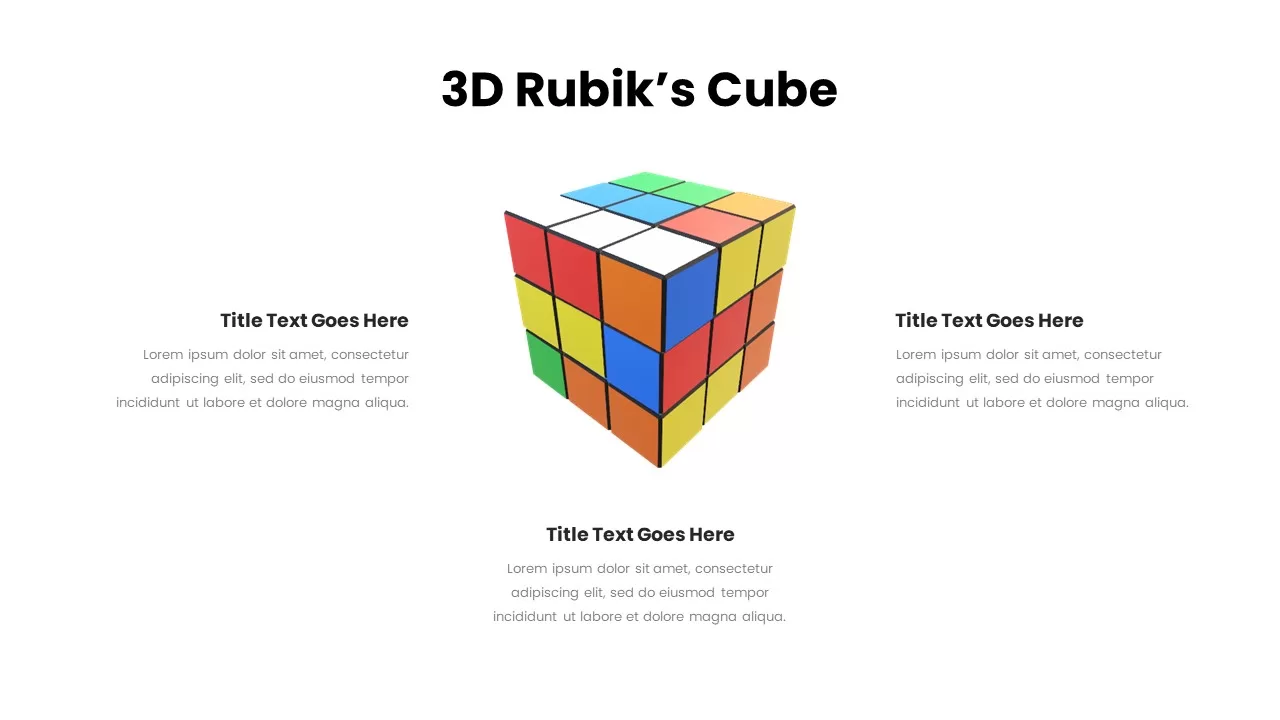
Dynamic 3D Rubik’s Cube Diagram Pack Template for PowerPoint & Google Slides
Infographics
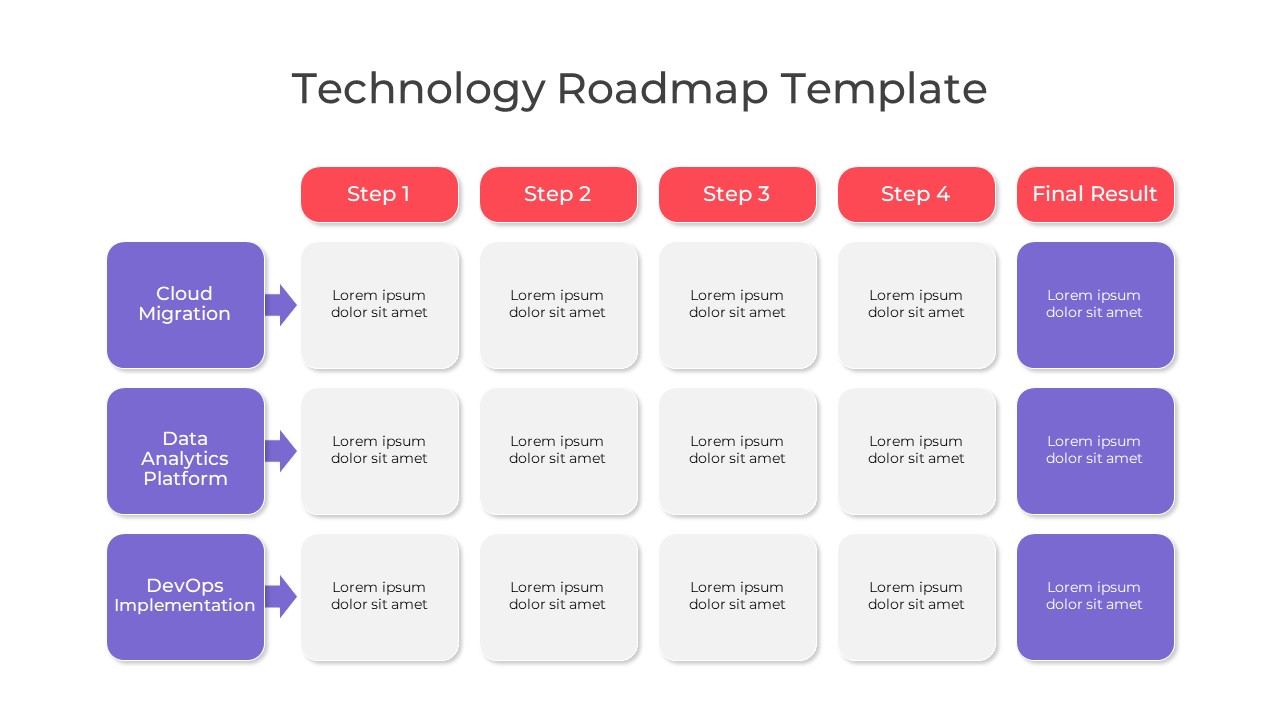
Technology Roadmap PowerPoint Template
Roadmap
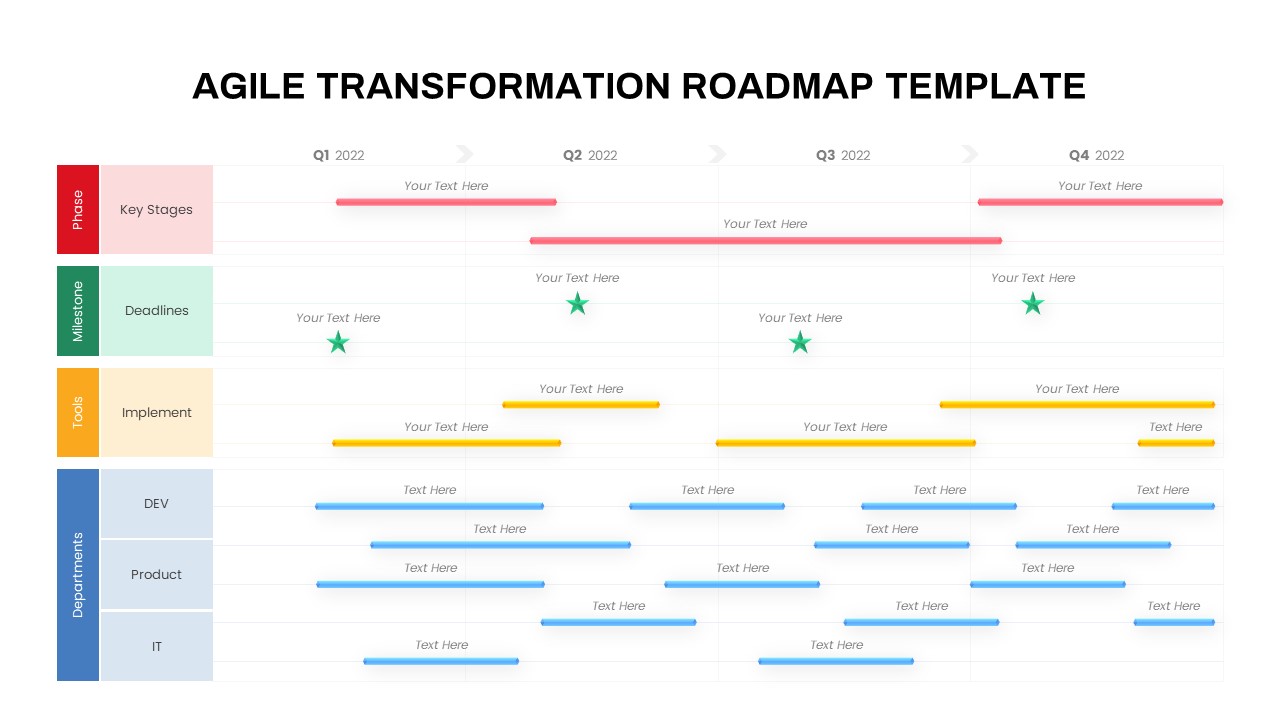
Agile Transformation Roadmap Slide Pack Template for PowerPoint & Google Slides
Roadmap
Advanced Data Flow Diagram Pack Template for PowerPoint & Google Slides
Flow Charts
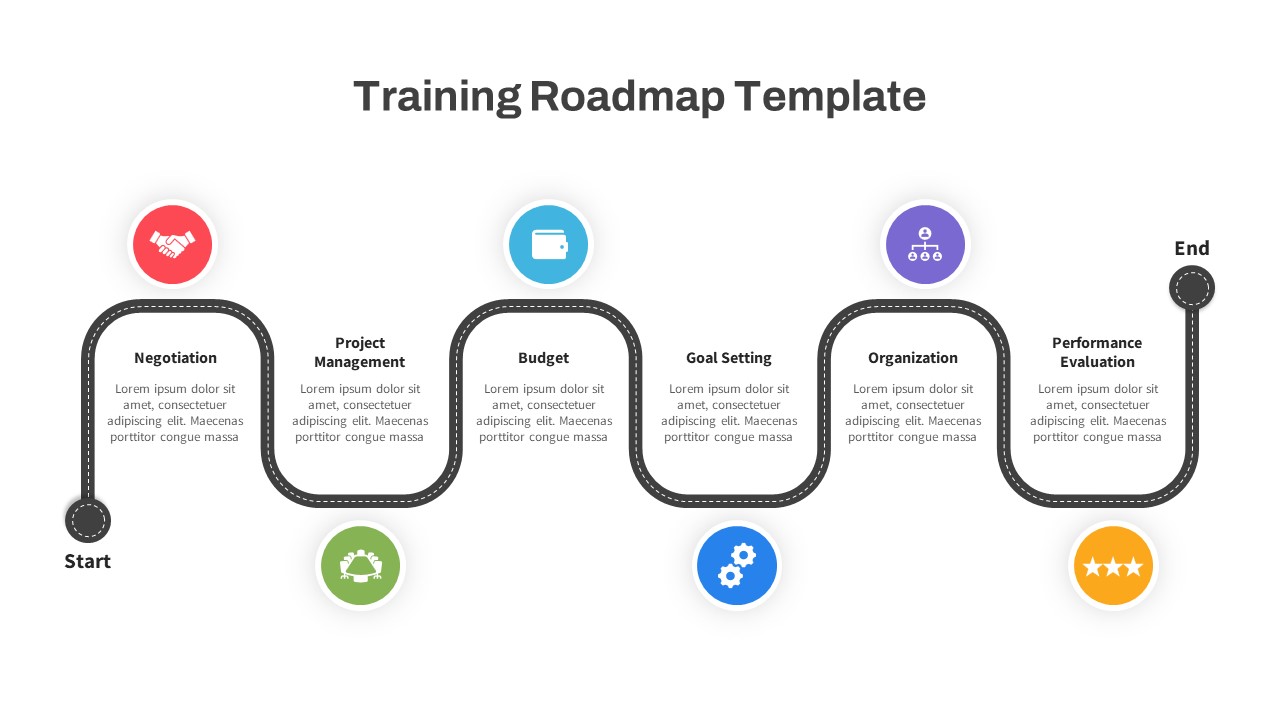
Training Roadmap Infographic Pack Template for PowerPoint & Google Slides
Roadmap
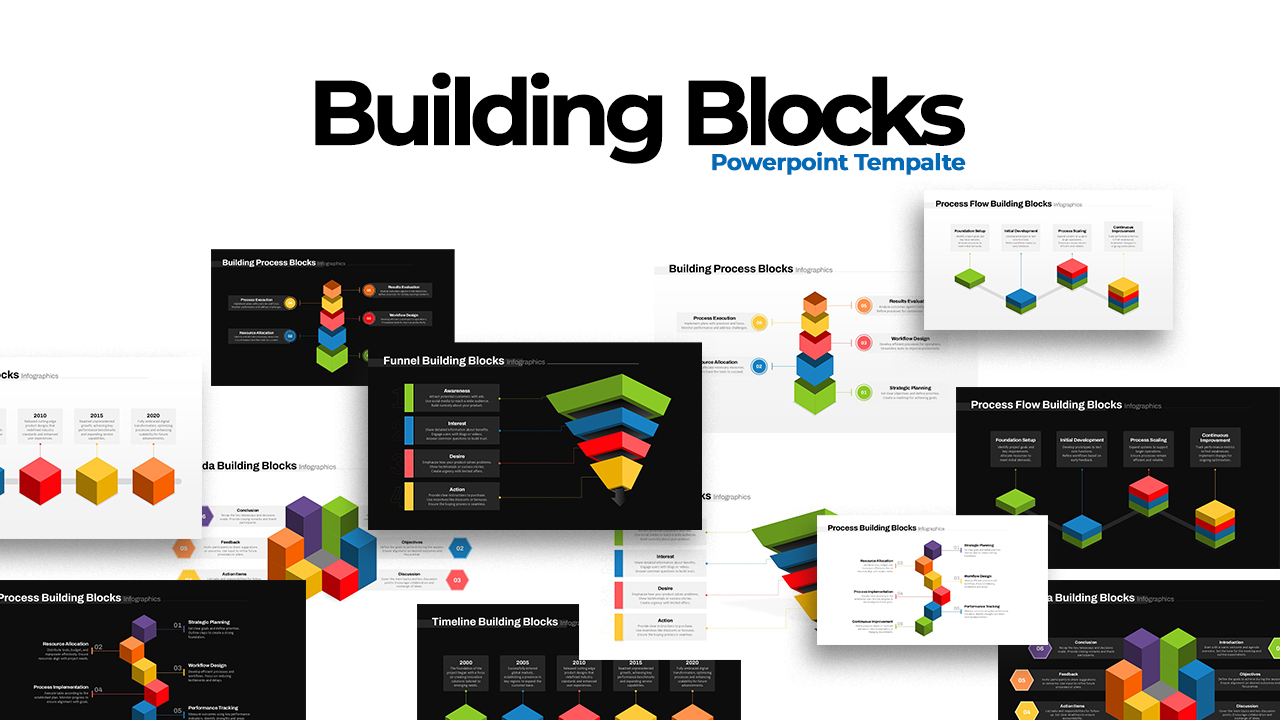
3D Building Blocks Infographic Pack Template for PowerPoint & Google Slides
Infographics
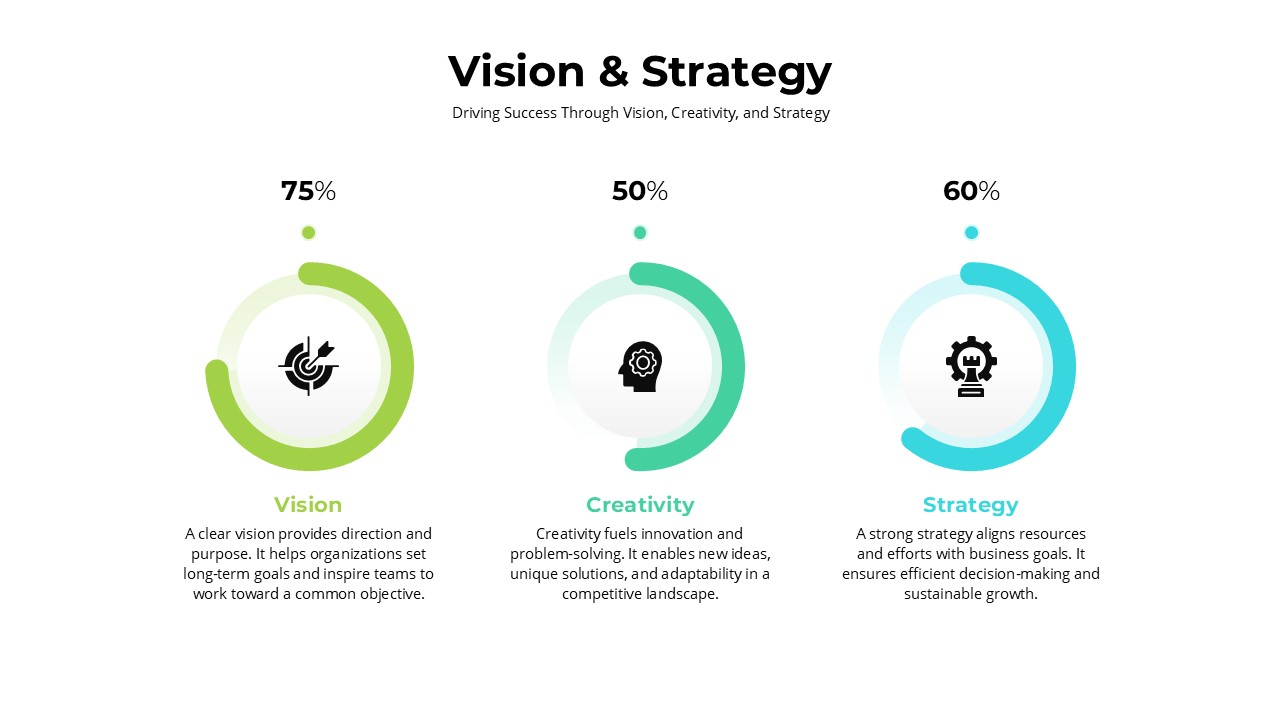
Vision & Strategy Infographic Pack Template for PowerPoint & Google Slides
Vision and Mission
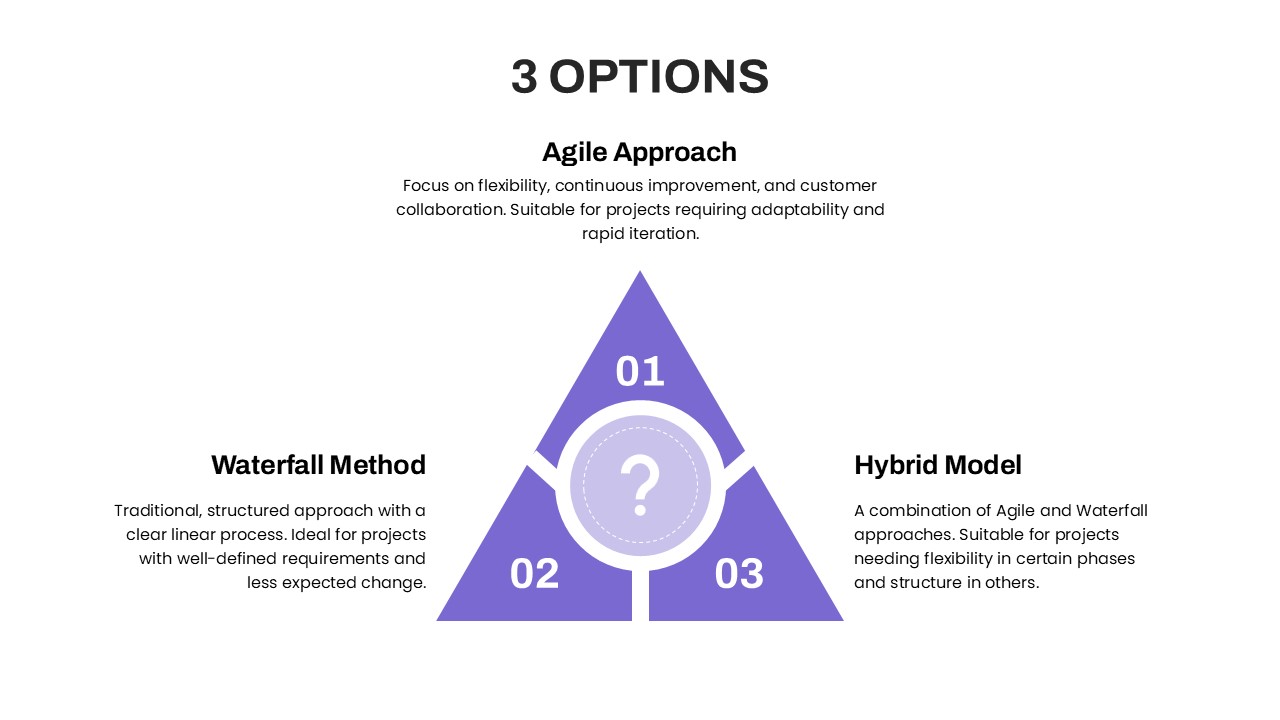
Three Options Infographic Pack Template for PowerPoint & Google Slides
Process
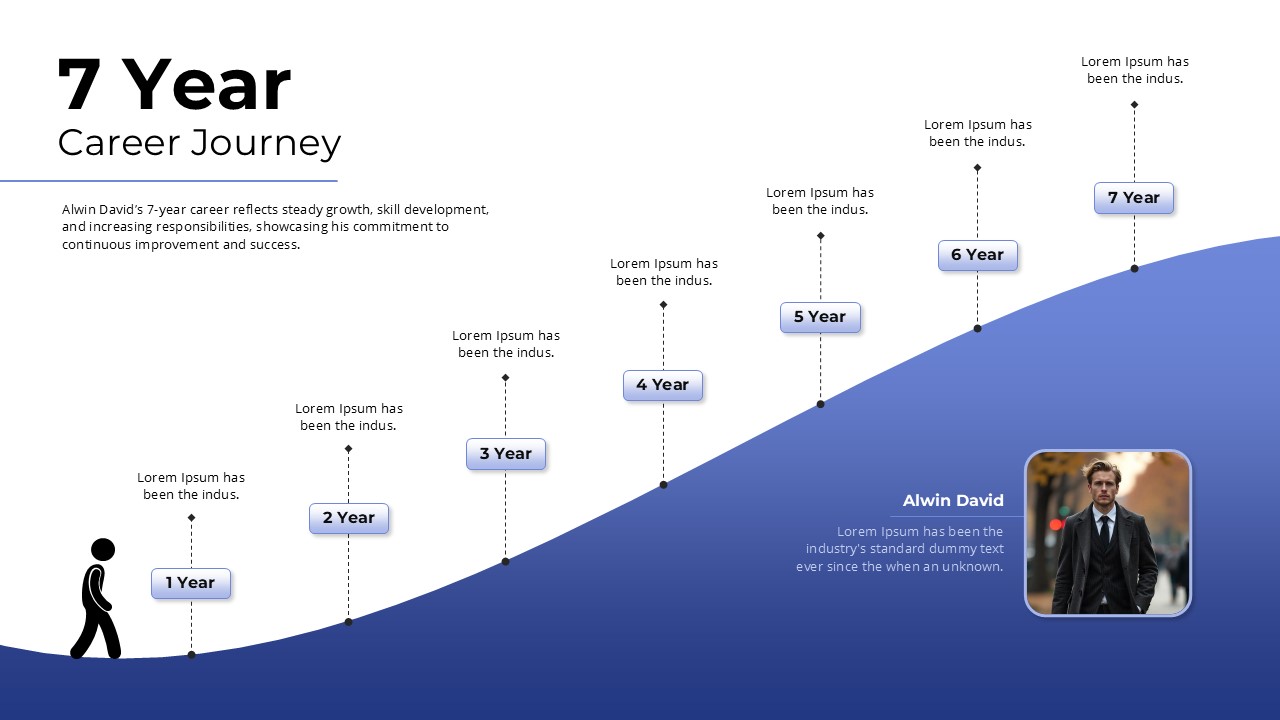
Career Journey Infographic Pack Template for PowerPoint & Google Slides
Timeline
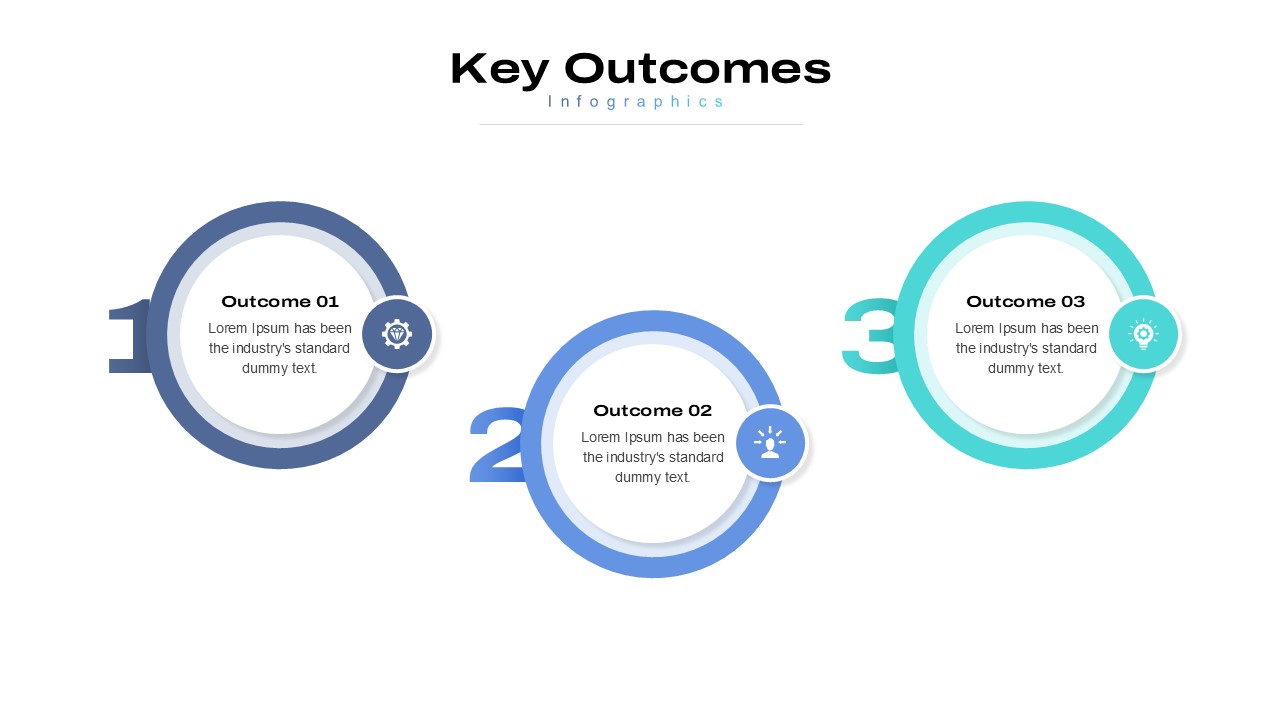
5 Styles Key Outcomes Infographics Pack Template for PowerPoint & Google Slides
Infographics
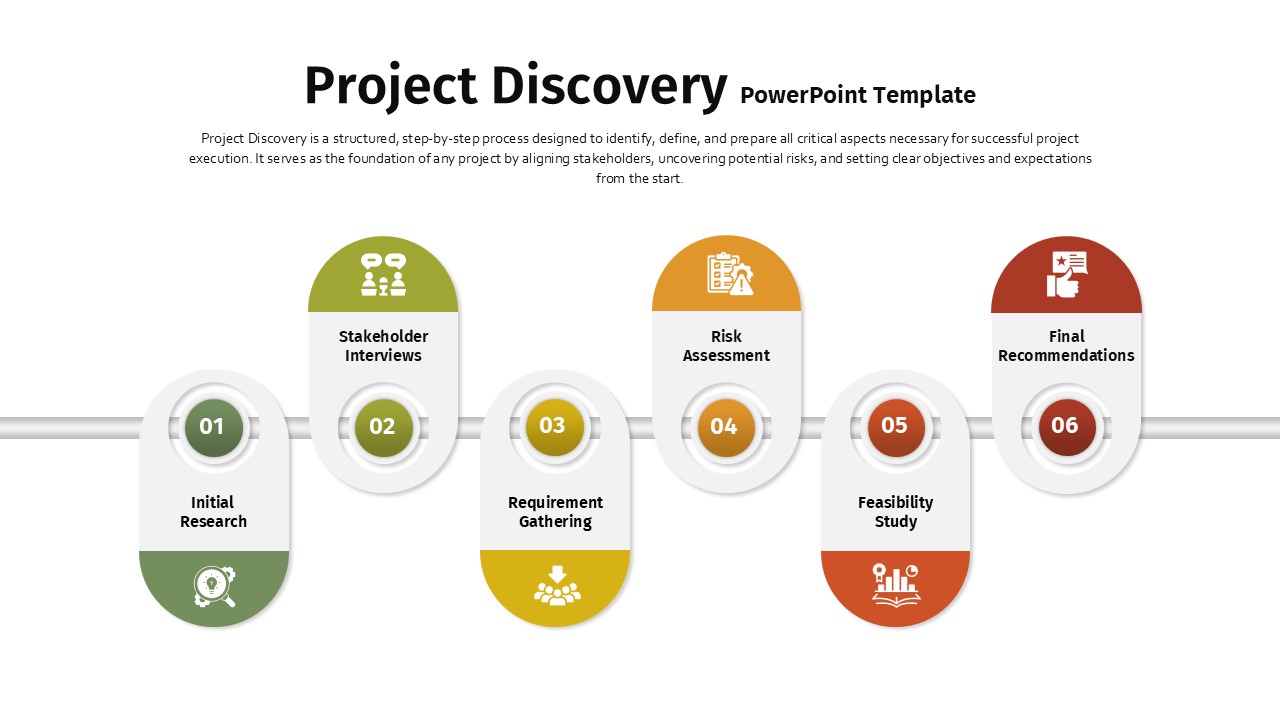
Project Discovery Infographic Pack Template for PowerPoint & Google Slides
Timeline
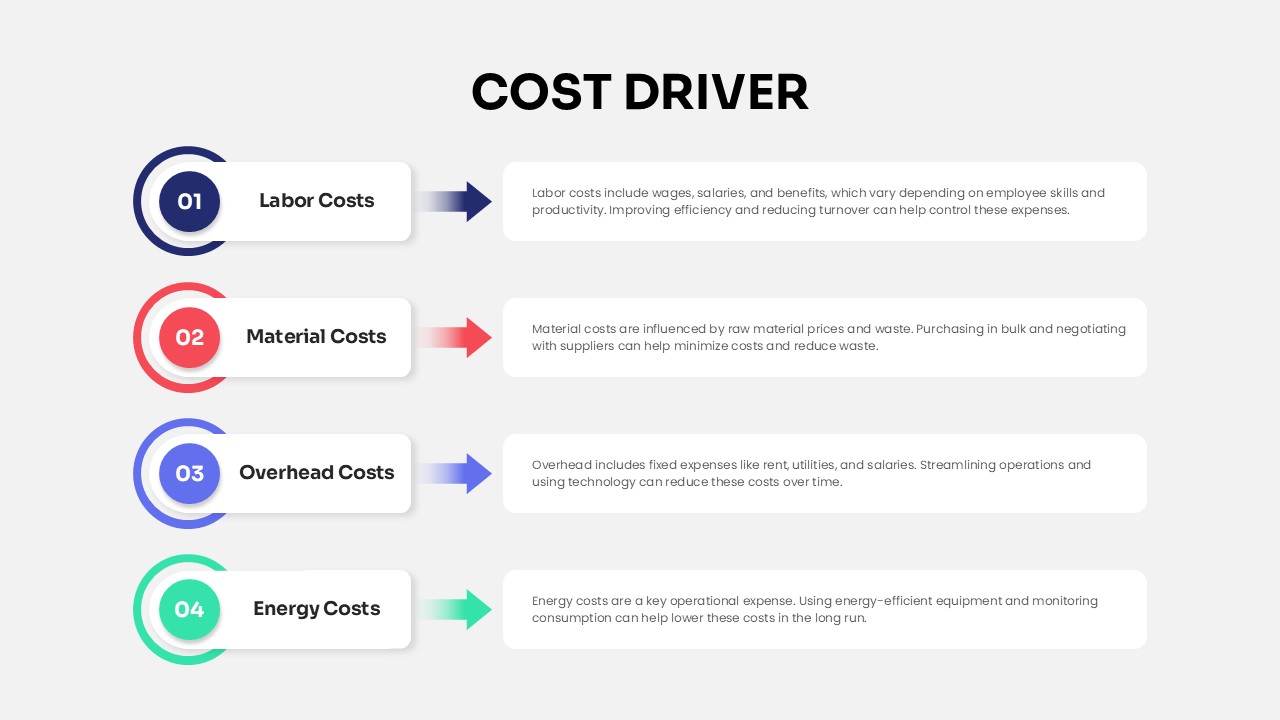
Cost Driver Infographic Slide Pack Template for PowerPoint & Google Slides
Process
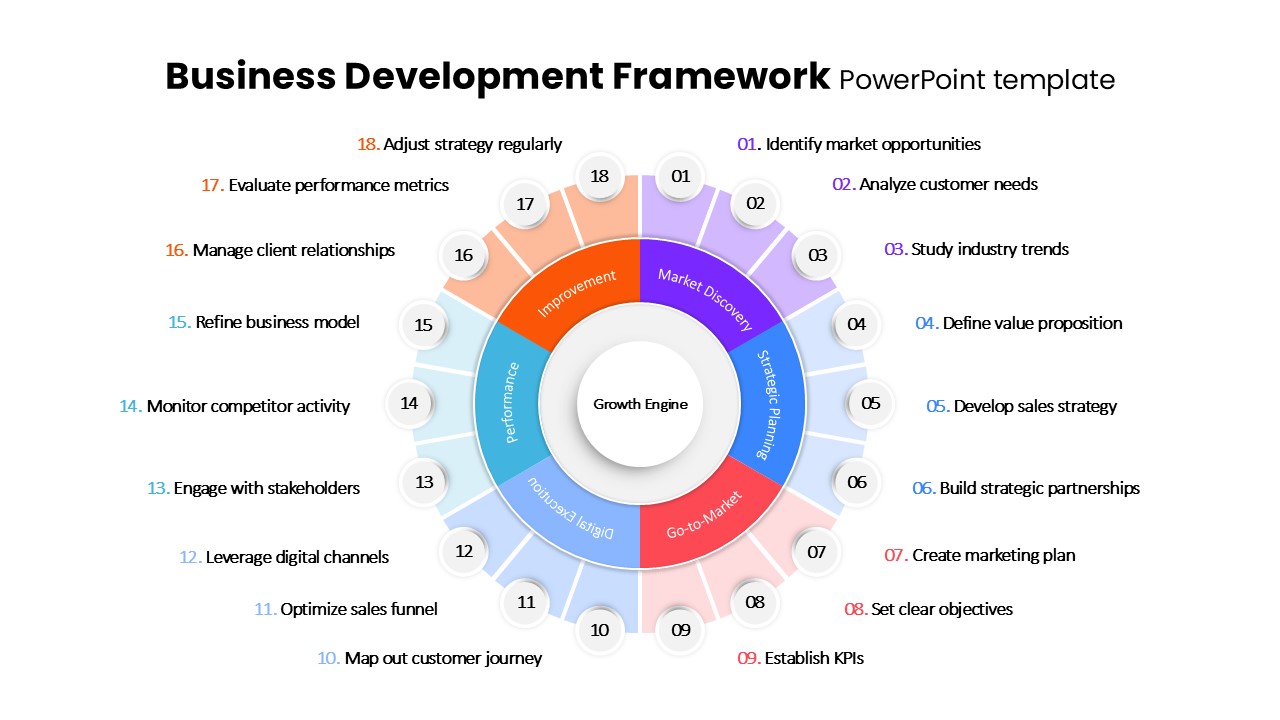
Business Development Framework Pack Template for PowerPoint & Google Slides
Business Strategy
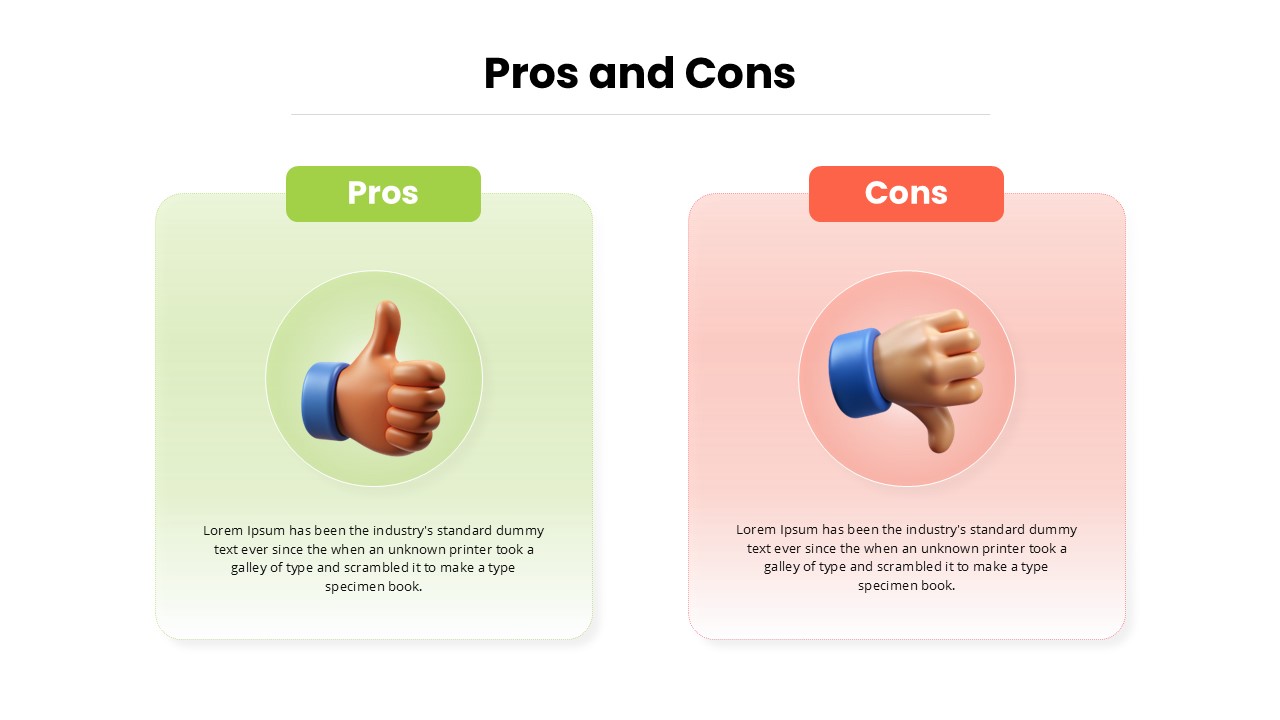
Pros and Cons Infographic Slide Pack Template for PowerPoint & Google Slides
Comparison