Forecast Chart with Confidence Bounds Template for PowerPoint & Google Slides

Description
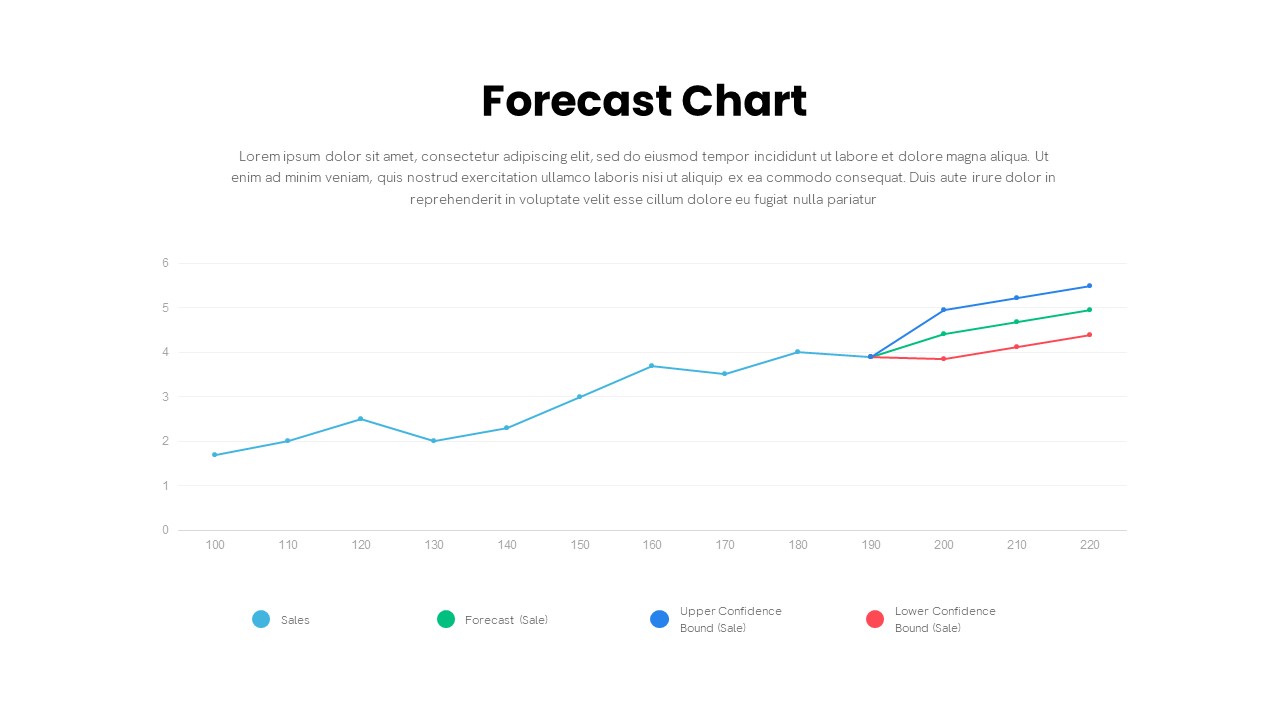
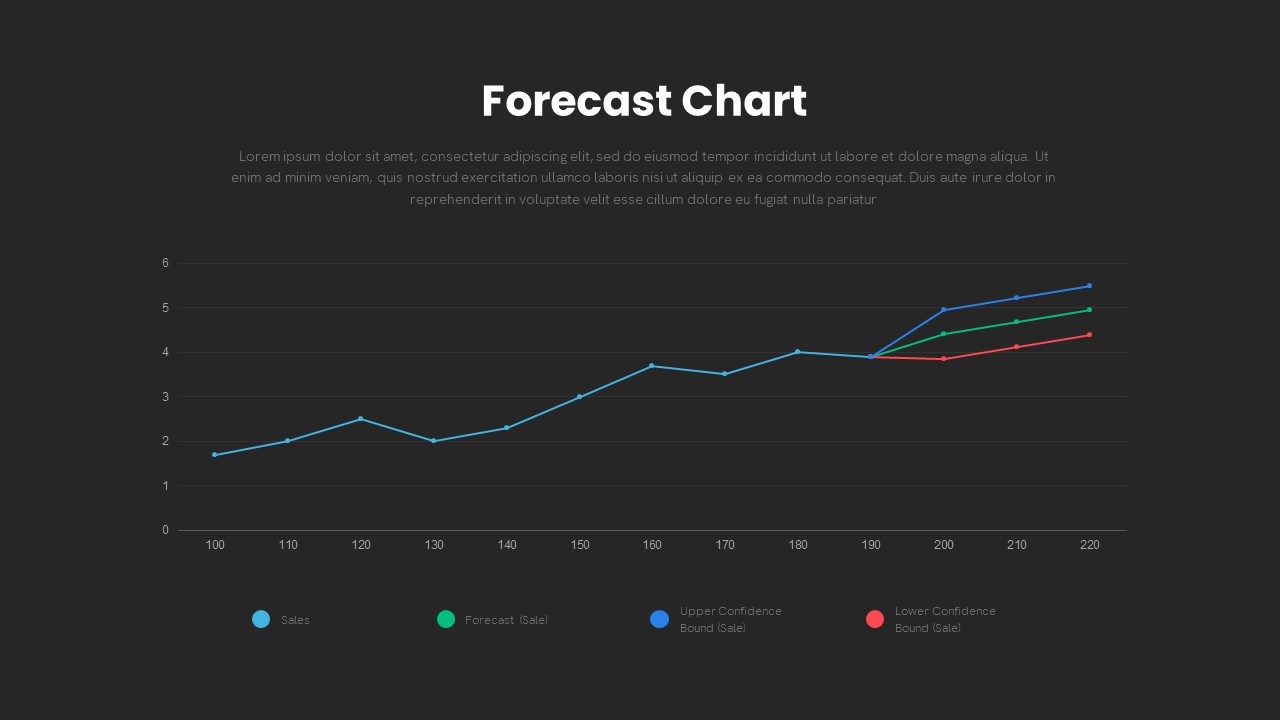
This forecast chart slide features a time-series line graph plotting historical sales and projected forecasts with upper and lower confidence bounds. A customizable title and subtitle area sits above a clean chart grid with subtle gray axes and tick marks. The sales series is rendered in light-blue with circular markers, the forecast series in green, and confidence intervals in bold blue and red lines, all defined in a clear legend. Chart elements—lines, markers, axes, and legend—are fully editable vectors, enabling quick color, weight, and marker adjustments. Users can update underlying data tables or linked spreadsheets within PowerPoint or Google Slides to reflect real metrics. Generous white space and sans-serif fonts ensure readability across devices, while master-slide integration allows brand palettes and logos to propagate throughout. Axis labels and tick intervals are fully editable to match your reporting standards, and data labels can be toggled on or off for precise value emphasis. Toggle axis formats between numeric, date, or category scales to suit your data. Minimalist design and editable data labels make it easy to highlight key points or seasonal peaks. Use fade-in animations to reveal forecast and confidence series progressively, guiding narrative flow. The chart’s editable legend can be repositioned or restyled to complement custom branding or slide layouts. This slide requires no extra plugins and retains fidelity when exported. Optimized for both presentation and print, this asset empowers teams to communicate sales projections, demand planning, and KPI trends with clarity and impact.
Who is it for
Financial analysts, sales managers, and business intelligence teams will find this slide invaluable for presenting actuals versus forecasts. Data scientists, operations managers, and executive leaders can leverage it to share predictive insights and confidence ranges.
Other Uses
Repurpose this design to visualize revenue pipelines, resource utilization forecasts, market growth projections, or performance benchmarks. Adapt it for risk assessments, capacity planning, or budget outlook presentations.
Login to download this file

Item ID
SB03659
Related Templates

Budget Forecast Dashboard & Donut Charts Template for PowerPoint & Google Slides
Pie/Donut
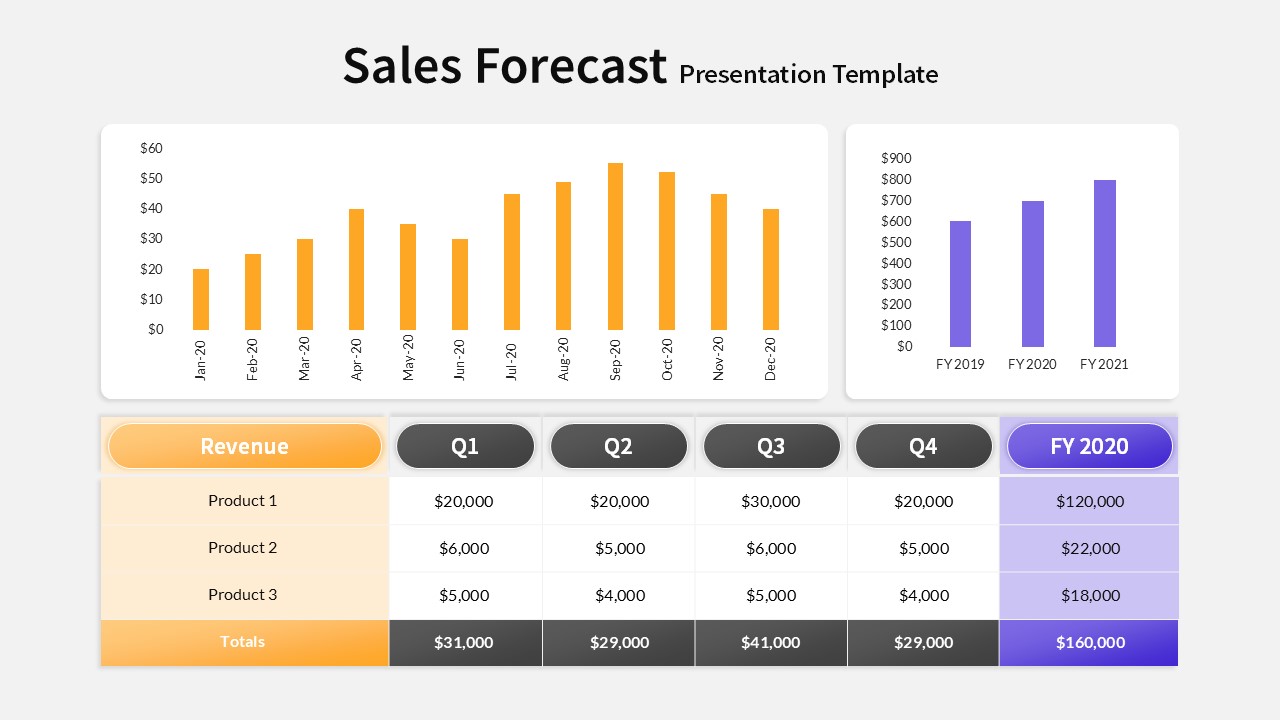
Editable Sales Forecast PPT Template & Slides
Revenue
Quad Chart Infographic Pack of 8 Slides Template for PowerPoint & Google Slides
Comparison Chart
Free Professional Gantt Chart Pack – 4 Slides Template for PowerPoint & Google Slides
Gantt Chart
Free
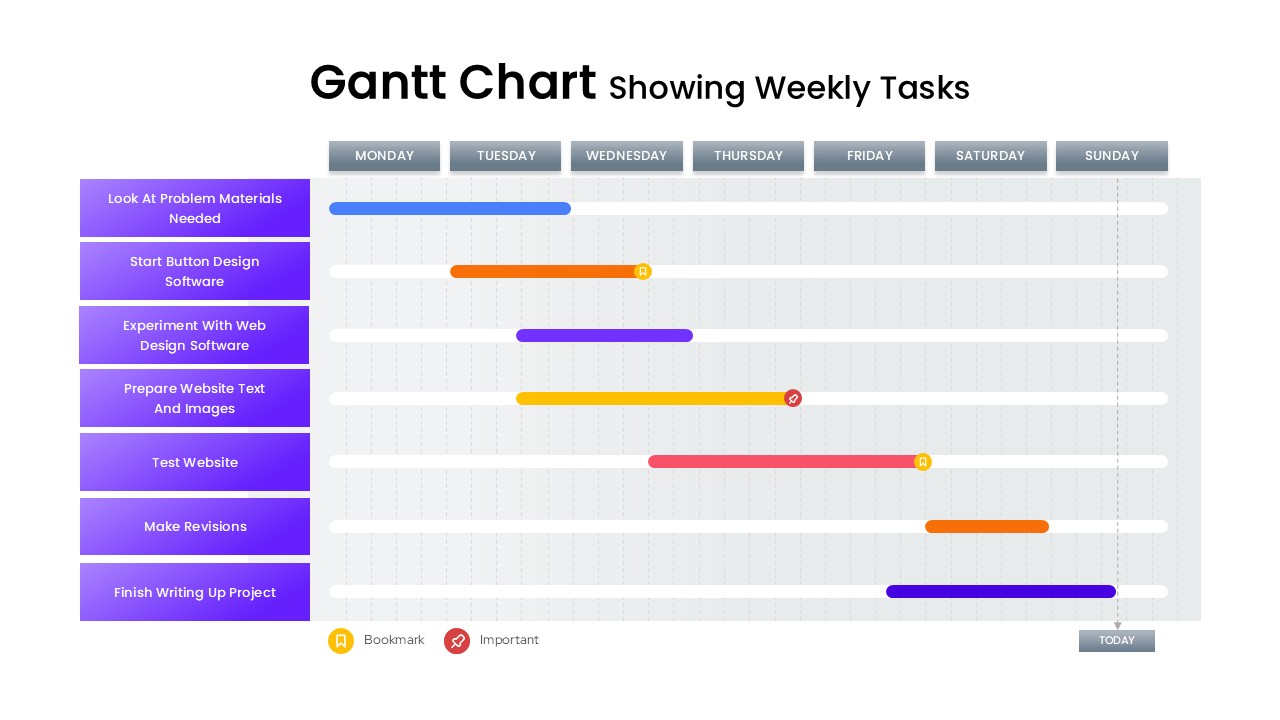
Gantt Chart Template Showing Weekly Tasks Template for PowerPoint & Google Slides
Gantt Chart
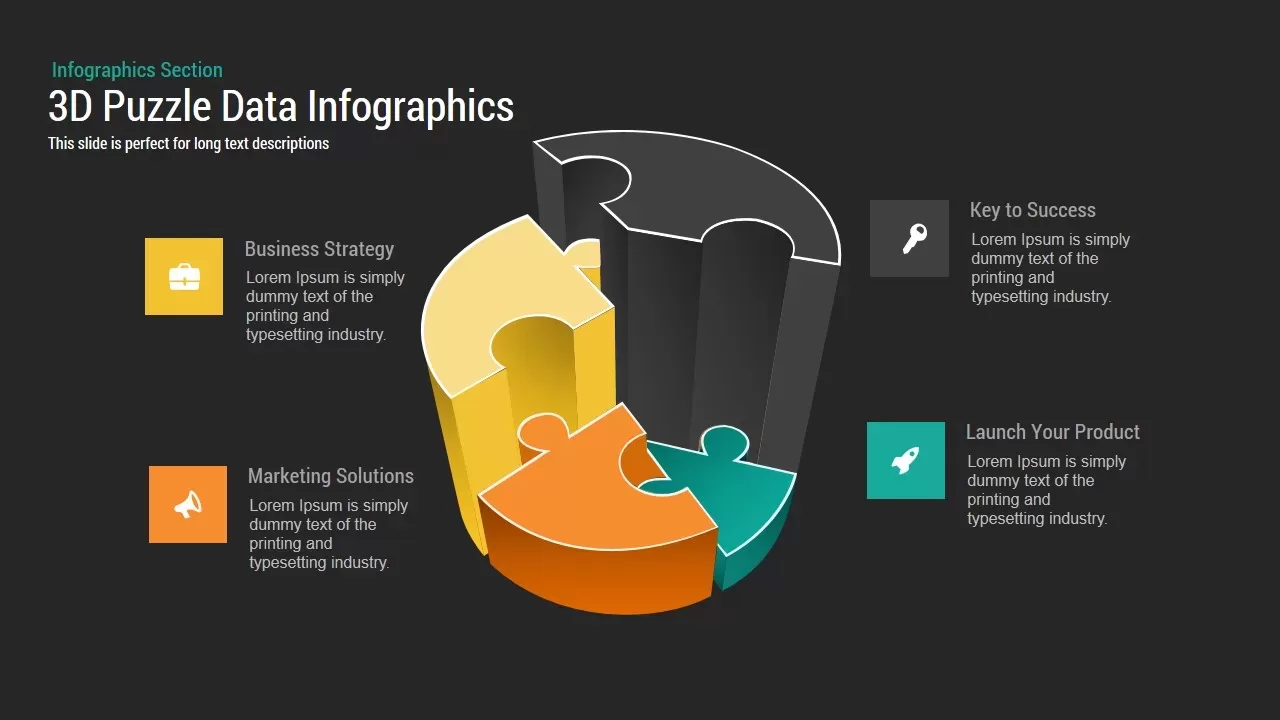
3D Puzzle Chart template for PowerPoint & Google Slides
Infographics

Product Roadmap Gantt Chart Timeline template for PowerPoint & Google Slides
Gantt Chart

Eight Section Donut Chart Infographic Template for PowerPoint & Google Slides
Pie/Donut
Line Chart Analysis template for PowerPoint & Google Slides
Charts
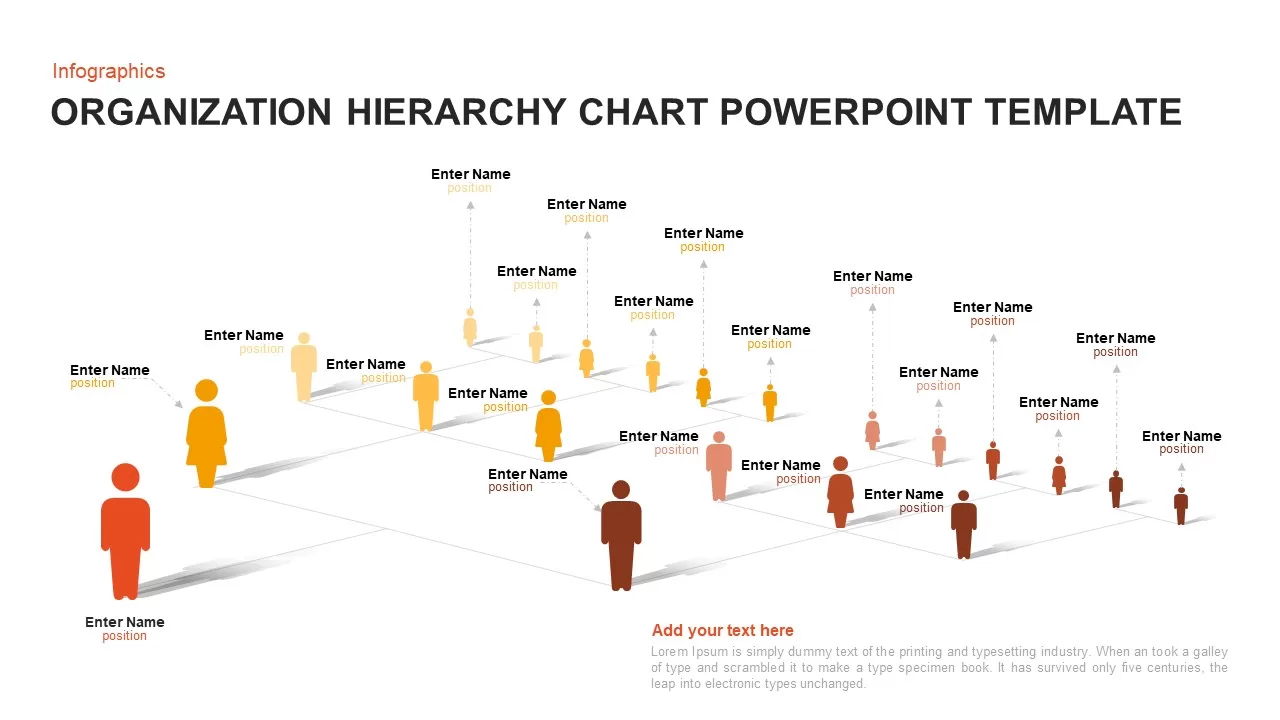
3D Organization Hierarchy Chart Template for PowerPoint & Google Slides
Org Chart
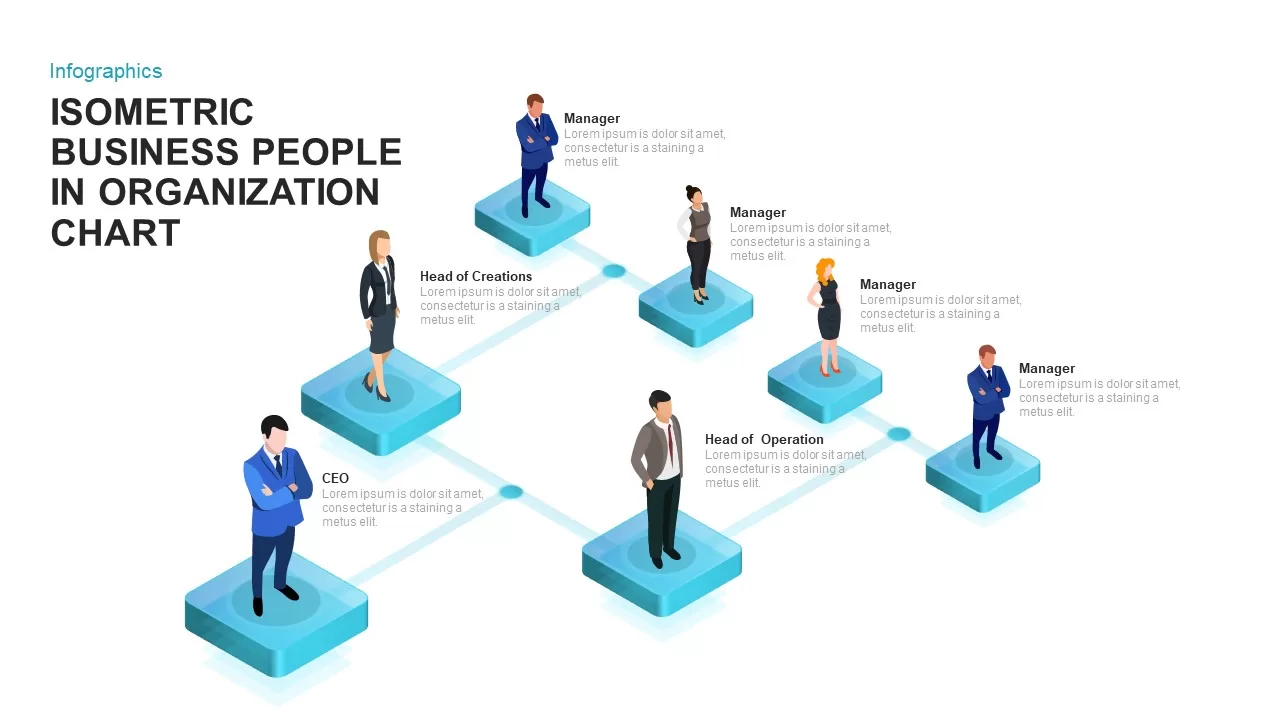
Isometric Business Organization Chart Template for PowerPoint & Google Slides
Org Chart
Distracting Factors at Work – Bar Chart Template for PowerPoint
Bar/Column
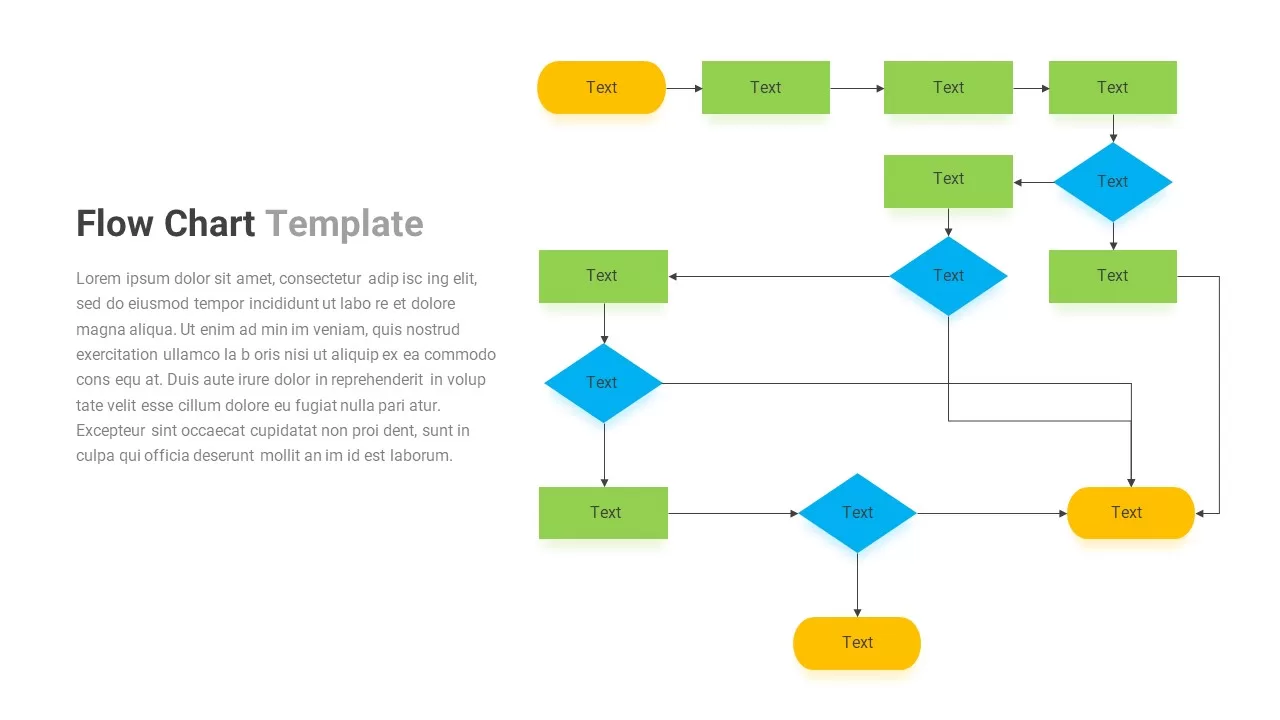
Flow Chart template for PowerPoint & Google Slides
Flow Charts
MABA Attractiveness Matrix Chart Template for PowerPoint & Google Slides
Comparison Chart
Animated Clustered Bar Chart Template for PowerPoint & Google Slides
Bar/Column
Simple Area Chart Data Trends Analysis Template for PowerPoint & Google Slides
Comparison Chart
Grouped Column Chart Comparison Template for PowerPoint & Google Slides
Bar/Column
Five-Phase and Three-Phase Phases Chart Template for PowerPoint & Google Slides
Charts
Disaster Response Role Matrix RACI Chart Template for PowerPoint & Google Slides
Project Status
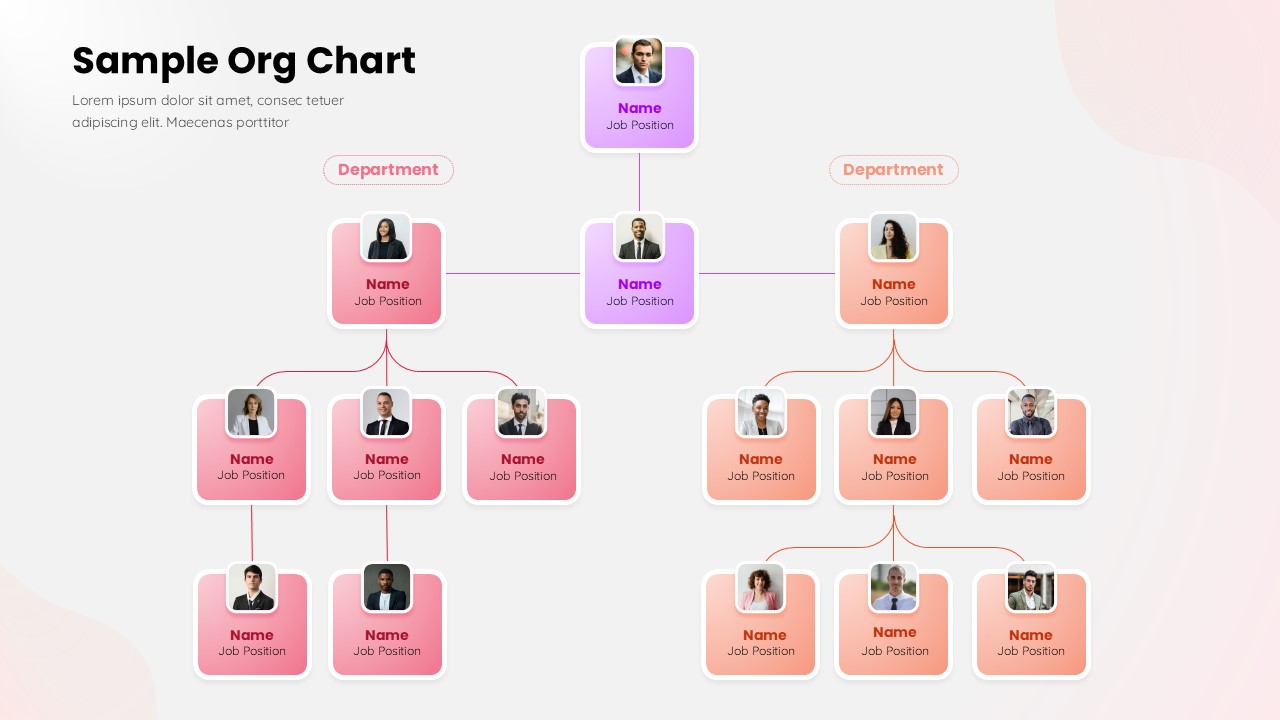
Sample Org Chart Template for PowerPoint & Google Slides
Org Chart