Segmented Pie Chart Infographic with Icons for PowerPoint & Google Slides


Description
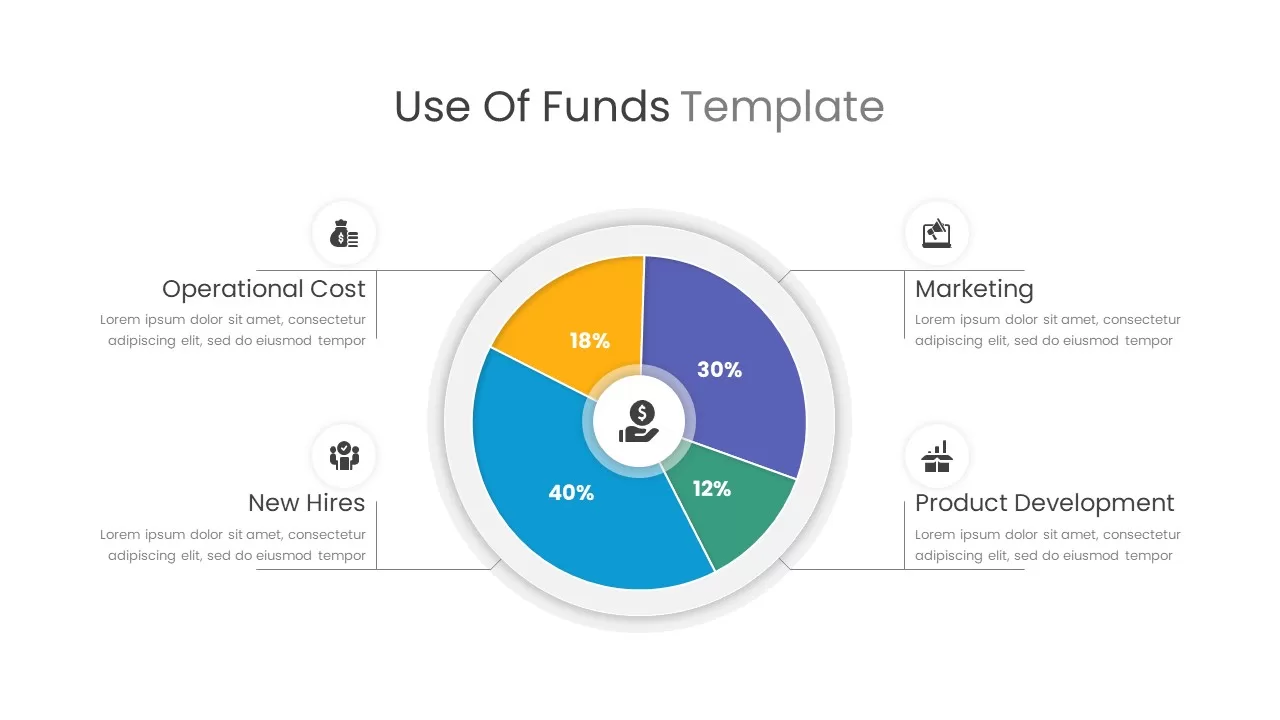
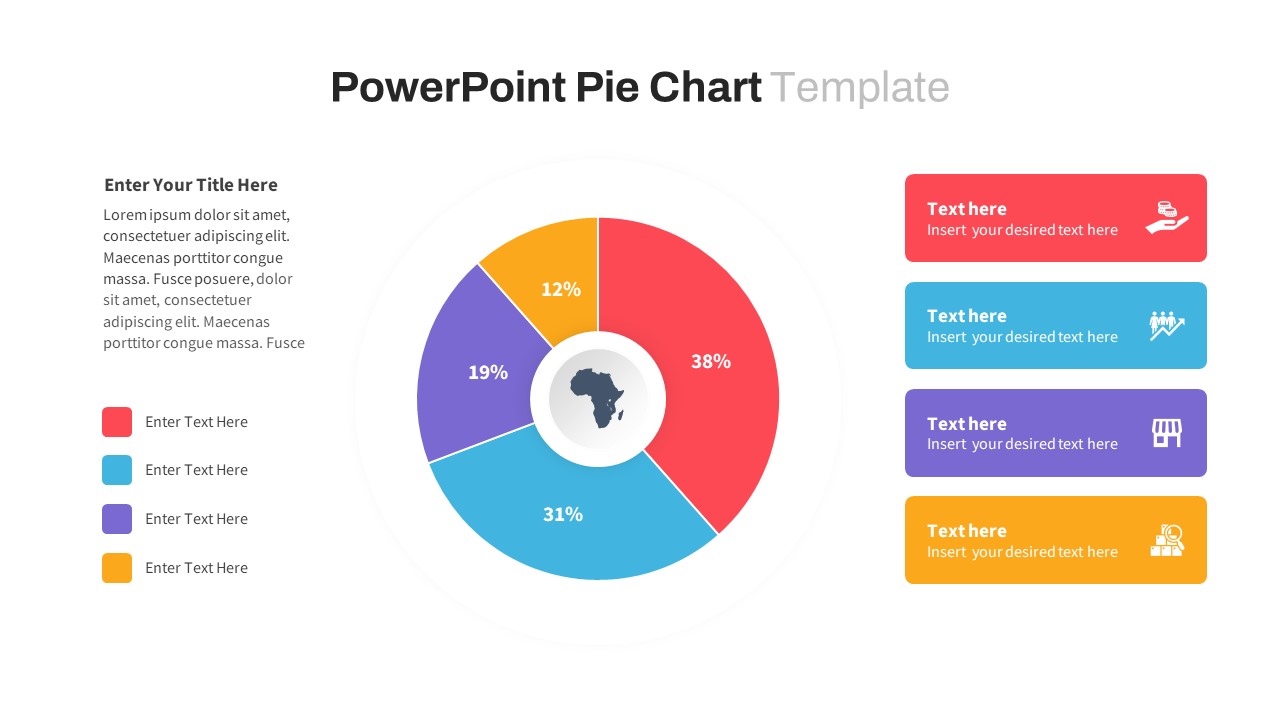
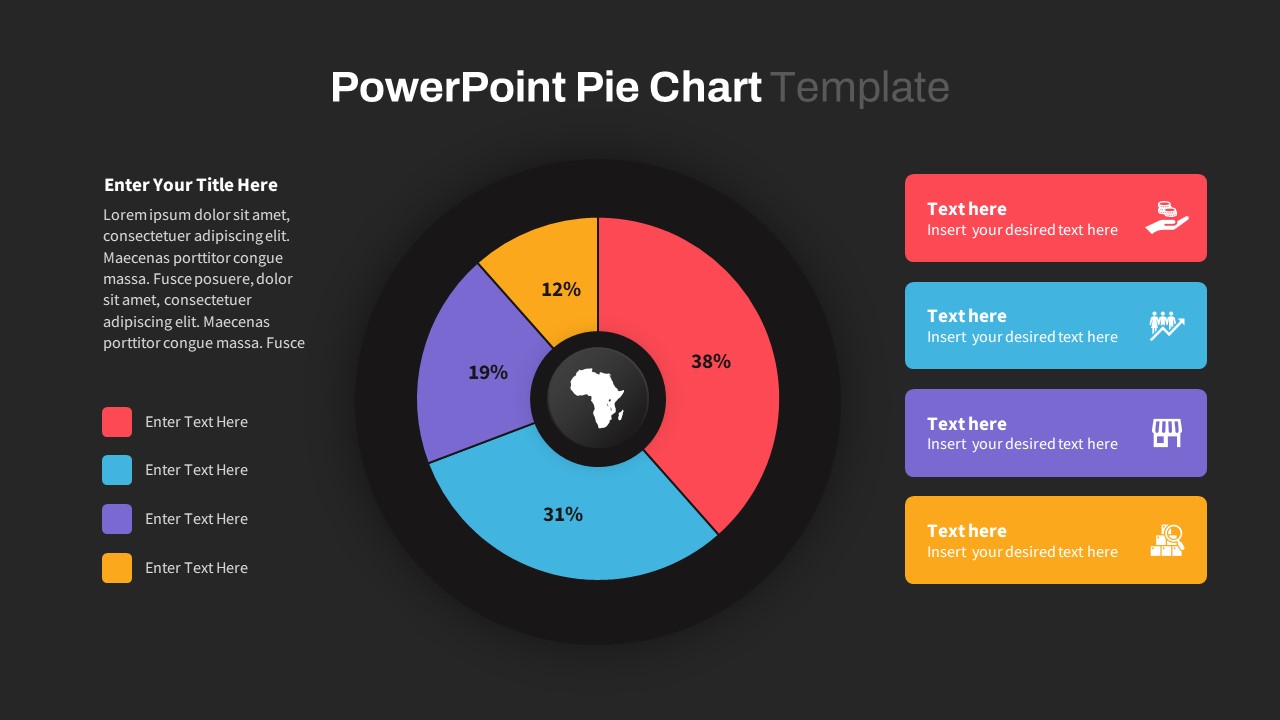
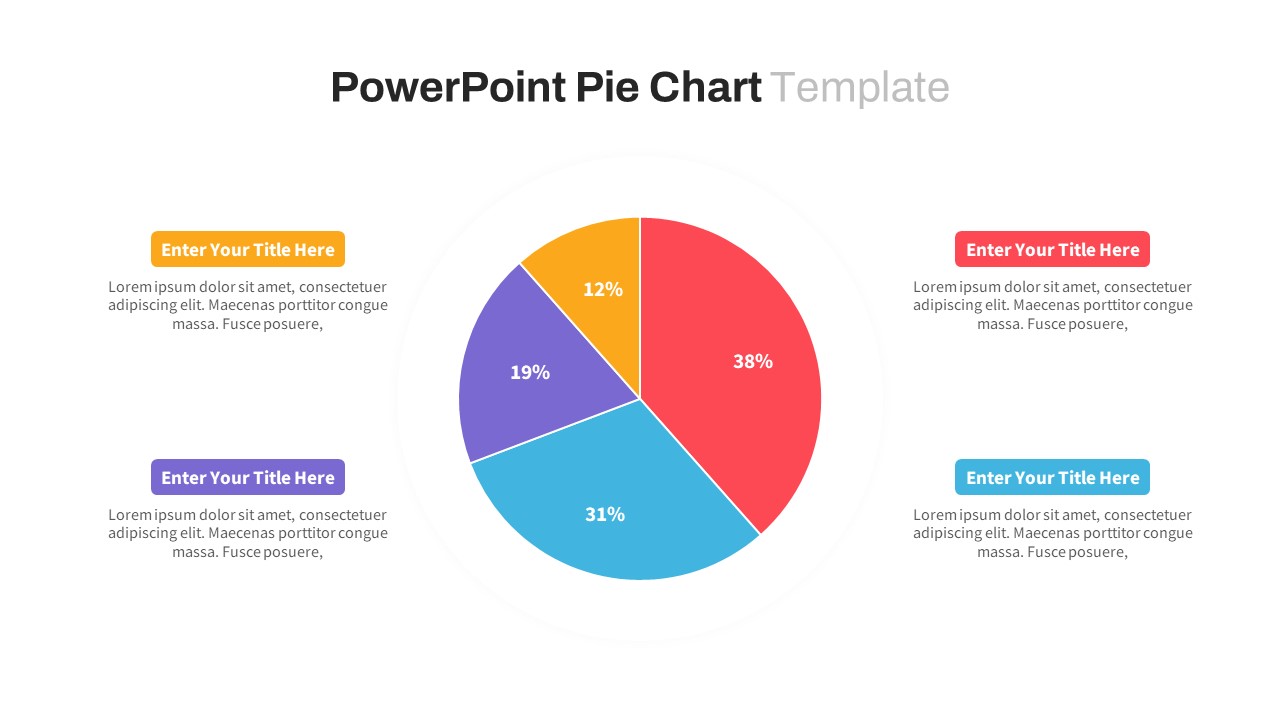
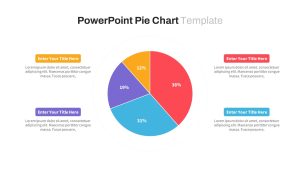
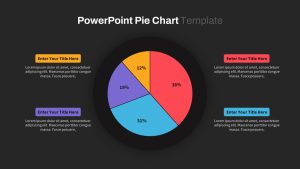
Visualize your data with clarity using this Segmented Pie Chart Infographic, designed for impactful storytelling across business, marketing, and analytics contexts. The central donut-style pie chart features four vividly colored segments—red (38%), blue (31%), purple (19%), and orange (12%)—with clean numerical labels and an Africa icon at the core for optional regional context. Each color-coded segment corresponds to matching callout boxes on the right side, complete with editable icons and text blocks for category descriptions or insights.
The layout uses a modern flat design with generous white space, ensuring optimal readability and professional polish. On the left, a placeholder for a short description or title provides room for narrative framing or additional context. The template’s structured, balanced format makes it ideal for comparative breakdowns, resource allocation summaries, market segmentation, or survey results.
Fully editable in PowerPoint and Google Slides, this chart allows effortless updates—change colors, icons, or values to suit any project need. Whether used in reports, dashboards, or executive presentations, this slide transforms data into compelling visual stories that engage and inform.
Who is it for
Perfect for data analysts, consultants, marketers, finance professionals, and project managers needing to communicate segmented data clearly and visually.
Other Uses
This slide can also be adapted for product portfolio analysis, budget overviews, demographic studies, risk assessments, or departmental KPIs. Modify the center icon to reflect any region or theme.
Login to download this file

Item ID
SB04002
Related Templates

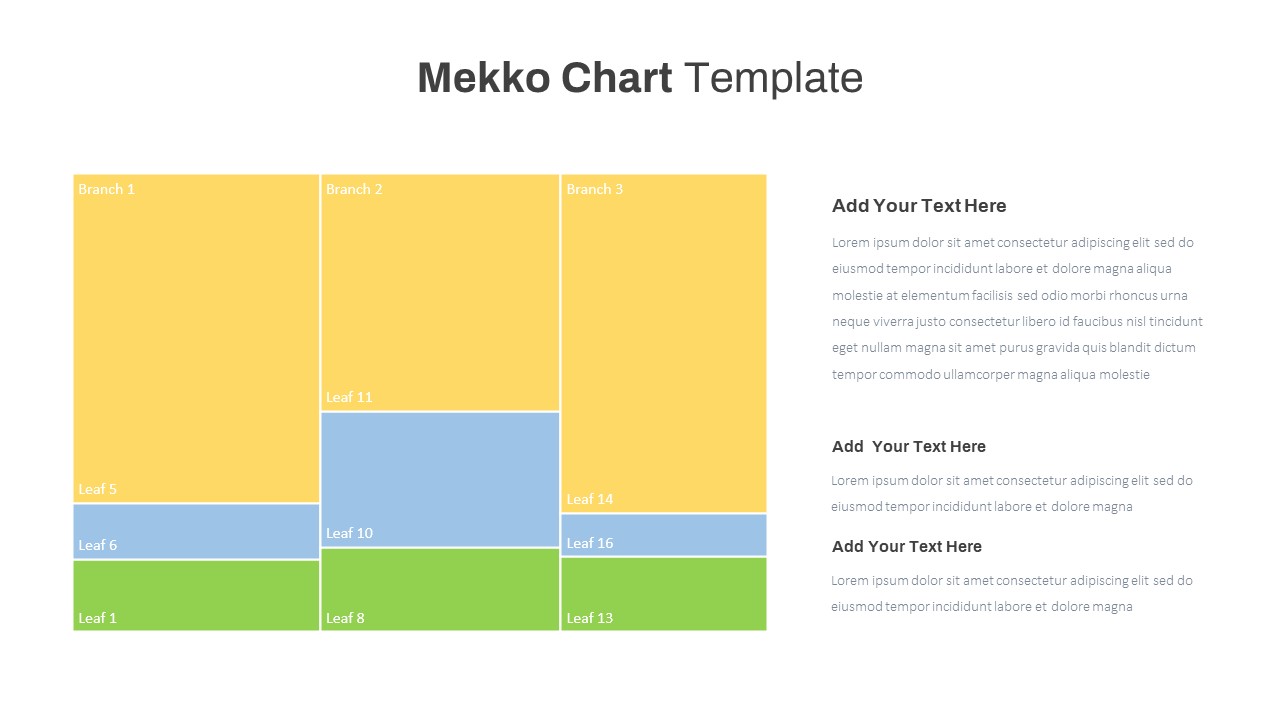
Mekko Chart with Segmented Branches & Leaves Template for PowerPoint & Google Slides
Bar/Column
Segmented Scatter Chart Data Visualization Template for PowerPoint & Google Slides
Business Strategy
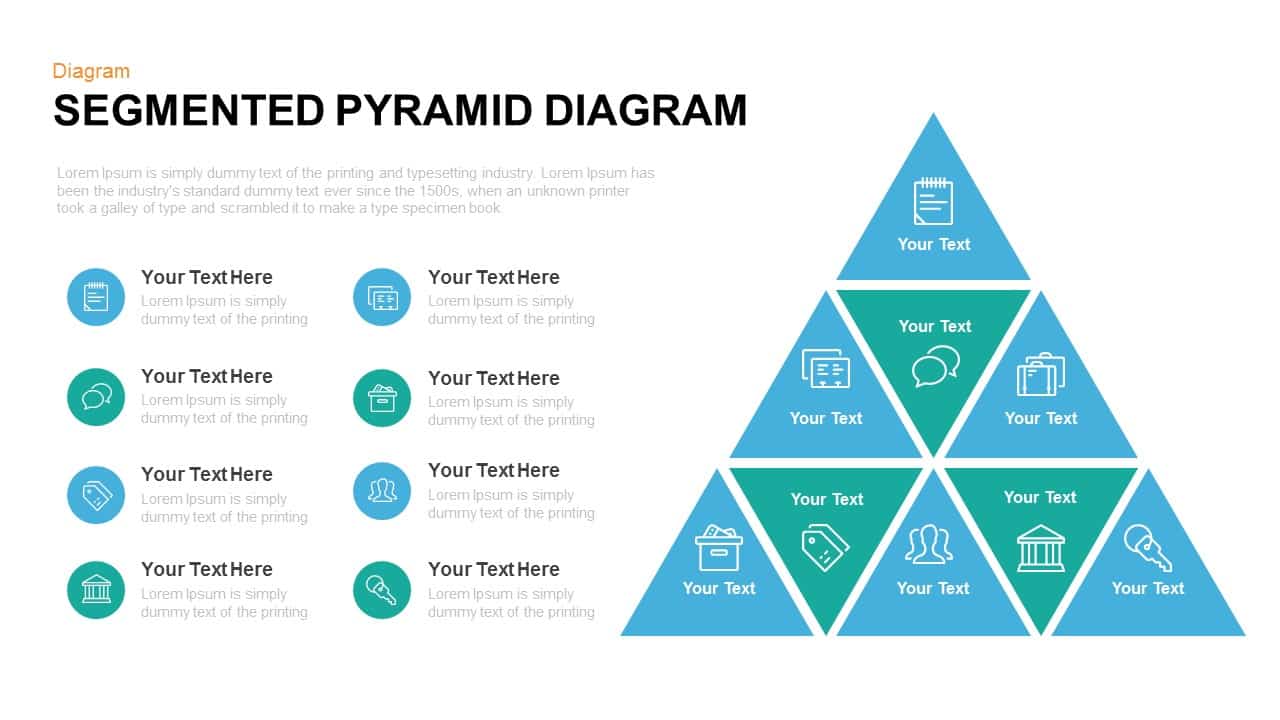
Segmented Pyramid Diagram Infographic Template for PowerPoint & Google Slides
Pyramid
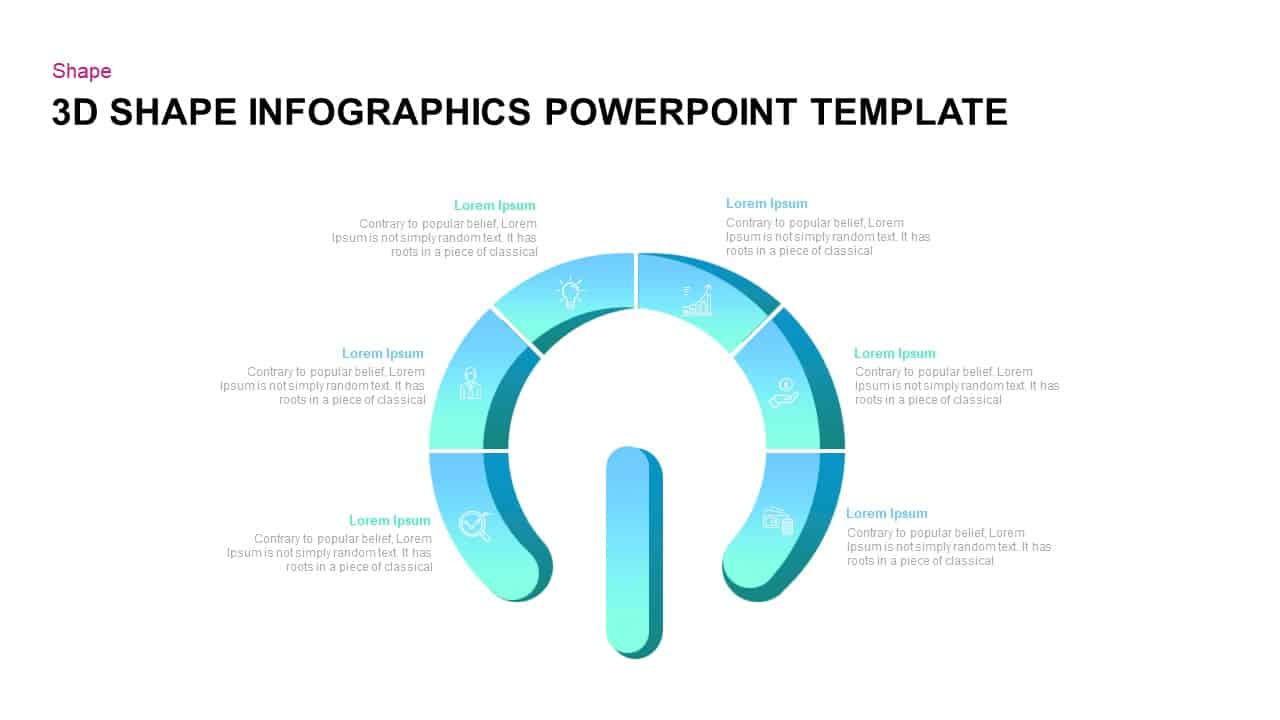
3D Segmented Shape Infographic Template for PowerPoint & Google Slides
Circular
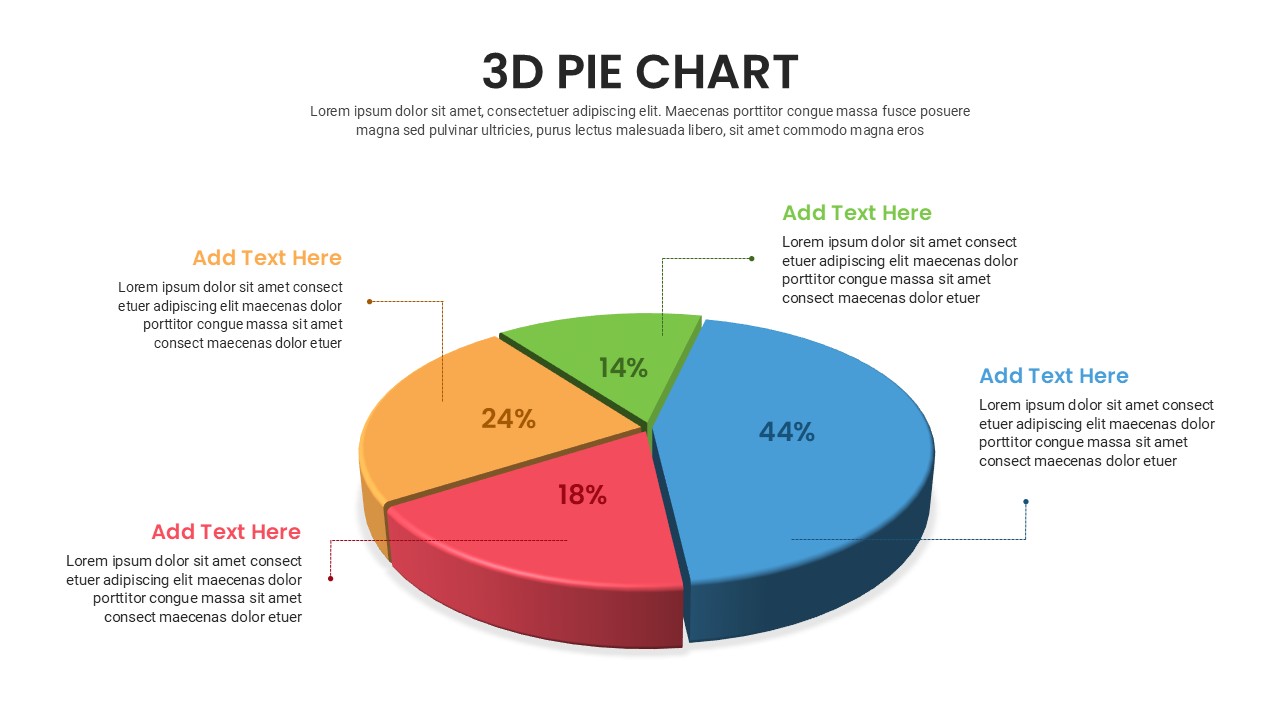
3D pie chart infographic template for PowerPoint & Google Slides
Pie/Donut
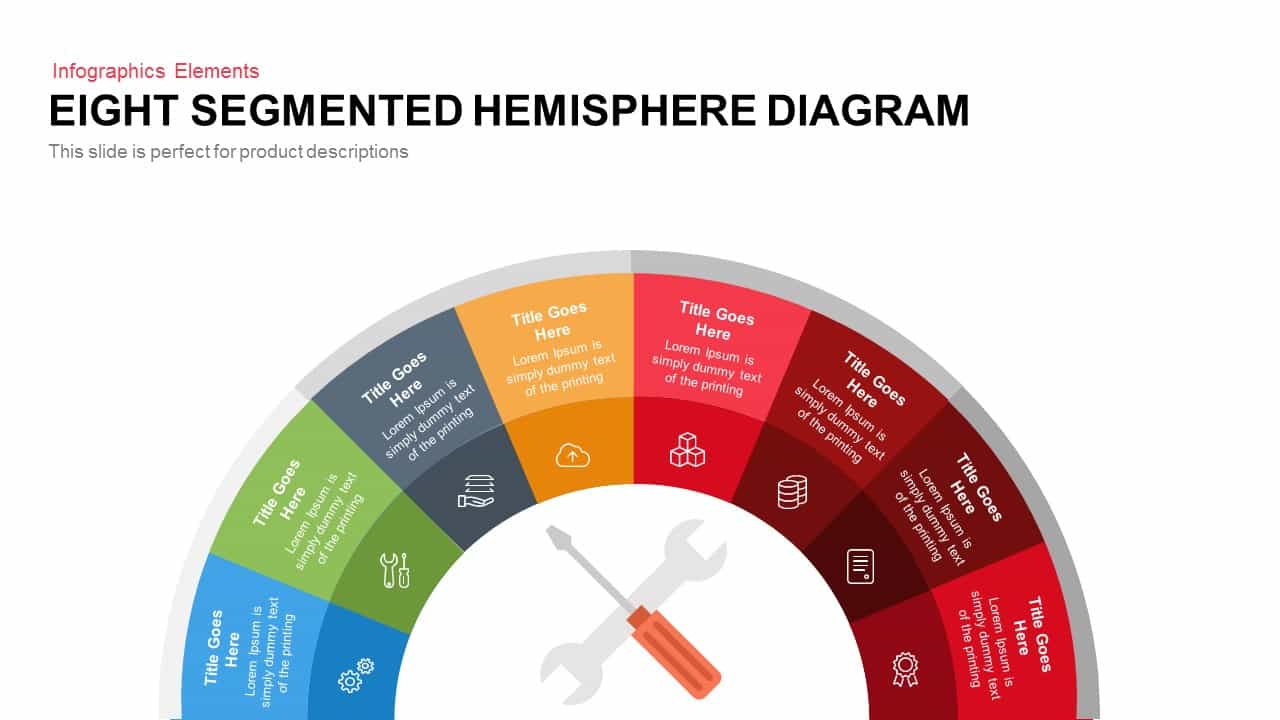
Eight Segmented Hemisphere Diagram Template for PowerPoint & Google Slides
Process
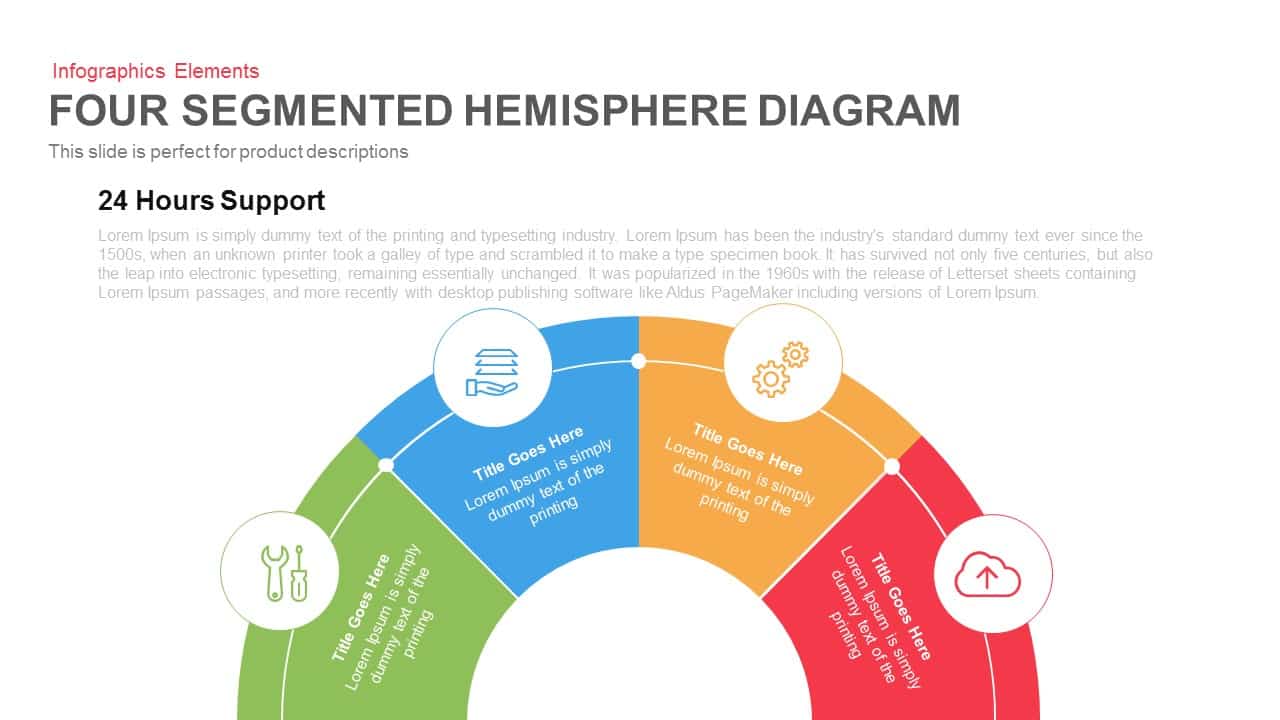
Four Segmented Hemisphere Diagram Template for PowerPoint & Google Slides
Process

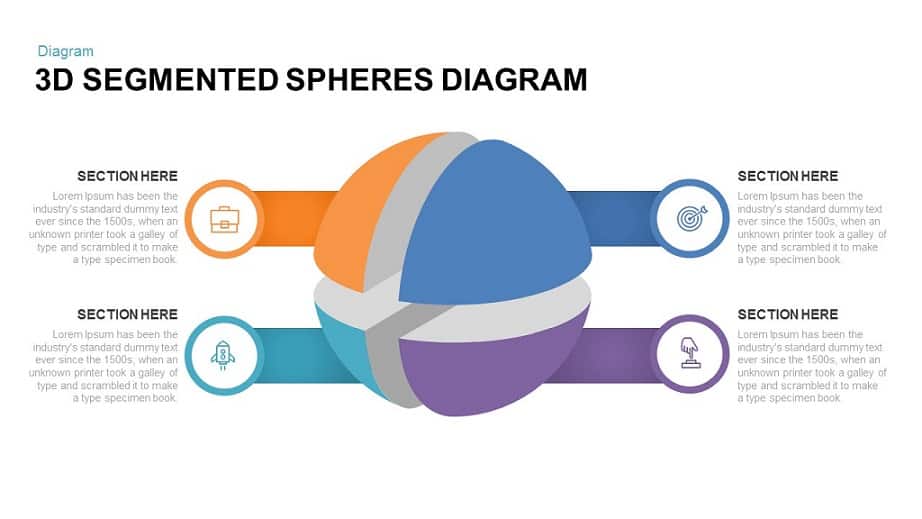
3D Segmented Spheres Diagram template for PowerPoint & Google Slides
Infographics
Free 3D Pie Chart PowerPoint Template & Google Slides
Pie/Donut
Free
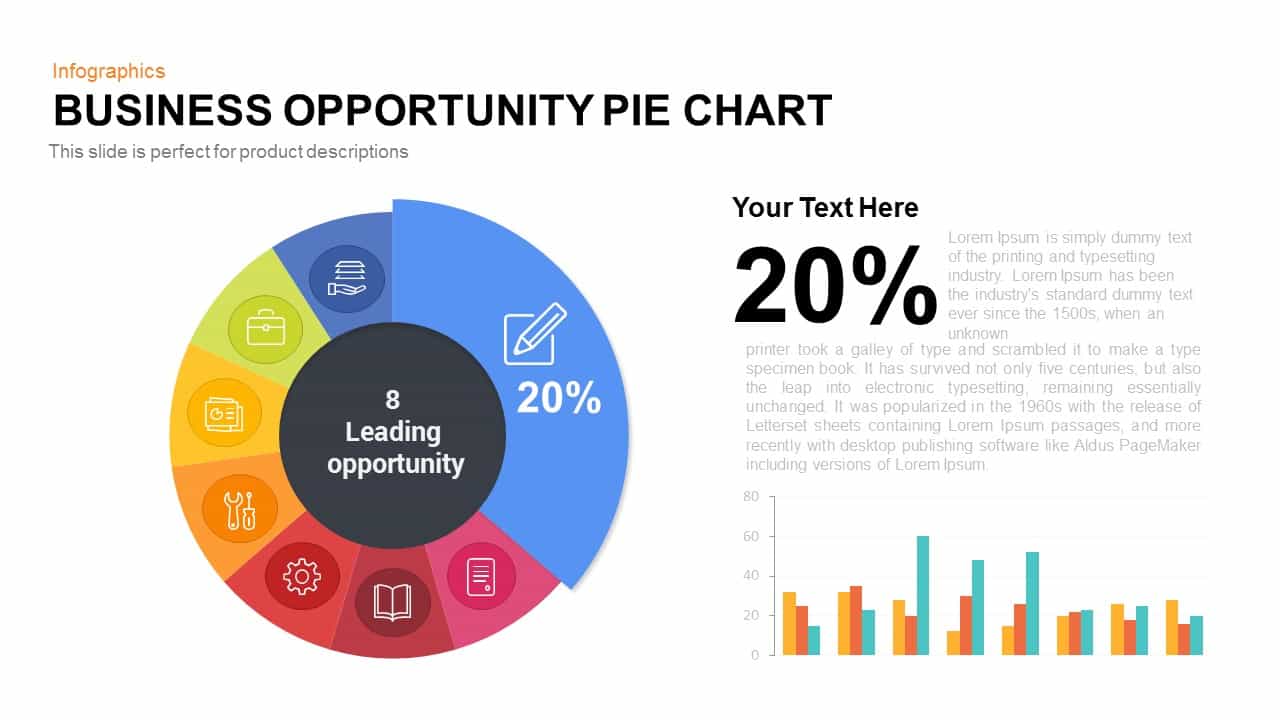
Business Opportunity Pie Chart Template for PowerPoint & Google Slides
Pie/Donut
Car Sales Market Share Pie Chart Template for PowerPoint & Google Slides
BCG
Dynamic Bar-of-Pie Chart Comparison Template for PowerPoint & Google Slides
Pie/Donut
Quarterly Comparison Pie Chart Template for PowerPoint & Google Slides
Pie/Donut
Multi-Series Line Chart with Icons Template for PowerPoint & Google Slides
Comparison Chart
Horizontal Bar Chart Slide with Icons Template for PowerPoint & Google Slides
Bar/Column
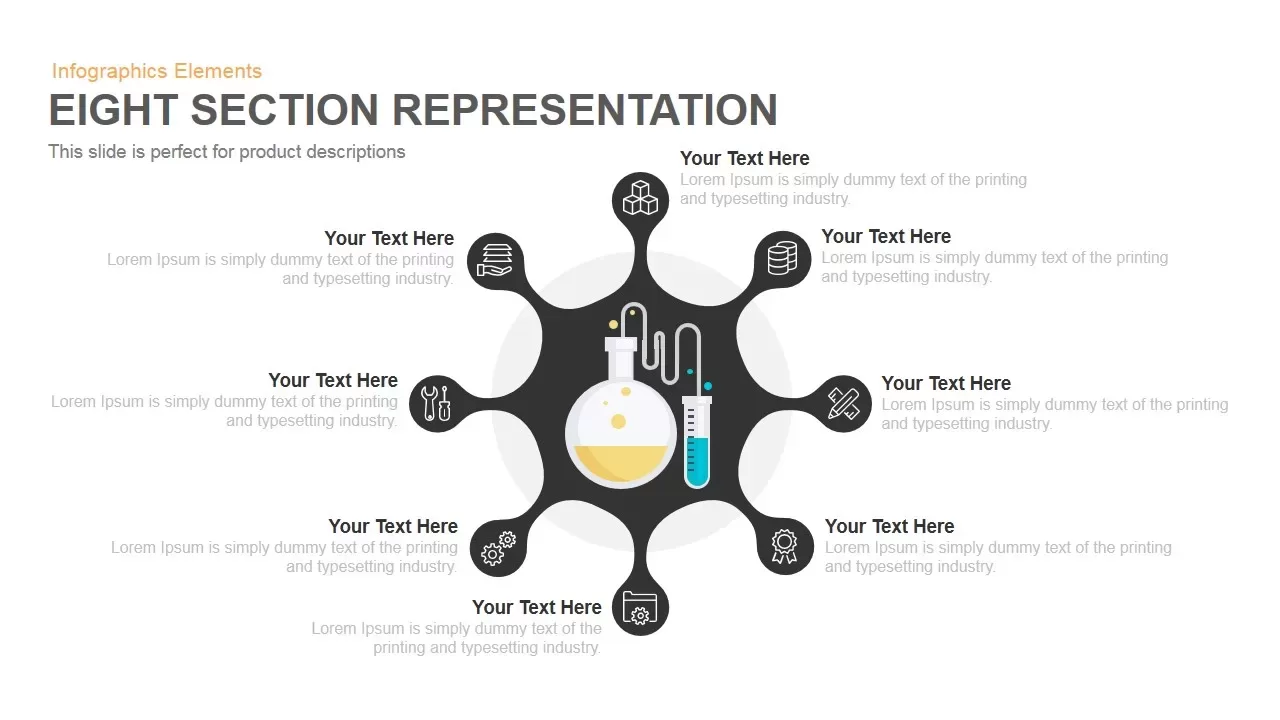
Eight Section Lab Infographic with Icons Template for PowerPoint & Google Slides
Circular
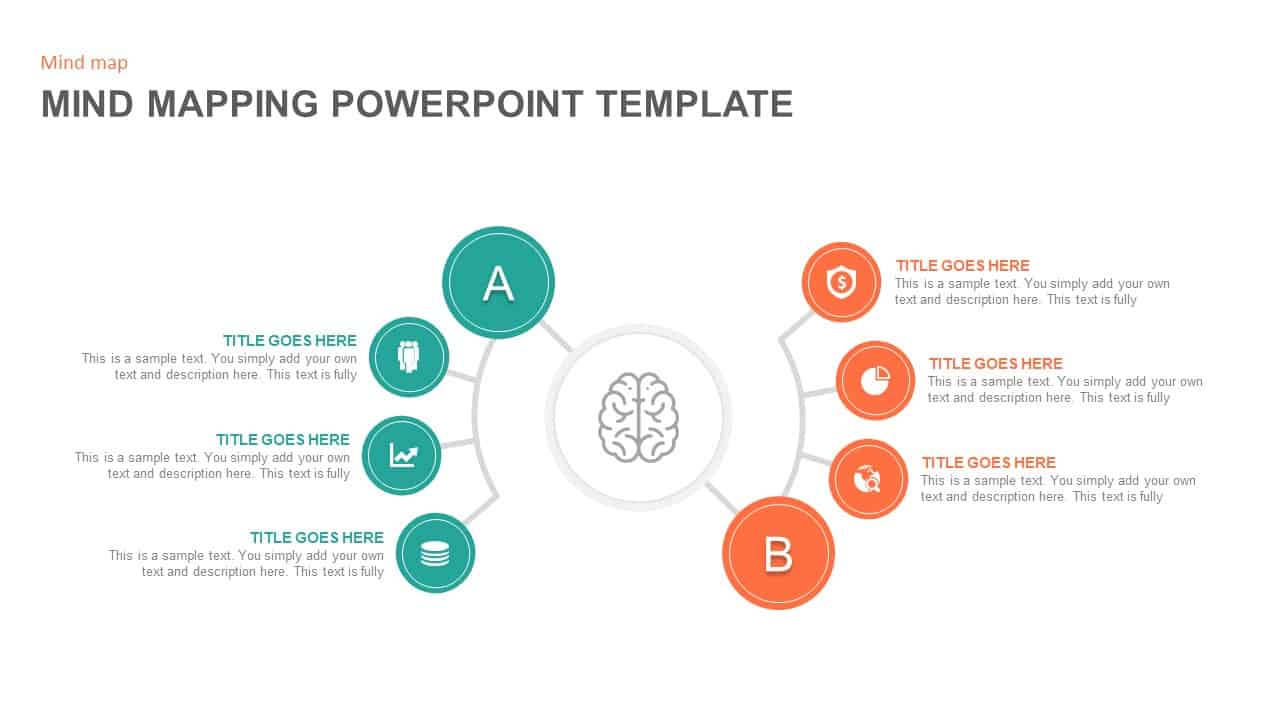
Mind Map PowerPoint Template and Google Slides
Mind Maps
Umbrella & Rain Icons Infographic Template for PowerPoint & Google Slides
Goals
SWOT Analysis Infographic with Circular Icons Template for PowerPoint & Google Slides
SWOT

Pie Segment Diagram Four-Step Process Template for PowerPoint & Google Slides
Pie/Donut
Gear Pie Diagram Data Visualization Template for PowerPoint & Google Slides
Pie/Donut
Social Media Market Share Pie Charts Template for PowerPoint & Google Slides
Pie/Donut
Project Progress Dashboard Pie Charts Template for PowerPoint & Google Slides
Project

Strategy Arrow and Gear Icons Template for PowerPoint & Google Slides
Infographics
Comprehensive Social Media Icons Slide Template for PowerPoint & Google Slides
Advertising
Six-Stage Semi-Circle Diagram with Icons Template for PowerPoint & Google Slides
Circular

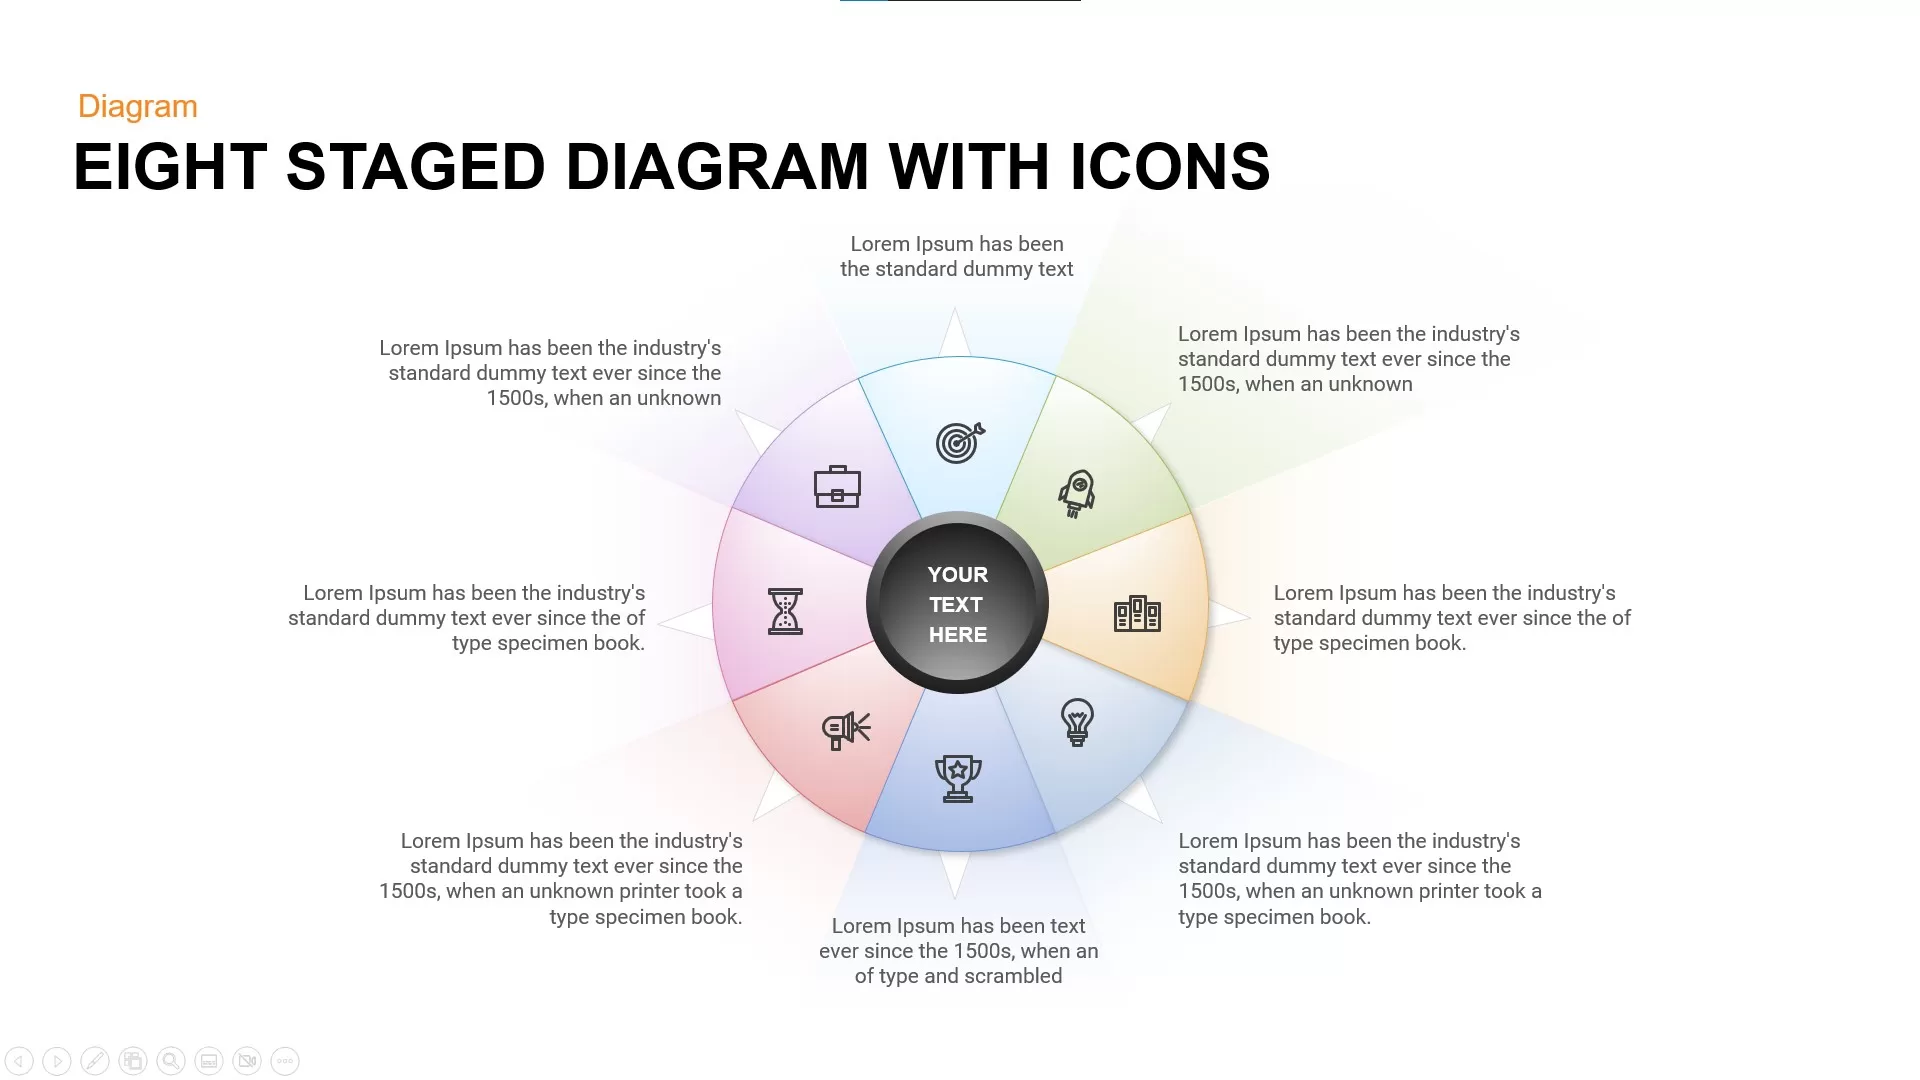
Eight Staged Diagram with Icons template for PowerPoint & Google Slides
Process
Free

Six Stage Circular Diagram with Icons Template for PowerPoint & Google Slides
Circular
Developer Icons Metaphor Slide Template for PowerPoint & Google Slides
Software Development
Internet Marketing Megaphone with Icons Template for PowerPoint & Google Slides
Process
30-60-90 Day Plan with Hexagon Icons Template for PowerPoint & Google Slides
Timeline
Creative Mind Mapping Diagram with Icons Template for PowerPoint & Google Slides
Mind Maps
Free 3D Social Media Icons template for PowerPoint & Google Slides
Digital Marketing
Free
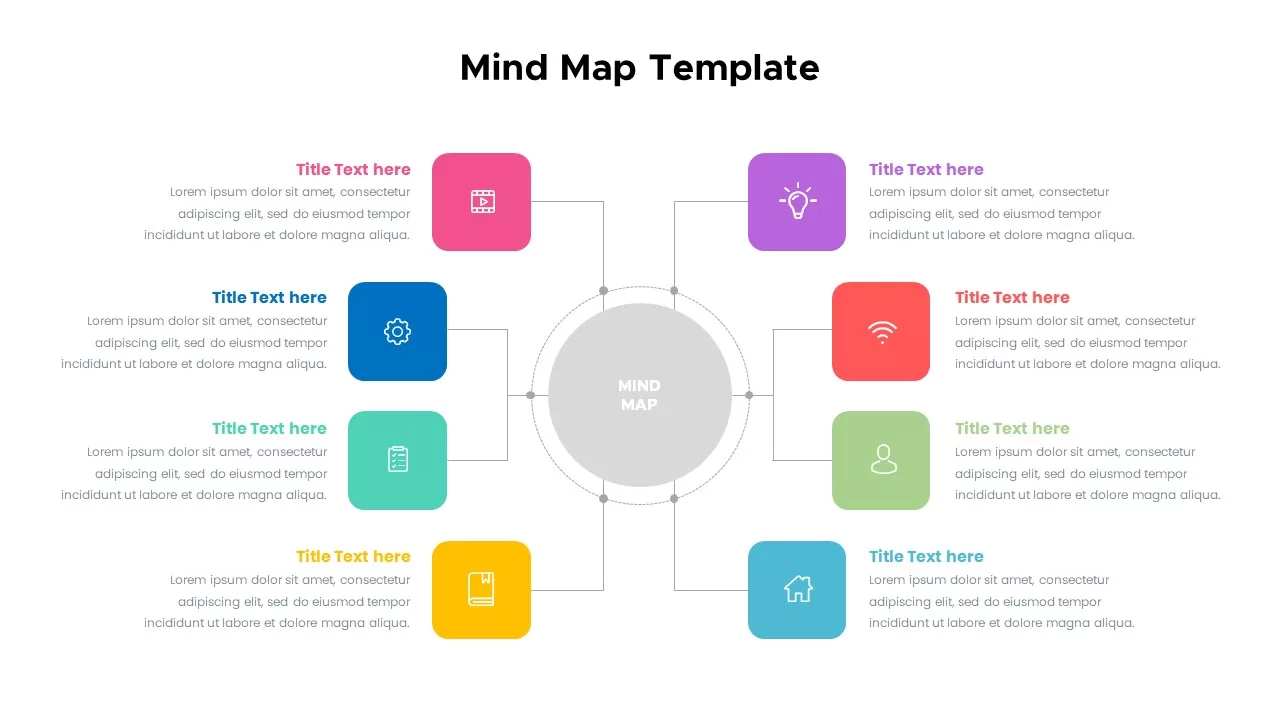
Colorful Mind Map with Icons Template for PowerPoint & Google Slides
Mind Maps
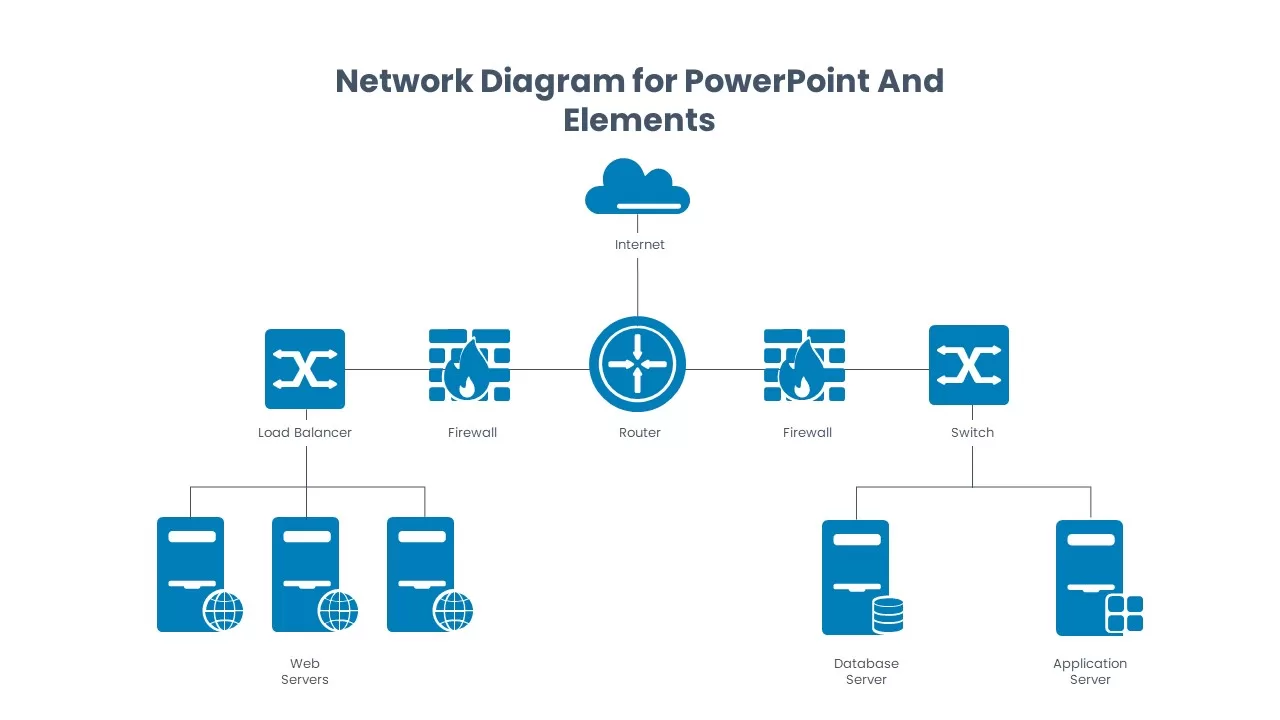
Network Diagram Template and Elements
Information Technology
Modern Accomplishment Slide with Icons Template for PowerPoint & Google Slides
Business
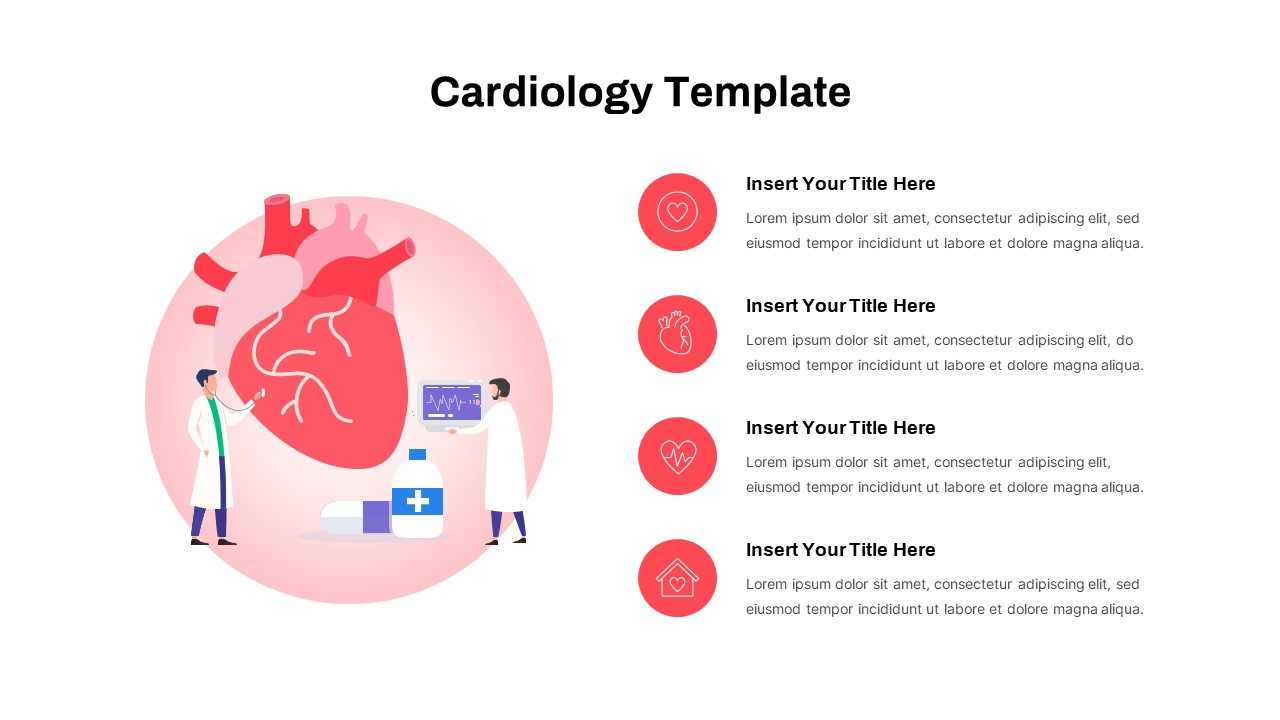
Cardiology Icons & Illustration Slide Template for PowerPoint & Google Slides
Health
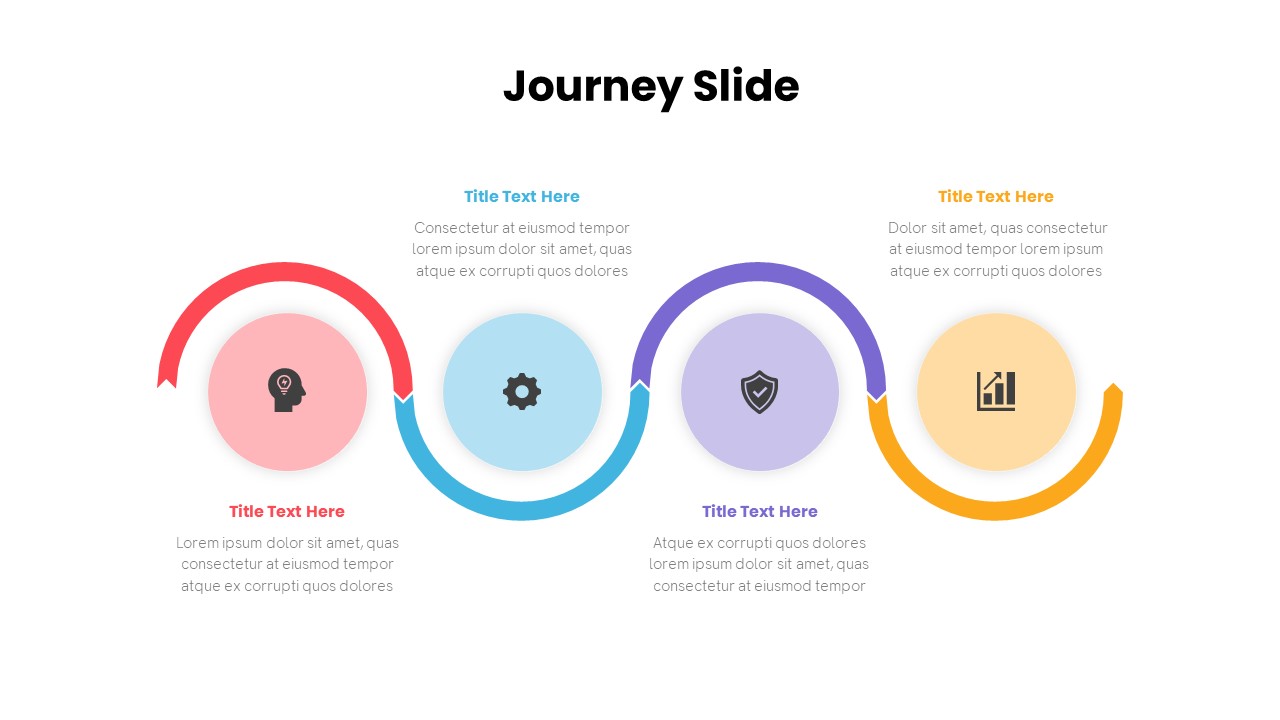
Free Journey Slide PowerPoint Presentation Template
Process
Free
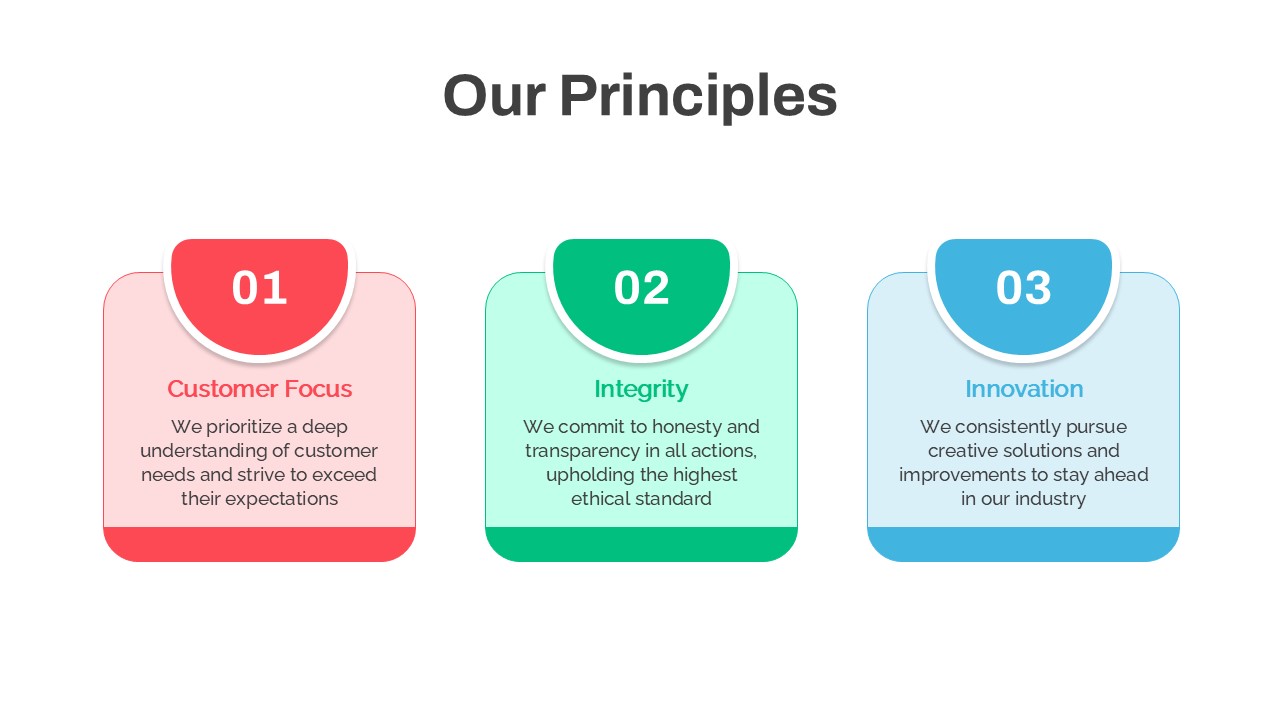
Our Principles Slide with Icons Layout Template for PowerPoint & Google Slides
Vision and Mission
Quad Chart Infographic Pack of 8 Slides Template for PowerPoint & Google Slides
Comparison Chart
Simple Organizational Chart Infographic Template for PowerPoint & Google Slides
Org Chart
Five-Stage People Infographic Chart template for PowerPoint & Google Slides
Process
Eight Section Donut Chart Infographic Template for PowerPoint & Google Slides
Pie/Donut
30-60-90 Day Donut Chart Plan Infographic Template for PowerPoint & Google Slides
Timeline
Use of Funds Donut Chart Infographic Template for PowerPoint & Google Slides
Circular
Statistics Infographic & KPI Bar Chart Template for PowerPoint & Google Slides
Bar/Column
3D Pyramid Column Chart Infographic Template for PowerPoint & Google Slides
Bar/Column
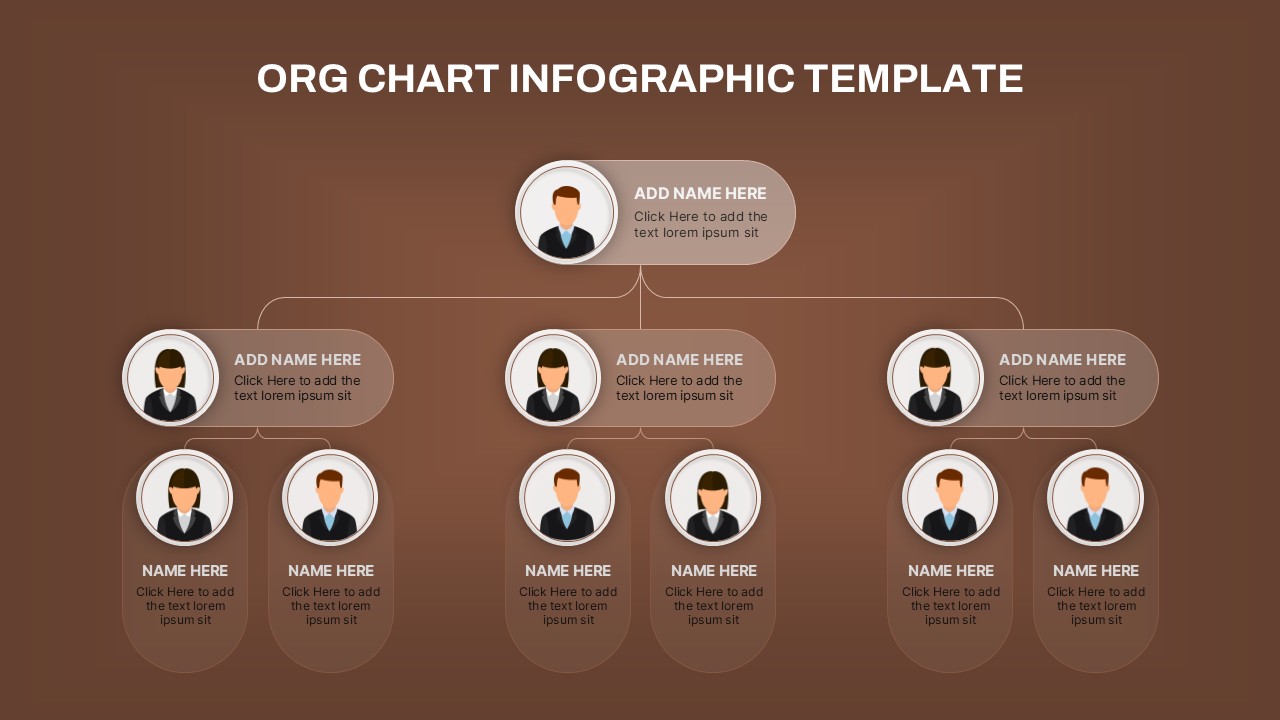
Hierarchical Org Chart Infographic Template for PowerPoint & Google Slides
Org Chart
Three Segment Donut Chart KPI Infographic Template for PowerPoint & Google Slides
Pie/Donut
Free Professional Gantt Chart Pack – 4 Slides Template for PowerPoint & Google Slides
Gantt Chart
Free
Google Ads Optimization & Performance Infographic Template for PowerPoint & Google Slides
Digital Marketing
SQ3R Study Strategy Infographic Slides Template for PowerPoint & Google Slides
Business Strategy
Double Diamond PowerPoint Template
Process
Sales Process PowerPoint Template
Process
Casino/Poker Chips Infographic Slides template for PowerPoint & Google Slides
Business Strategy
Agenda Infographic Pack of 2 Slides Template for PowerPoint & Google Slides
Agenda
Four Options Infographic Slides Template for PowerPoint & Google Slides
Comparison
Game Plan Infographic Slides Pack Template for PowerPoint & Google Slides
Infographics
Mobile Data Analysis Chart template for PowerPoint & Google Slides
Charts
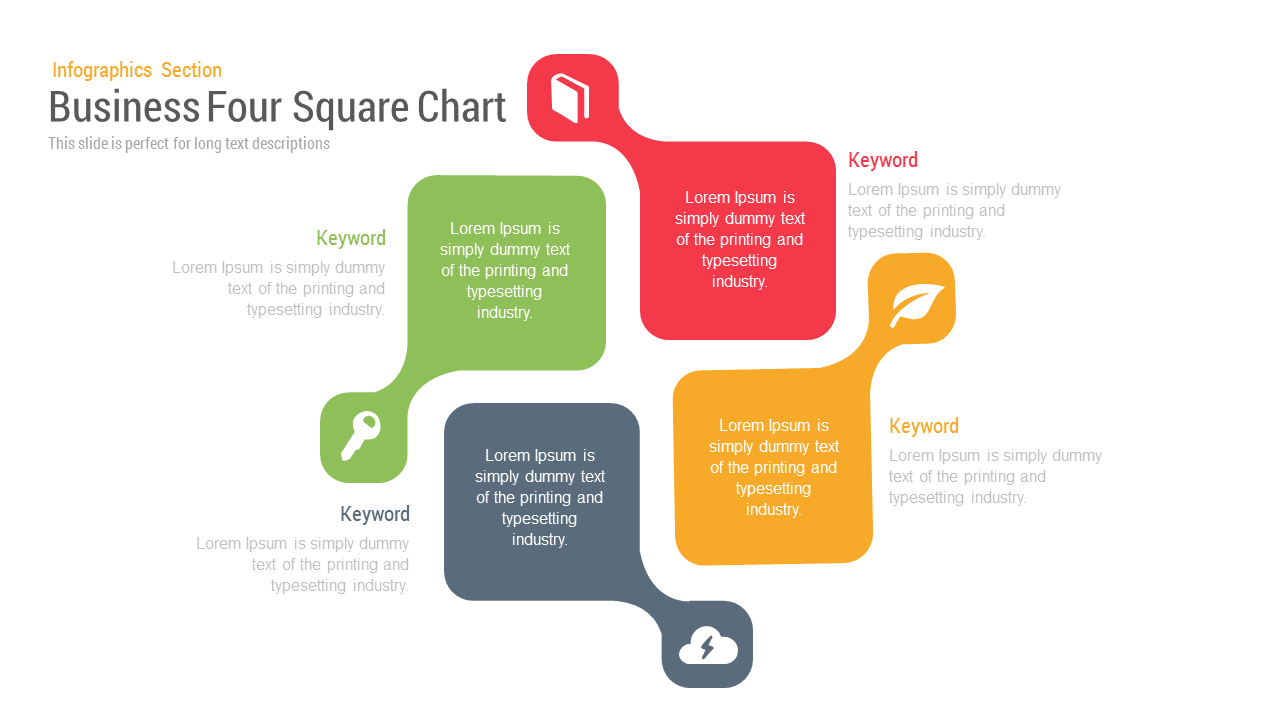
Business Four Square Chart template for PowerPoint & Google Slides
Business
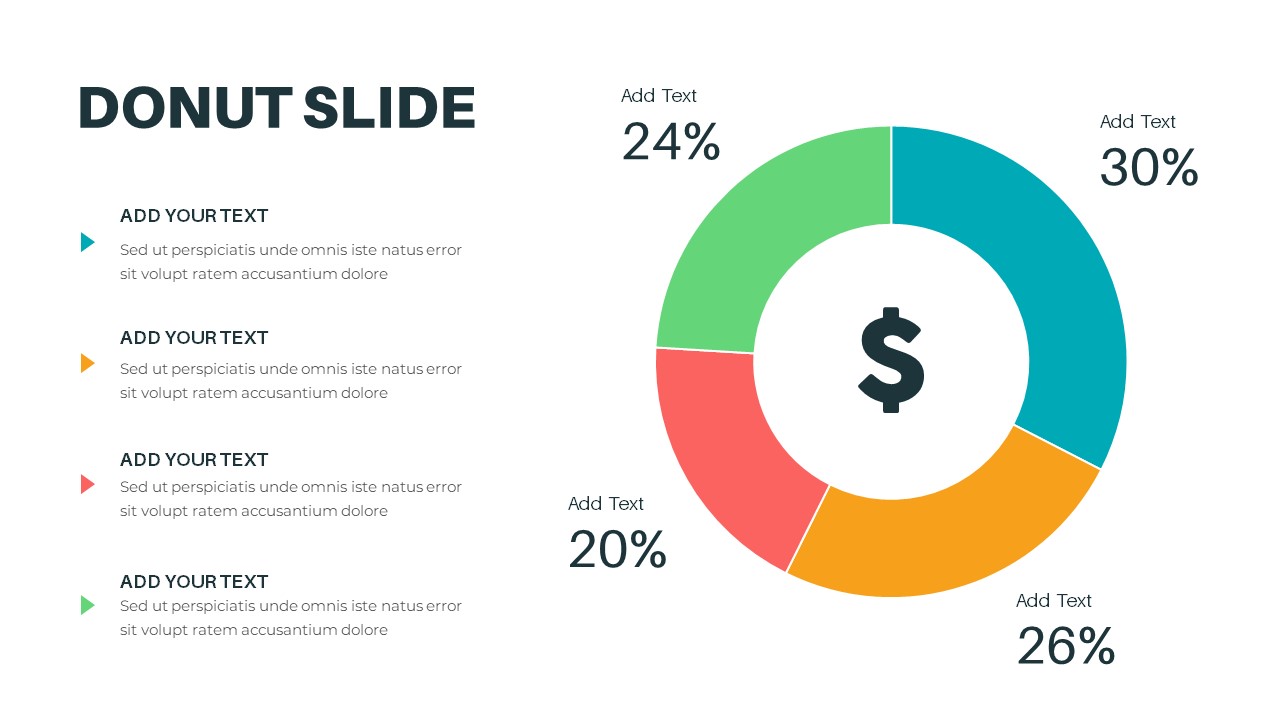
Donut Chart template for PowerPoint & Google Slides
Pie/Donut
Profit Performance Trend Chart Template for PowerPoint & Google Slides
Finance
3D Bar Chart Data Infographics Template for PowerPoint & Google Slides
Bar/Column
Comparison Bar Chart template for PowerPoint & Google Slides
Comparison Chart
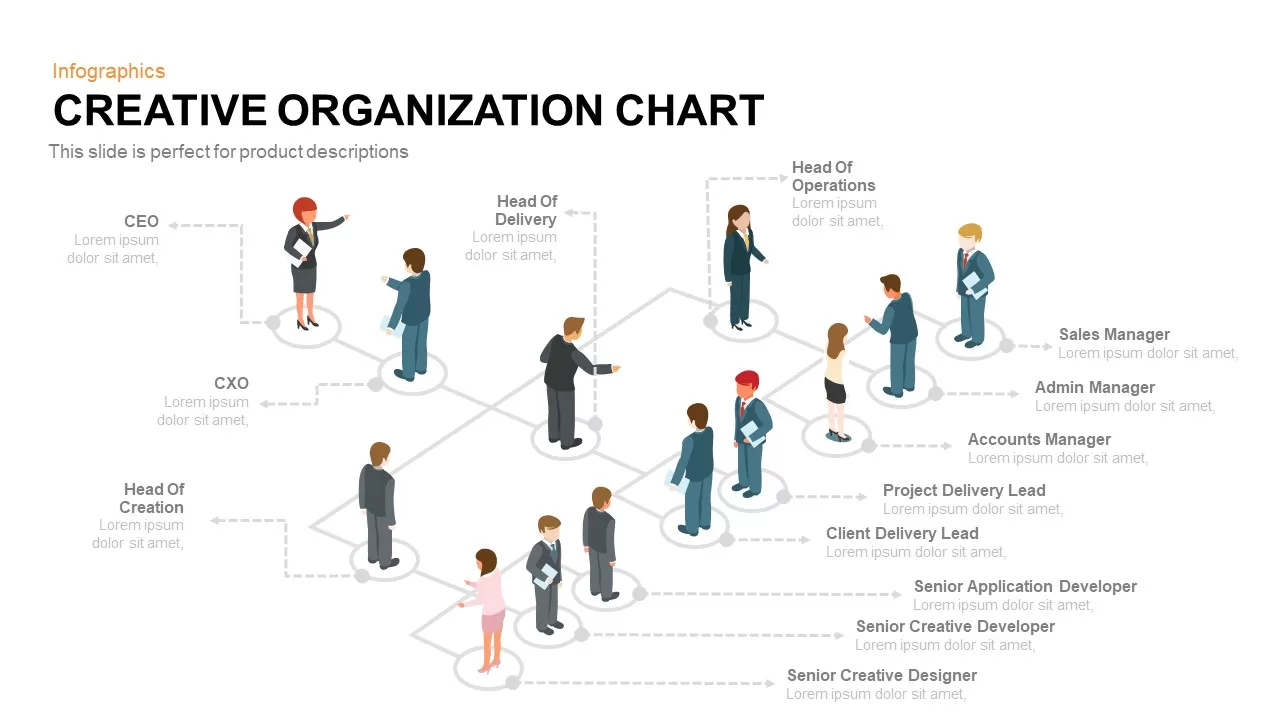
Creative Isometric Organization Chart PowerPoint Template
Org Chart
Market Development Matrix Chart Template for PowerPoint & Google Slides
Comparison Chart
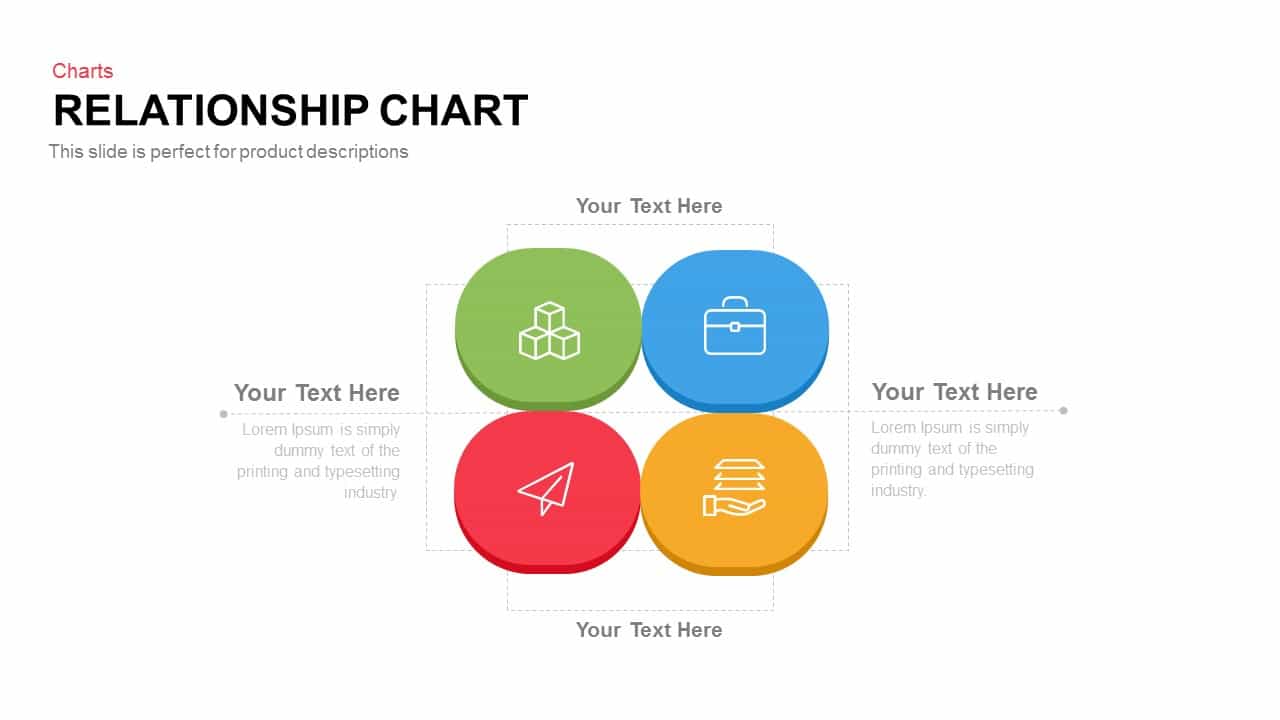
Relationship Chart template for PowerPoint & Google Slides
Flow Charts
3D Cone Chart Data Visualization template for PowerPoint & Google Slides
Bar/Column

Colorful Radial Bar Chart Template for PowerPoint & Google Slides
Bar/Column
Interactive Product Comparison Bar Chart Template for PowerPoint & Google Slides
Bar/Column
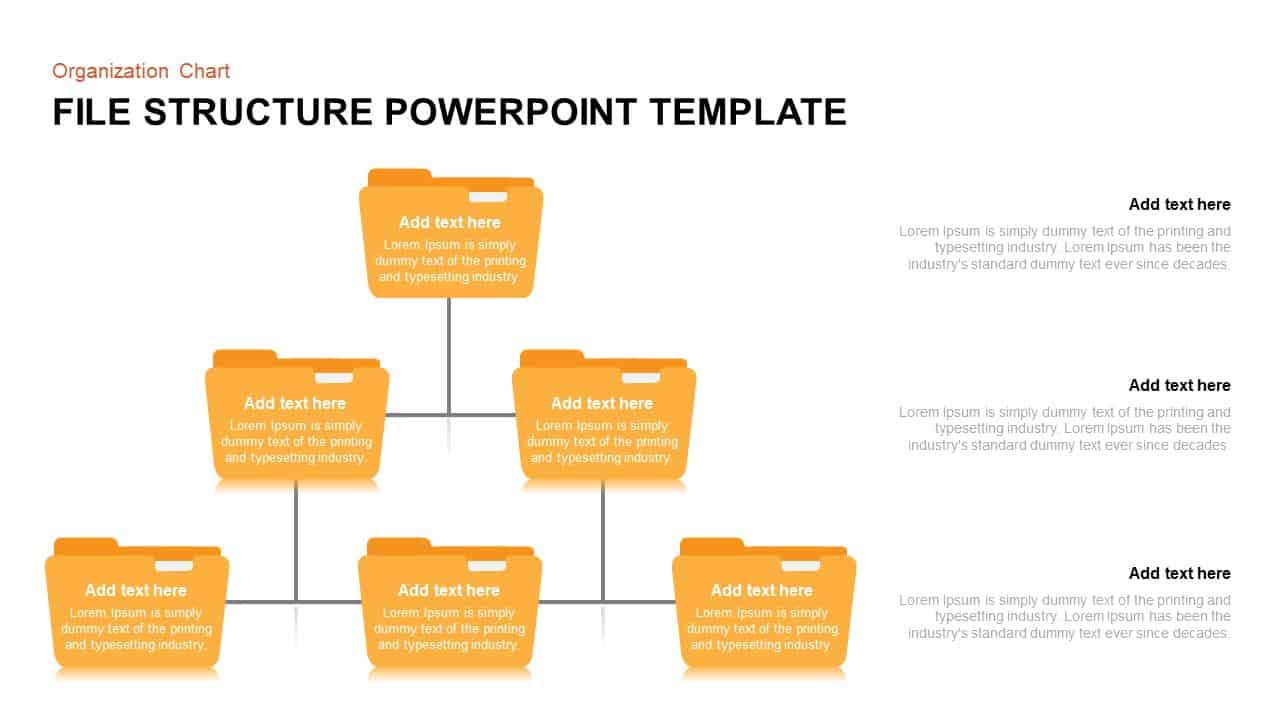
Folder Structure Template for PowerPoint
Org Chart
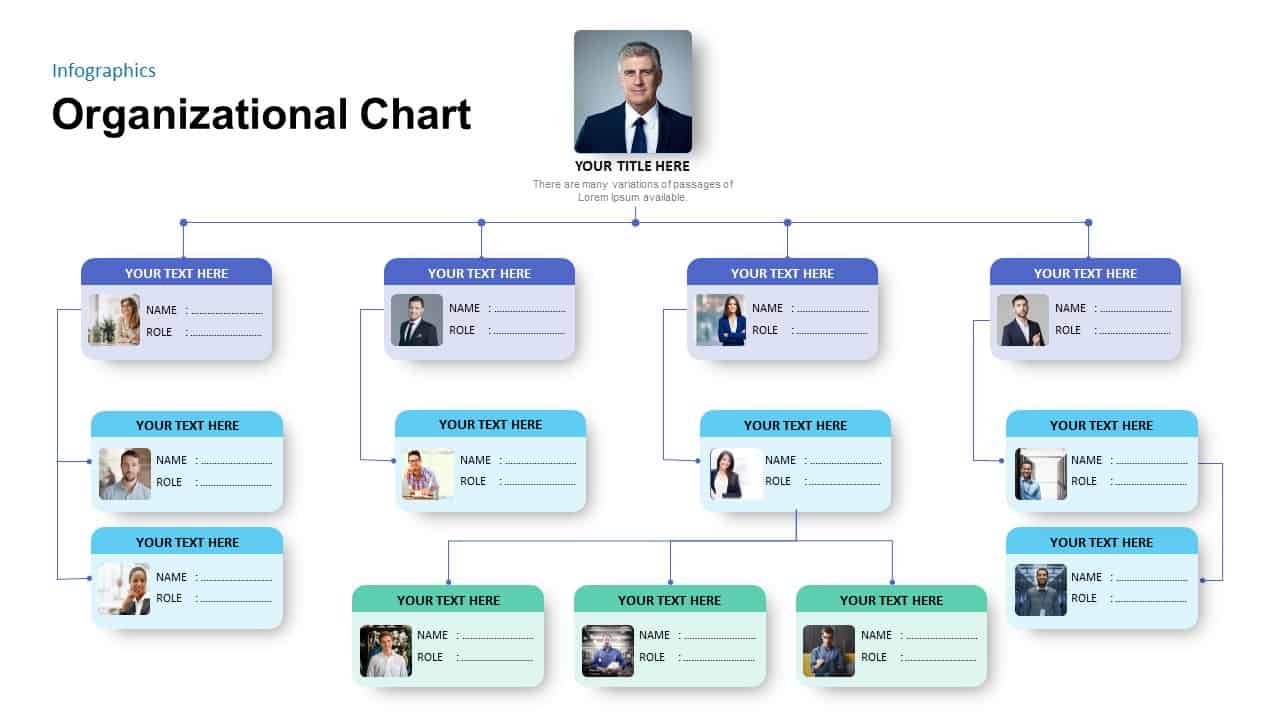
Modern Organizational Chart Hierarchy Template for PowerPoint & Google Slides
Org Chart
Capital Structure Dynamic Split Chart Template for PowerPoint & Google Slides
Comparison Chart

Dynamic Marketing Radar Chart Analytics Template for PowerPoint & Google Slides
Comparison
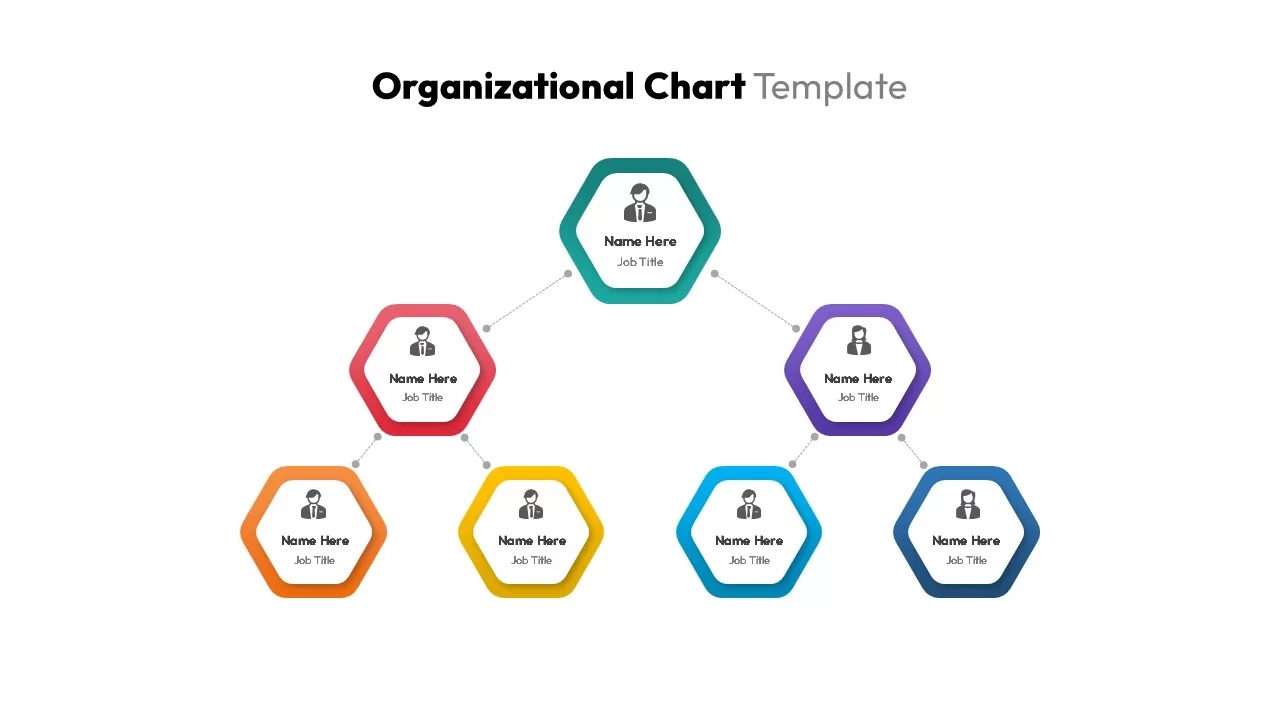
Organizational Chart Template for PowerPoint & Google Slides
Our Team
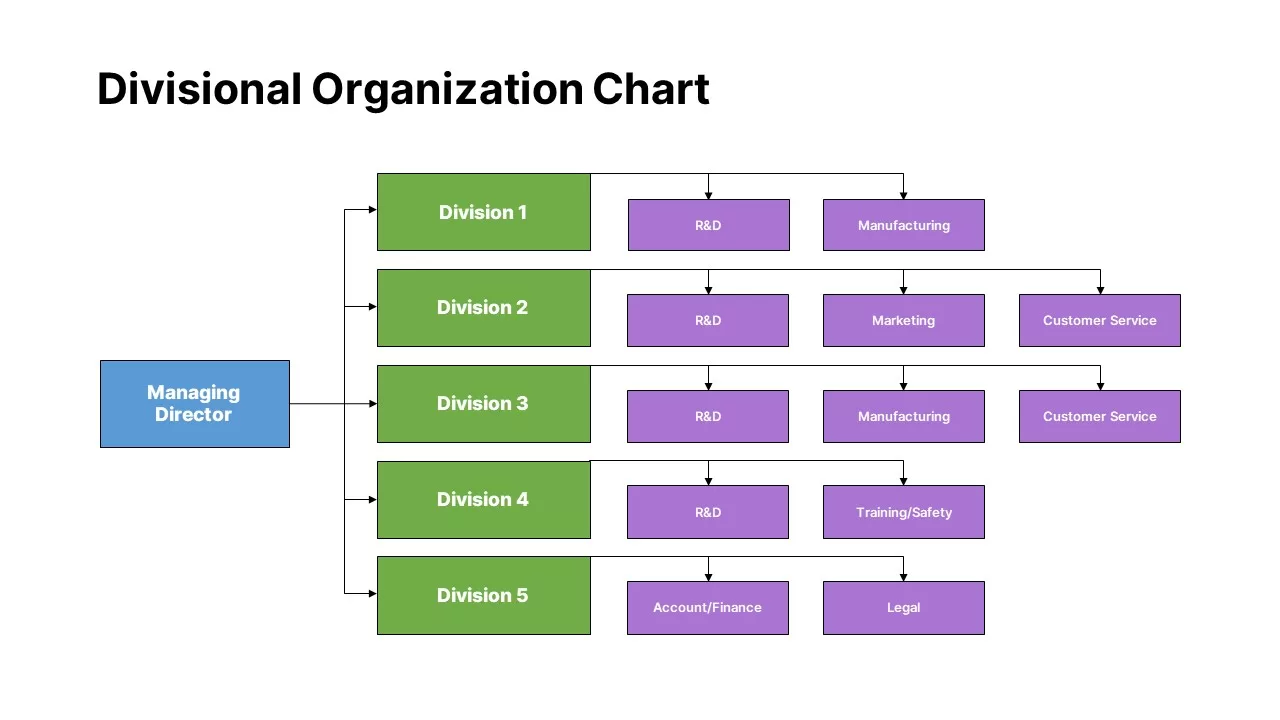
Divisional Organization Chart Template for PowerPoint & Google Slides
Org Chart
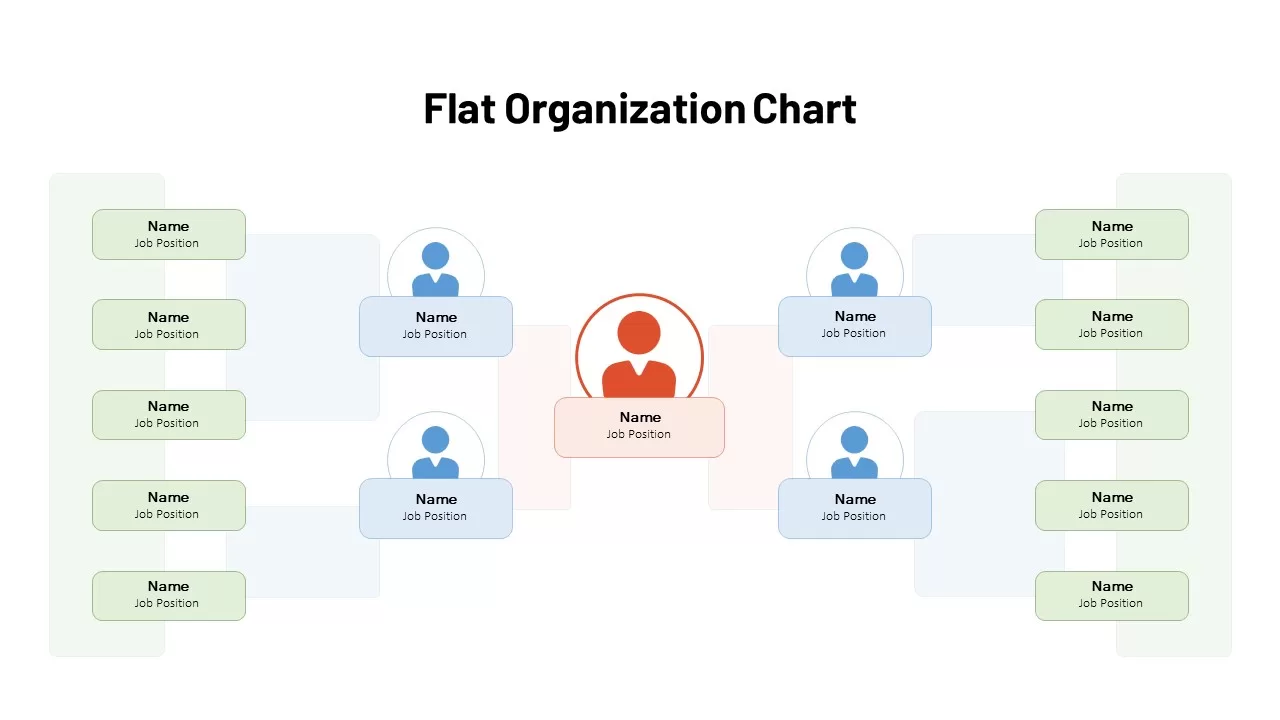
Flat Organization Chart Diagram Template for PowerPoint & Google Slides
Org Chart
Donut Chart for PowerPoint & Google Slides
Pie/Donut
100% Stacked Bar Chart for PowerPoint & Google Slides
Bar/Column
Waterfall Column Chart Analysis Template for PowerPoint & Google Slides
Bar/Column
Professional Clustered Column Chart Template for PowerPoint & Google Slides
Bar/Column
Simple Scatter Chart Analysis Template for PowerPoint & Google Slides
Comparison Chart
Professional 100% Stacked Column Chart Template for PowerPoint & Google Slides
Bar/Column
Grouped Column Chart Comparison Template for PowerPoint & Google Slides
Bar/Column
Multi-Series Vertical Dot Chart Template for PowerPoint & Google Slides
Comparison Chart
Waterfall Chart Data Visualization Template for PowerPoint & Google Slides
Comparison Chart
Five-Phase Horizontal Timeline Chart Template for PowerPoint & Google Slides
Timeline
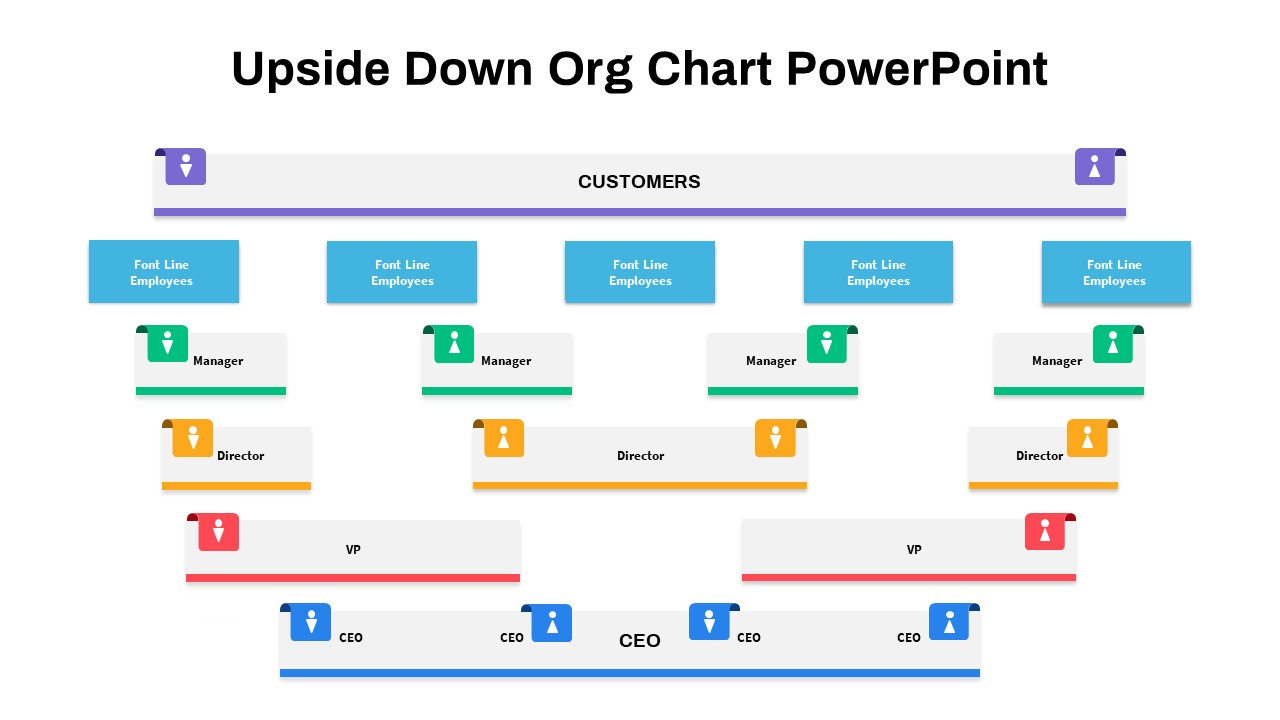
Upside-Down Organizational Chart Diagram Template for PowerPoint & Google Slides
Org Chart
Wastewater Treatment Process Flow Chart Template for PowerPoint & Google Slides
Flow Charts
Wheel Chart PowerPoint Templates
Pie/Donut
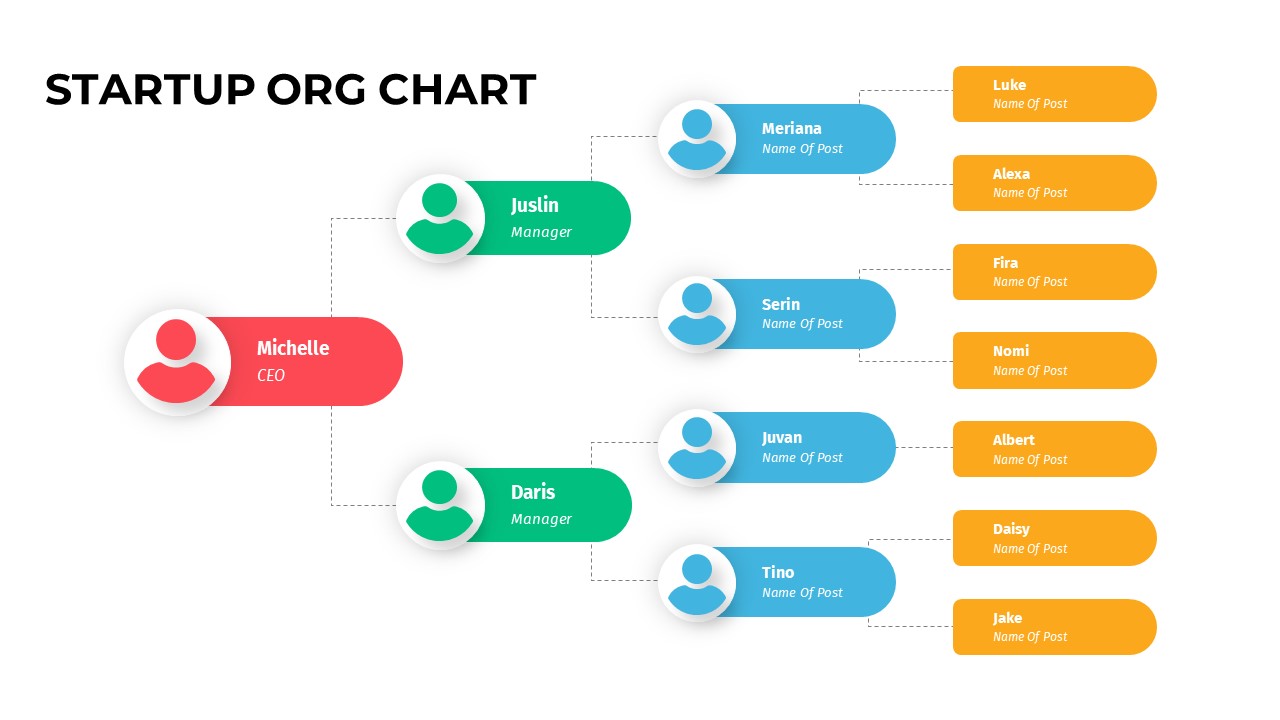
Color-Coded Startup Org Chart Slide for PowerPoint & Google Slides
Org Chart
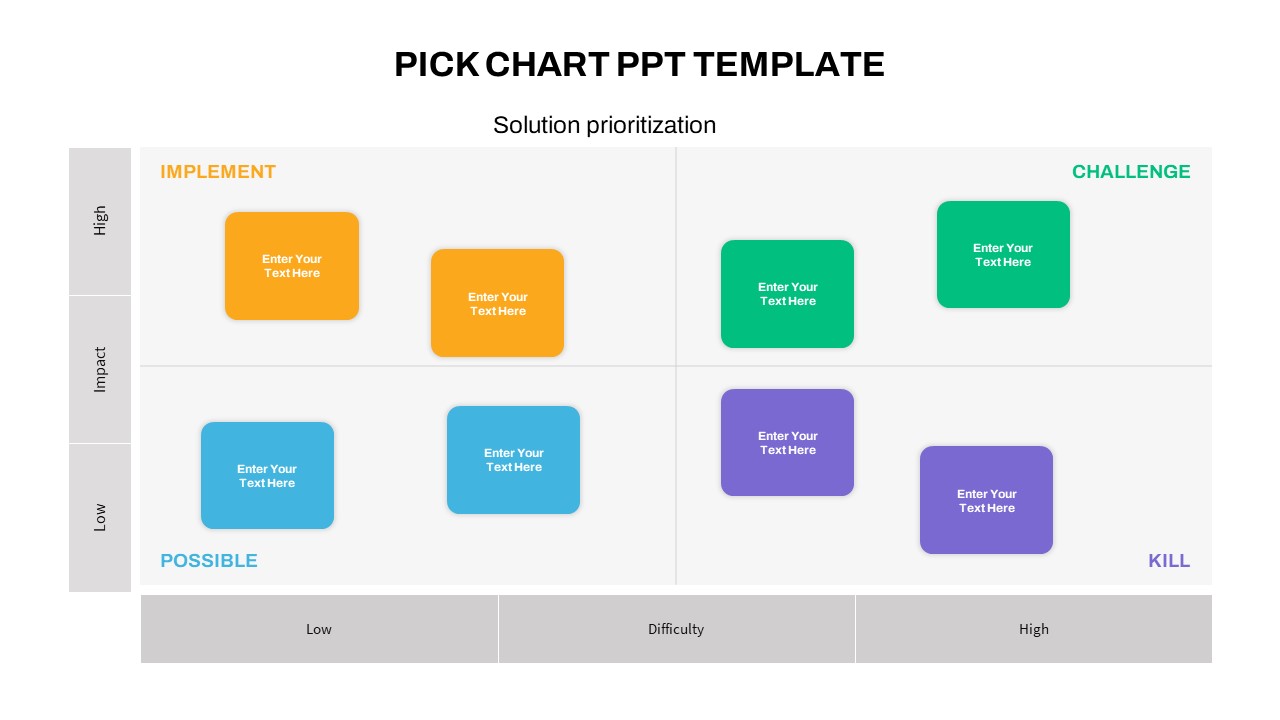
PICK Chart Matrix for Solution Prioritization in PowerPoint & Google Slides
Comparison
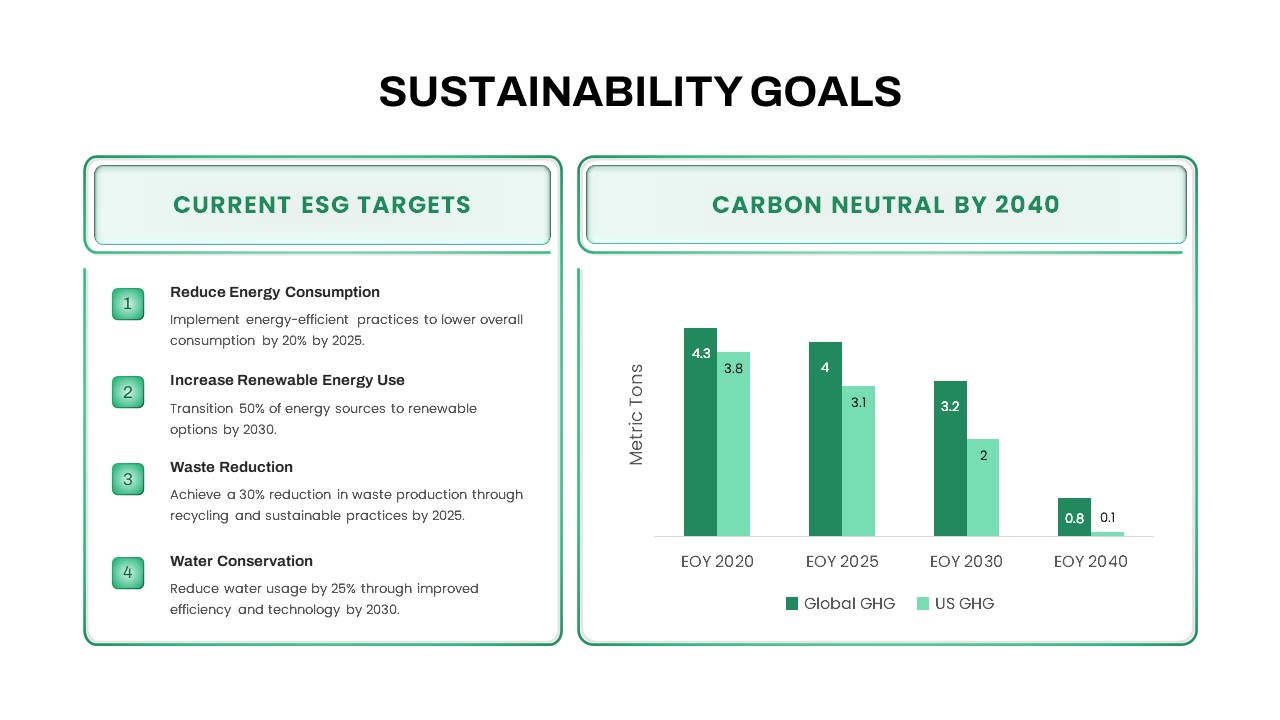
Sustainability Goals and Targets Chart Template for PowerPoint & Google Slides
Goals
Event Planning Gantt Chart template for PowerPoint & Google Slides
Business
Feasibility Matrix Comparison Chart Template for PowerPoint & Google Slides
Comparison Chart
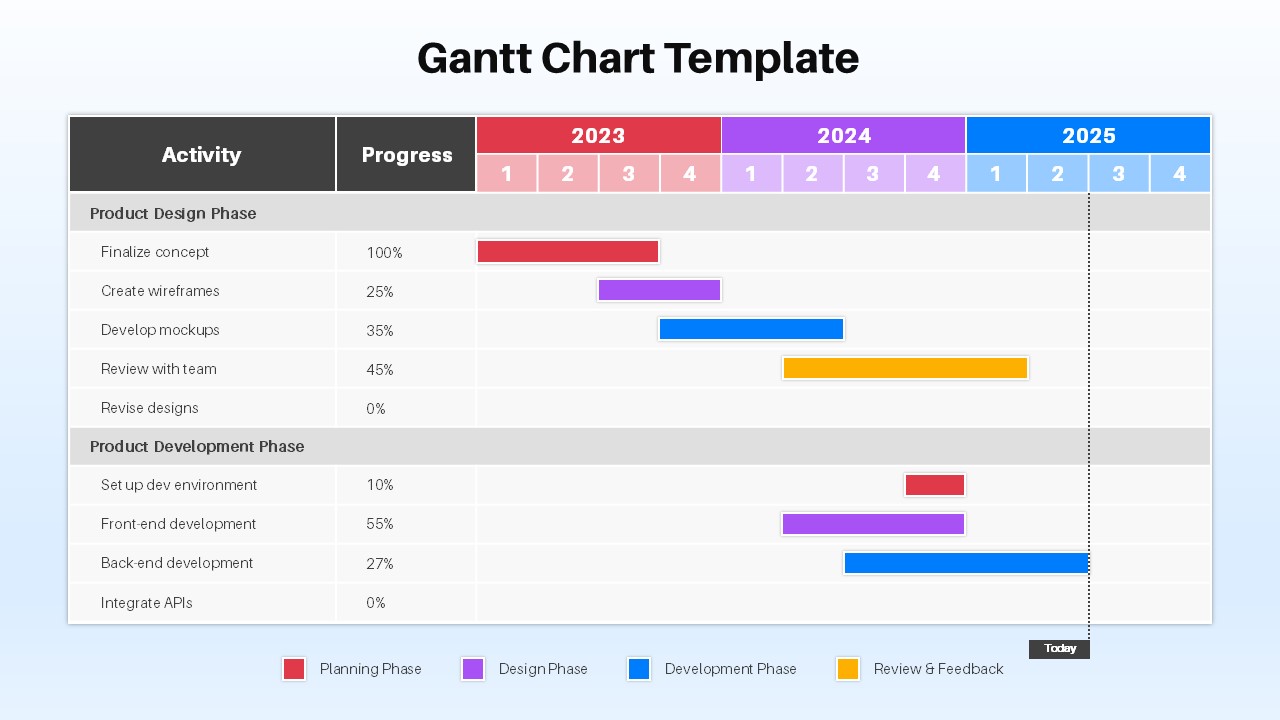
Project Timeline Gantt Chart Template for PowerPoint & Google Slides
Gantt Chart
Colorful Annual Gantt Chart Project Planner Template for PowerPoint & Google Slides
Gantt Chart
Colorful Annual Gantt Chart Timeline Template for PowerPoint & Google Slides
Gantt Chart
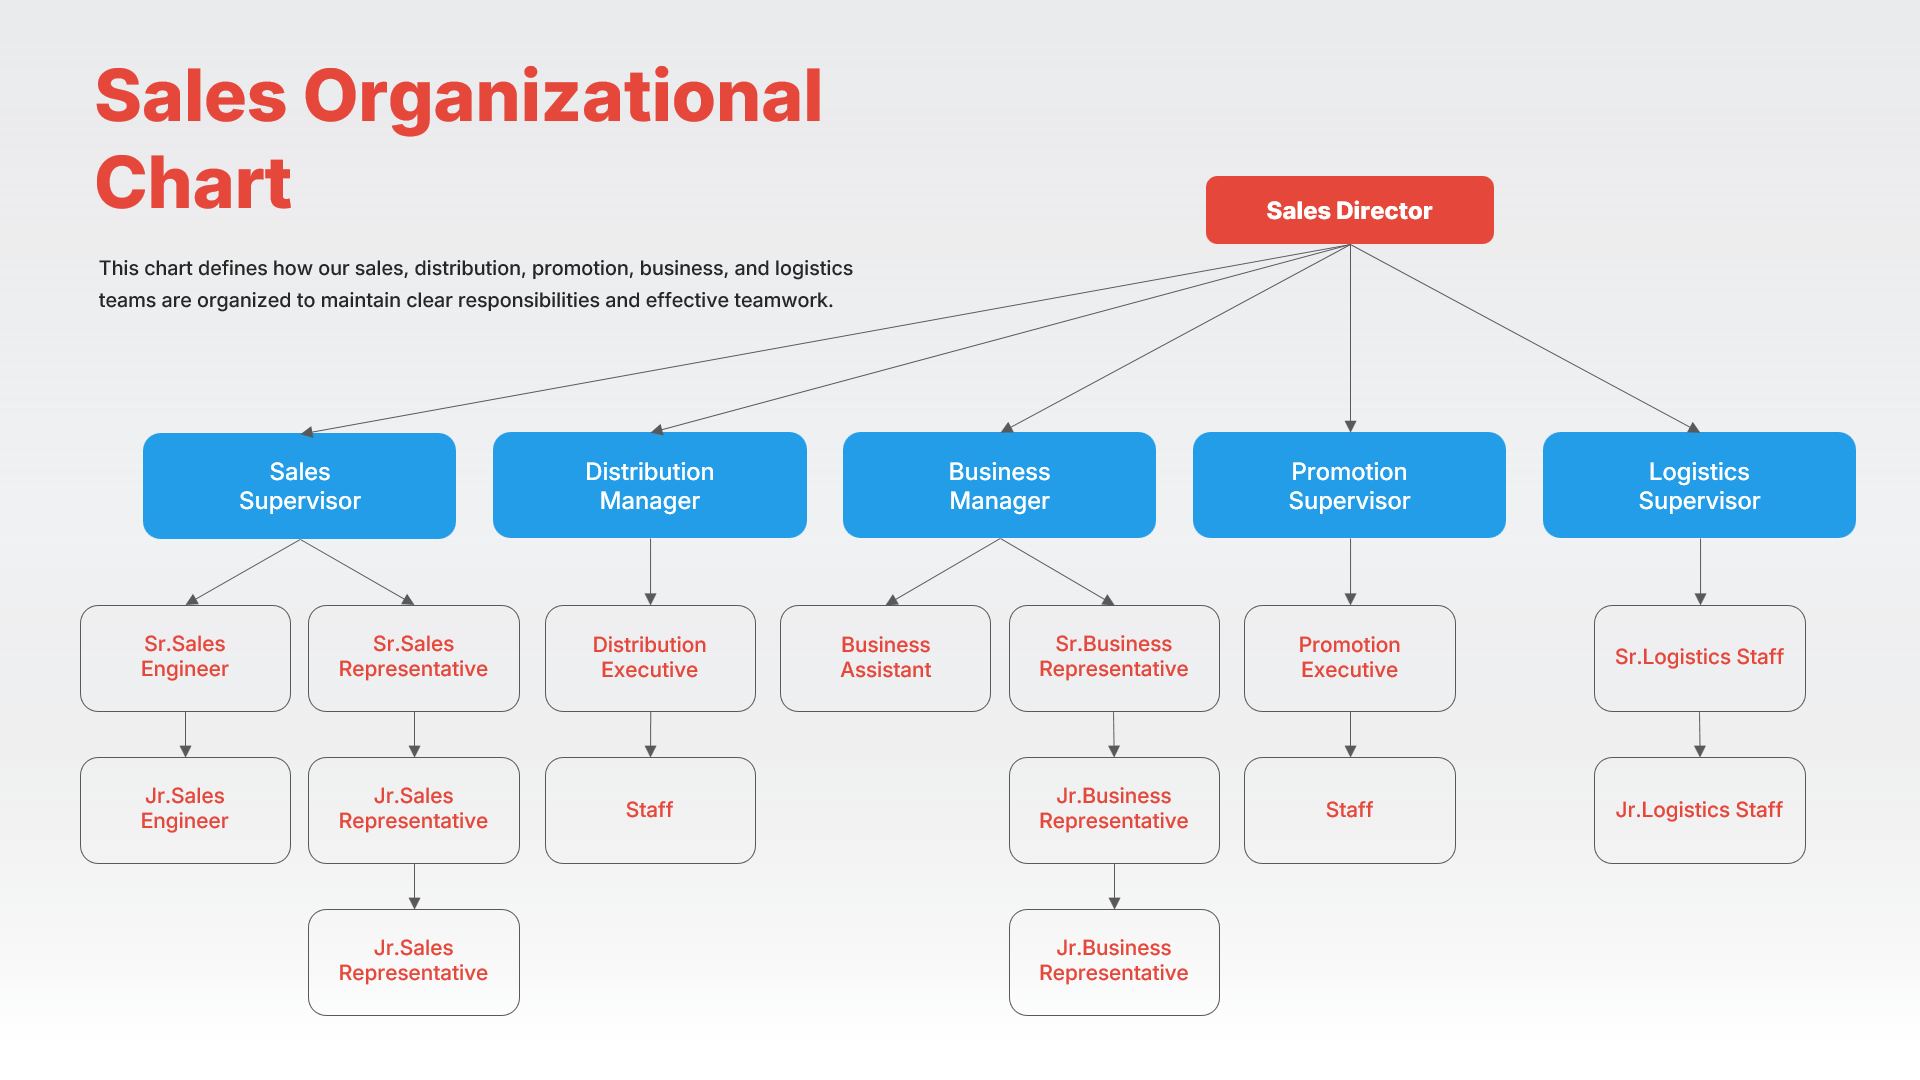
Sales Organizational Chart Hierarchy Template for PowerPoint & Google Slides
Org Chart
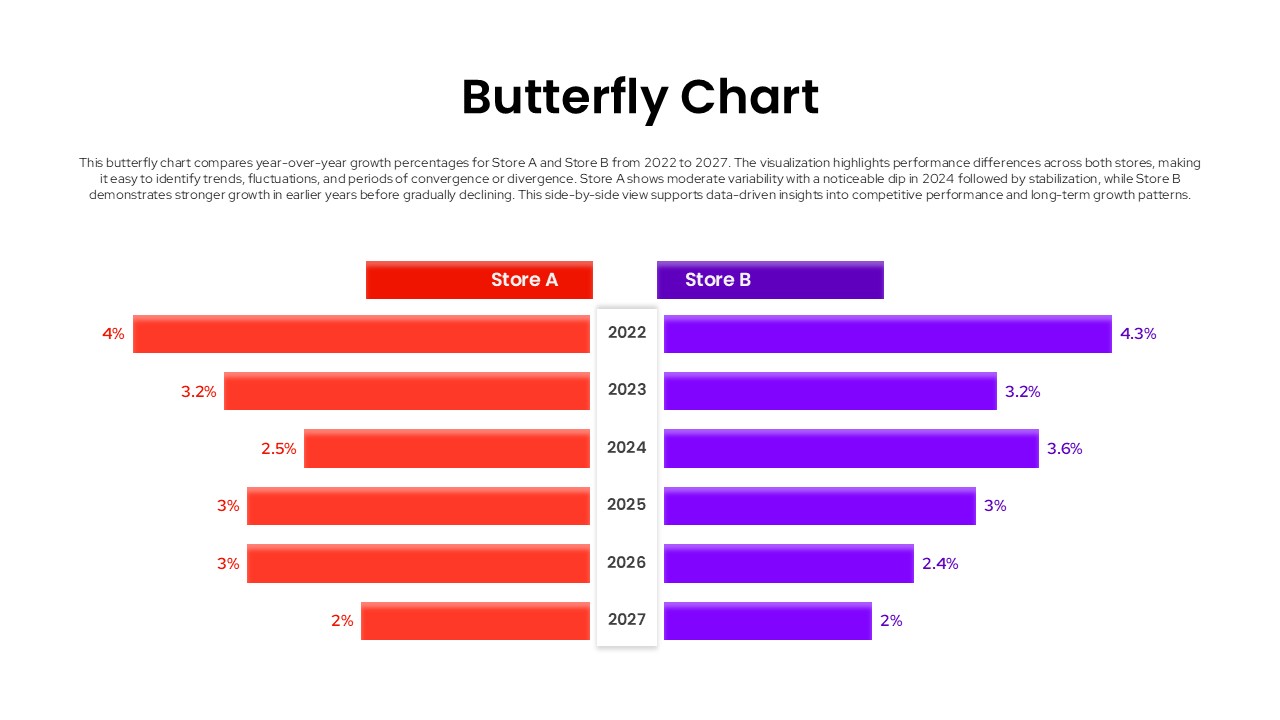
Butterfly Chart Template for PowerPoint & Google Slides Presentations
Comparison Chart