Distracting Factors at Work – Bar Chart Template for PowerPoint

Distracting Factors at Work – Bar Chart PowerPoint Template
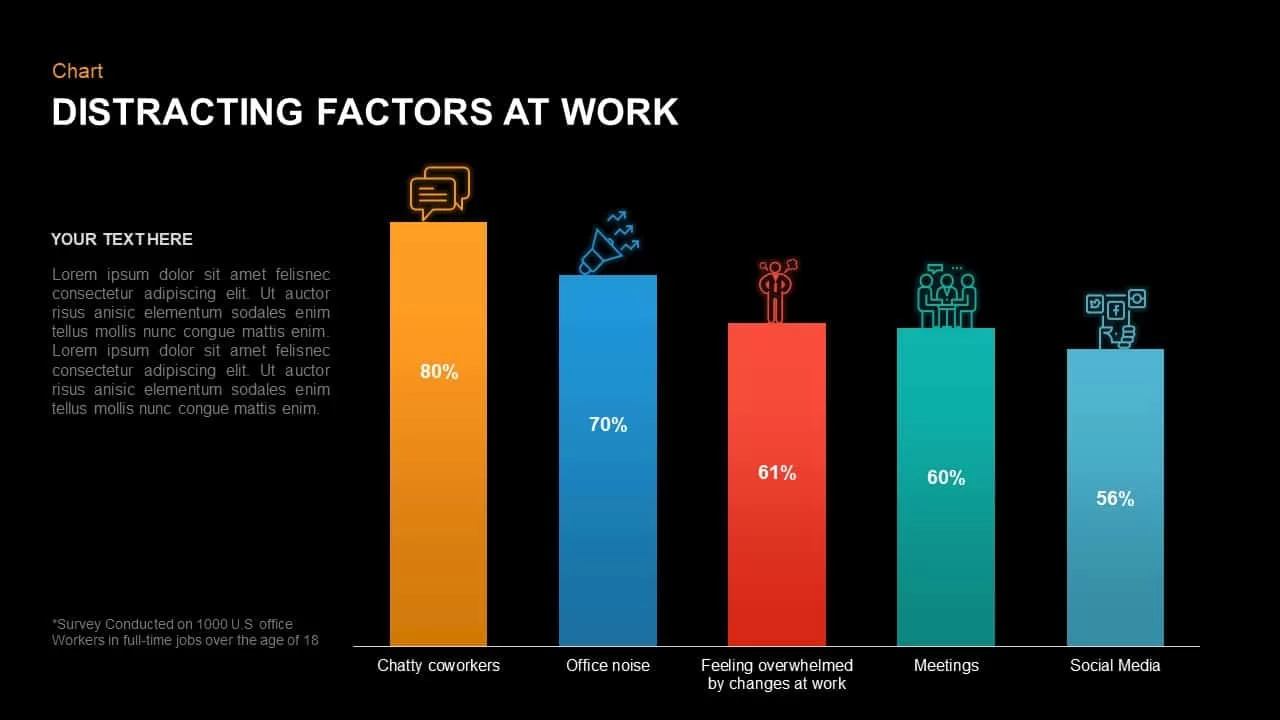
Distracting factors at work chart is created to announce the major distracting factors that affect the work efficiencies and productivity. It is a bar chart template arranged in an ordered sequence depicting the most significant distracting factor in the first and the other factors come respectively. Each bar shape represents data, which is costly, affects companies’ productivity and revenue. Studies show nearly 70% of workers admit they feel distracted when they are on the job. This will become a serious issue when it affects the company’s incremental growth. Some of the problems likely come from the workspace itself, many companies don’t have private areas for employees. Employees are also chit-chatting with their colleagues and making office noises that may influence the productivity of the coworker. The infographic template for showing distracting elements in the workplace is a horizontal ppt template having multiple uses.
The linear process presentation comes in two slides with black and white background. Each bar chart objects coloured differently for easy and serious learning. In the top of the bar, there are clipart icons that will symbolize the topic of the presentation if you manipulate it into the presentation theme. At the bottom, you can see some headings that are the major elements of the work distraction. These elements are; chatty coworkers, Office noises, feeling overwhelmed by changes and work, meetings, and social media. The PowerPoint chart shows the maximum distraction occurs because of the Chatty coworkers, office noise stands next. In the 3rd position is distraction occurred by work changes, meeting and social media usages are comes in 4th and 5th position. Each infographic icon symbolically represents these topics or that are well-matched with the default presentation theme.
The editable distracting factors at work PowerPoint template is created for human resource managers. They can use this diagram to show the distracting elements and their solutions. The customizable PowerPoint allows any changes in PowerPoint features that will not affect the image quality or resolution.
You can access more Bar Chart Templates here. Grab the free ppt now!
Login to download this file

Item ID
SB01324
Related Templates

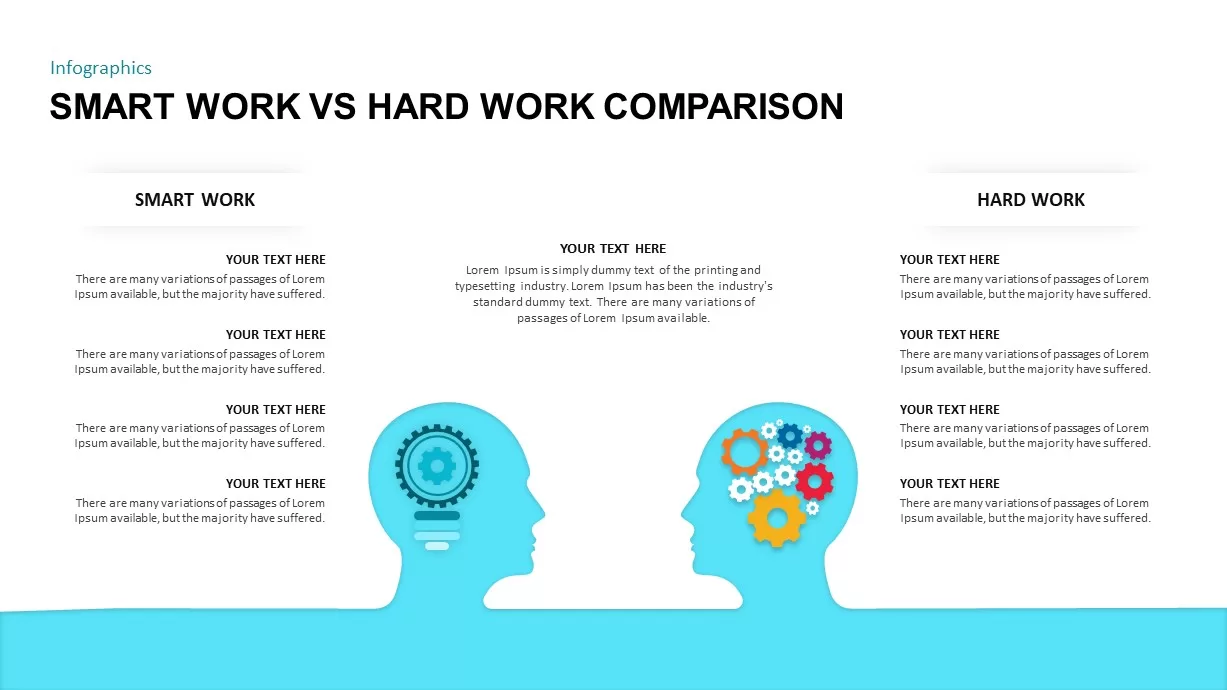
Smart Work vs Hard Work Comparison for PowerPoint & Google Slides
Infographics

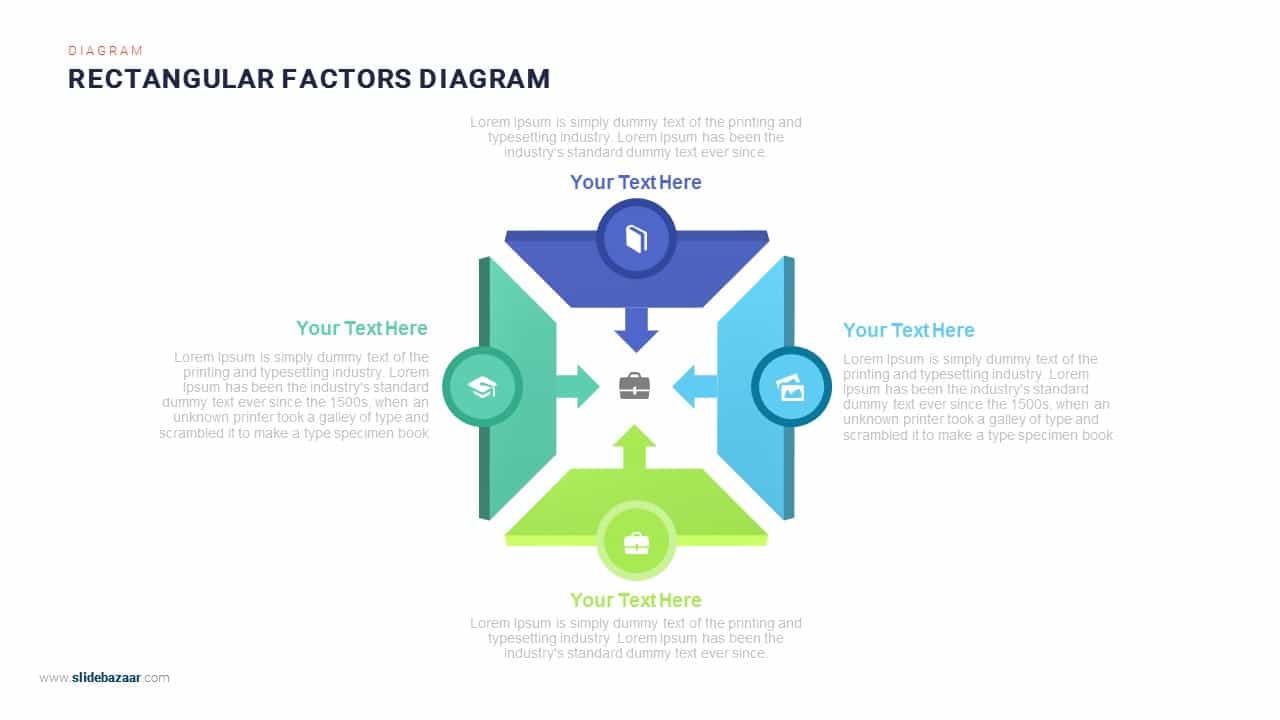
Rectangular Contributing Factors PowerPoint Diagram and Google Slides Template
Process
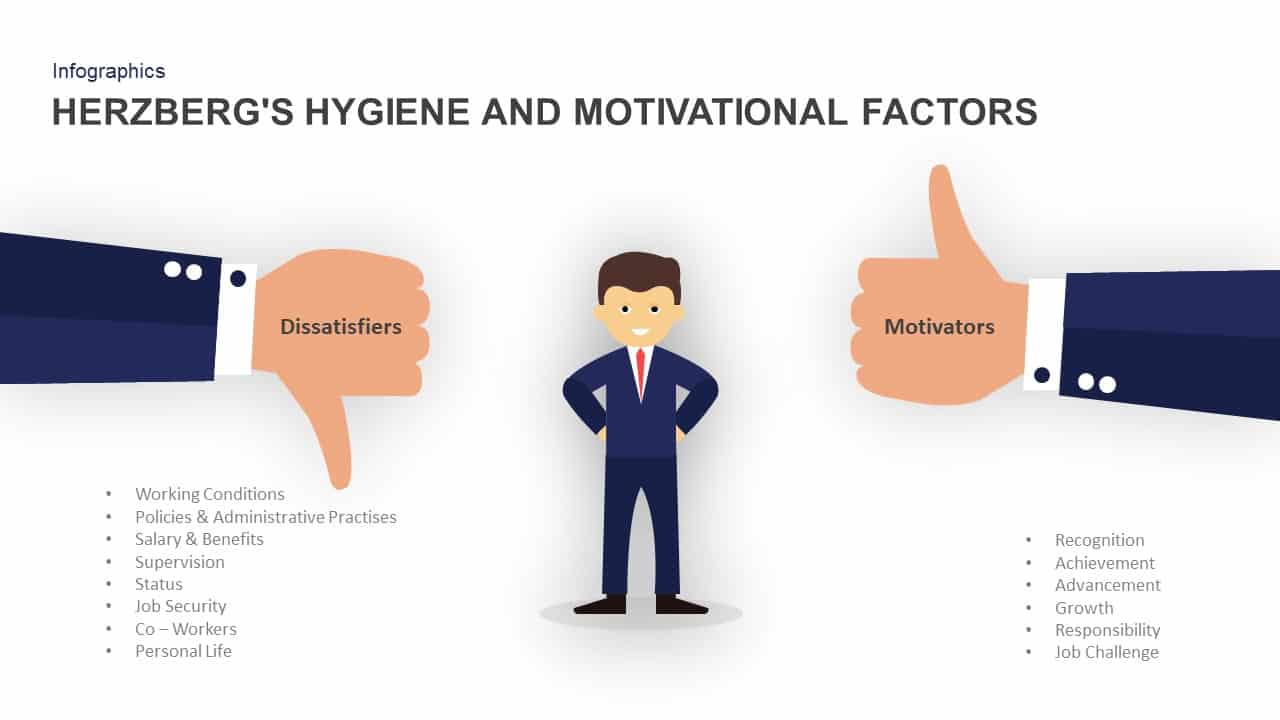
Herzberg’s Hygiene & Motivation Factors Template for PowerPoint & Google Slides
Employee Performance
4 Factors Circular Diagram Infographic Template for PowerPoint & Google Slides
Circular
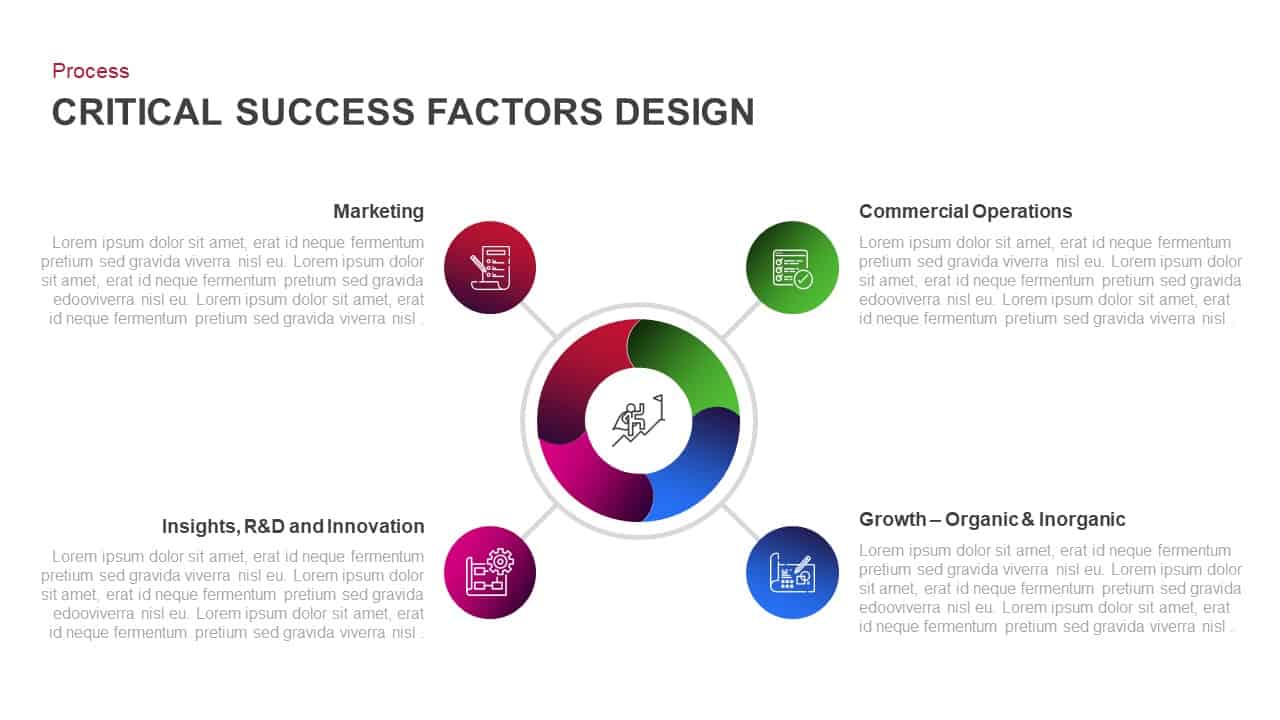
Critical Success Factors Diagram Template for PowerPoint & Google Slides
Infographics
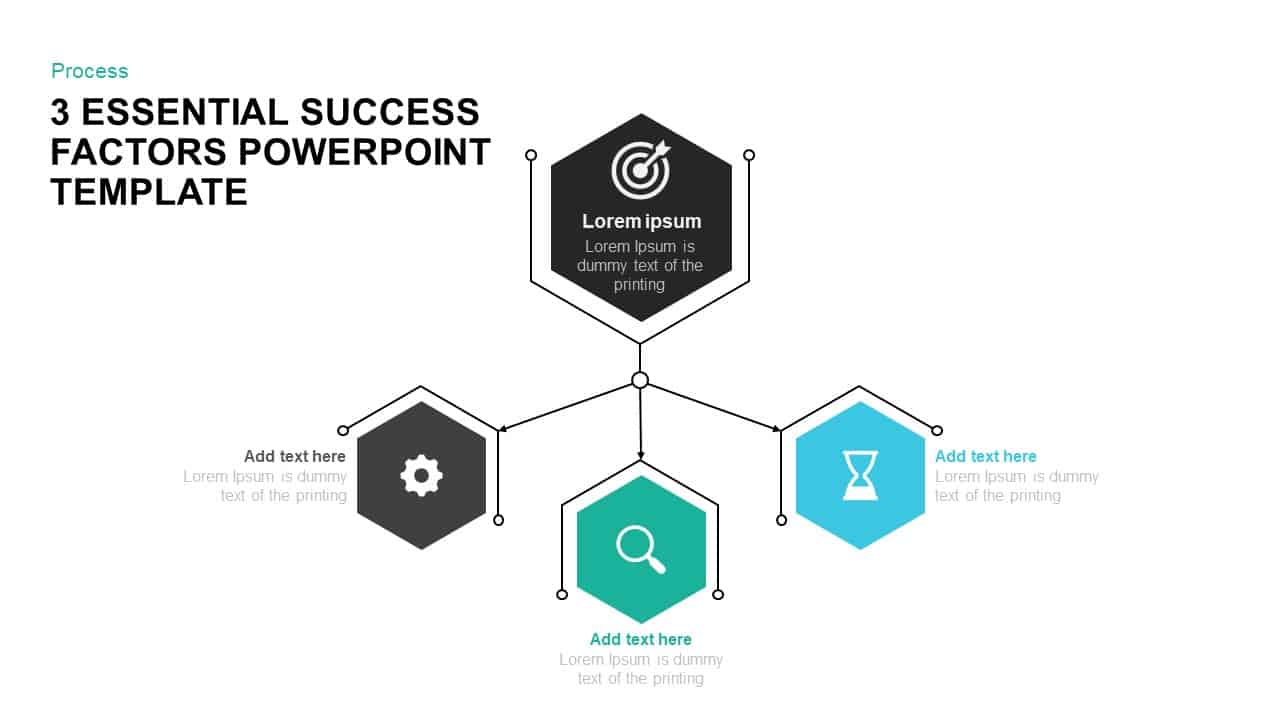
3 Success Factors Hexagon Process Template for PowerPoint & Google Slides
Process
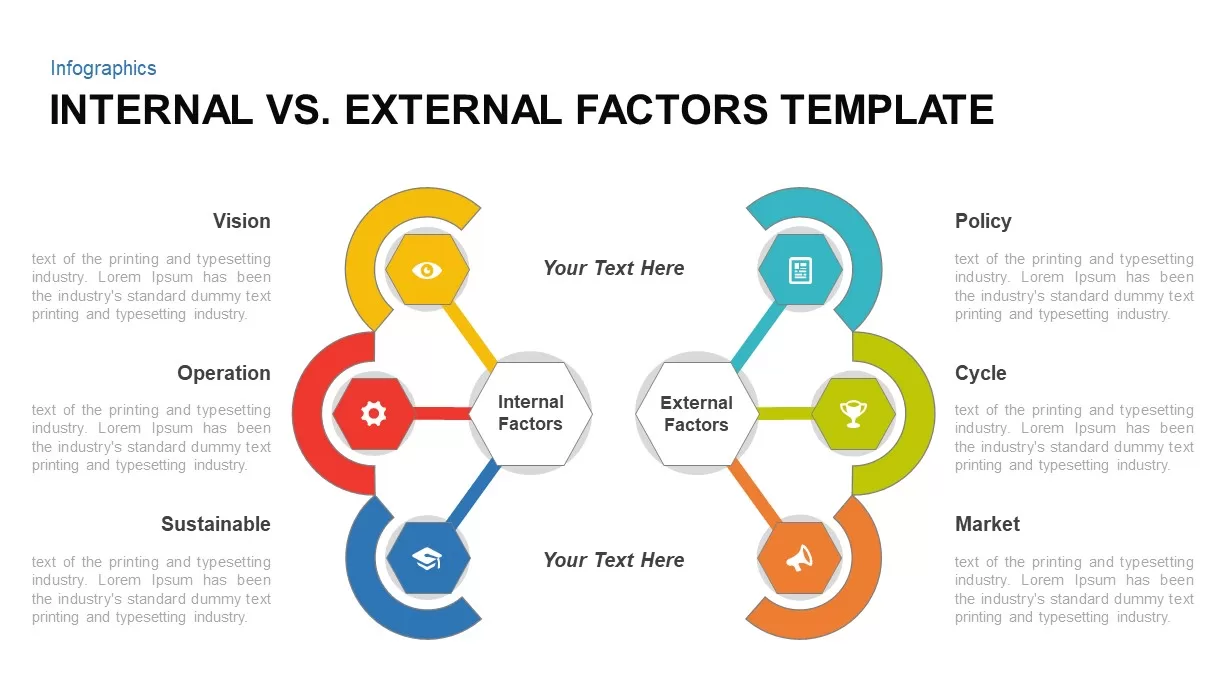
Internal vs. External Factors PowerPoint Template
Infographics
Internal vs External Factors Comparison Template for PowerPoint & Google Slides
Comparison
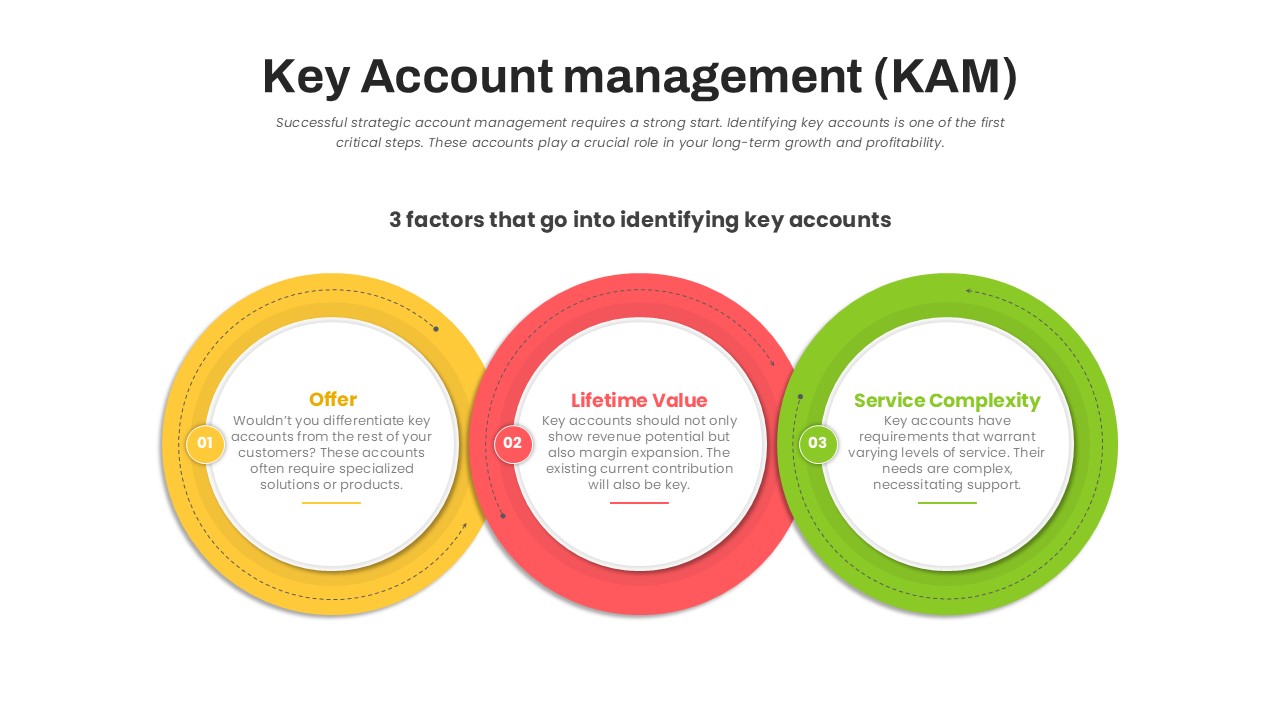
Key Account Management Circular Factors Template for PowerPoint & Google Slides
Circular
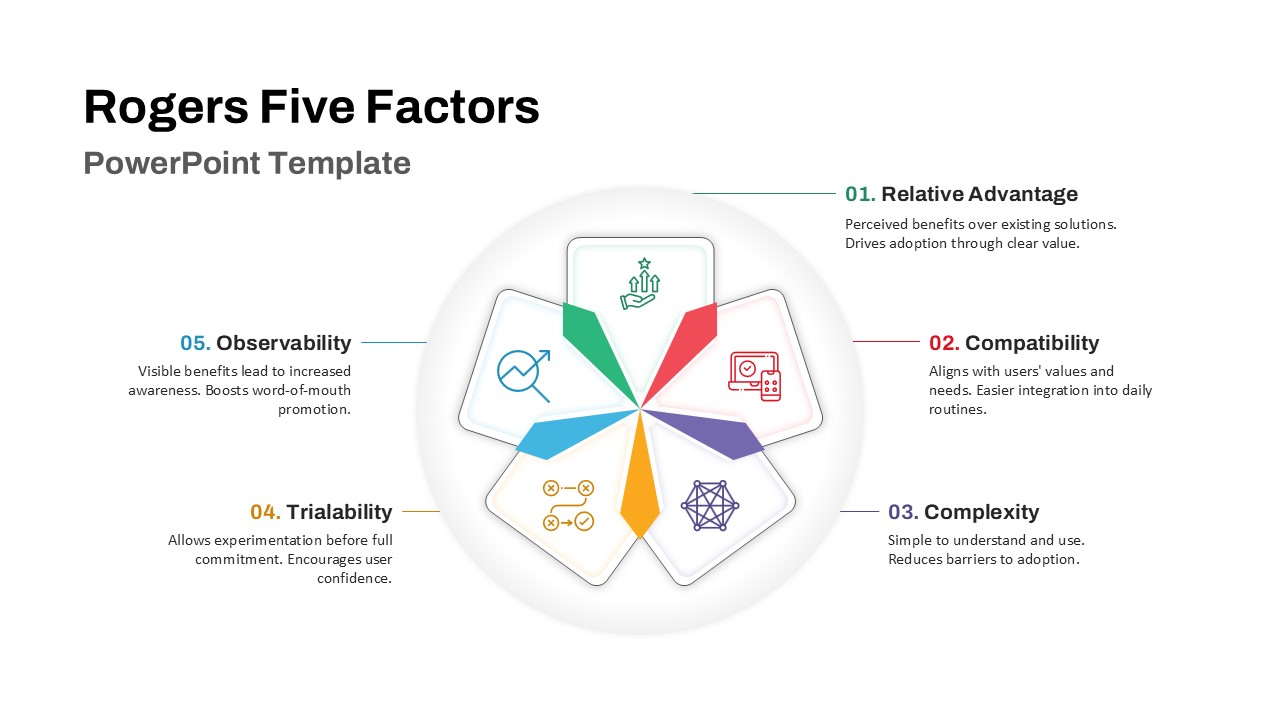
Rogers Five Factors Diffusion Innovation Template for PowerPoint & Google Slides
Process
Pencil Bar Chart Data Analysis Template for PowerPoint & Google Slides
Bar/Column
Interactive Product Comparison Bar Chart Template for PowerPoint & Google Slides
Bar/Column
For and Against Vote Count Bar Chart Template for PowerPoint & Google Slides
Bar/Column
Entertainment Industry Revenue Bar Chart Template for PowerPoint & Google Slides
Bar/Column
Statistics Infographic & KPI Bar Chart Template for PowerPoint & Google Slides
Bar/Column
Multi-Series Stacked Bar Chart Template for PowerPoint & Google Slides
Bar/Column
Simple Bar Chart Data Visualization Template for PowerPoint & Google Slides
Bar/Column
Dynamic Bar-of-Pie Chart Comparison Template for PowerPoint & Google Slides
Pie/Donut
Horizontal Bar Chart Slide with Icons Template for PowerPoint & Google Slides
Bar/Column
Two-Option Bar Chart Comparison Table Template for PowerPoint & Google Slides
Comparison