


Animated Clustered Bar Chart Template for PowerPoint & Google Slides

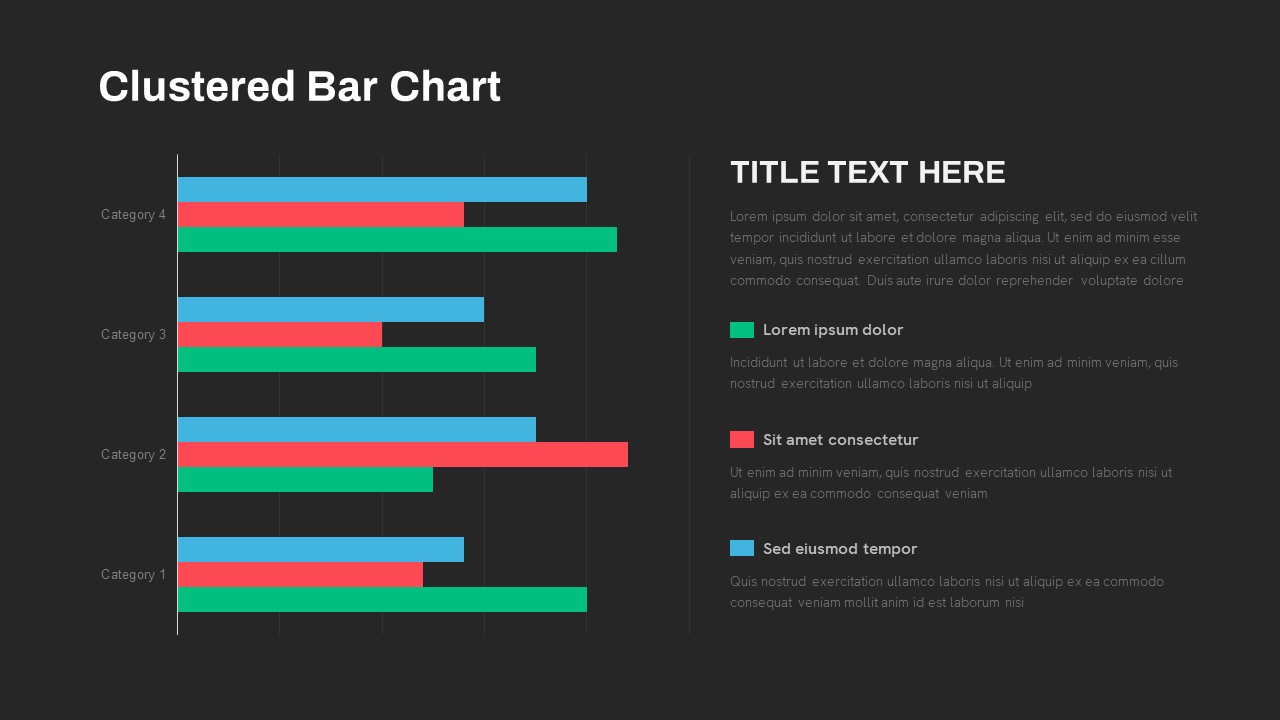
Use this editable animated clustered bar chart slide to compare multiple data series side by side with clarity and impact. The clean white layout features four category rows of horizontal bars—green, red, and blue—stacked in clusters to highlight variance across groups. A title header and customizable text panel on the right let you insert context, key insights, or bullet-point callouts tied to each series legend. Built-in animation triggers bring each bar cluster in sequentially, emphasizing trends as you talk through the data.
Designed on master slides for both PowerPoint and Google Slides, every element is vector-based for pixel-perfect scaling. Swap in your own data via the embedded chart object to automatically adjust bar lengths, change segment colors in seconds to match your branding, and edit text placeholders without breaking the layout. Drag-and-drop legend icons and list items make it simple to link commentary to chart elements, while subtle gridlines and high-contrast typography ensure readability on any screen.
This template accelerates your reporting and storytelling by packaging your bar-chart analysis into a single, professional slide—no designer needed. Whether presenting quarterly KPIs, market research findings, or project progress metrics, the animated clusters drive audience focus to each data series in turn, enhancing comprehension and engagement.
Who is it for
Data analysts, marketing leaders, finance managers, project managers, and executive teams who need a polished, animated chart to showcase comparative metrics.
Other Uses
Repurpose this slide for sales performance comparisons, budget versus actual reporting, customer survey results, or competitive benchmarking visuals.
Login to download this file

Item ID
SB03360
Related Templates

Clustered Bar Chart Comparison Template for PowerPoint & Google Slides
Bar/Column
Clustered Column Chart Template for PowerPoint & Google Slides
Bar/Column

Clustered Column Chart Data Analysis Template for PowerPoint
Bar/Column
Animated Stacked Bar Chart Template for PowerPoint & Google Slides
Bar/Column
Creative Data Analysis Bar Chart template for PowerPoint & Google Slides
Bar/Column
Comparison Bar Chart template for PowerPoint & Google Slides
Comparison Chart
3D Cylinder Bar Chart Template for PowerPoint & Google Slides
Bar/Column

Monthly Reports Bar Chart template for PowerPoint & Google Slides
Bar/Column
Interactive Product Comparison Bar Chart Template for PowerPoint & Google Slides
Bar/Column
For and Against Vote Count Bar Chart Template for PowerPoint & Google Slides
Bar/Column
Entertainment Industry Revenue Bar Chart Template for PowerPoint & Google Slides
Bar/Column
Statistics Infographic & KPI Bar Chart Template for PowerPoint & Google Slides
Bar/Column
Multi-Series Stacked Bar Chart Template for PowerPoint & Google Slides
Bar/Column
Simple Bar Chart Data Visualization Template for PowerPoint & Google Slides
Bar/Column
Dynamic Bar-of-Pie Chart Comparison Template for PowerPoint & Google Slides
Pie/Donut
Expanding Margins Analysis Bar Chart Template for PowerPoint & Google Slides
Charts
Quarterly Sales Review Bar Chart Template for PowerPoint & Google Slides
Bar/Column
Horizontal Bar Chart Slide with Icons Template for PowerPoint & Google Slides
Bar/Column
Two-Option Bar Chart Comparison Table Template for PowerPoint & Google Slides
Comparison
Bar Gantt Chart Template for PowerPoint & Google Slides
Gantt Chart


