Animated Stacked Bar Chart Template for PowerPoint & Google Slides

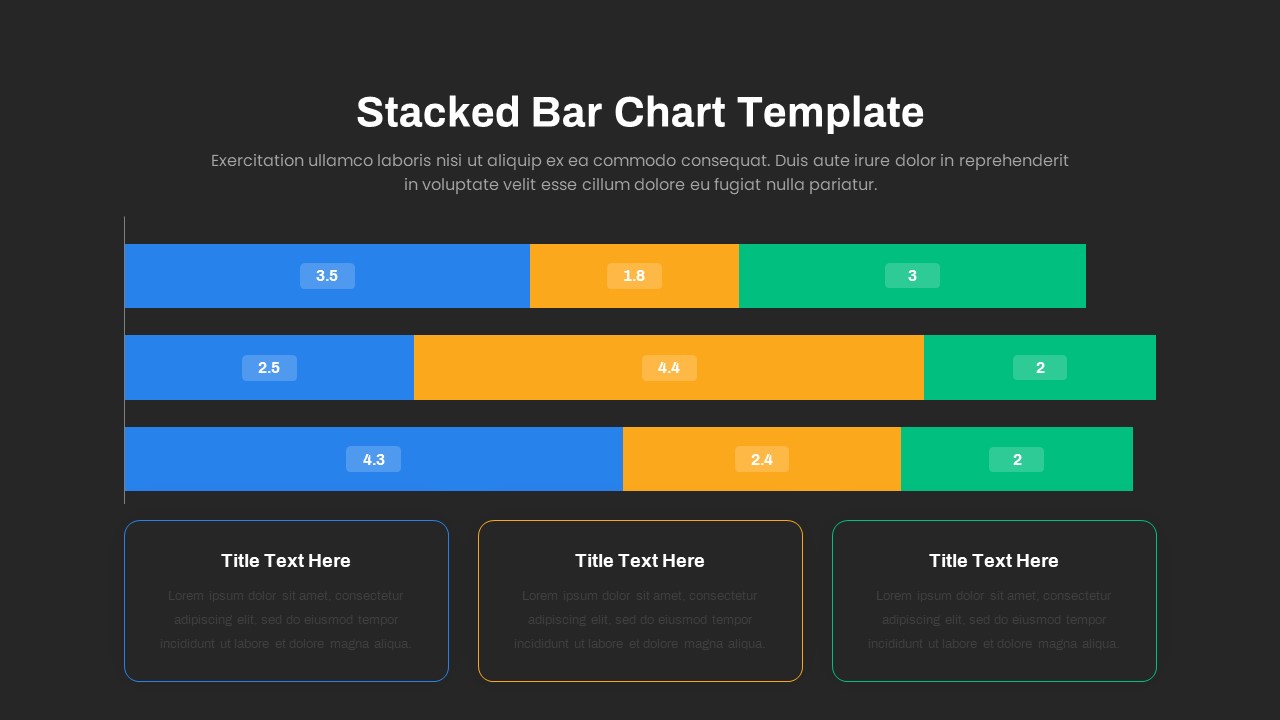

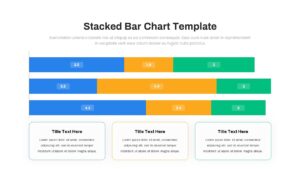

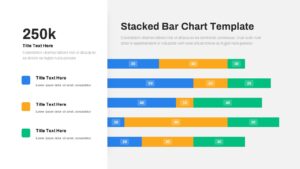

This animated stacked bar chart slide lets you compare up to three data series across multiple categories with dynamic entrance effects that bring each segment into view as you present. The clean white master layout features three horizontal bars, each divided into blue, orange, and green segments with embedded data labels. Below the chart, three bordered text panels—color-matched to each series—provide space for detailed commentary or key insights. Subtle gridlines, high-contrast typography, and vector-based shapes ensure readability and flawless scaling on any device.
Built on master slides for PowerPoint and Google Slides, this template requires zero design skills: simply paste your own values into the embedded chart object to auto-update bar lengths, swap segment colors to match your branding, and edit text placeholders in seconds. Animation triggers are preconfigured so each segment flies or fades in sequentially, drawing attention to specific metrics as you discuss them. Drag-and-drop legend items and text boxes streamline content updates, while consistent styling across slides enforces a polished, professional look.
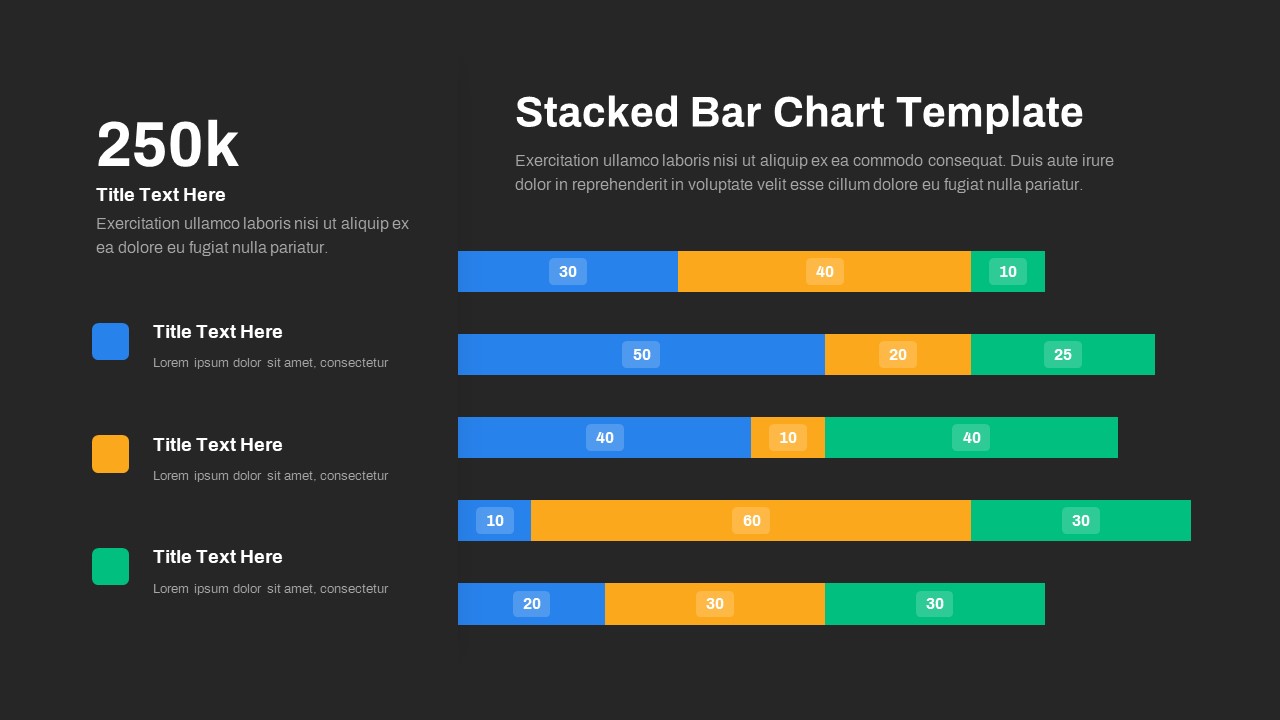
Ideal for quarterly reviews, market-share analyses, resource-allocation reports, and KPI dashboards, this slide transforms raw numbers into a compelling visual story. Use it to highlight performance against targets, compare product line results, or showcase budget versus actual spend—all with engaging animations that captivate stakeholders and drive data-informed discussions.
Who is it for
Finance managers, marketing analysts, project leads, and executive teams who need a high-impact, animated chart to showcase multi-series comparisons and performance metrics.
Other Uses
Repurpose this layout for sales-versus-returns breakdowns, customer-segmentation percentages, resource-utilization comparisons, or any scenario requiring side-by-side bar-chart analysis with commentary panels.
Login to download this file

Item ID
SB03624
Related Templates

Multi-Series Stacked Bar Chart Template for PowerPoint & Google Slides
Bar/Column
Year-over-Year Stacked Gender Bar Chart Template for PowerPoint & Google Slides
Bar/Column
100% Stacked Bar Chart for PowerPoint & Google Slides
Bar/Column
Stacked Bar Chart Template
Bar/Column
Animated Clustered Bar Chart Template for PowerPoint & Google Slides
Bar/Column
Free Stacked Column Chart Data Visualization Template for PowerPoint & Google Slides
Bar/Column
Free
Professional 100% Stacked Column Chart Template for PowerPoint & Google Slides
Bar/Column
Dynamic Three-Series Stacked Area Chart Template for PowerPoint & Google Slides
Comparison Chart
Stacked Waterfall Chart Template for PowerPoint & Google Slides
Bar/Column
Stacked Gantt Chart Timeline Slide Template for PowerPoint & Google Slides
Gantt Chart
3D Stacked Infographic Layers Data Template for PowerPoint & Google Slides
Pyramid

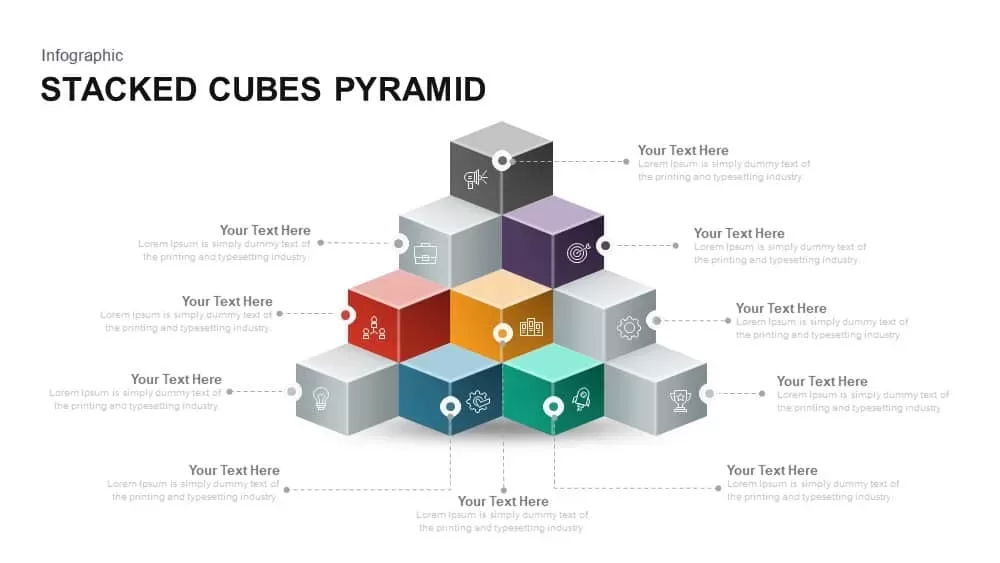
Stacked Cubes Pyramid Infographic Template for PowerPoint & Google Slides
Pyramid
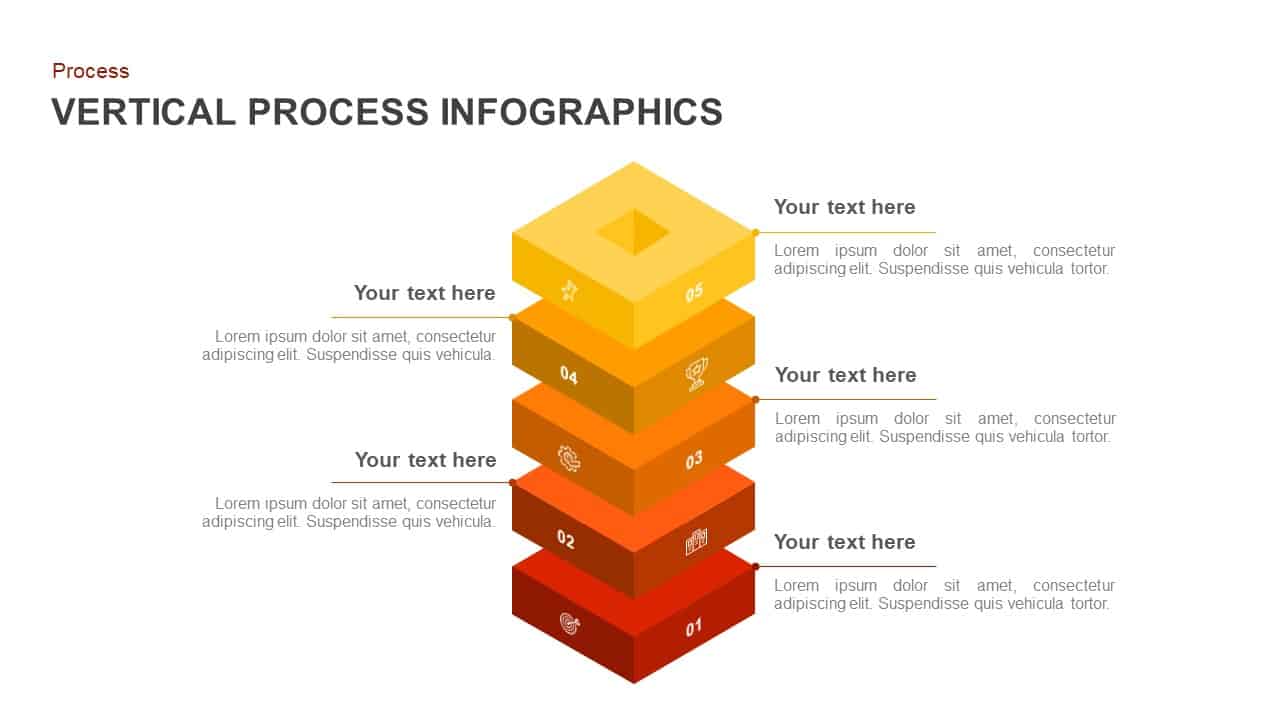
Vertical Stacked Process Infographic Template for PowerPoint & Google Slides
Process
Stacked Cubes Pyramid Six-Option Diagram Template for PowerPoint & Google Slides
Pyramid
Elegant Stacked Photo Collage Layout Template for PowerPoint & Google Slides
Graphics
Creative Bar Chart template for PowerPoint & Google Slides
Charts

Colorful Radial Bar Chart Template for PowerPoint & Google Slides
Bar/Column
Sales Bar Chart Template for PowerPoint and Google slides
Bar/Column
Combination Bar and Line Chart Template for PowerPoint & Google Slides
Bar/Column
Data Analysis Bar Chart with Insights Template for PowerPoint & Google Slides
Bar/Column
Free