Clustered Bar Chart Comparison Template for PowerPoint & Google Slides

Description
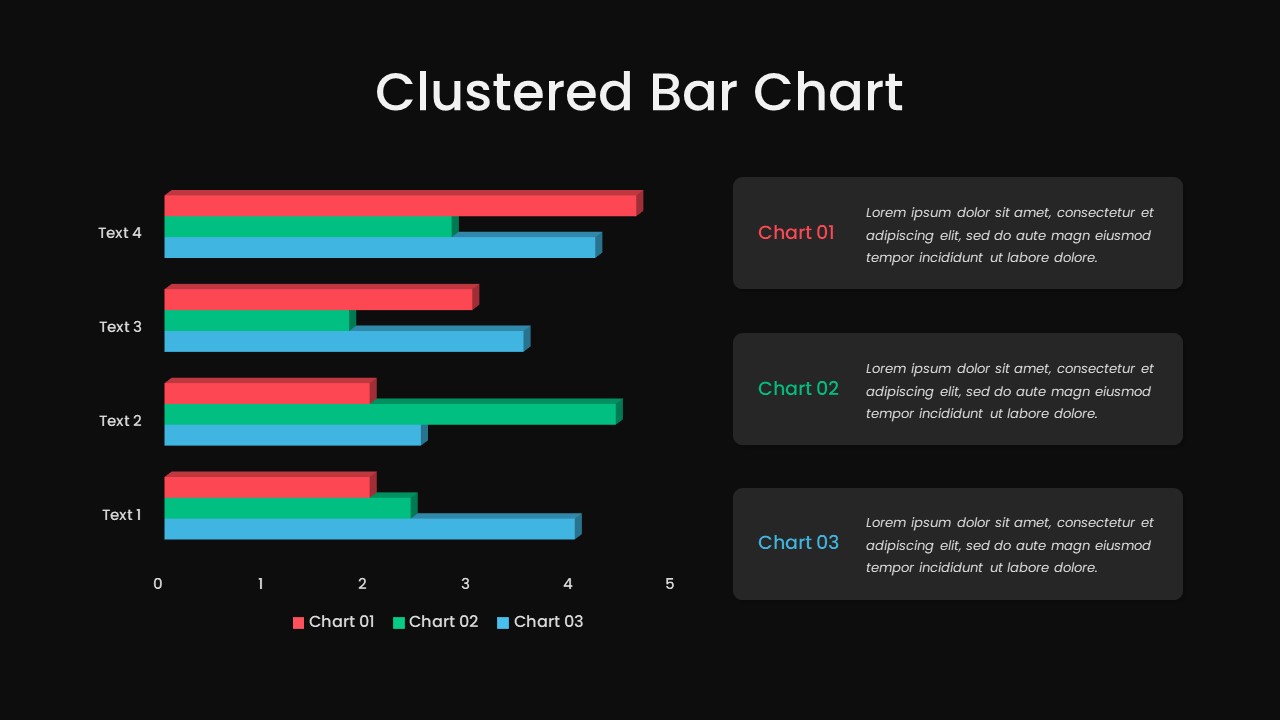
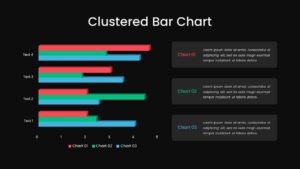
This clustered bar chart slide template enables straightforward comparison of three data series across four categorical items. It features horizontally arranged bars representing Chart 01 (red), Chart 02 (green), and Chart 03 (blue) values, plotted against a customizable axis with clear numeric tick marks. The chart area maintains a minimalist white background and subtle gridlines, ensuring maximum readability. Bars incorporate slight 3D shading and drop shadows for visual depth, while the legend and axis labels can be repositioned or hidden as needed.
On the right, three callout panels with rounded corners allow the addition of descriptive text for each series, complete with header color coding to match the chart palette. Each panel includes a subtle shadow to distinguish text from the slide canvas and offers room for annotations, bullet points, or performance insights. The chart’s axis titles are fully editable, allowing you to define custom metrics, time periods, or segment labels.
Editable master slides preserve spacing and alignment, and smart guides assist in adjusting bar widths, axis scales, and text formatting with ease. For advanced users, the template supports linked data tables—changes in Excel or Google Sheets reflect instantly on the slide, minimizing manual updates. Color-coded headers across panels ensure visual coherence between narrative and data visuals, while alignment markers lock panels in place for consistent layout.
Additional features include data-label toggles for precise value display, color theme swapping to reflect brand standards, and optional animation presets to introduce series sequentially. Perfectly formatted for both PowerPoint and Google Slides, this template retains full vector clarity and aspect ratio on any device. Slide sizes support 16:9 HD displays, and compatibility with dark-mode backgrounds ensures flexibility for diverse presentation contexts.
Who is it for
Financial analysts, sales managers, and project leaders will leverage this template to compare performance metrics, product line results, or regional benchmarks. Consultants, marketing teams, and operations executives can use it to highlight contrasts between customer segments, campaign outcomes, or budget allocations.
Other Uses
Beyond standard reports, repurpose this slide for competitive analyses, resource-allocation reviews, or KPI dashboards. Duplicate and reorder bars to illustrate before-and-after scenarios, survey results, or departmental comparisons. Use callouts to emphasize key takeaways during board meetings, investor pitches, or stakeholder workshops.
Login to download this file

Item ID
SB03627
Related Templates

Animated Clustered Bar Chart Template for PowerPoint & Google Slides
Bar/Column
Professional Clustered Column Chart Template for PowerPoint & Google Slides
Bar/Column

Clustered Column Chart Data Analysis Template for PowerPoint
Bar/Column
Comparison Bar Chart template for PowerPoint & Google Slides
Comparison Chart
Interactive Product Comparison Bar Chart Template for PowerPoint & Google Slides
Bar/Column
Timeline Comparison Slide PowerPoint Template
Comparison Chart
Mirror Bar Chart Comparison Template for PowerPoint & Google Slides
Bar/Column
Dynamic Bar-of-Pie Chart Comparison Template for PowerPoint & Google Slides
Pie/Donut
Quarterly Revenue Comparison Bar Chart Template for PowerPoint & Google Slides
Bar/Column
Two-Option Bar Chart Comparison Table Template for PowerPoint & Google Slides
Comparison
Bar Chart Sample template for PowerPoint & Google Slides
Bar/Column
Creative Data Analysis Bar Chart template for PowerPoint & Google Slides
Bar/Column
3D Bar Chart Data Infographics Template for PowerPoint & Google Slides
Bar/Column
Creative Bar Chart template for PowerPoint & Google Slides
Charts
Three Bar Chart PowerPoint Template
Charts
3D Cylinder Bar Chart Template for PowerPoint & Google Slides
Bar/Column
Pencil Bar Chart Data Analysis Template for PowerPoint & Google Slides
Bar/Column

Monthly Reports Bar Chart template for PowerPoint & Google Slides
Bar/Column

Colorful Radial Bar Chart Template for PowerPoint & Google Slides
Bar/Column
For and Against Vote Count Bar Chart Template for PowerPoint & Google Slides
Bar/Column
Entertainment Industry Revenue Bar Chart Template for PowerPoint & Google Slides
Bar/Column
Distracting Factors at Work Bar Chart Template for PowerPoint & Google Slides
Bar/Column
Statistics Infographic & KPI Bar Chart Template for PowerPoint & Google Slides
Bar/Column
Multi-Series Stacked Bar Chart Template for PowerPoint & Google Slides
Bar/Column
Monthly Recurring Revenue KPI Bar Chart Template for PowerPoint & Google Slides
Bar/Column
Combination Bar and Line Chart Template for PowerPoint & Google Slides
Bar/Column
Animated Stacked Bar Chart Template for PowerPoint & Google Slides
Bar/Column
Simple Bar Chart Data Visualization Template for PowerPoint & Google Slides
Bar/Column
Waterfall Bar Chart Analysis Template for PowerPoint & Google Slides
Bar/Column
Year-over-Year Stacked Gender Bar Chart Template for PowerPoint & Google Slides
Bar/Column
Expanding Margins Analysis Bar Chart Template for PowerPoint & Google Slides
Charts
Quarterly Sales Review Bar Chart Template for PowerPoint & Google Slides
Bar/Column
Data Analysis Bar Chart with Insights Template for PowerPoint & Google Slides
Bar/Column
Free
Horizontal Bar Chart Slide with Icons Template for PowerPoint & Google Slides
Bar/Column
Bar Gantt Chart Template for PowerPoint & Google Slides
Gantt Chart
USA Map with Bar Chart Template for PowerPoint & Google Slides
World Maps
Sales Bar Chart for PowerPoint & Google Slides
Bar/Column
Data Bar Chart Template for PowerPoint and Keynote
Bar/Column

Radial Bar Chart Diagram for PowerPoint & Google Slides
Bar/Column
Stacked Bar Chart for PowerPoint & Google Slides
Bar/Column
100% Stacked Bar Chart for PowerPoint & Google Slides
Bar/Column
3D Cylinder Bar Chart Visualization Template for PowerPoint
Bar/Column
Four Section Comparison Chart Diagram Template for PowerPoint & Google Slides
Infographics
Comparison Chart Overview template for PowerPoint & Google Slides
Comparison Chart
Tornado Chart Data Comparison Slide Template for PowerPoint & Google Slides
Bar/Column
Radar Chart Product Comparison Template for PowerPoint & Google Slides
Comparison Chart

BMI Category Comparison Chart Template for PowerPoint & Google Slides
Comparison
Circular Product Comparison Chart Template for PowerPoint & Google Slides
Comparison Chart
Pugh Matrix Decision Comparison Chart Template for PowerPoint & Google Slides
Comparison Chart
Dynamic Benchmarking Comparison Chart Template for PowerPoint & Google Slides
Comparison Chart
People Demographic Comparison Chart Template for PowerPoint & Google Slides
Comparison
Grouped Column Chart Comparison Template for PowerPoint & Google Slides
Bar/Column
Multiple Line Chart PowerPoint Template
Comparison Chart
Free Product Comparison Chart Template
Charts
Free
ESG Initiatives Comparison Chart Template for PowerPoint & Google Slides
Business
Competitor Comparison Chart Design Template for PowerPoint & Google Slides
Comparison
Profile Comparison Chart template for PowerPoint & Google Slides
Comparison Chart
Sales Growth Comparison Chart & Table Template for PowerPoint & Google Slides
Bar/Column
Skills Gap Analysis Comparison Chart Template for PowerPoint & Google Slides
Gap
Feasibility Matrix Comparison Chart Template for PowerPoint & Google Slides
Comparison Chart
Quarterly Comparison Pie Chart Template for PowerPoint & Google Slides
Pie/Donut
Blank Comparison Chart Template for PowerPoint & Google Slides
Comparison Chart
Process Comparison Chart for PowerPoint & Google Slides
Infographics
Comparison Chart Design Slide for PowerPoint & Google Slides
Infographics
3D Bar Graph Infographic Template for PowerPoint & Google Slides
Bar/Column
Five-Stage Vertical Bar Process Template for PowerPoint & Google Slides
Process
Progress Timeline Bar PowerPoint Template
Timeline
Progress Bar and Milestone Visualization Template for PowerPoint & Google Slides
Timeline

Blank Bar Graph Template for PowerPoint & Google Slides
Bar/Column
Progress Bar Graph Layout Design for PowerPoint & Google Slides
Charts
Progress Bar Infographic for PowerPoint & Google Slides
Business
Progress Bar infographic pack for PowerPoint & Google Slides
Business
Five Options Business Bar Graph for PowerPoint & Google Slides
Business Report
Comparison Donut Chart PowerPoint Template and Keynote
Pie/Donut
Service Zoom Feature Slides Comparison template for PowerPoint & Google Slides
Process
Simple Comparison Table Template for PowerPoint & Google Slides
Comparison
Speedometer Infographic Gauge Comparison Template for PowerPoint & Google Slides
Comparison

Dual Percentage Comparison Metaphor Template for PowerPoint & Google Slides
Comparison
Comparison Pricing Table Template for PowerPoint & Google Slides
Comparison Chart
Interactive Pricing Plan Comparison Template for PowerPoint & Google Slides
Comparison
Challenges vs Solutions Comparison Template for PowerPoint & Google Slides
Comparison
Fact and Figures Comparison Slide Template for PowerPoint & Google Slides
Business Report
Rag Status Infographic Diagrams
Project
Current State vs Future State Template for PowerPoint & Google Slides
Comparison Chart
Challenges and Solutions Comparison Template for PowerPoint & Google Slides
Opportunities Challenges
Risk Heatmap Comparison Template for PowerPoint & Google Slides
Maps
Heatmap Comparison Template for PowerPoint & Google Slides
Maps
Surgery Infographics Comparison Template for PowerPoint & Google Slides
Health
AI vs. Human Intelligence Comparison Template for PowerPoint & Google Slides
Comparison
Hits & Misses Comparison Infographic Template for PowerPoint & Google Slides
Pitch Deck
Entry and Exit Barriers Comparison Template for PowerPoint & Google Slides
Comparison
Market Share Comparison Diagram Template for PowerPoint & Google Slides
Comparison Chart
Two-Box Analysis & Target Comparison Template for PowerPoint & Google Slides
Comparison
VUCA vs BANI Comparison Infographic Template for PowerPoint & Google Slides
Comparison
Funnel and Flywheel Thinking Comparison template for PowerPoint & Google Slides
Infographics
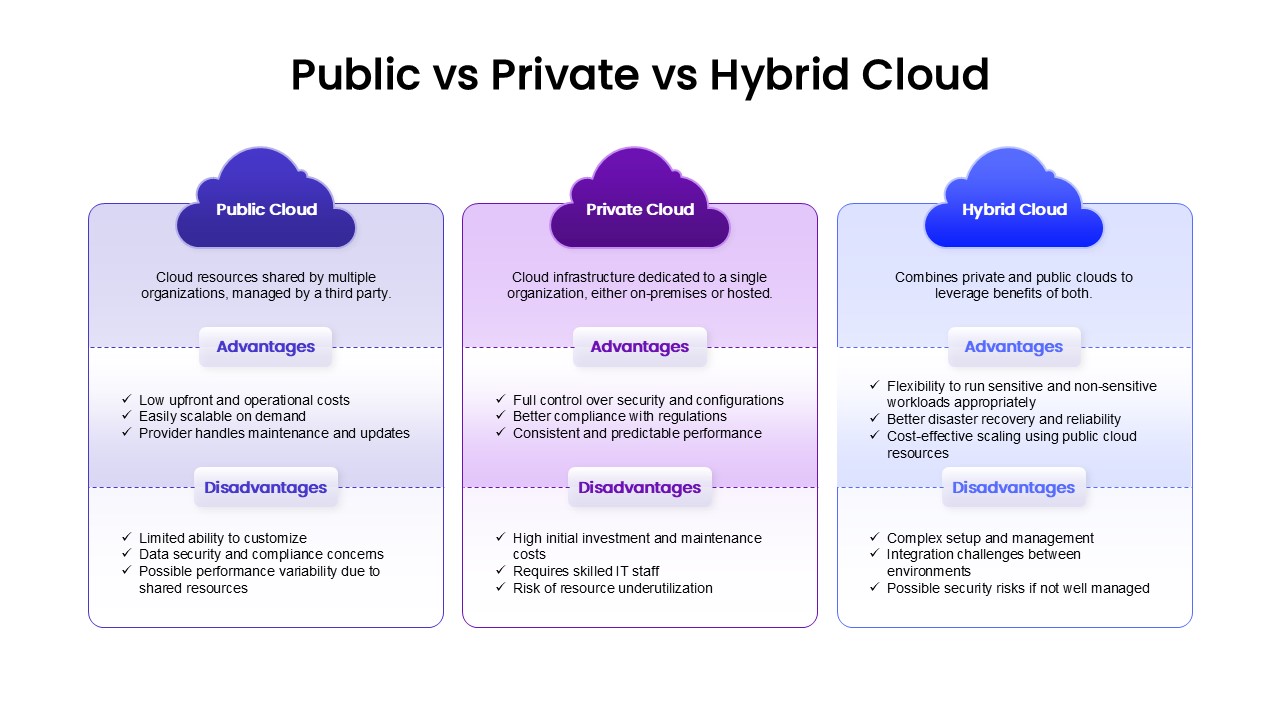
Public vs Private vs Hybrid Cloud Comparison Template for Presentations
Cloud Computing
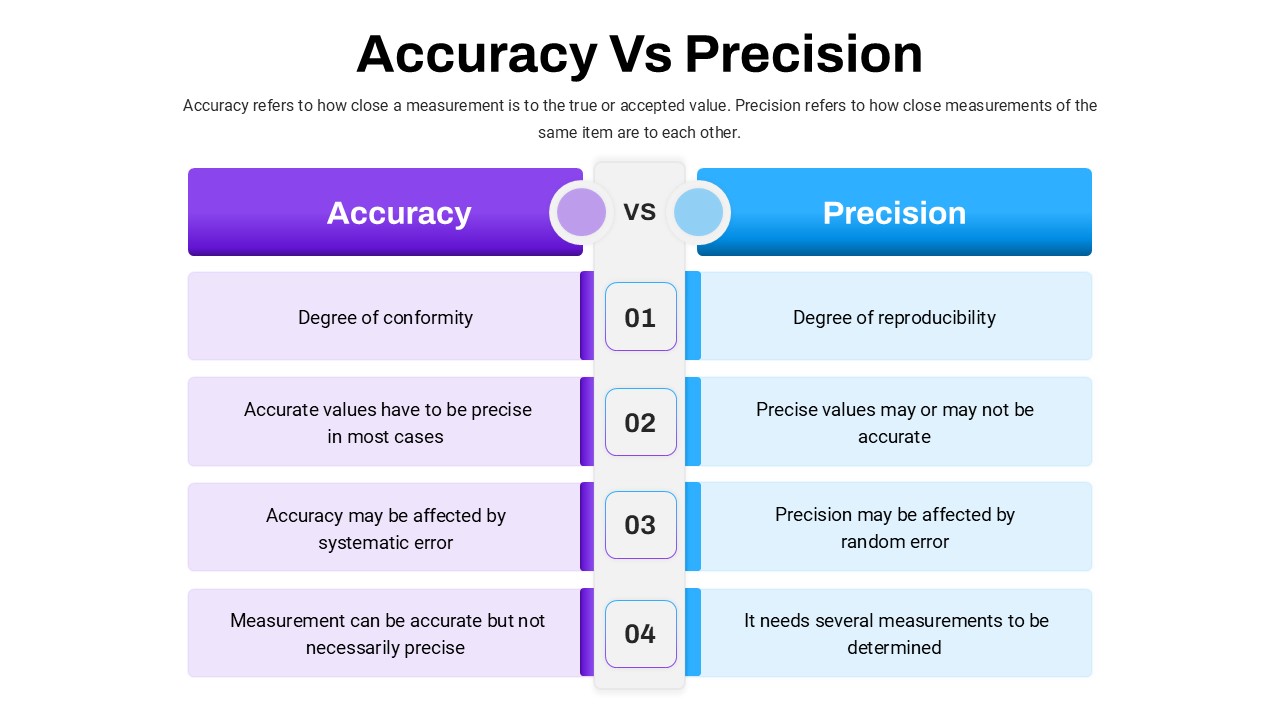
Accuracy Vs Precision Comparison Template for PowerPoint & Google Slides
Comparison Chart
Customer Persona Comparison Profile Template for PowerPoint & Google Slides
Business
Operating Channels Comparison Diagram Template for PowerPoint & Google Slides
Business Models
4 Set Venn Diagram Comparison Template for PowerPoint & Google Slides
Comparison