Circle Strategy Creative Chart for PowerPoint


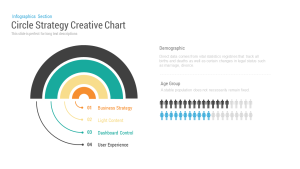
The Circle Strategy Creative Chart PowerPoint Template gives business strategists, consultants, and data analysts a structured layout to present layered priorities, categorical comparisons, and demographic breakdowns in a single slide. This template fits strategic planning sessions, market analysis reports, and executive briefings. It is fully editable in PowerPoint and Google Slides, so presenters can replace placeholder text, adjust color fills, and reorder content without rebuilding the layout from scratch.
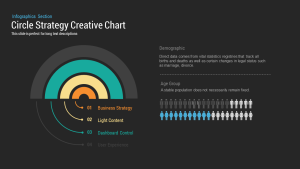
The slide uses a white background with charcoal, teal, yellow, and orange as the primary accent colors. The left section features a semicircular concentric arc diagram divided into four distinct layers, each mapped to a numbered label below: Business Strategy, Light Content, Dashboard Control, and User Experience. The arc structure communicates hierarchy and layered relationships at a glance, making it practical for presenting tiered frameworks or phased strategies. The right section splits into two content blocks. The upper block, labeled Demographic, holds a heading and a short descriptive text area separated by a dotted divider. The lower block, labeled Age Group, pairs a brief text field with a pictograph row displaying male and female icons in two colors, teal and gray, to represent population distribution across segments. The combination of a structural diagram and a statistical pictograph on one slide supports side-by-side analysis without requiring multiple slides.
All shapes, arc segments, icons, and text boxes are editable and users can remap the arc layers to different categories, update the pictograph count, change label colors, and adjust font sizing to align with their reporting standards.
Download the Circle Strategy Creative Chart Template and present your strategic data with clarity and precision today.
Login to download this file

Item ID
SB00008
Related Templates

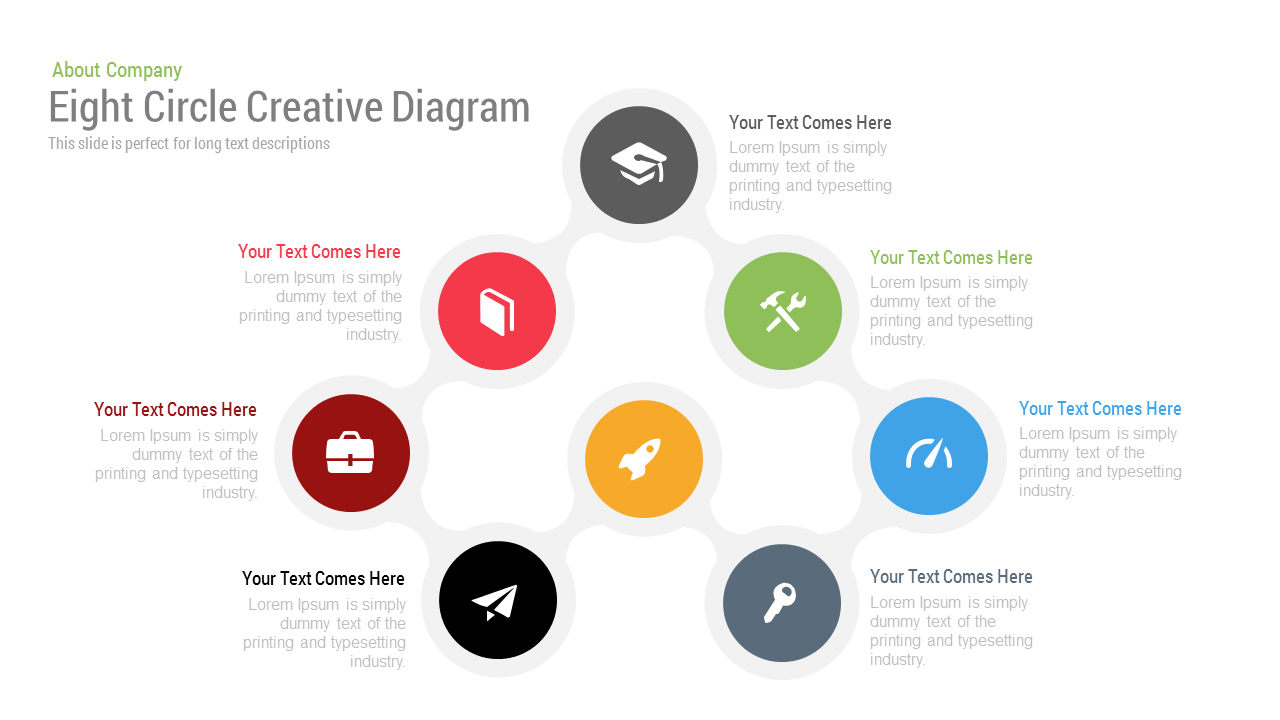
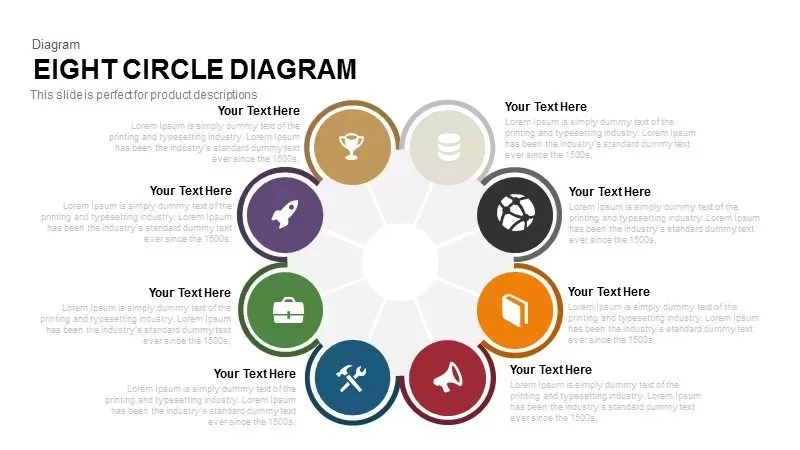
Free Eight Circle Creative Diagram Template for PowerPoint & Google Slides
Circular
Free

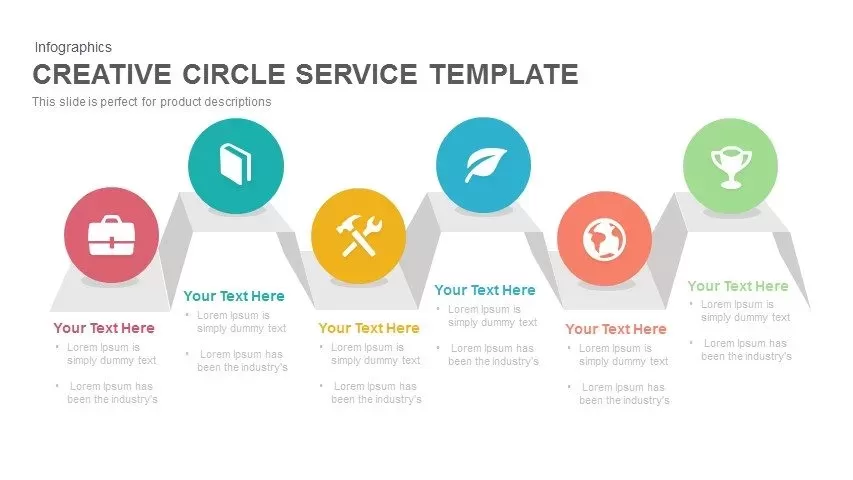
Creative Zigzag Circle Service Steps Template for PowerPoint & Google Slides
Process
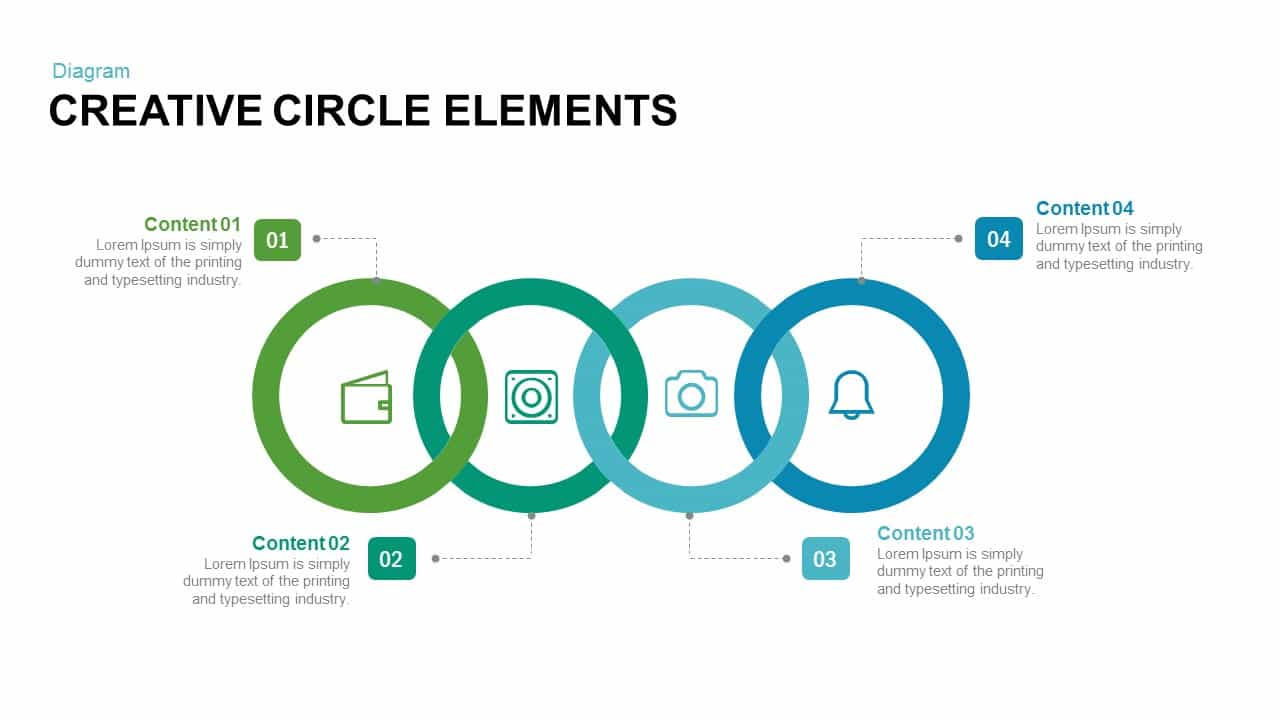
Creative Circle Elements for PowerPoint & Google Slides
Infographics
Creative Three-Circle Venn Diagram Template for PowerPoint & Google Slides
Comparison
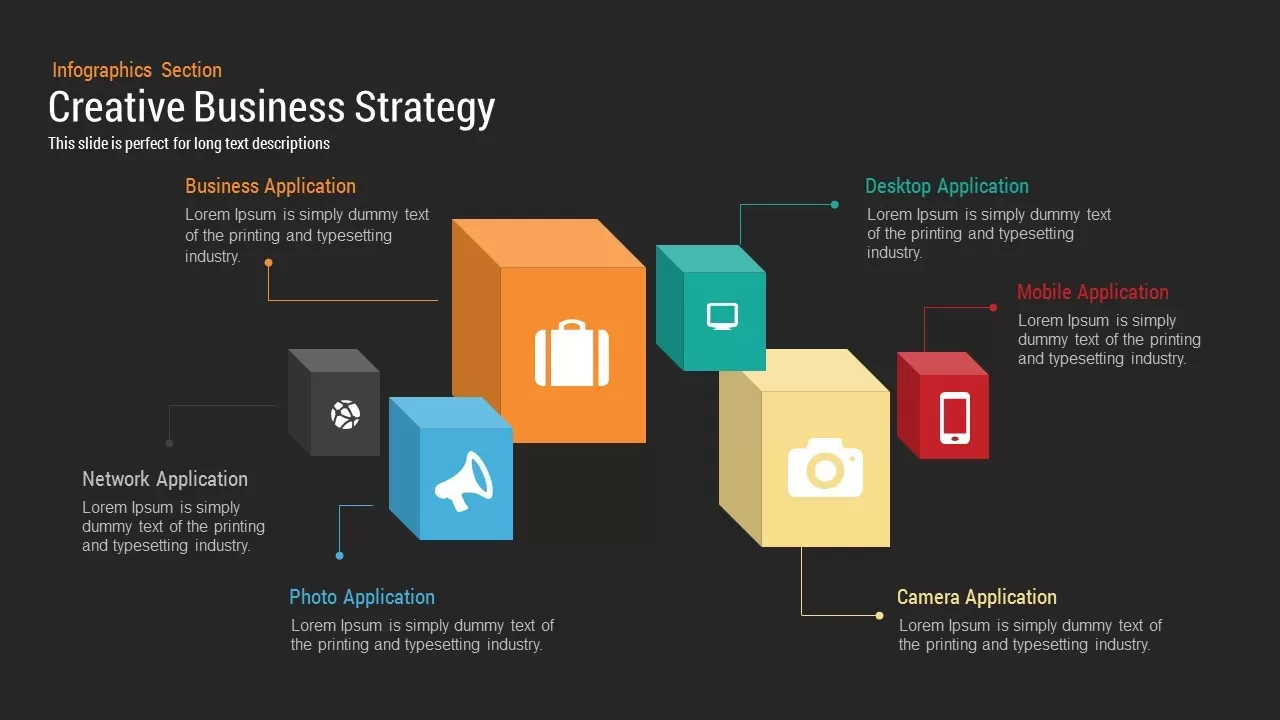
Creative Business Strategy Template for PowerPoint & Google Slides
Business Strategy
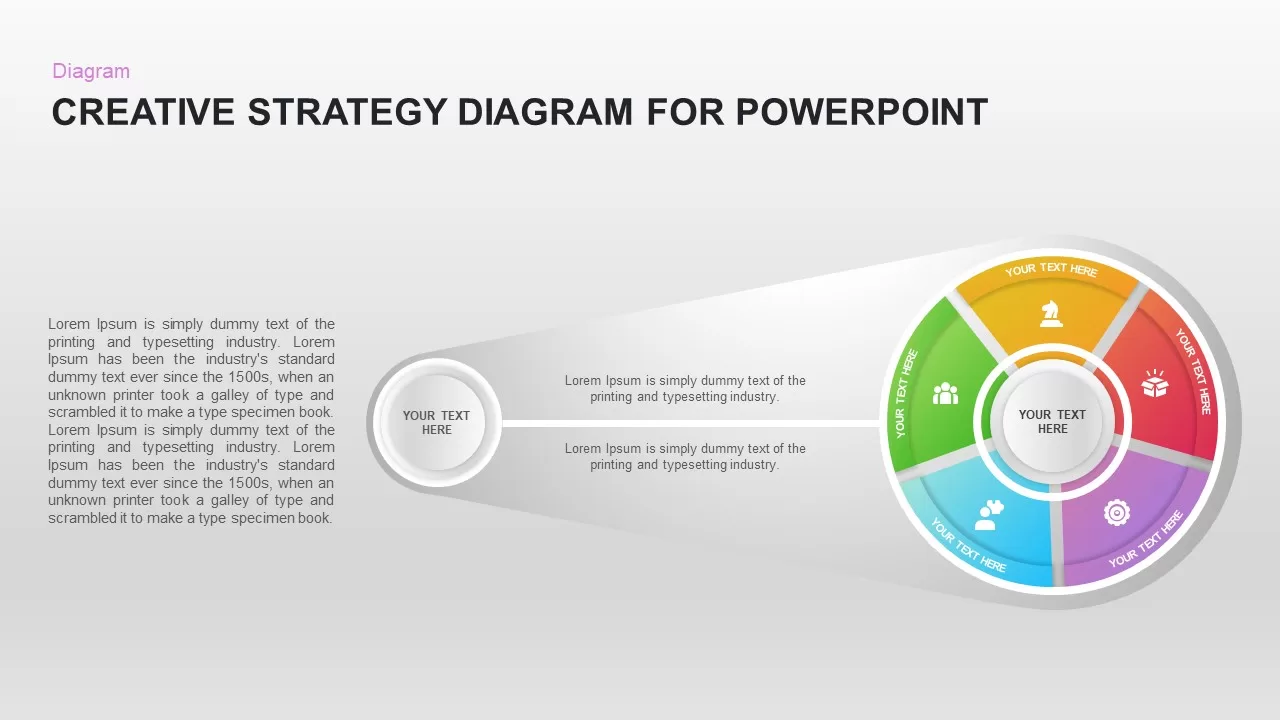
Creative Strategy Diagram Template for PowerPoint & Google Slides
Business Strategy
Circle Chart Data template for PowerPoint & Google Slides
Pie/Donut
Creative Data Analysis Bar Chart template for PowerPoint & Google Slides
Bar/Column
Creative SWOT Chart template for PowerPoint & Google Slides
SWOT
Creative Dynamic Gantt Chart Timeline Template for PowerPoint & Google Slides
Timeline
Creative Bar Chart template for PowerPoint & Google Slides
Charts
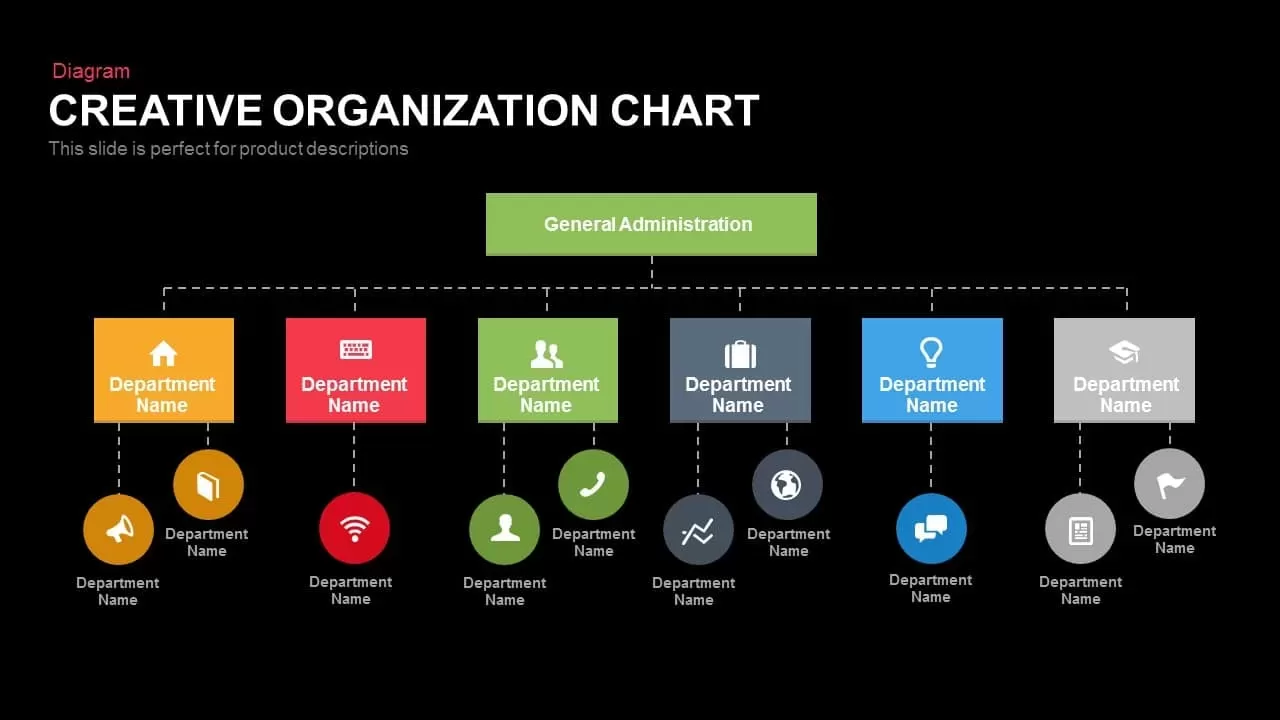
Creative Organization Chart Diagram Template for PowerPoint & Google Slides
Org Chart
Creative Organizational Chart Template for PowerPoint & Google Slides
Org Chart

Creative data chart Analytics Presentation Template
Charts
Cost Reduction Strategy Donut Chart Template for PowerPoint & Google Slides
Pie/Donut
Skimming Pricing Strategy Line Chart Template for PowerPoint & Google Slides
Business Strategy
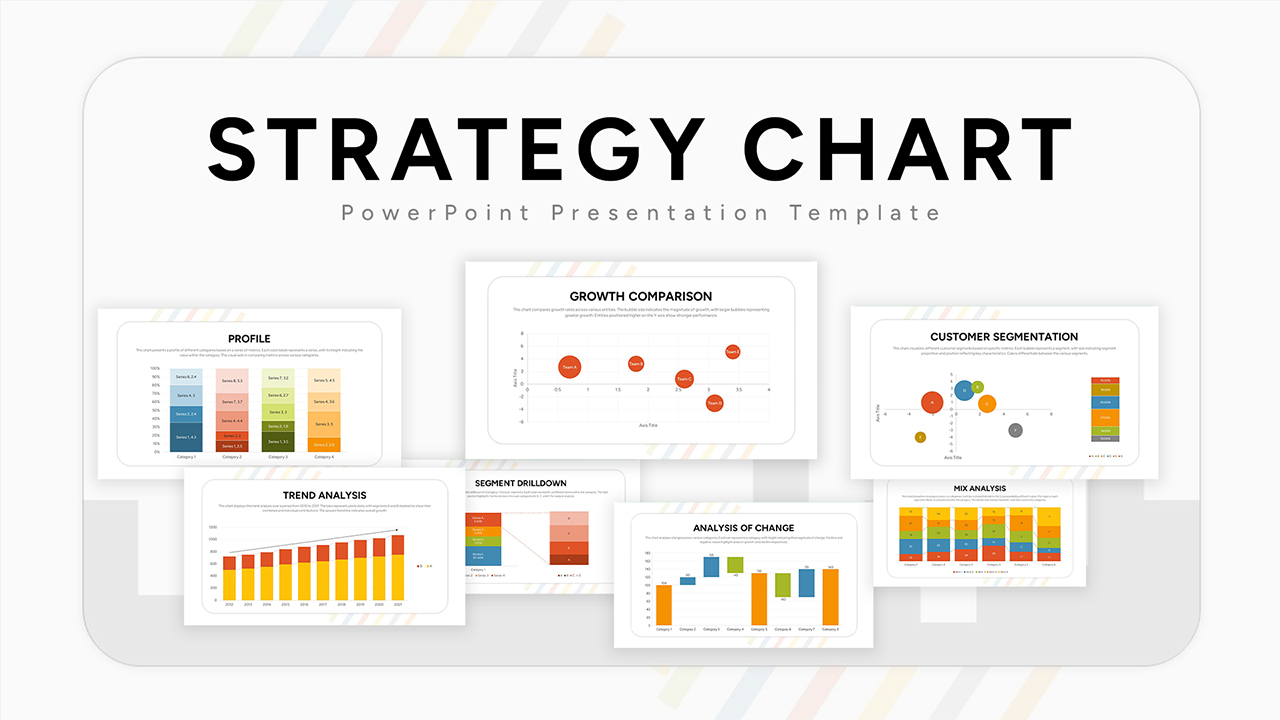
Ultimate Strategy Chart Presentation Template for PowerPoint & Google Slides
Charts
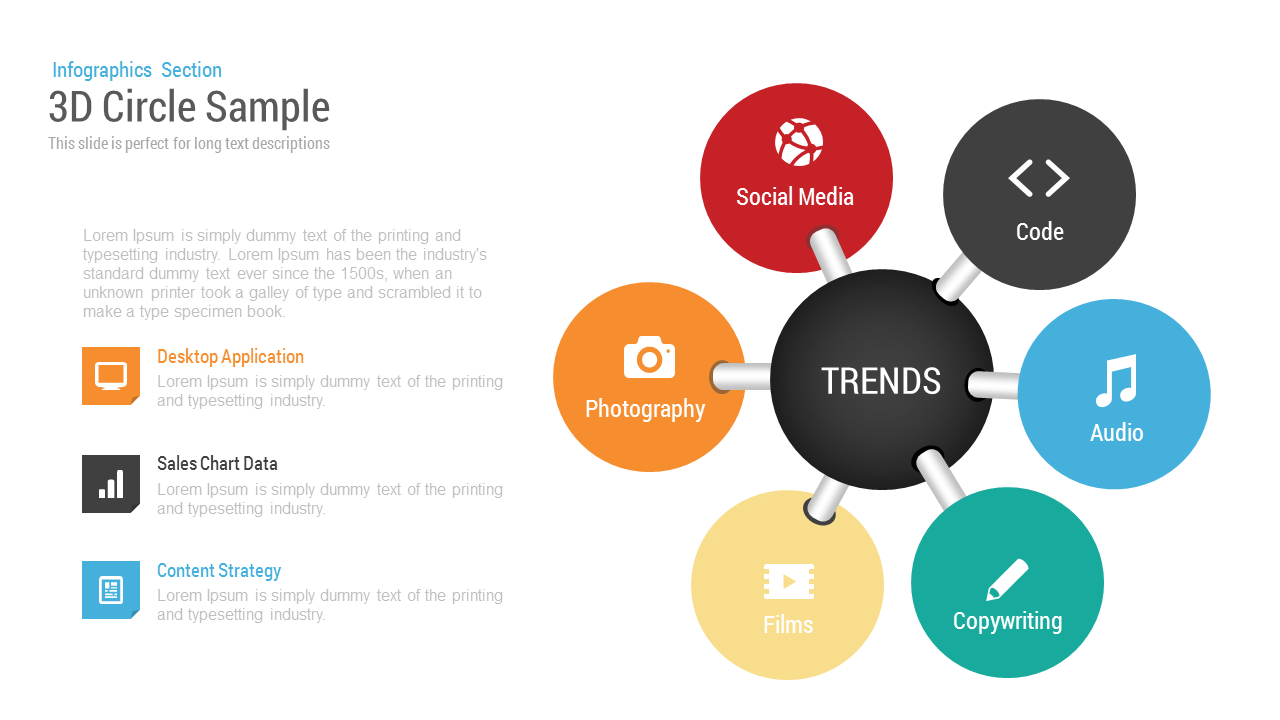
3D Circle Sample Editable Slide Template for PowerPoint
Circular
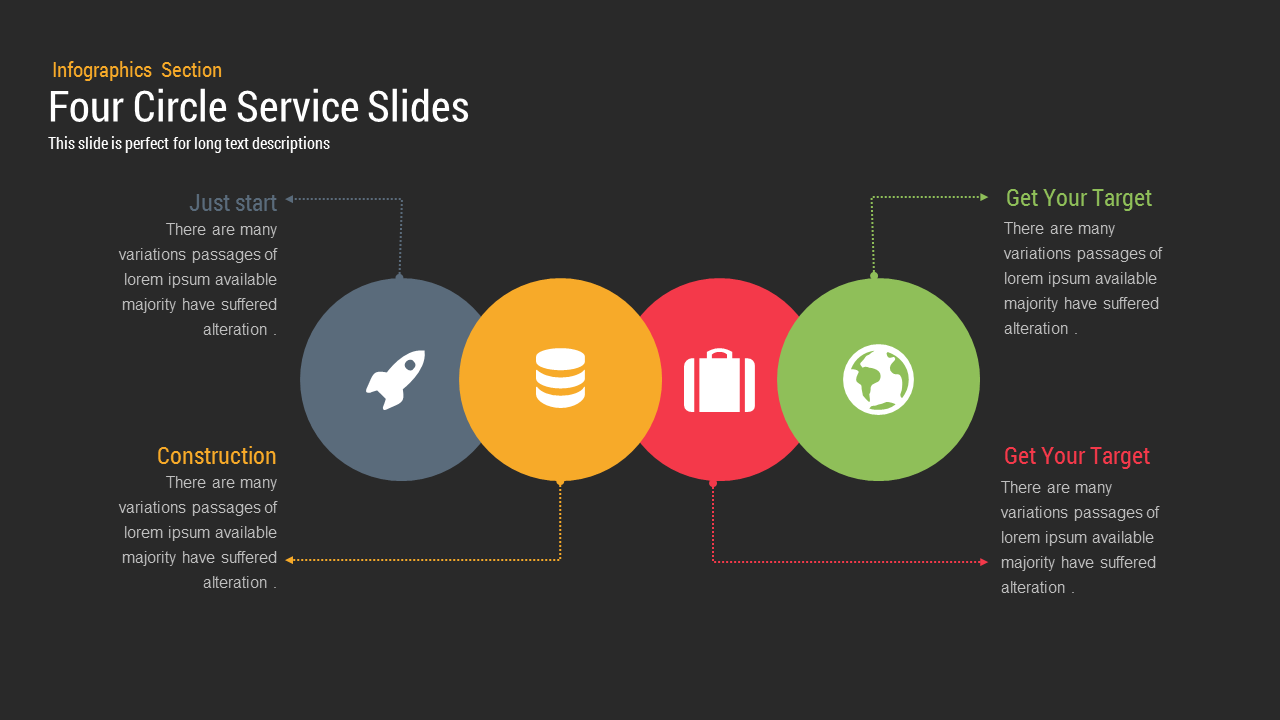
Four Circle Service template for PowerPoint & Google Slides
Process
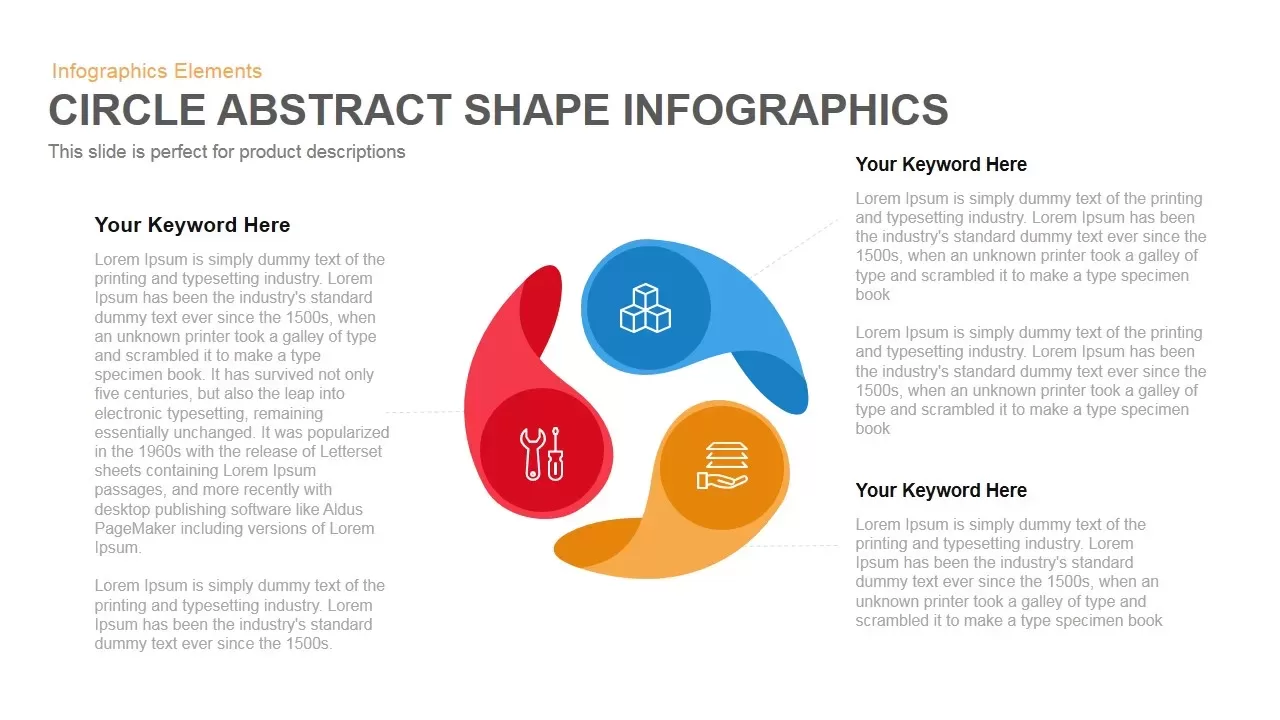
Circle Abstract Shape Infographics Template for PowerPoint & Google Slides
Circular
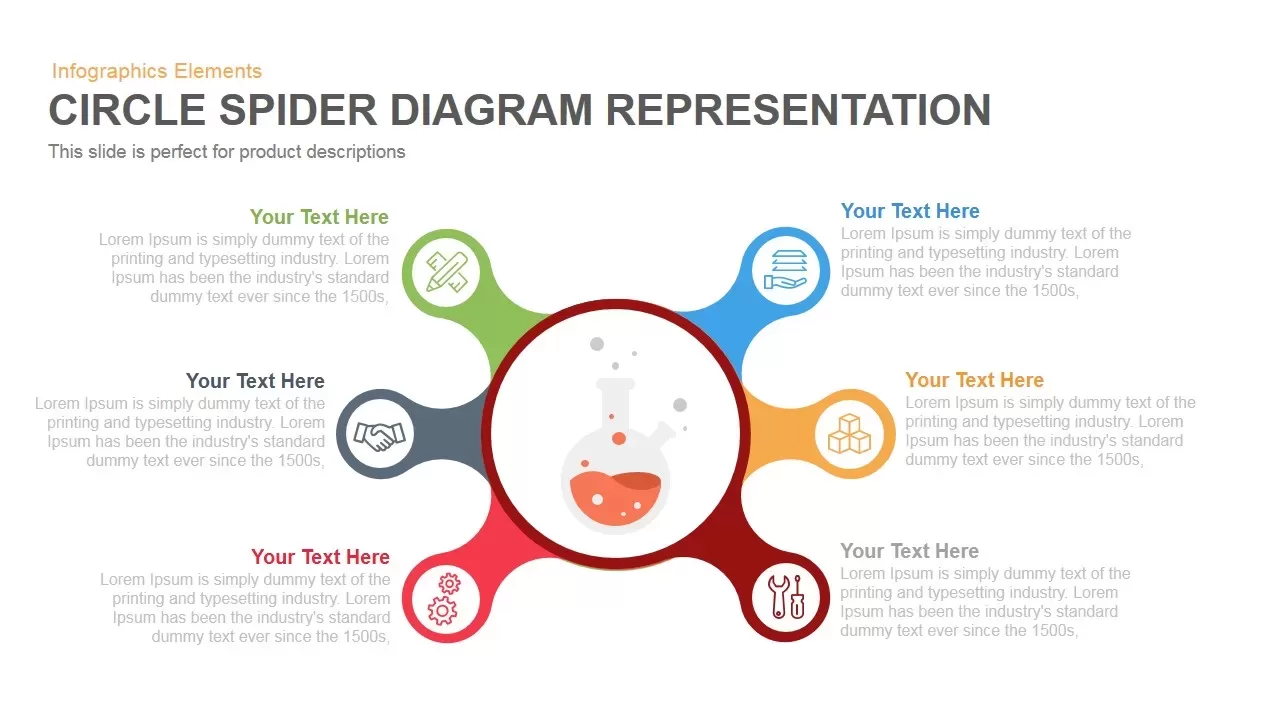
Circle Spider Diagram Template for PowerPoint and Google Slides
Circular
Circle Segment Sales Metrics Infographic Template for PowerPoint & Google Slides
Circular
Circle Graph Data Visualization Template for PowerPoint & Google Slides
Circular
Modern Circle SWOT Analysis Diagram Template for PowerPoint & Google Slides
SWOT
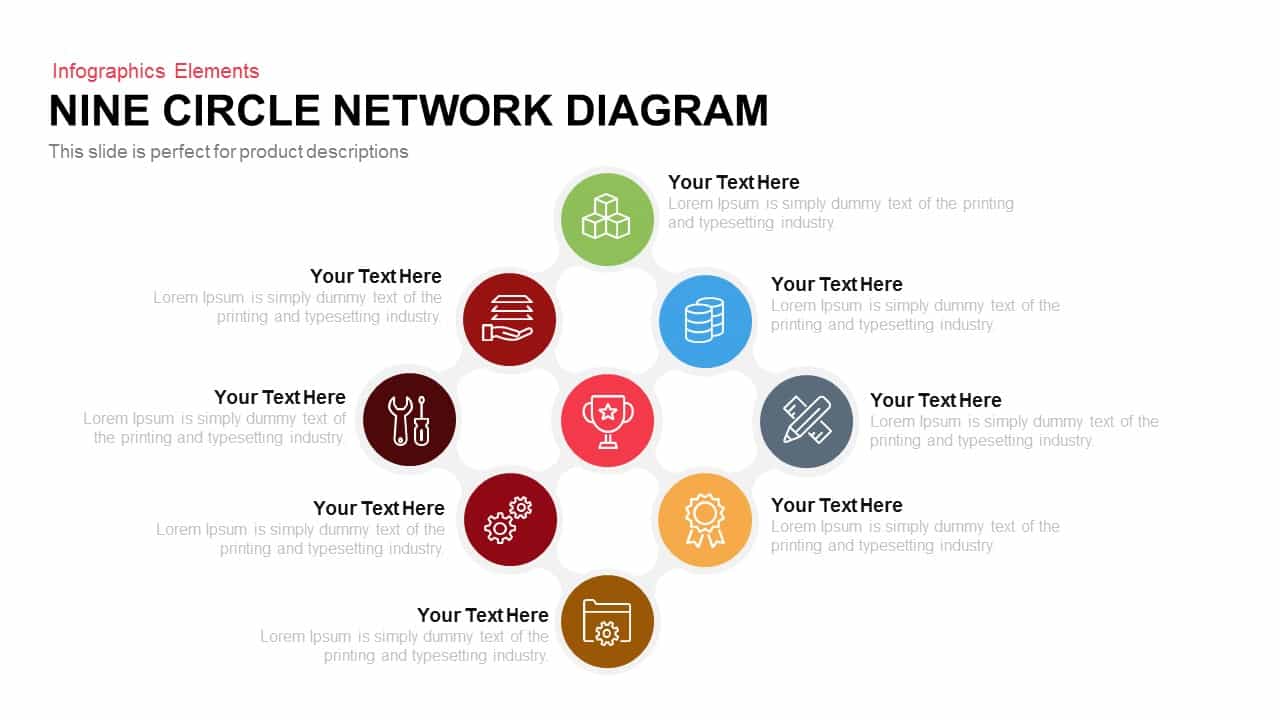
Modern Nine Circle Network Diagram Template for PowerPoint & Google Slides
Circular
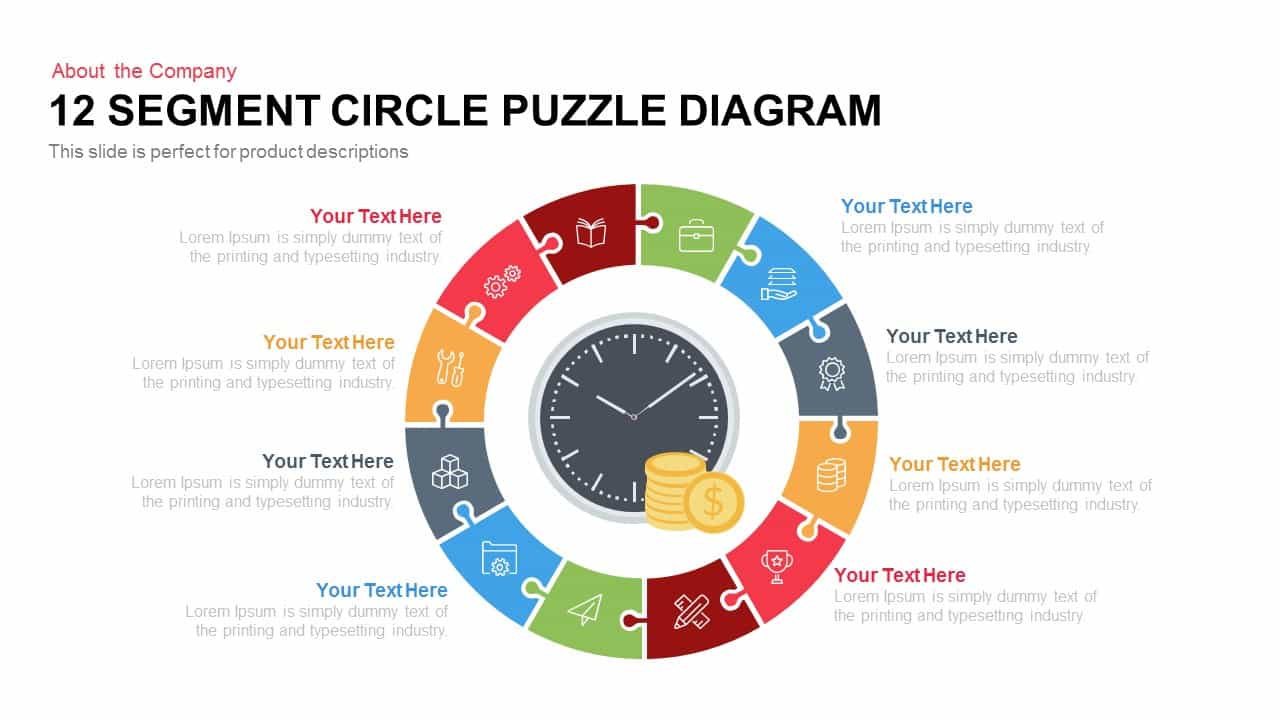
12 Segment Circle Puzzle Diagram Template for PowerPoint and Keynote
Circular
Alternating Circle Timeline Diagram Template for PowerPoint & Google Slides
Timeline
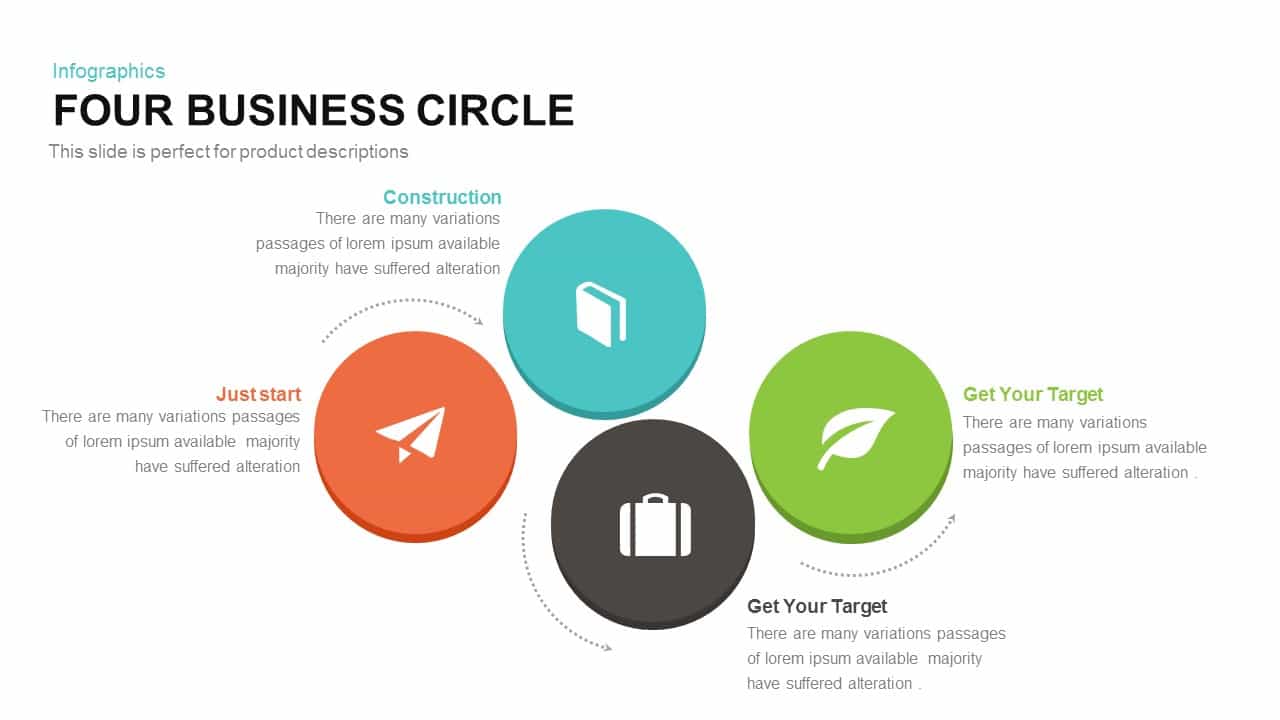
Four-Circle Business Process Infographic Template for PowerPoint & Google Slides
Circular
Three Circle Arrow Process Diagram template for PowerPoint & Google Slides
Circular
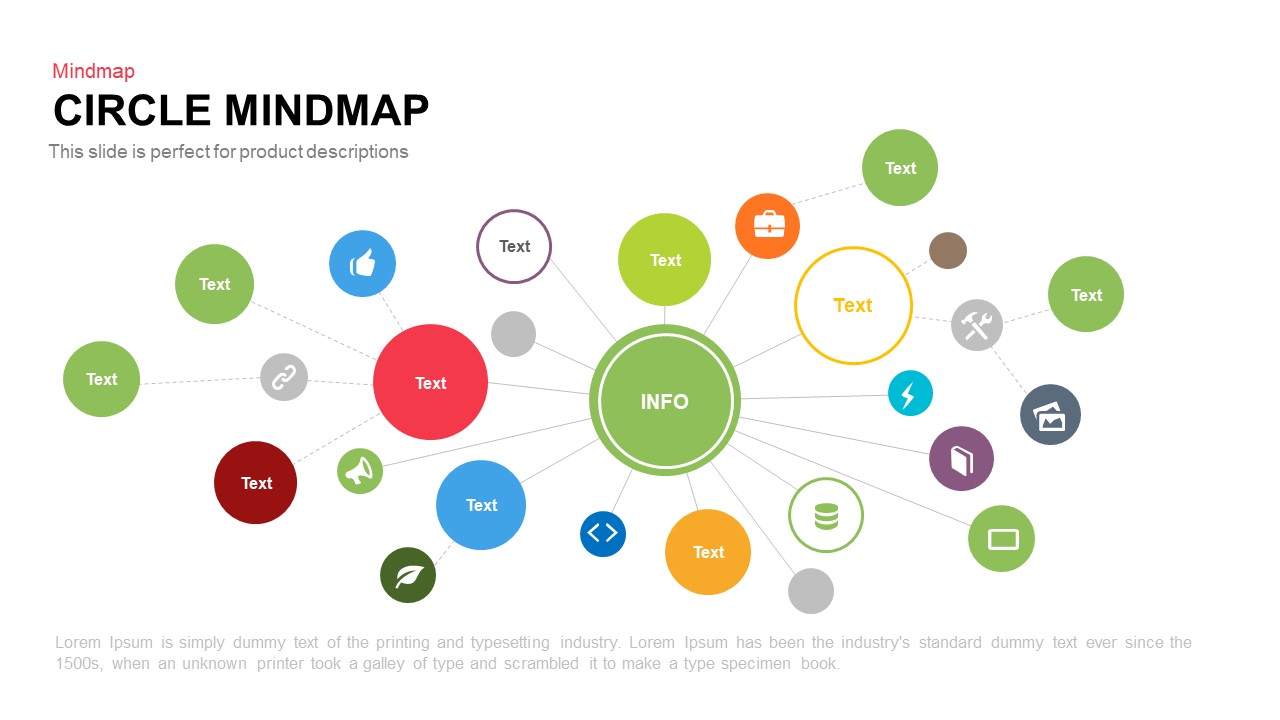
Circle Mindmap template for PowerPoint & Google Slides
Mind Maps
Multi-Segment Circle Split Diagram template for PowerPoint & Google Slides
Circular

Dynamic Circle Timeline Infographics template for PowerPoint & Google Slides
Timeline
Eight Circle Diagram Template for PowerPoint & Google Slides
Circular
Multi-layout Circle Spoke Diagram Template for PowerPoint & Google Slides
Circular

Four-Circle Venn Process Diagram template for PowerPoint & Google Slides
Process
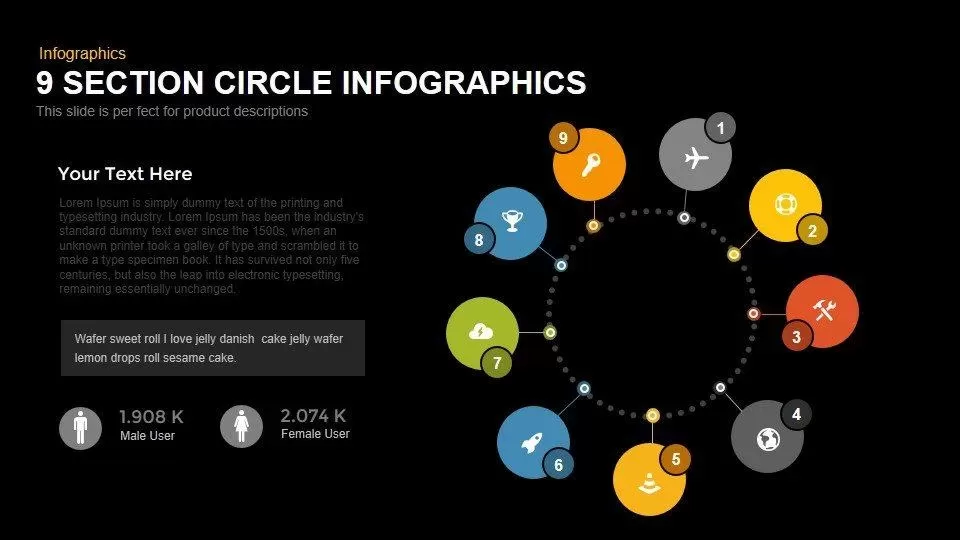
Modern 9-Section Circle Infographics Template for PowerPoint & Google Slides
Circular
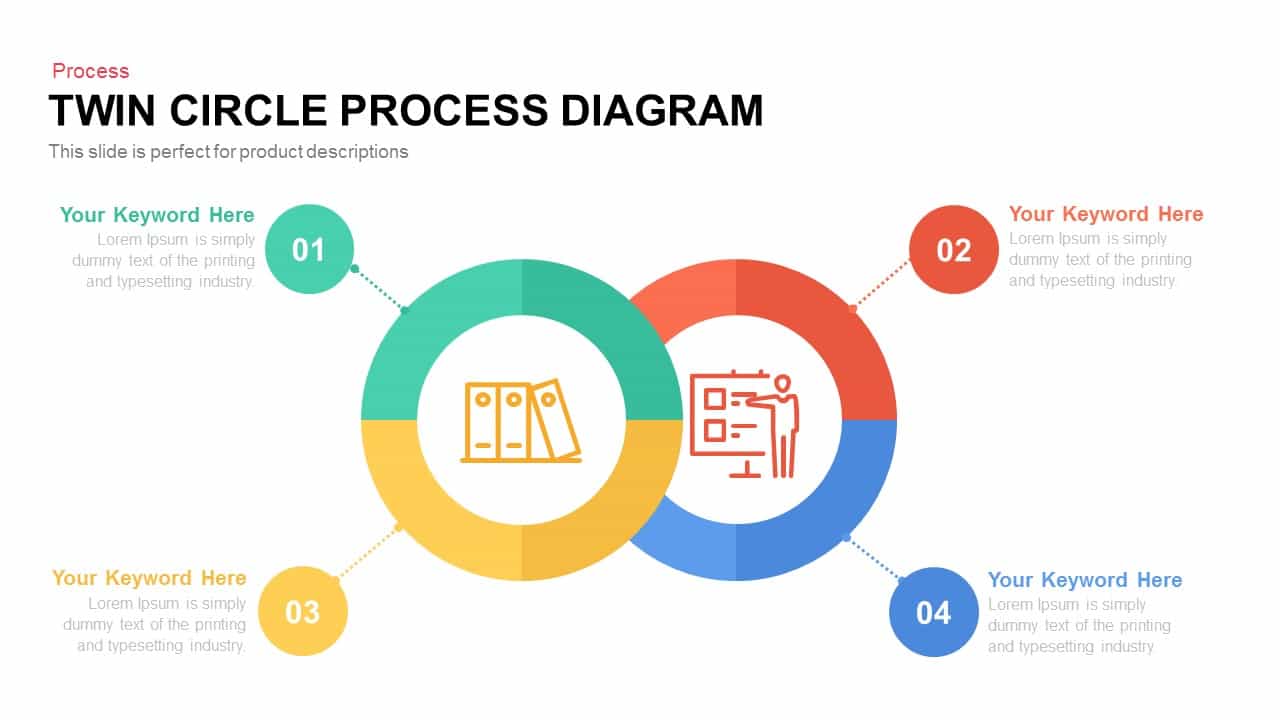
Editable Twin Circle Process Diagram Template for PowerPoint & Google Slides
Process
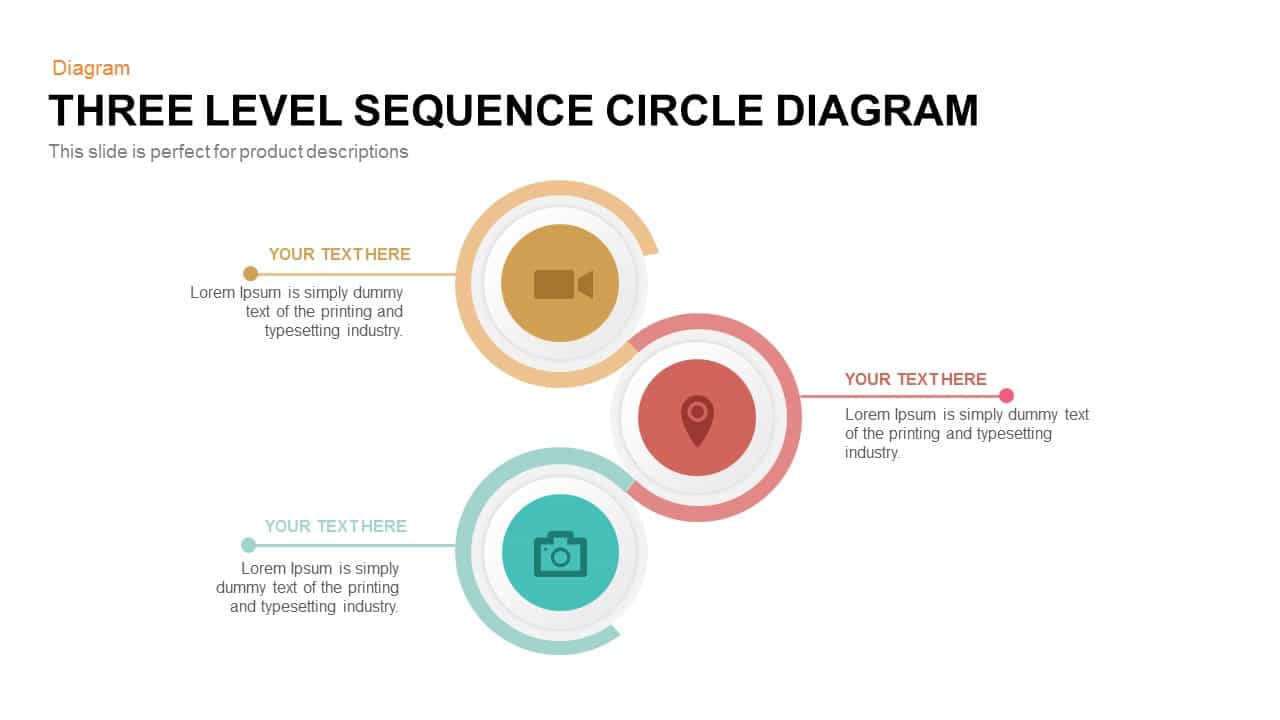
Three-Level Sequence Circle Diagram Template for PowerPoint & Google Slides
Circular
Five-Staged Circle Sections Diagram Template for PowerPoint & Google Slides
Circular
Five-Stage Semi-Circle Diagram Template for PowerPoint & Google Slides
Process
Five-Stage Circle Arrow Diagram Template for PowerPoint & Google Slides
Circular
Two-Stage Semi-Circle Diagram Overview Template for PowerPoint & Google Slides
Circular
Three-Circle Diagram Infographic Template for PowerPoint & Google Slides
Circular
Modern Multi-Section Circle Diagram Template for PowerPoint & Google Slides
Circular
Six-Stage Semi-Circle Diagram with Icons Template for PowerPoint & Google Slides
Circular
Four Linked Circle Diagram for PowerPoint & Google Slides
Process
Four-Circle Hub and Spoke Diagram Template for PowerPoint & Google Slides
Process
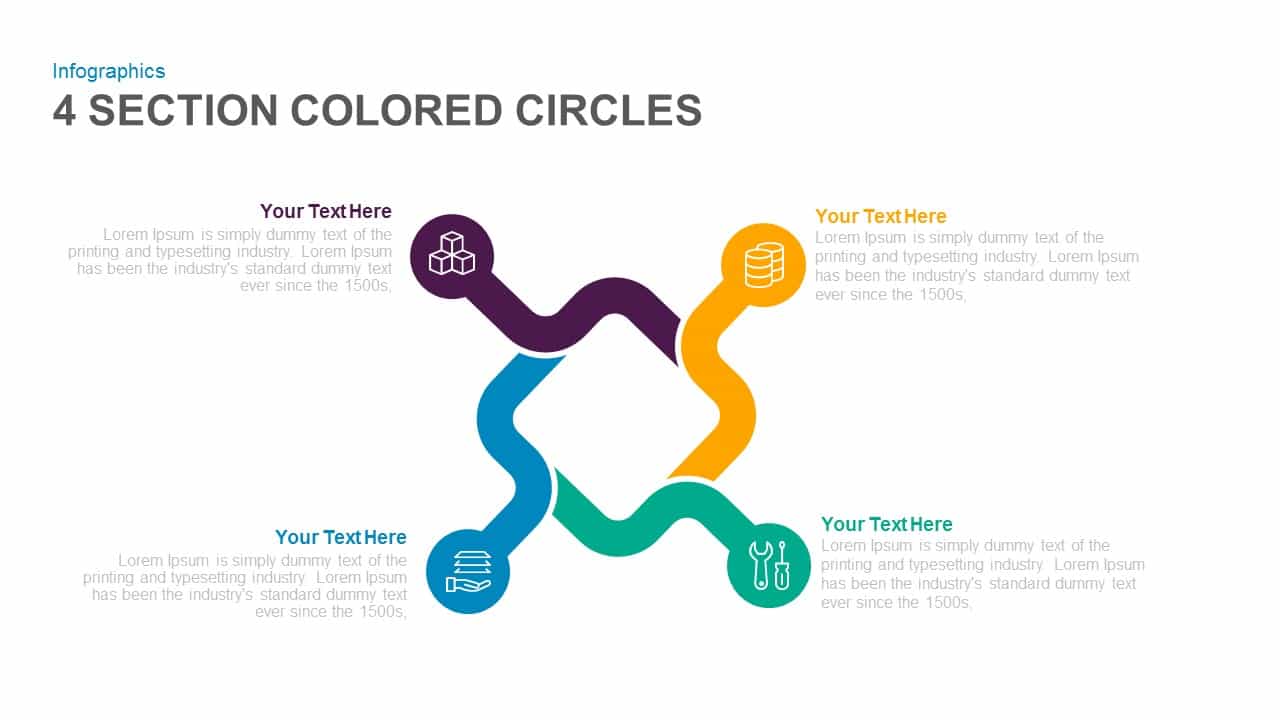
Four-Section Colored Circle Infographic Template for PowerPoint & Google Slides
Circular
Arrow Circle Flow Diagram for PowerPoint & Google Slides
Infographics
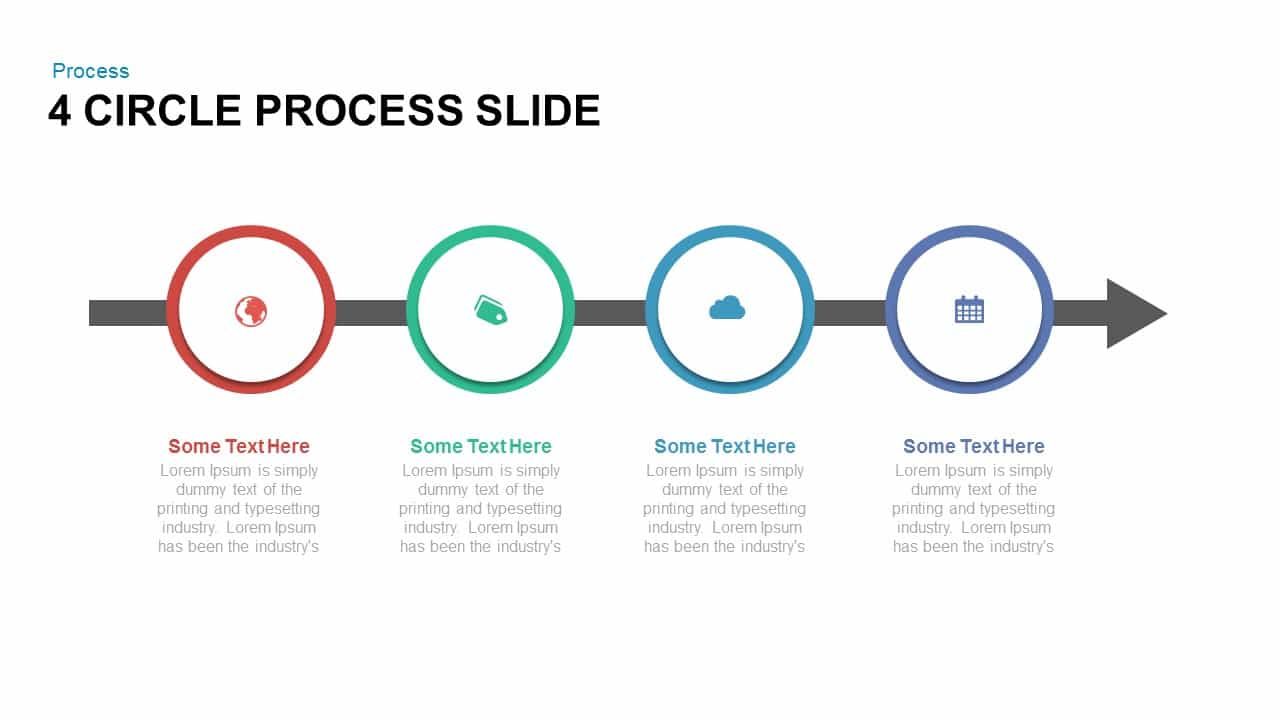
4 Circle Process for PowerPoint & Google Slides
Process
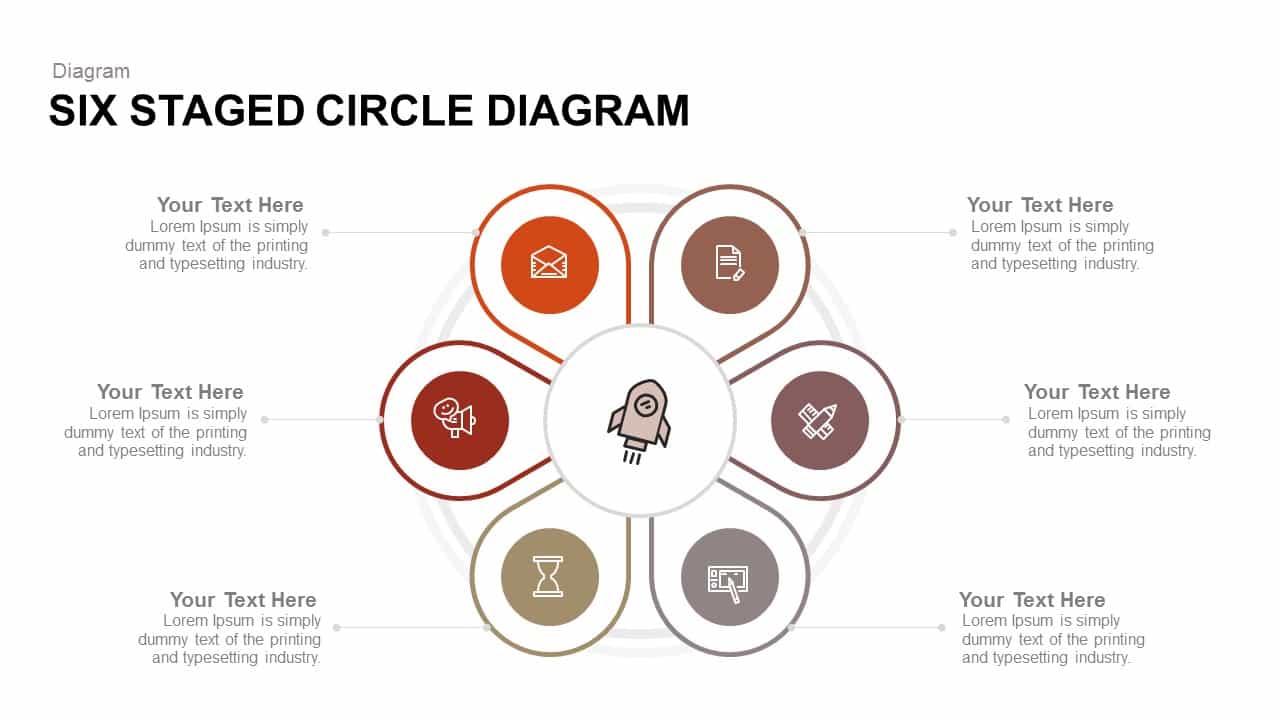
Six Staged Circle Diagram template for PowerPoint & Google Slides
Circular
Five-Point Circle Timeline Diagram Template for PowerPoint & Google Slides
Timeline
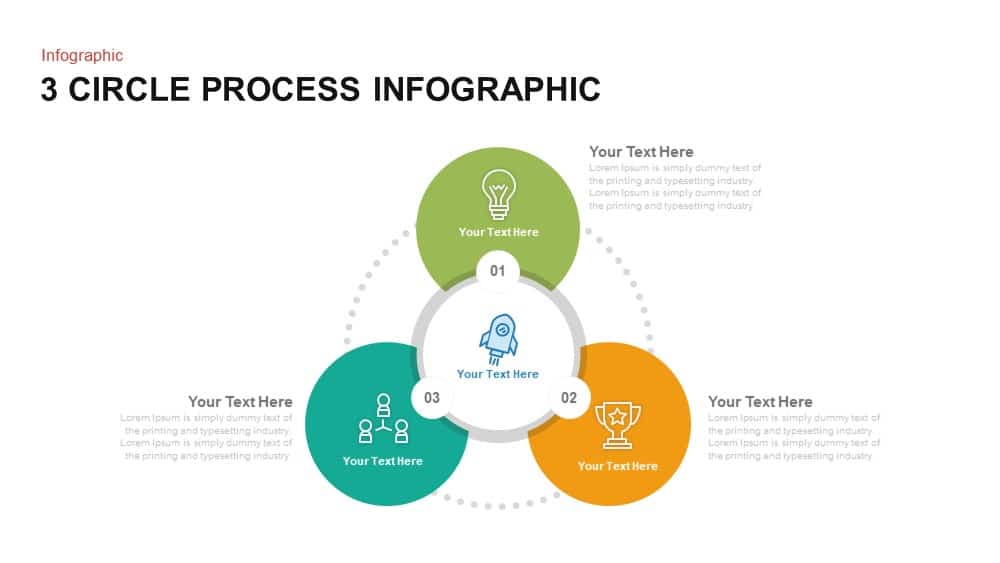
Three-Circle Process Infographic Template
Circular
Six-Stage Circle Process Diagram Template for PowerPoint & Google Slides
Process
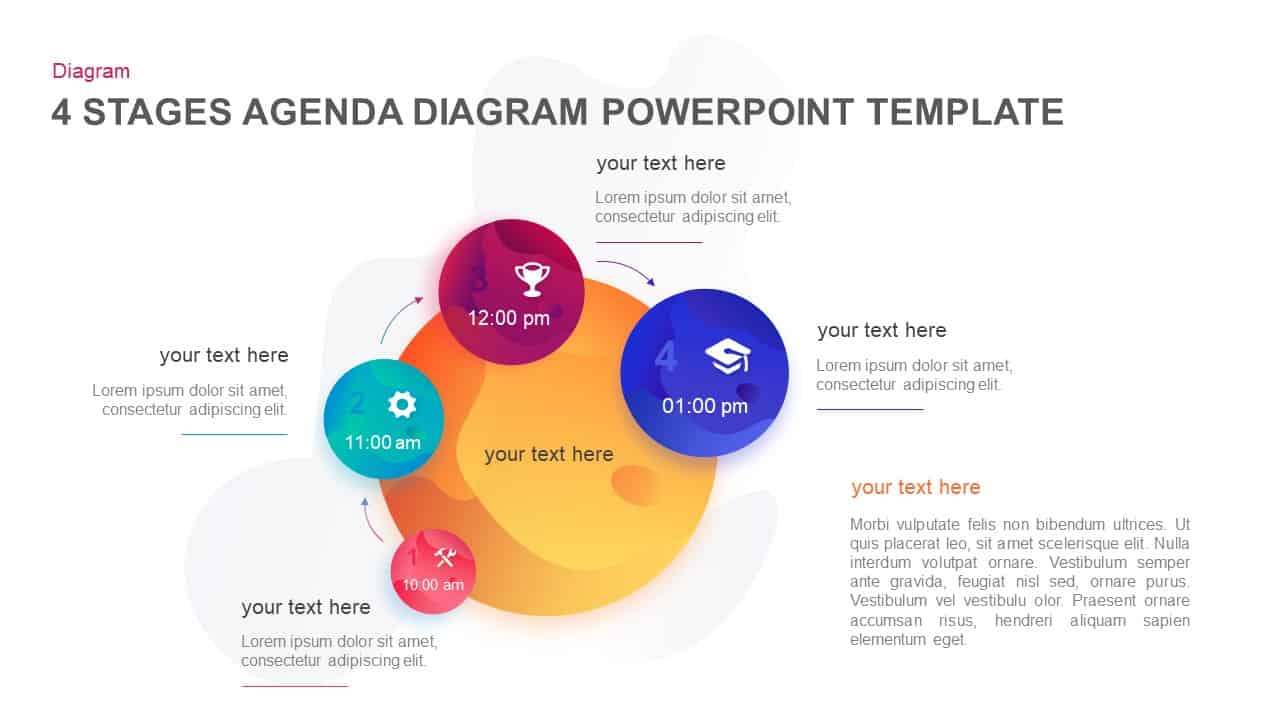
Four-Stage Agenda Circle Diagram Slide Template for PowerPoint & Google Slides
Agenda
Six-Circle Process Infographic Diagram Template for PowerPoint & Google Slides
Circular

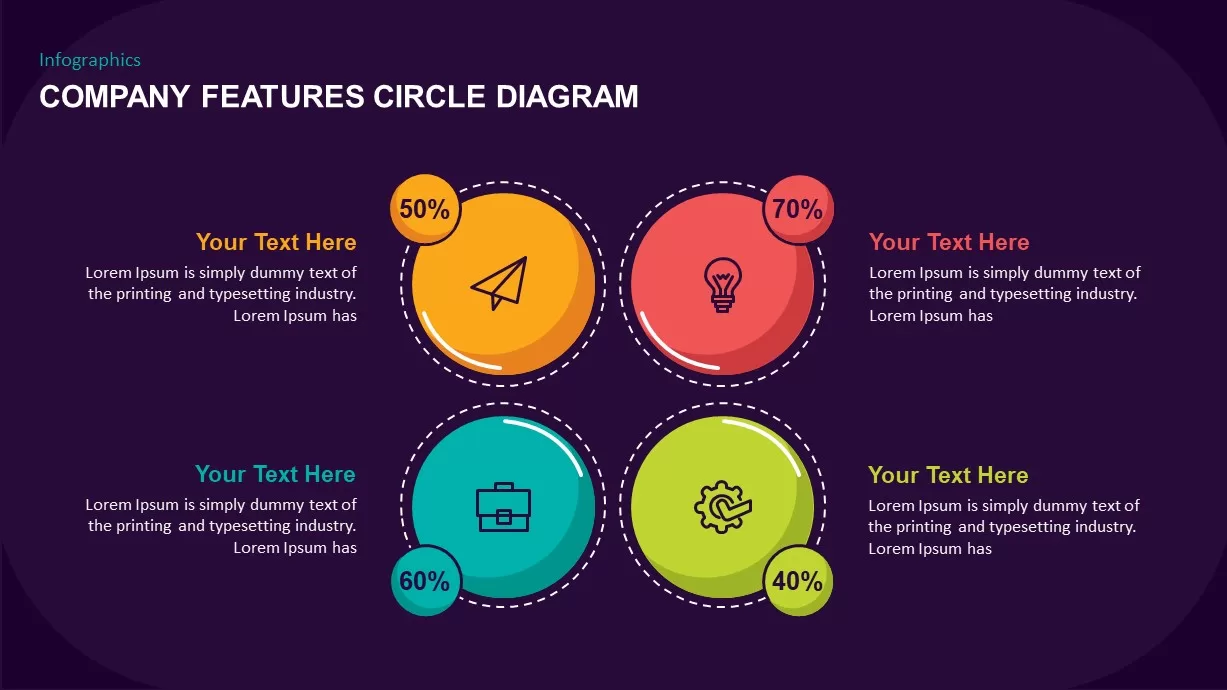
Company Features Circle Diagram for PowerPoint & Google Slides
Process
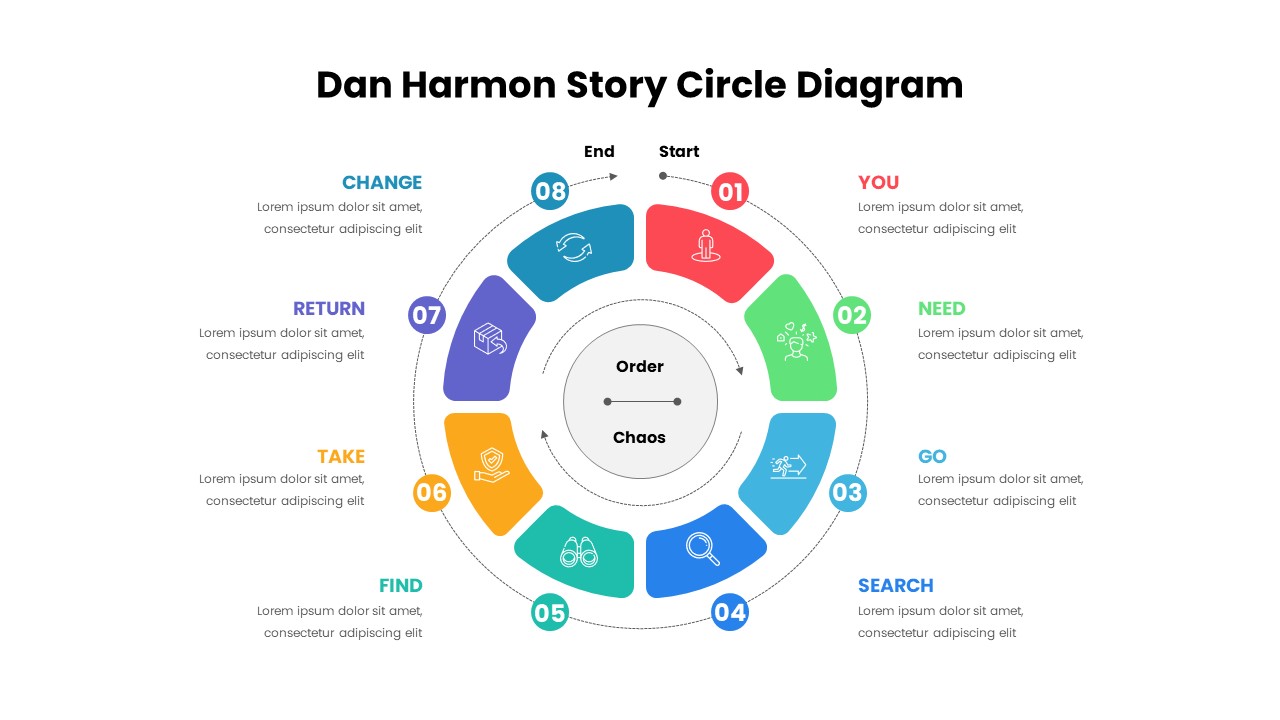
Dan Harmon Story Circle Diagram Template
Circular
Circle Arrows Diagram template for PowerPoint & Google Slides
Process
Circle Arrows Process Flow template for PowerPoint & Google Slides
Process
Circle Arrow Process Flow template for PowerPoint & Google Slides
Process
Circle Arrow Process Flow template for PowerPoint & Google Slides
Process
Four-Stage Circle Arrow Infographic Template for PowerPoint & Google Slides
Circular
Four-Stage Circle Arrow Infographic Template for PowerPoint & Google Slides
Circular
Five Circle Venn Diagram for Template for PowerPoint & Google Slides
Circular
8 Circle Venn Diagram PowerPoint Template
Circular
6 Circle Venn Diagram PowerPoint Template
Circular
Free Graduation PowerPoint Template
Decks
Free

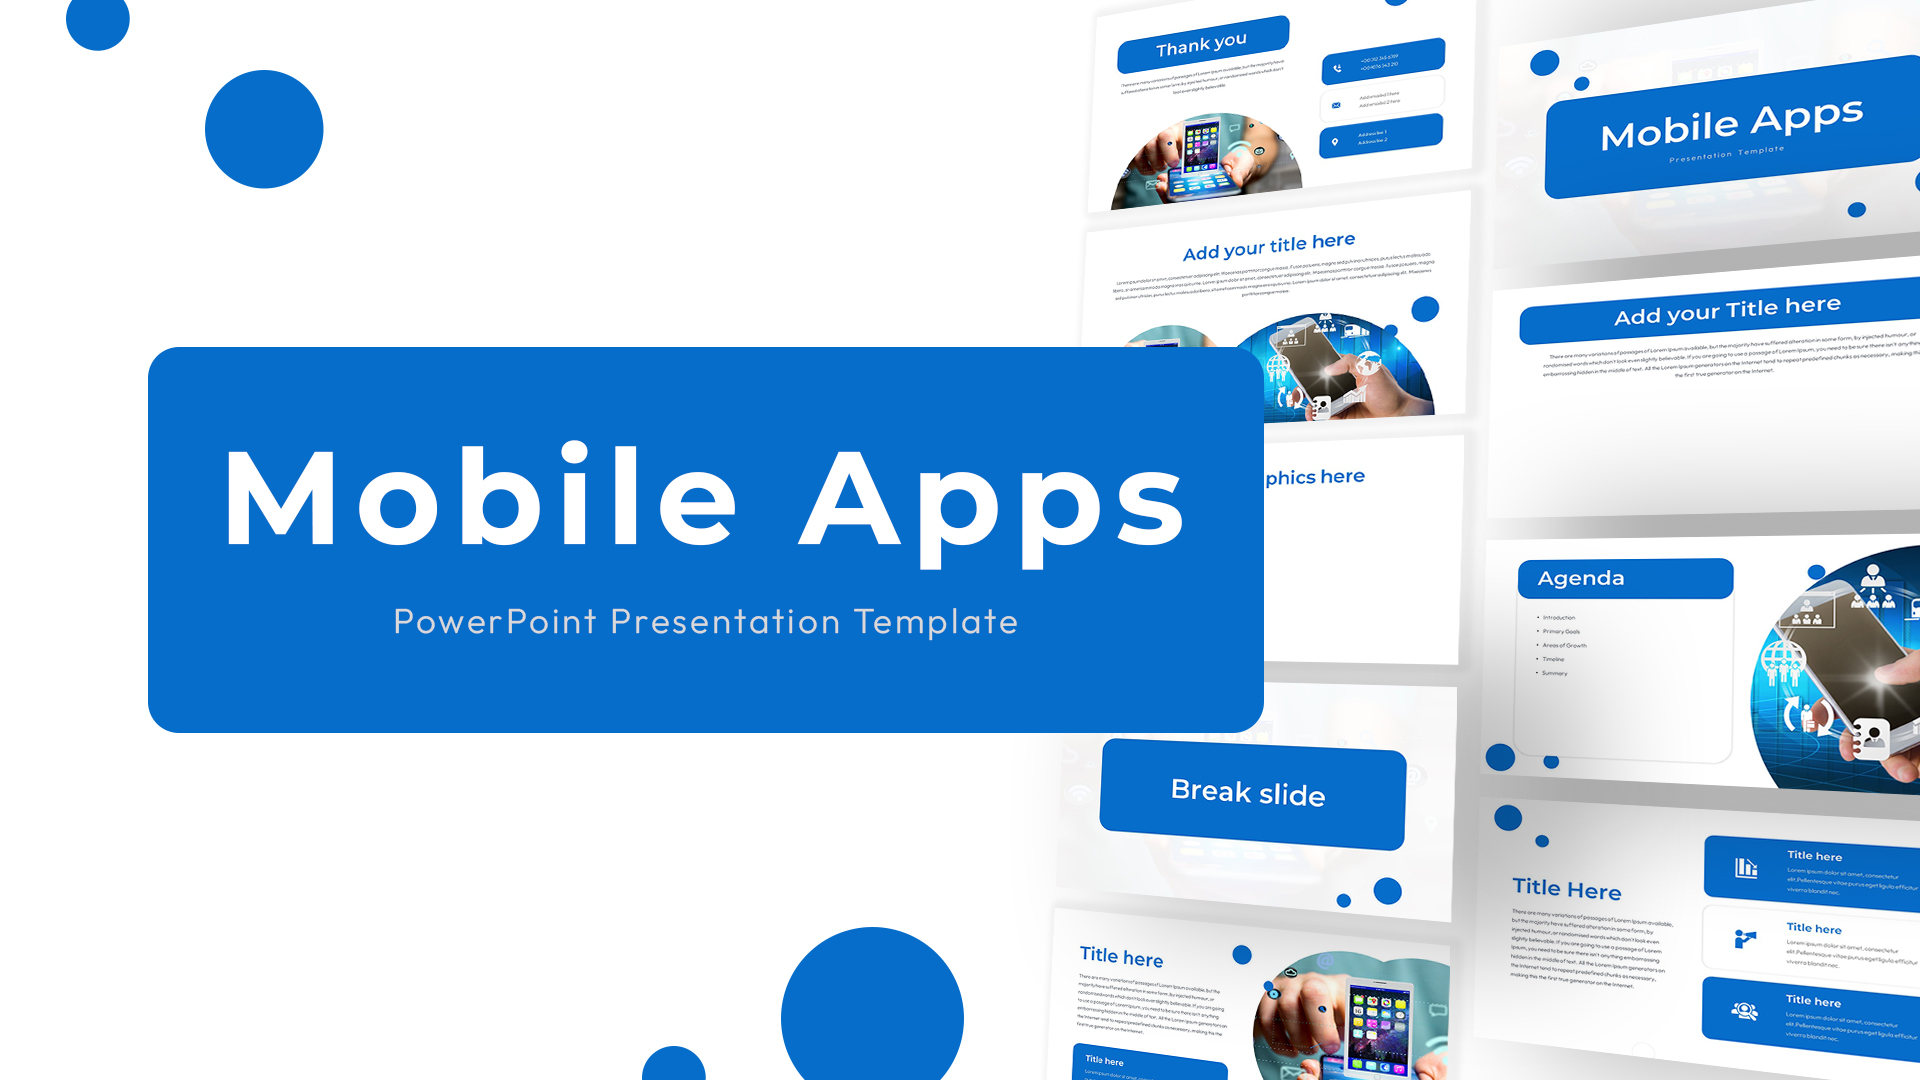
Blue Circle Mobile Apps Presentation Template for PowerPoint & Google Slides
Information Technology
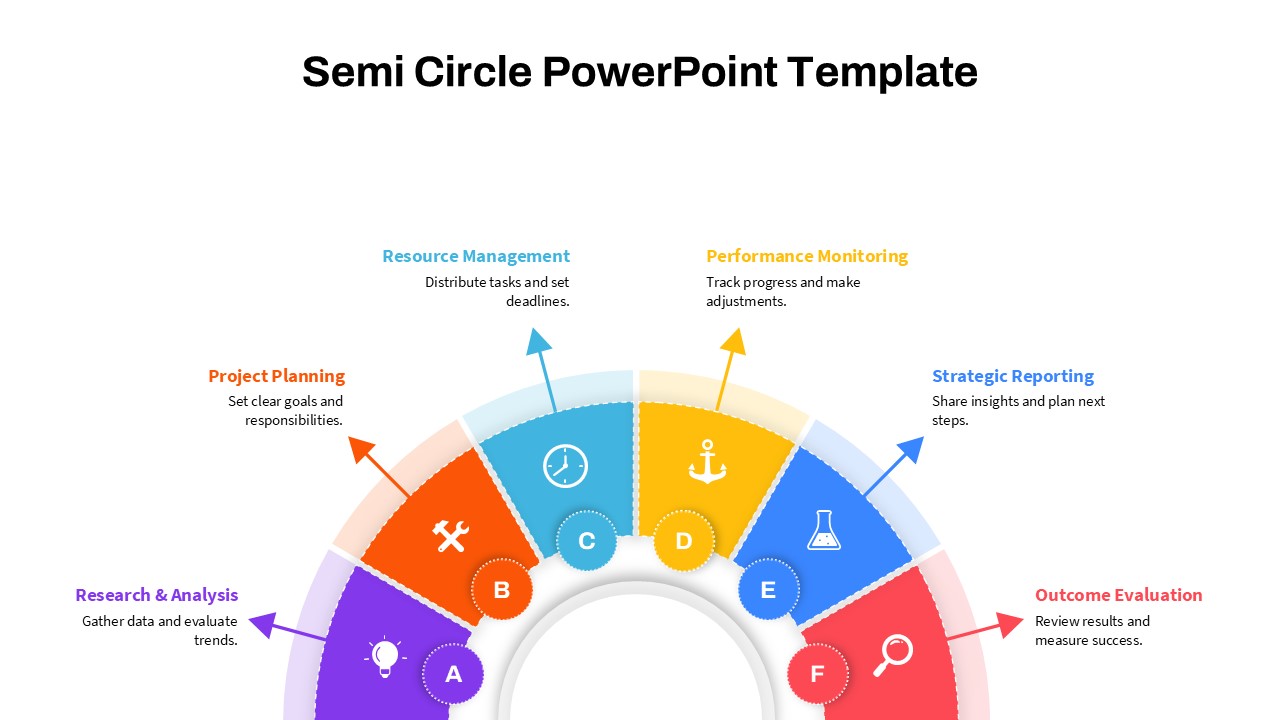
Modern Semi Circle Infographic Template for PowerPoint & Google Slides
Circular
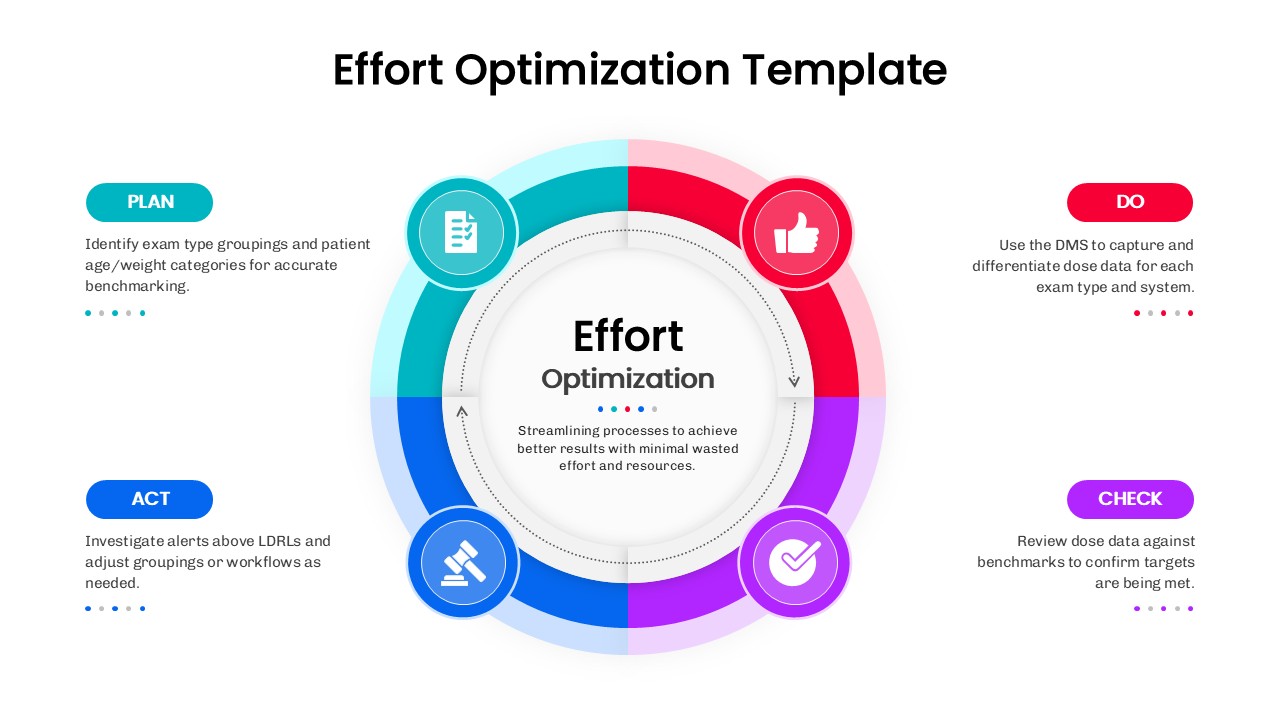
Effort Optimization PDCA Circle Diagram Template for PowerPoint & Google Slides
Circular
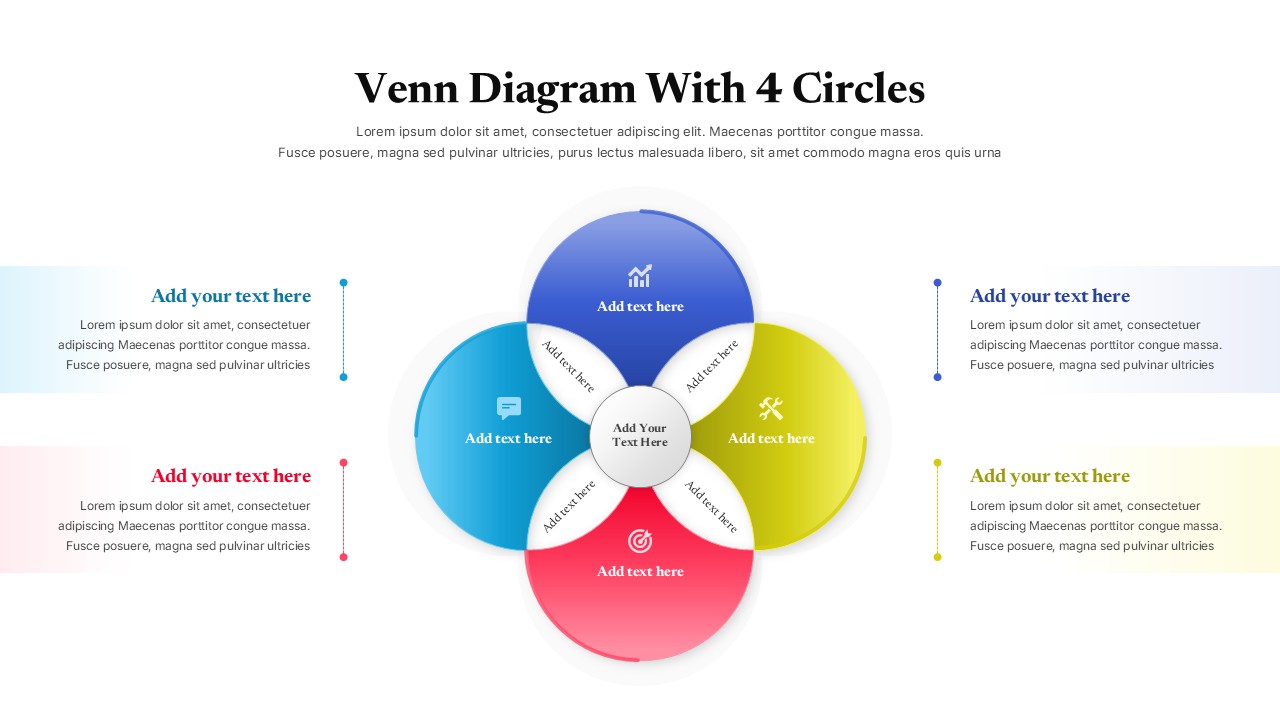
Colorful Venn Diagram with 4 Circle for PowerPoint & Google Slides
Circular
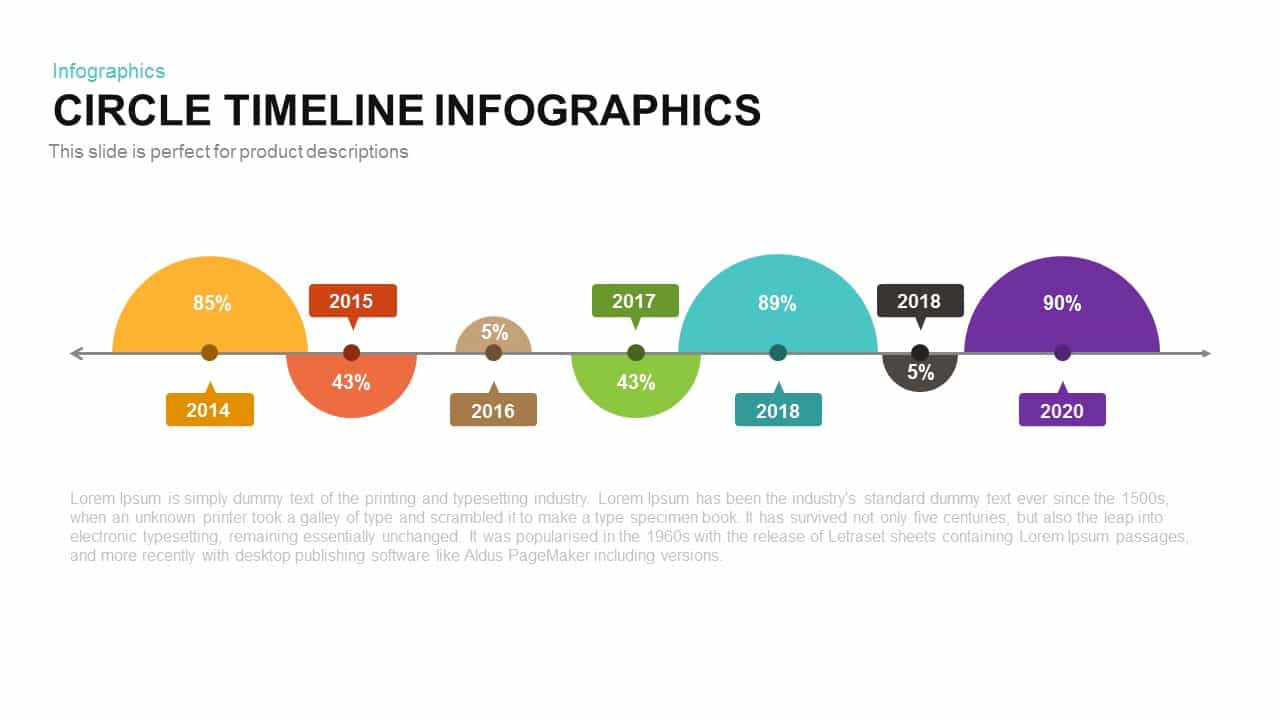
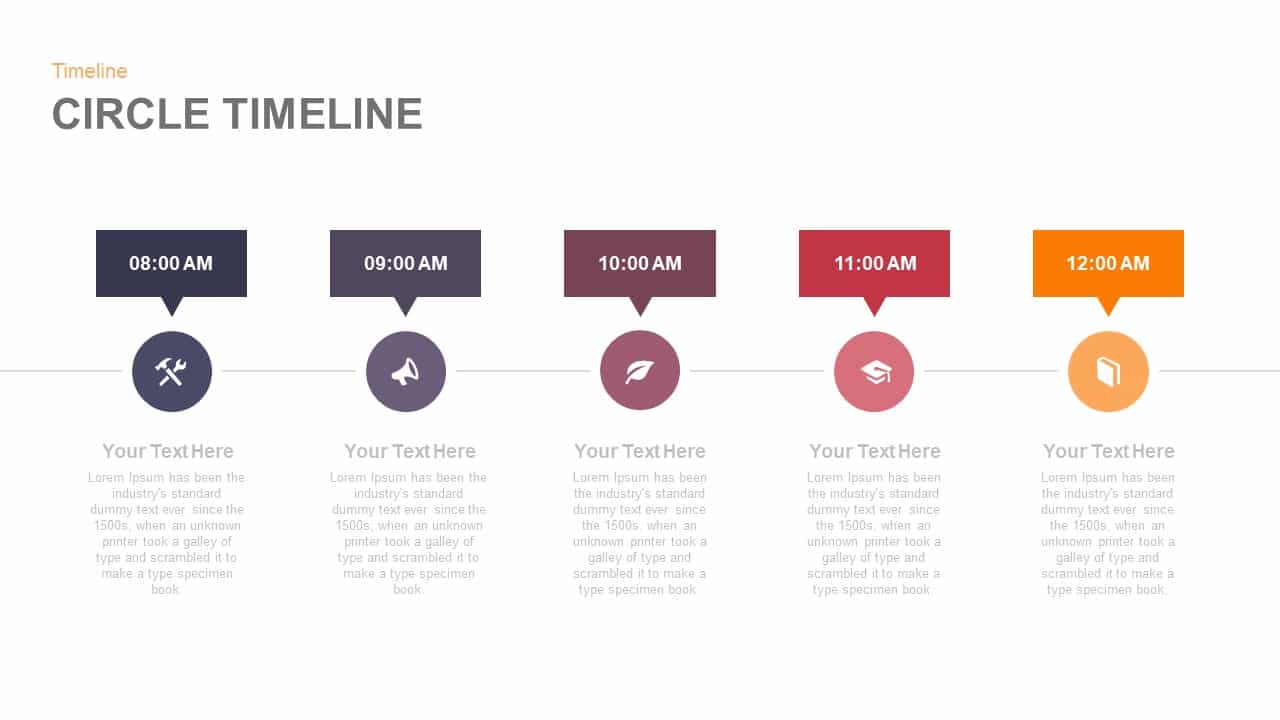
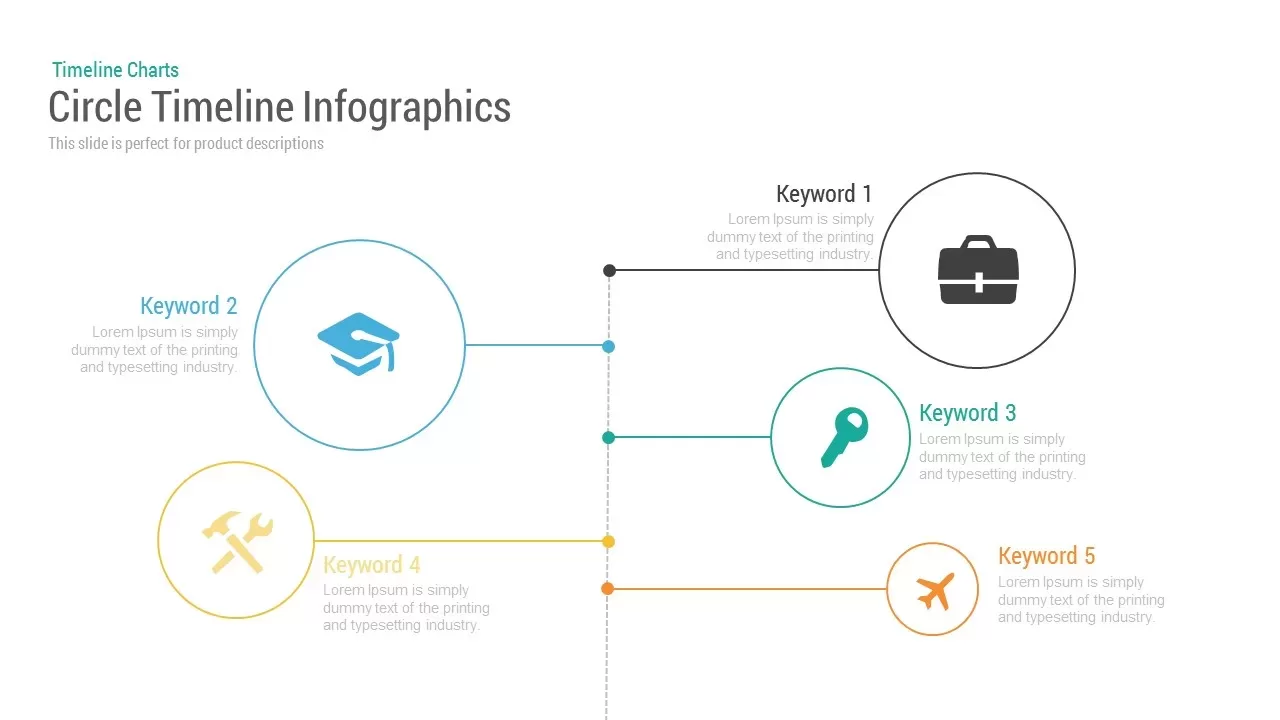
Circle Timeline Infographics Template
Timeline

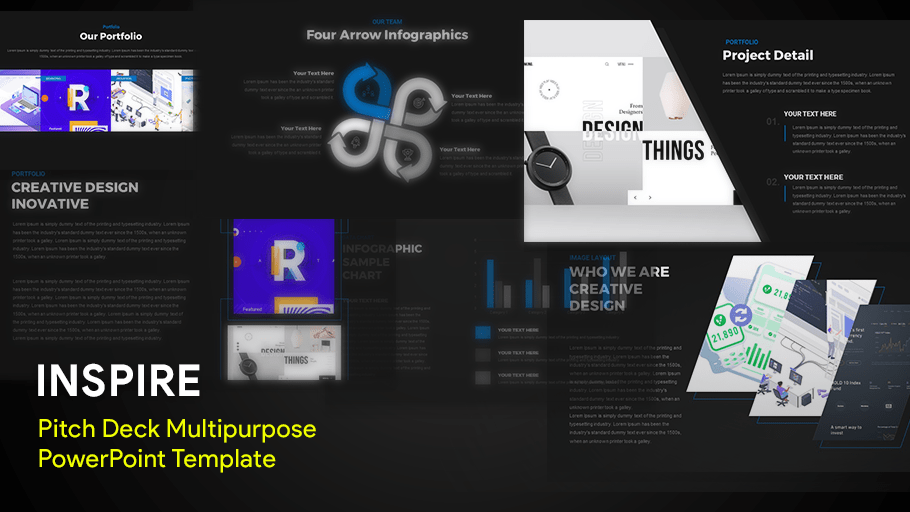
Inspire Multipurpose Creative Deck PowerPoint Template for PowerPoint & Google Slides
Pitch Deck
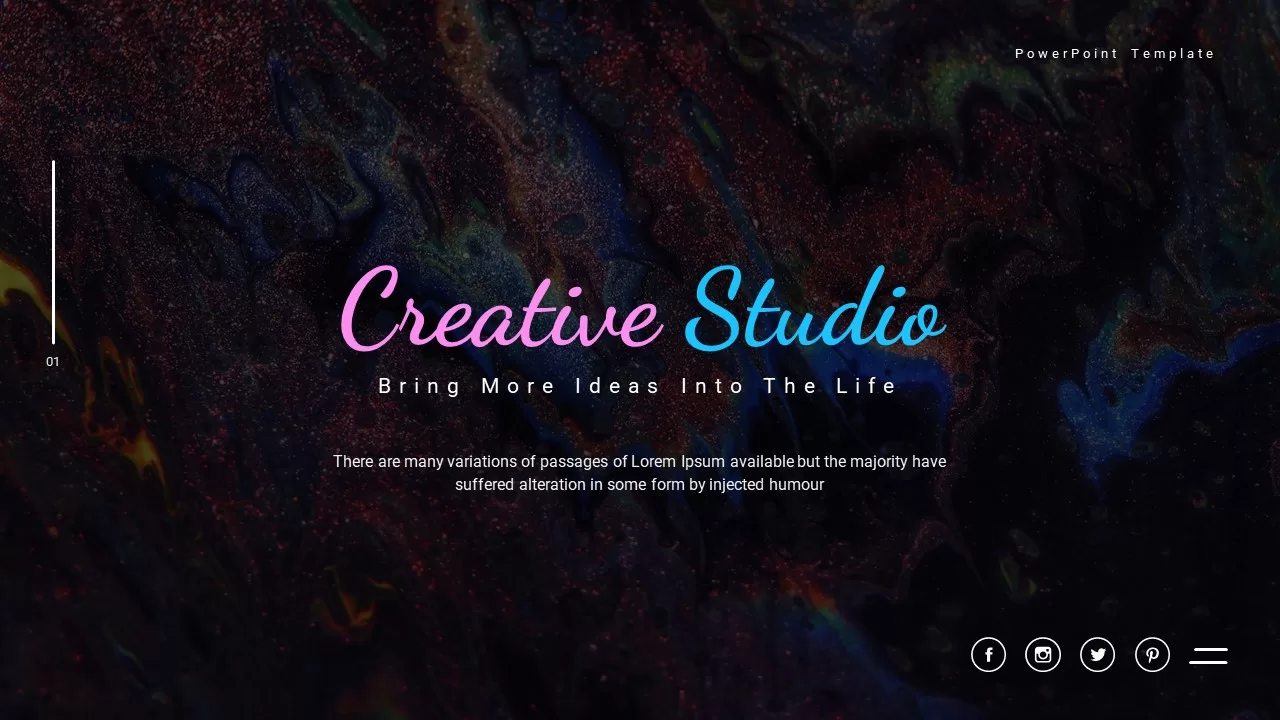
Creative Studio PowerPoint Template for PowerPoint & Google Slides
Decks
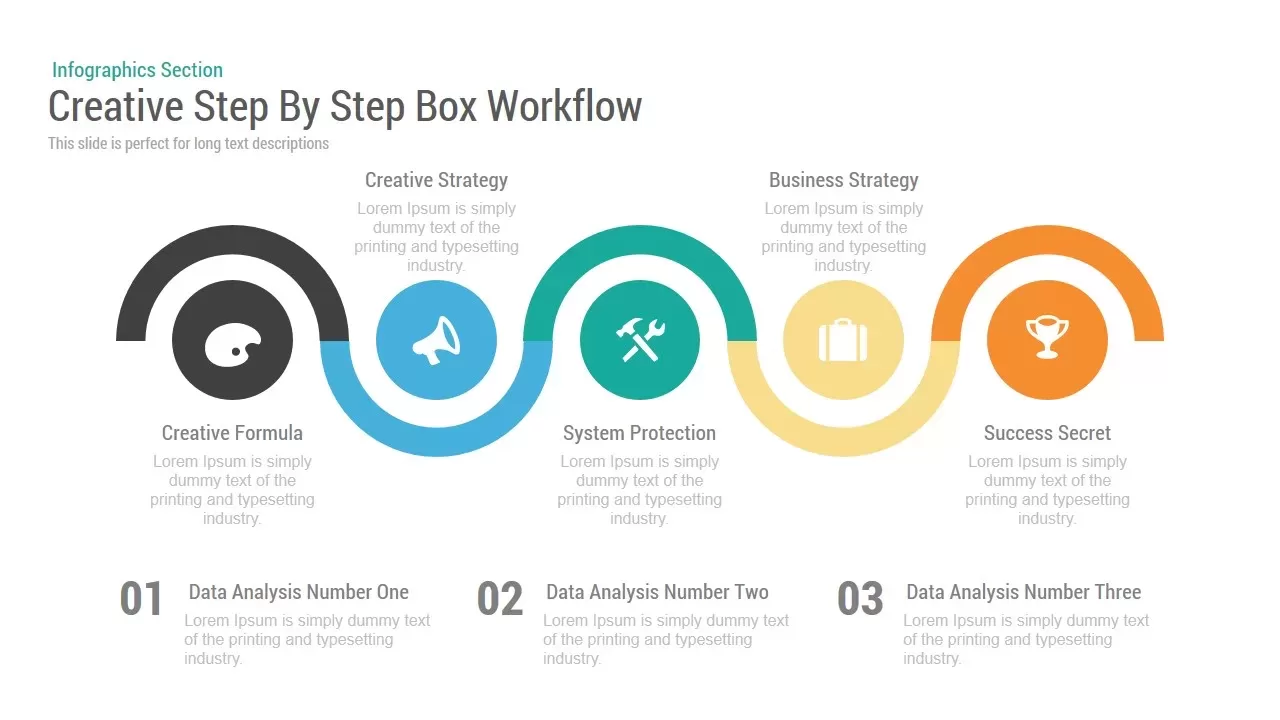
Creative Step By Step Workflow template for PowerPoint & Google Slides
Process
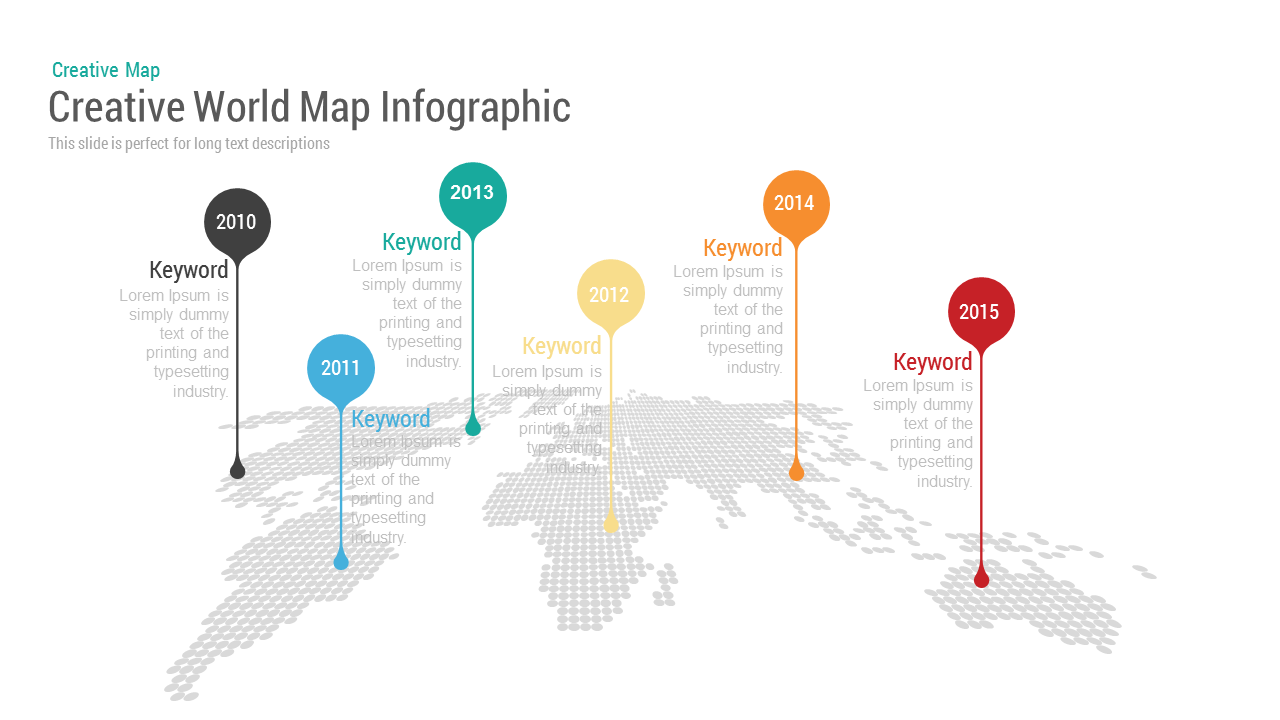
Creative World Map template for PowerPoint & Google Slides
World Maps
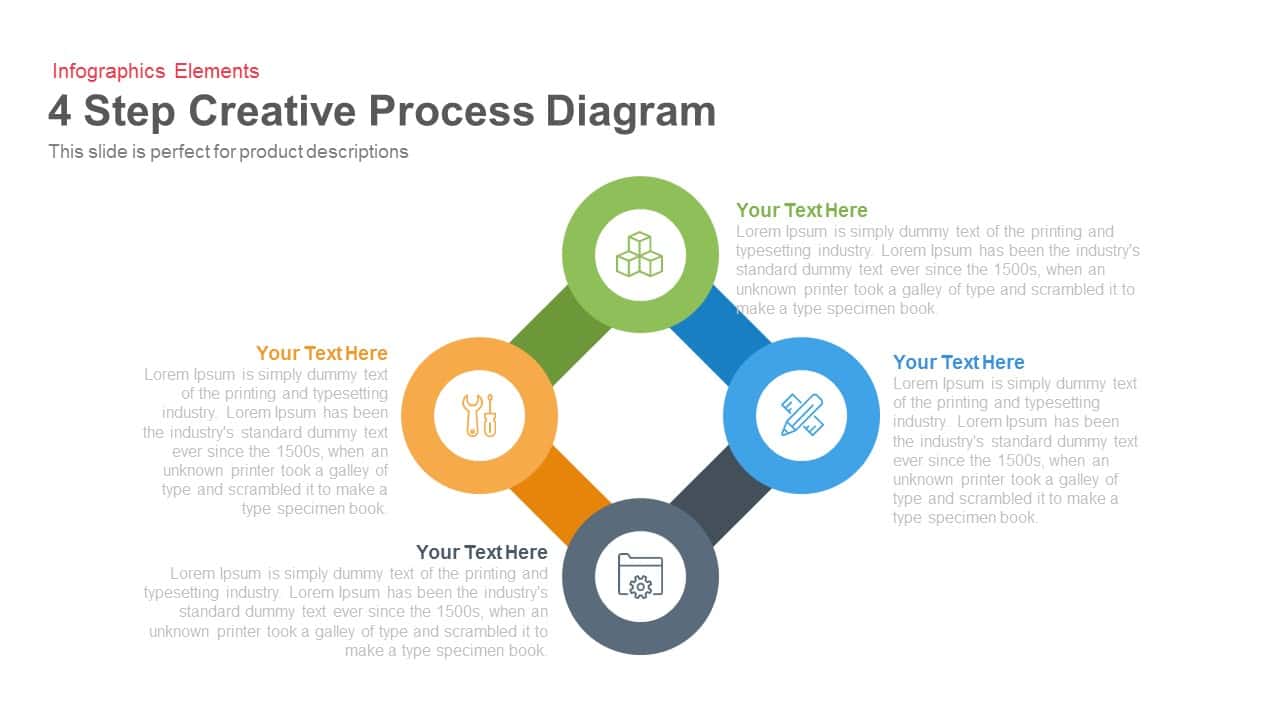
4 Step Creative Process Diagram Template for PowerPoint & Google Slides
Infographics
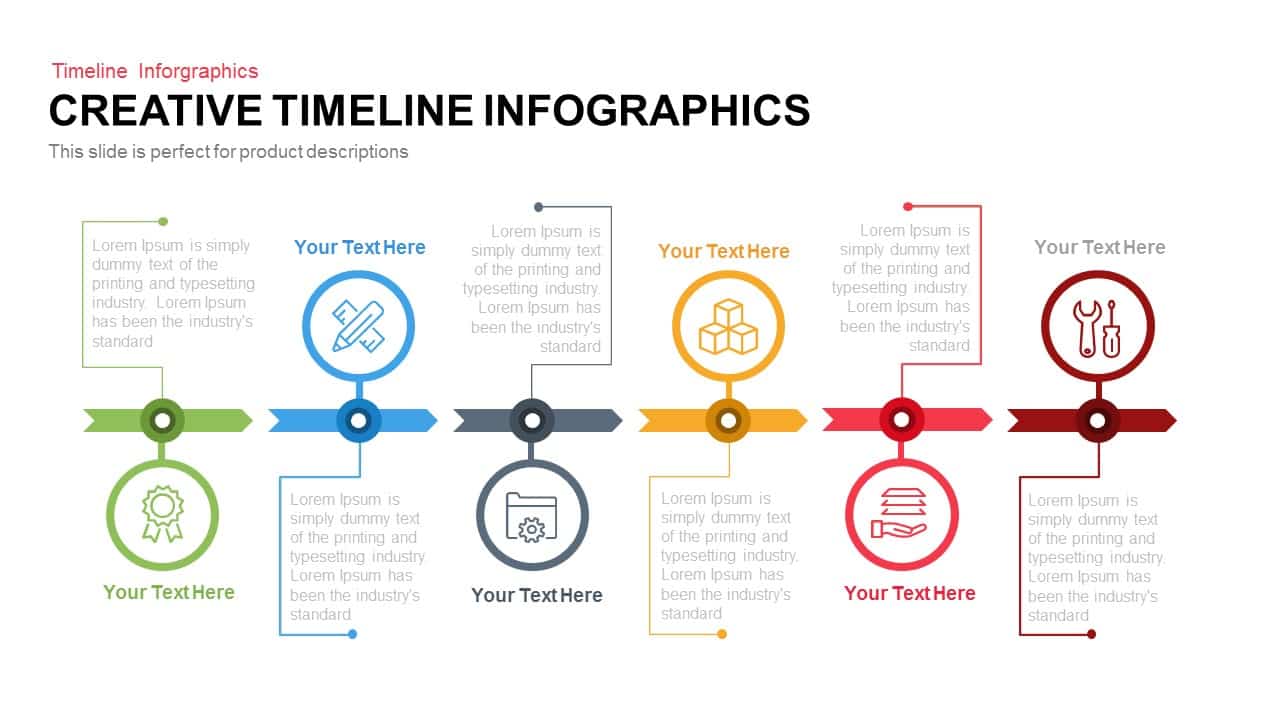
Animated Creative Infographics Timeline PowerPoint Template
Timeline
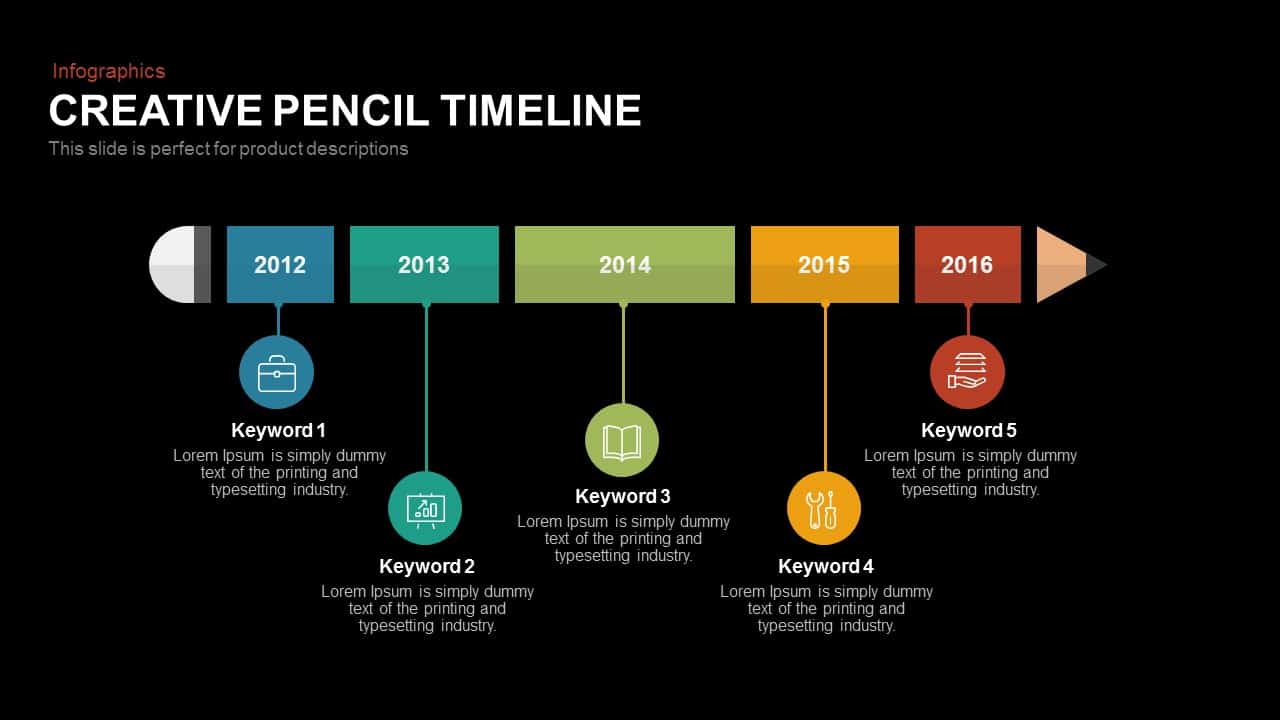
Creative Pencil Timeline Infographic Template for PowerPoint & Google Slides
Timeline
Creative Organic Hub-and-Spoke Diagram template for PowerPoint & Google Slides
Circular
Free Helios Creative Business Deck for PowerPoint & Google Slides
Business
Free

PIXELS – Free Creative Presentation Template for PowerPoint & Google Slides
Pitch Deck
Free
Creative Mind Mapping Diagram with Icons Template for PowerPoint & Google Slides
Mind Maps
Creative Tree Diagram Infographic Template for PowerPoint & Google Slides
Decision Tree
Pop Art PowerPoint Template
Decks
Creative Mind Mapping Template for PowerPoint & Google Slides
Mind Maps
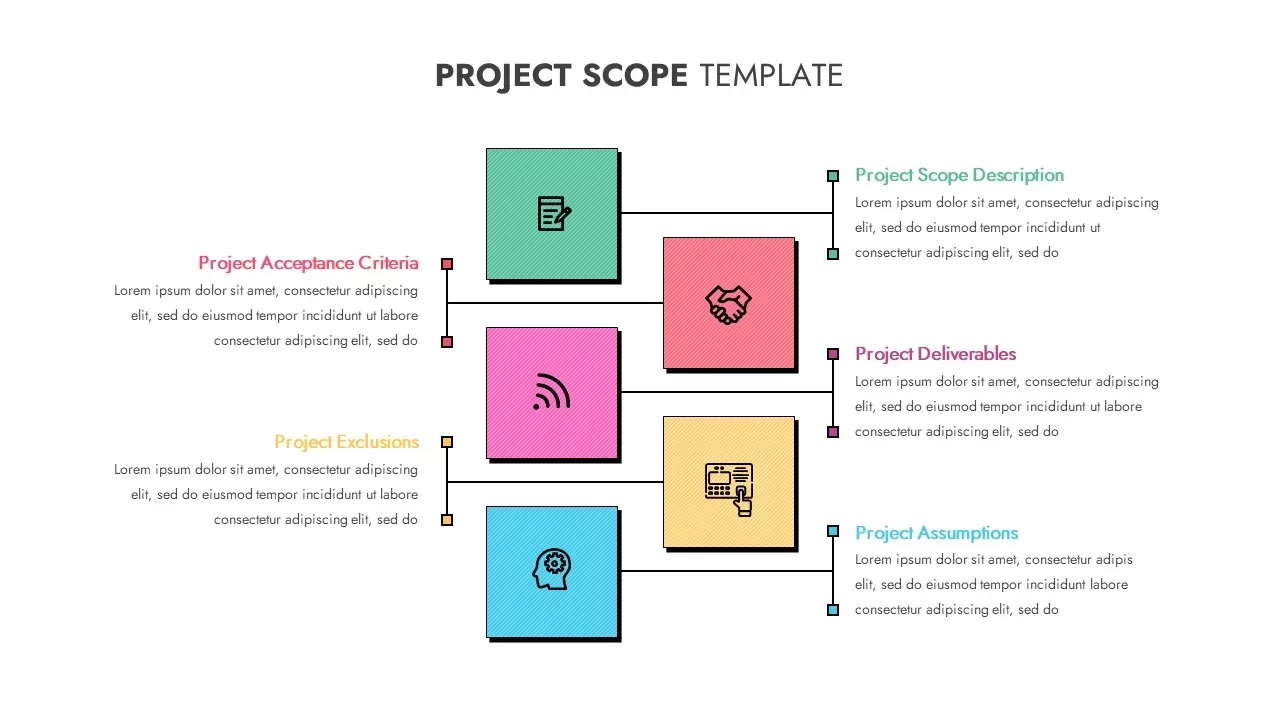
Creative Project Scope Template for PowerPoint & Google Slides
Project
Creative Photo Collage Grid Layout Template for PowerPoint & Google Slides
Graphics
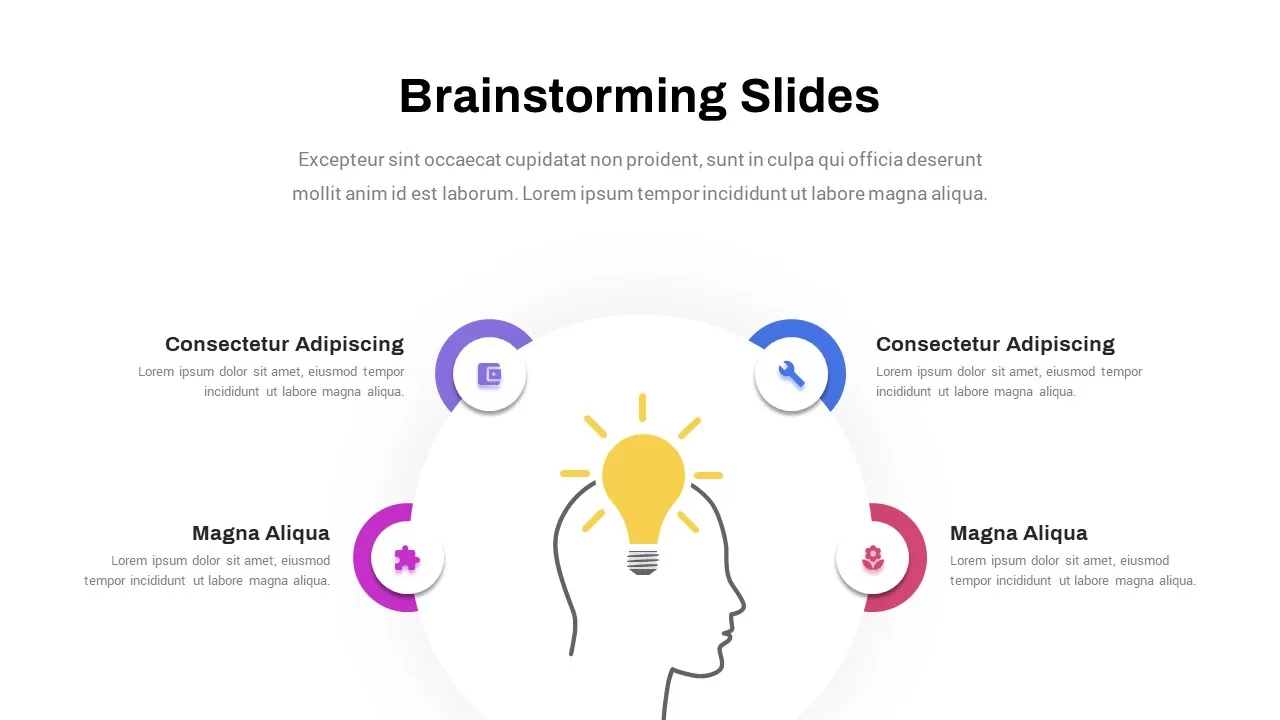
Creative Brainstorming Process Diagram Template for PowerPoint & Google Slides
Process
Creative Team Introduction template for PowerPoint & Google Slides
Our Team

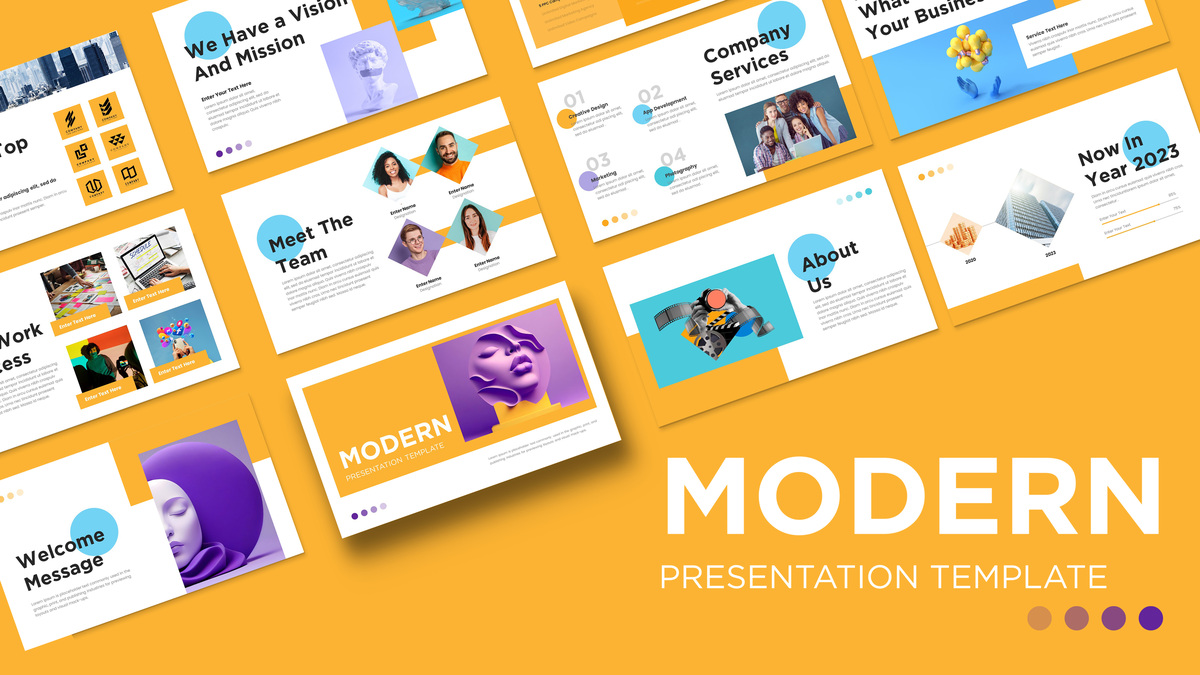
Modern Creative Business Pitch Deck Template for PowerPoint & Google Slides
Pitch Deck
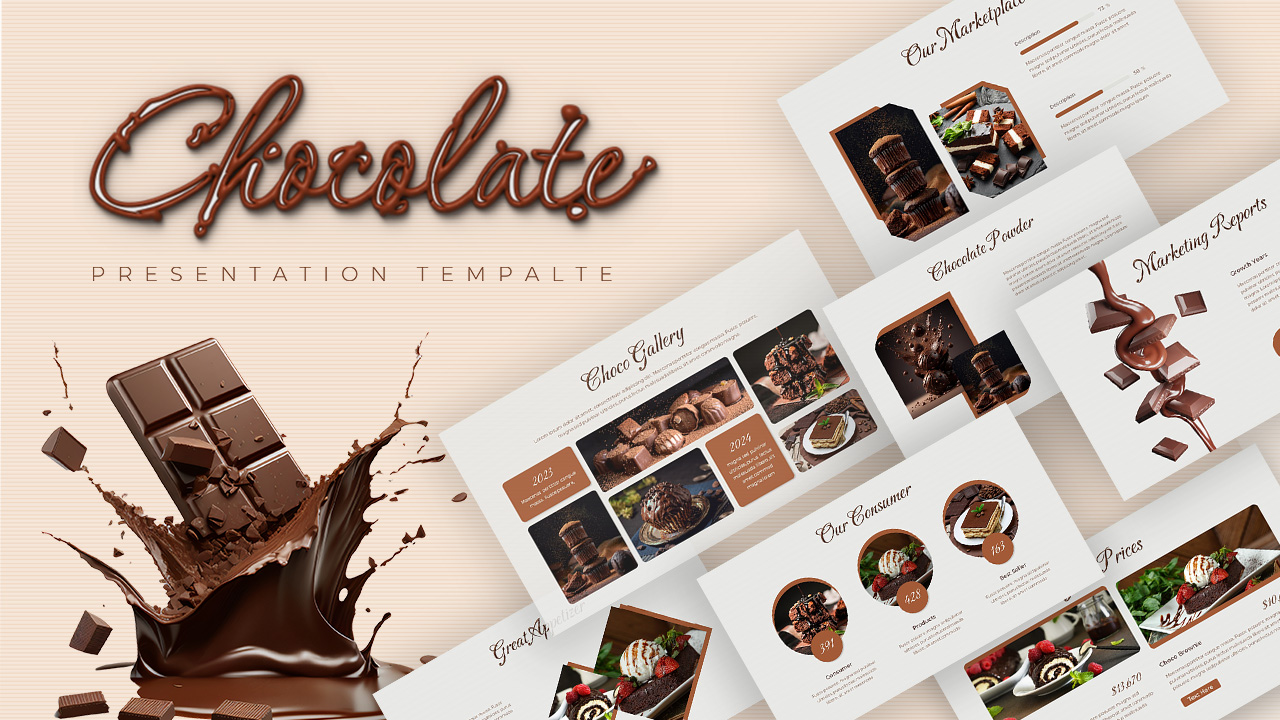
Creative Chocolate Marketing Deck Template for PowerPoint & Google Slides
Company Profile
Creative Power Analogy Metaphor Slide Template for PowerPoint & Google Slides
Leadership
Colorful Creative Presentation Deck Template for PowerPoint & Google Slides
Company Profile
Creative Influencer Marketing Framework Template for PowerPoint & Google Slides
Digital Marketing
Creative Project Roadmap template for PowerPoint & Google Slides
Business
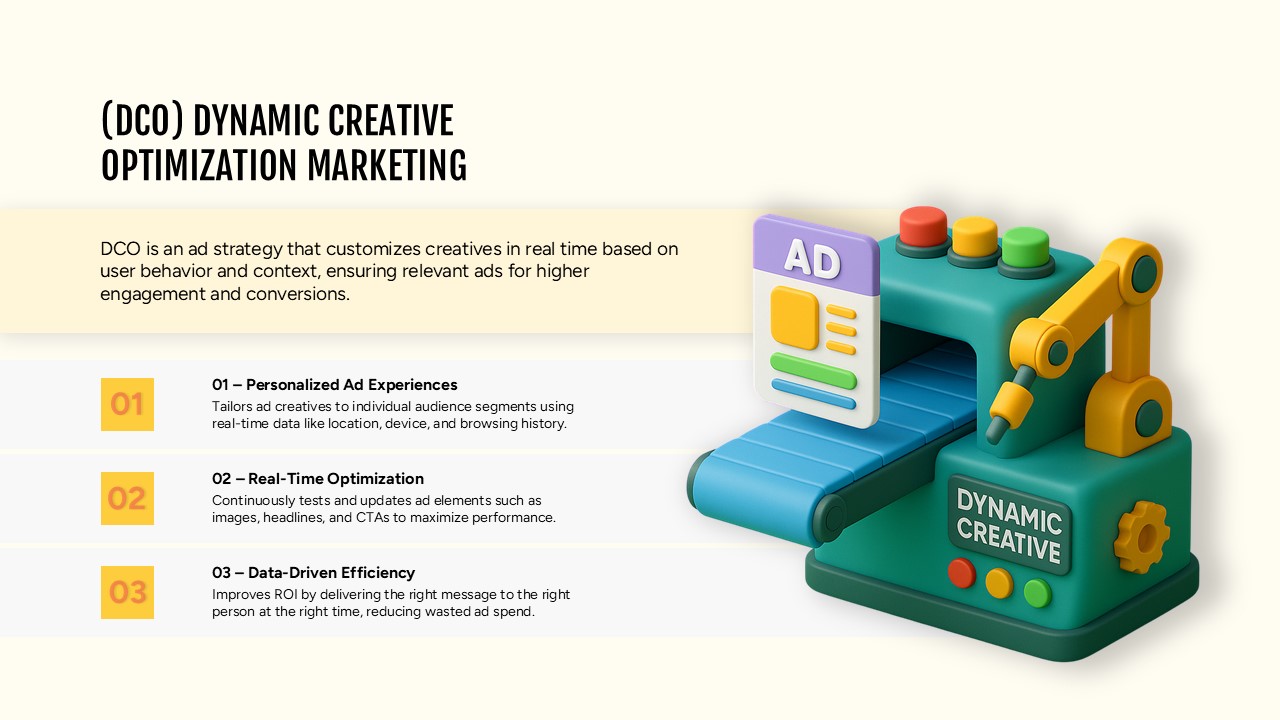
Dynamic Creative Optimization Marketing Template for PowerPoint & Google Slides
Digital Marketing
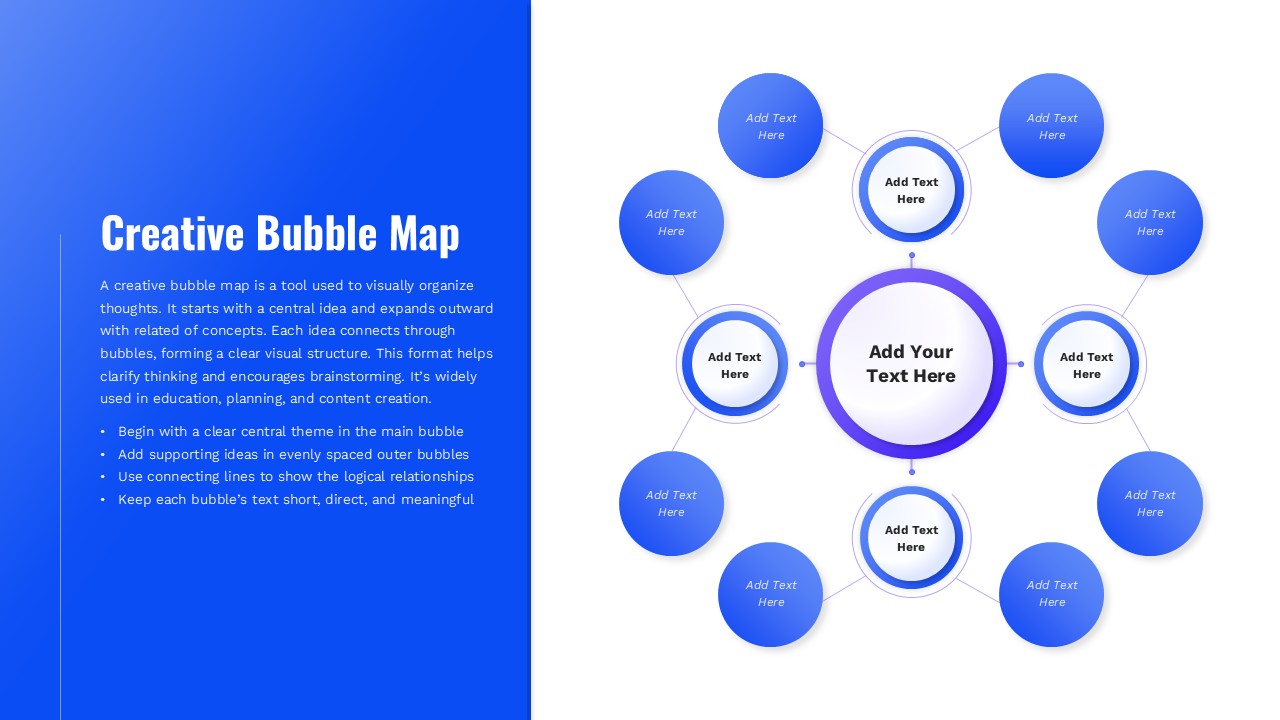
Creative Bubble Mind Map Template for PowerPoint & Google Slides
Mind Maps
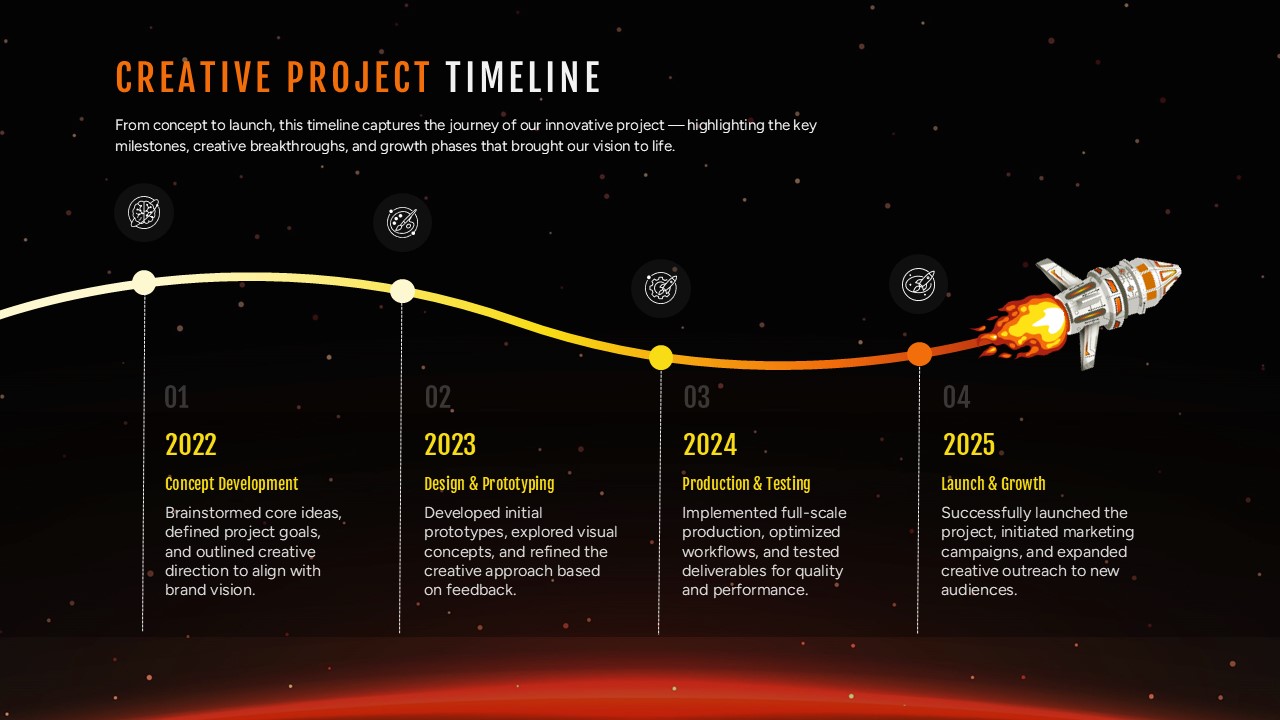
Creative Project Timeline Roadmap Template for PowerPoint & Google Slides
Timeline