Population Age Distribution Pyramid Chart Template for PowerPoint & Google Slides

Description
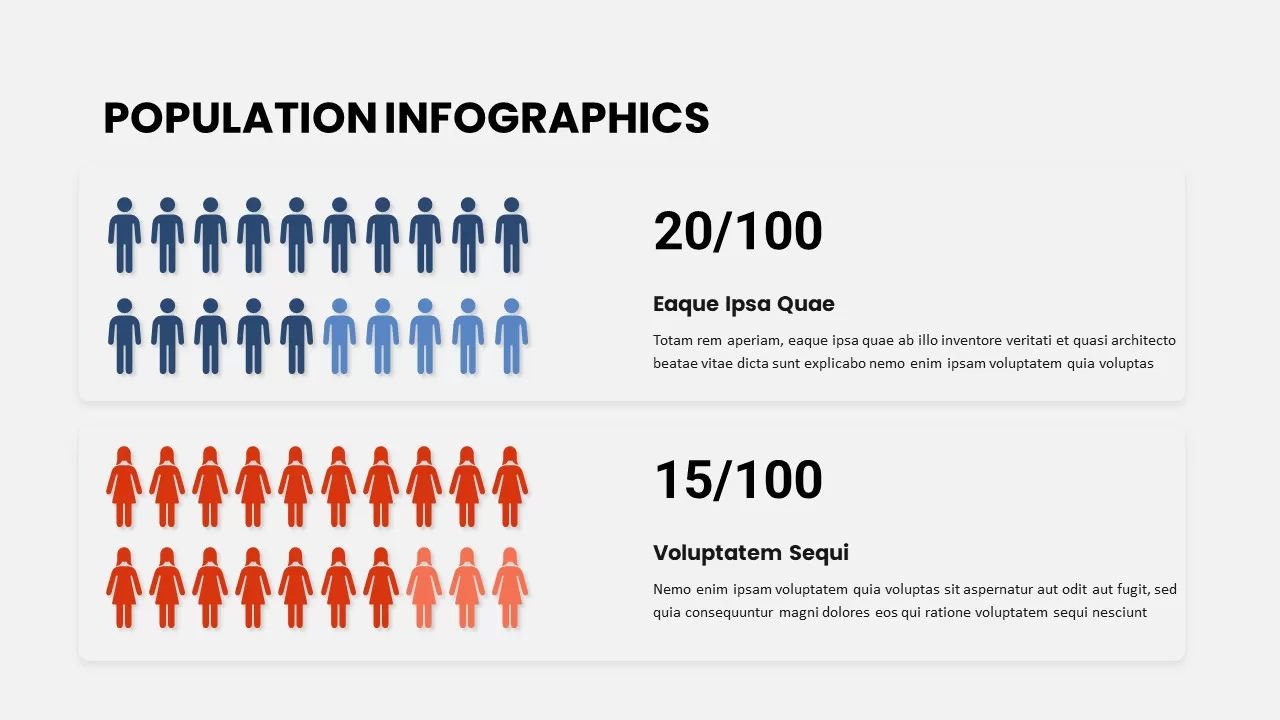
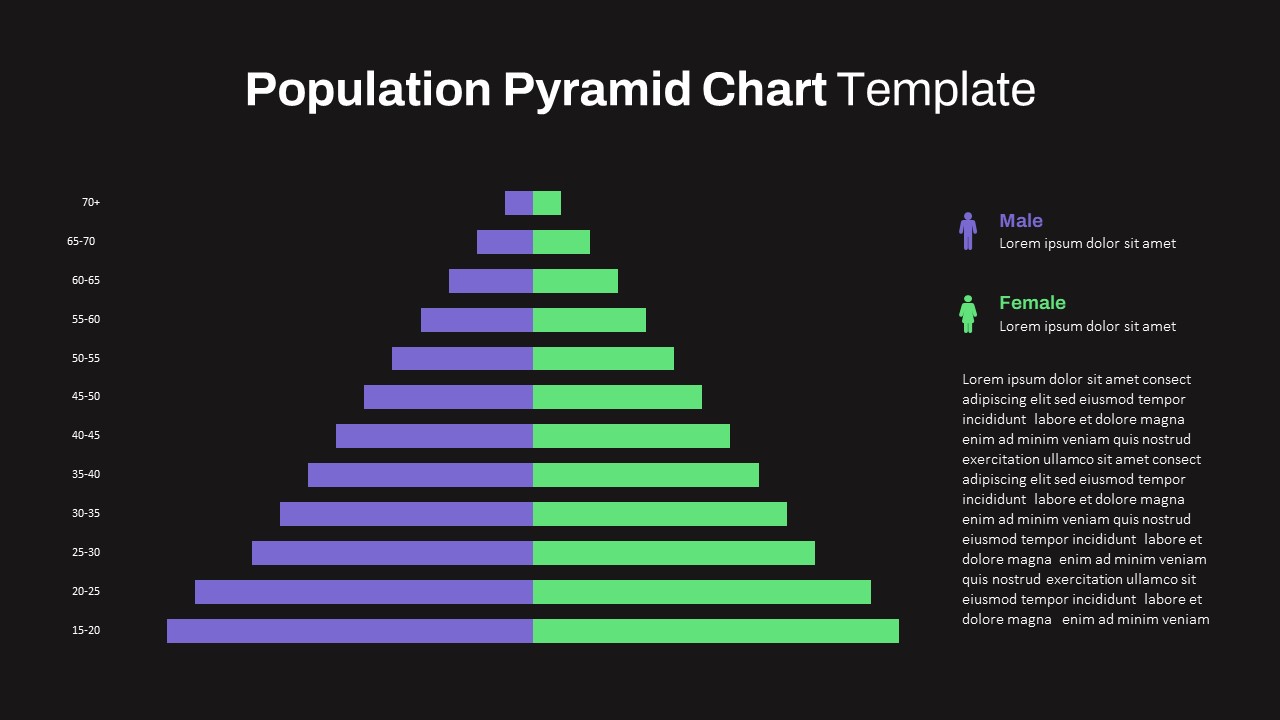
This editable population pyramid infographic displays gender-segmented age groups across eleven five-year cohorts (15–20 through 70+) on a crisp white master slide. Purple bars extend left for male values and green bars extend right for female values, each built from vector shapes for perfect scaling and recoloring. Age-range labels sit along the vertical axis, while matching legend icons and text placeholders on the right provide context. Hidden guide layers let you adjust cohort labels, add or remove cohorts, swap color themes, or toggle bar orientations without disrupting alignment. Subtle drop shadows add depth to the bars, and theme-font controls ensure typographic consistency across both PowerPoint and Google Slides. Whether presenting demographic analyses, workforce distributions, or market segment breakdowns, this pyramid chart combines clarity and flexibility for professional storytelling. For additional hierarchical and structured visuals, you can explore our full pyramid slides collection that supports demographic, organizational, and strategic storytelling.
Who is it for
Demographers, HR analysts, and marketing researchers will leverage this pyramid to visualize age and gender distributions for population studies, workforce planning, or customer-segment analyses.
Other Uses
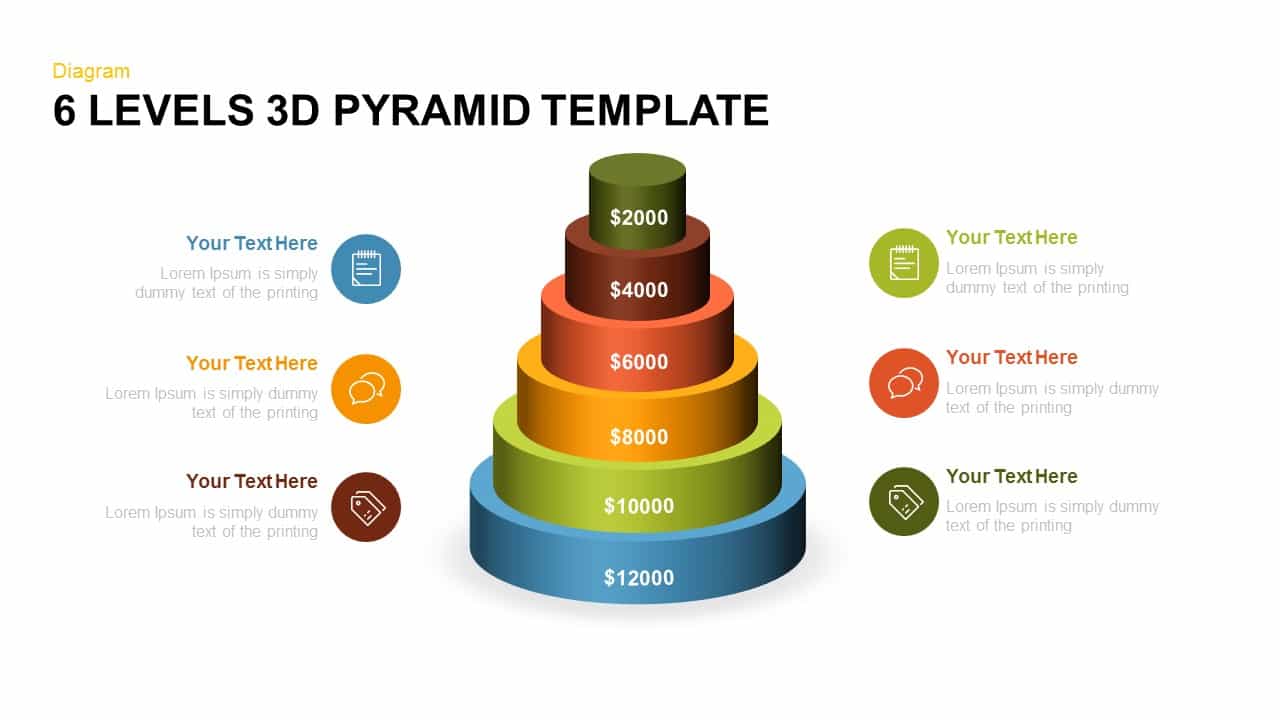
Repurpose this layout for survey-response breakdowns, beneficiary-group overviews, enrollment-cohort analyses, or any context requiring a mirrored bar-segment comparison across categories. For governance or role-hierarchy mapping, presenters may reference the data governance pyramid to illustrate layered accountability structures. Teams needing deeper multi-stage conceptual models can apply the 3d six level pyramid infographic template to present strategic frameworks or development progressions in a more dimensional format.
Login to download this file

Item ID
SB03793
Related Templates

Population Pyramid Chart Analysis Template for PowerPoint & Google Slides
Bar/Column
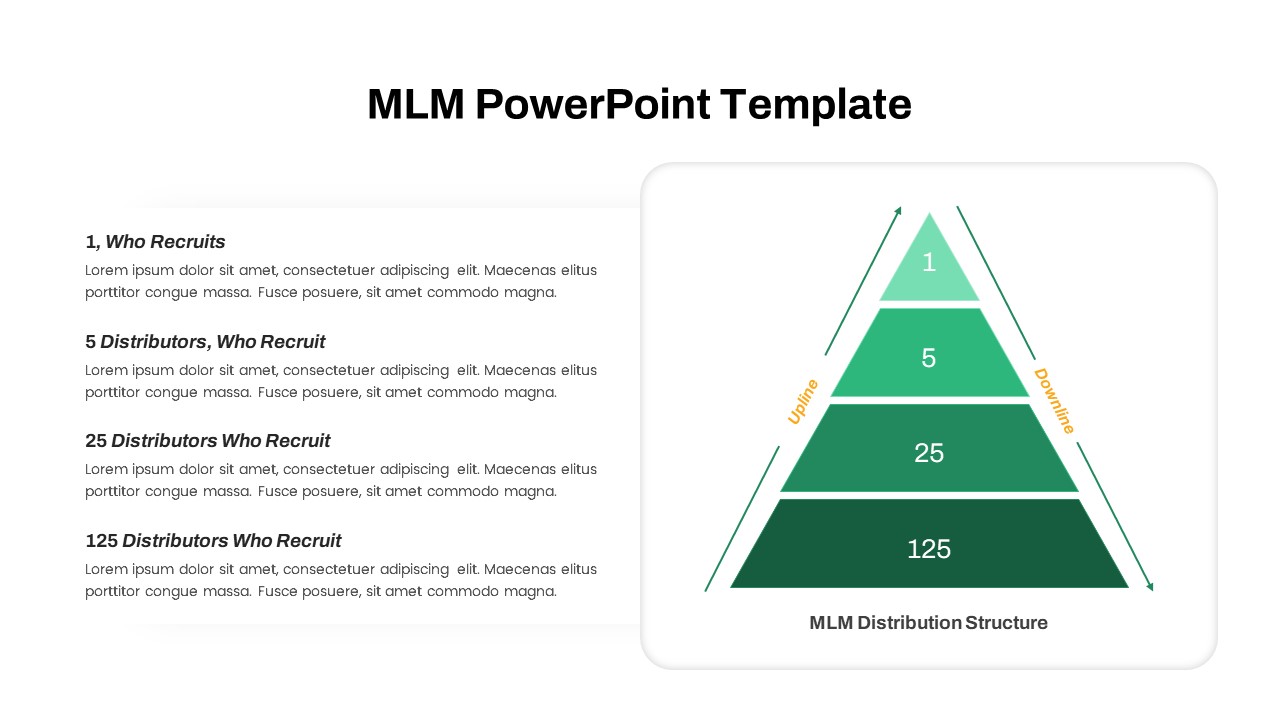
MLM Distribution Pyramid Diagram Template for PowerPoint & Google Slides
Business Models
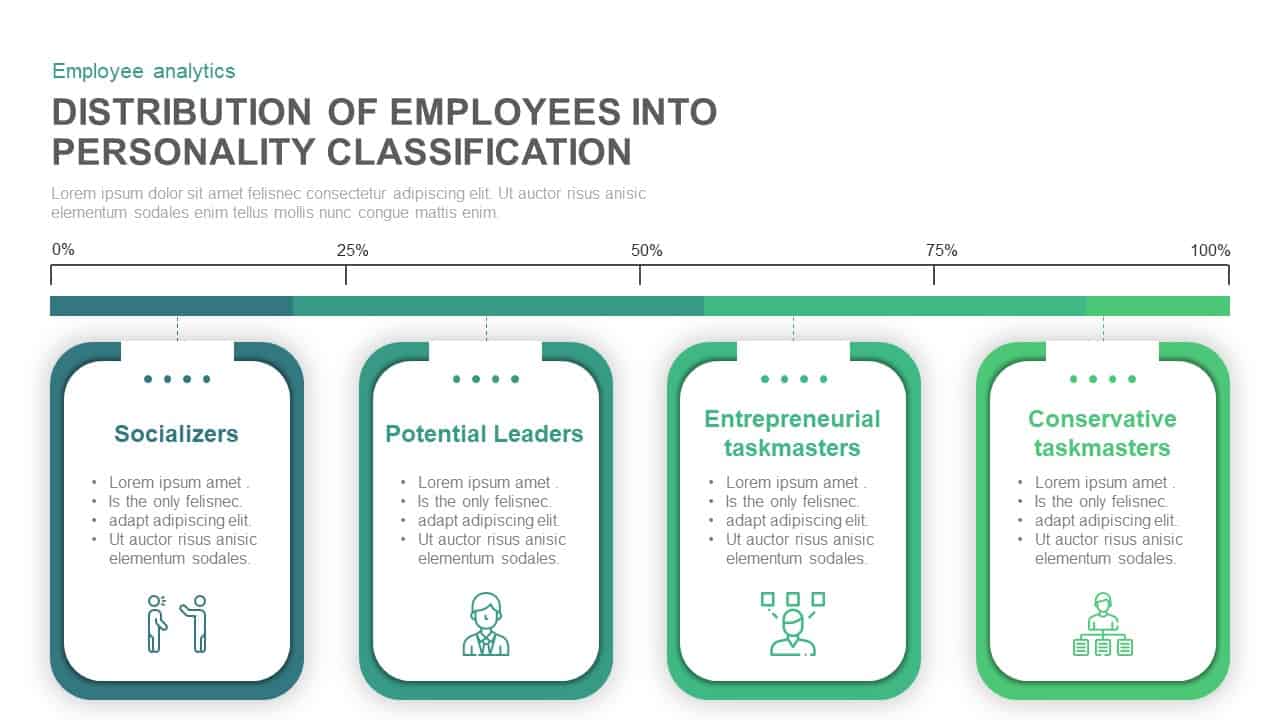
Employee Personality Distribution Chart Template for PowerPoint & Google Slides
Bar/Column
Interactive US Population Data Map Slide Template for PowerPoint & Google Slides
World Maps
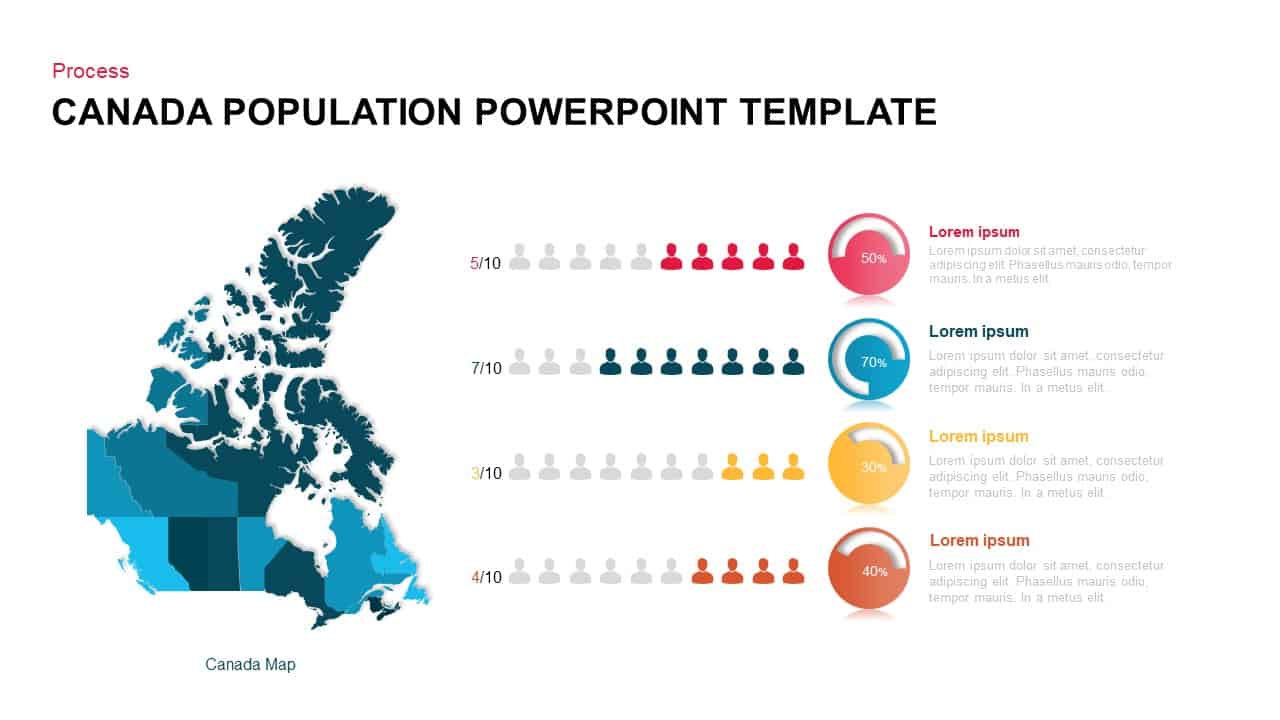
Canada Population Infographics Template for PowerPoint & Google Slides
World Maps
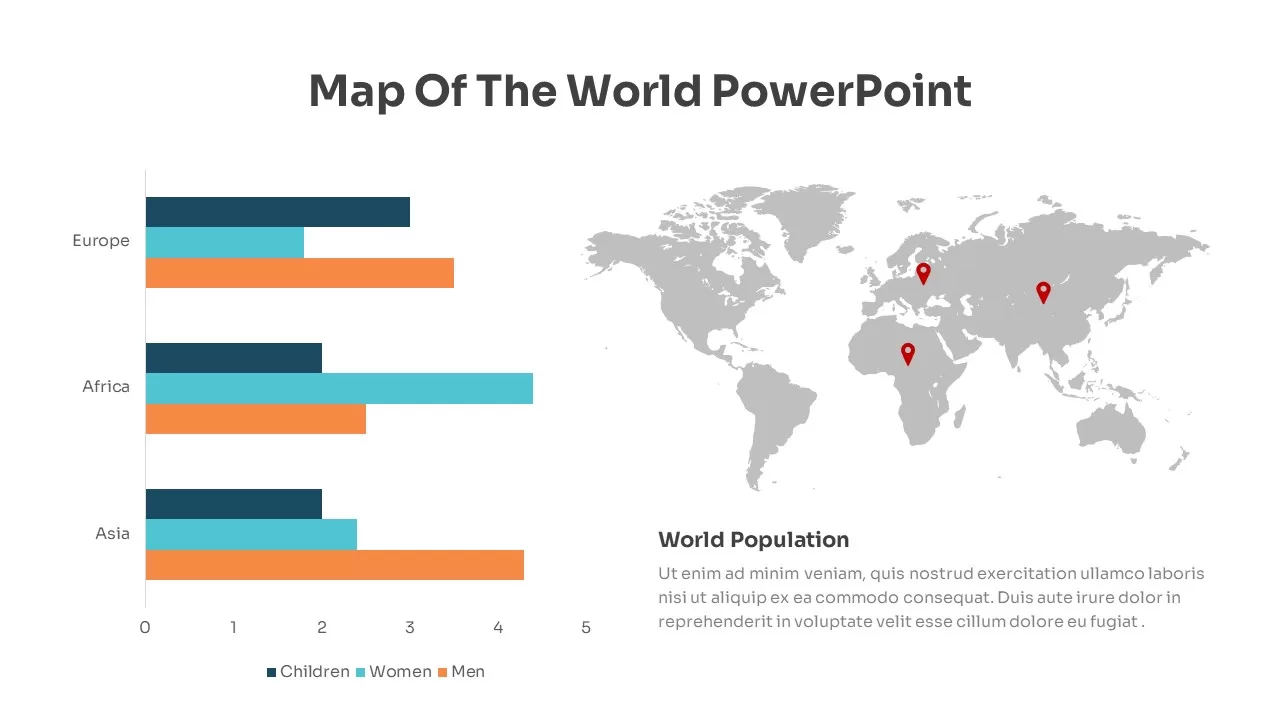
Global Population Demographics & Map Template for PowerPoint & Google Slides
Bar/Column
Population Infographics template for PowerPoint & Google Slides
Comparison
Population Infographic Template for PowerPoint & Google Slides
Comparison
World Map PowerPoint Template Free
World Maps
Free
Distribution Channel Flowchart Template for PowerPoint & Google Slides
Business Models
Workload Distribution Circular Diagram Template for PowerPoint & Google Slides
Circular

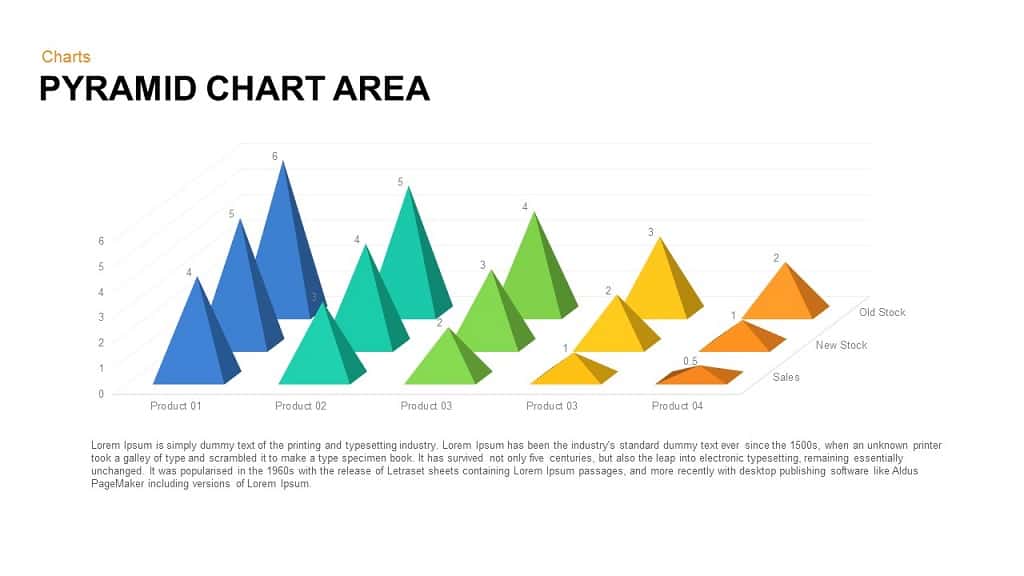
Pyramid Chart Area template for PowerPoint & Google Slides
Pyramid
Free Learning Retention Pyramid Chart Template for PowerPoint & Google Slides
Pyramid
Free
Multi-Level Colorful Pyramid Chart Template for PowerPoint & Google Slides
Pyramid
3D Pyramid Column Chart Infographic Template for PowerPoint & Google Slides
Bar/Column
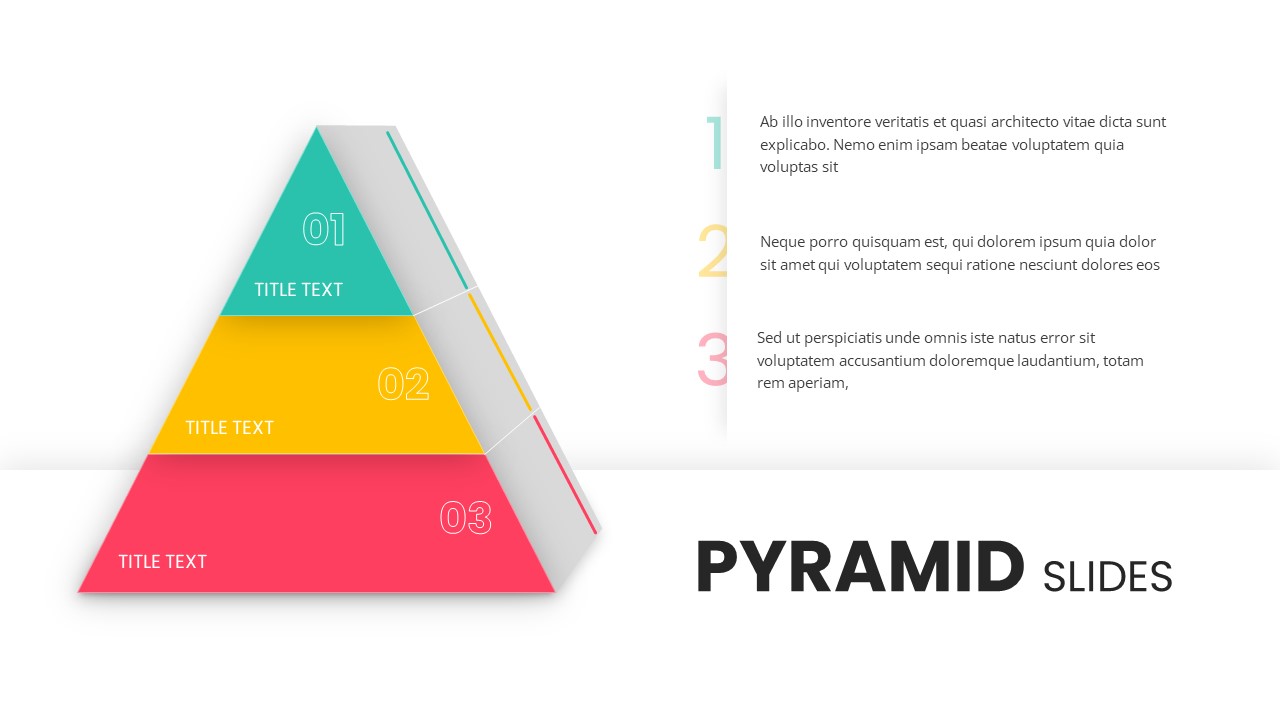
3 Stage Pyramid Slides for PowerPoint & Google Slides
Pyramid
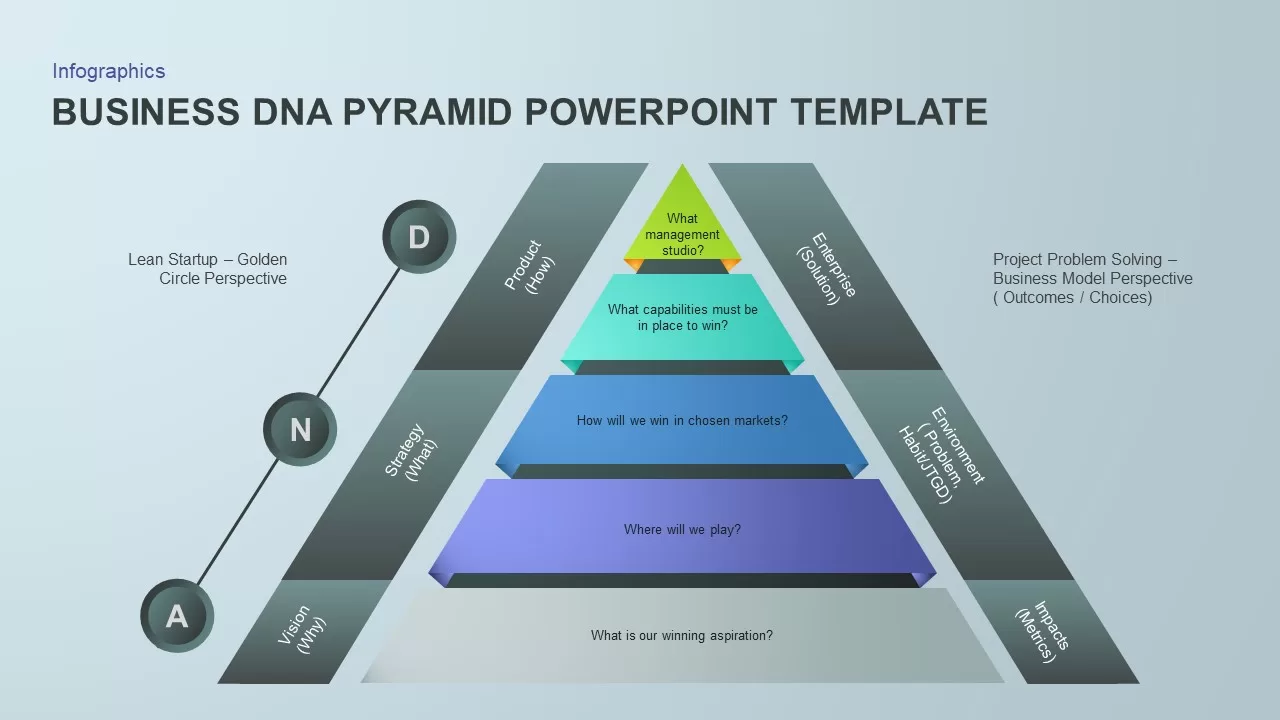
Business DNA Pyramid PowerPoint Template for PowerPoint & Google Slides
Pyramid
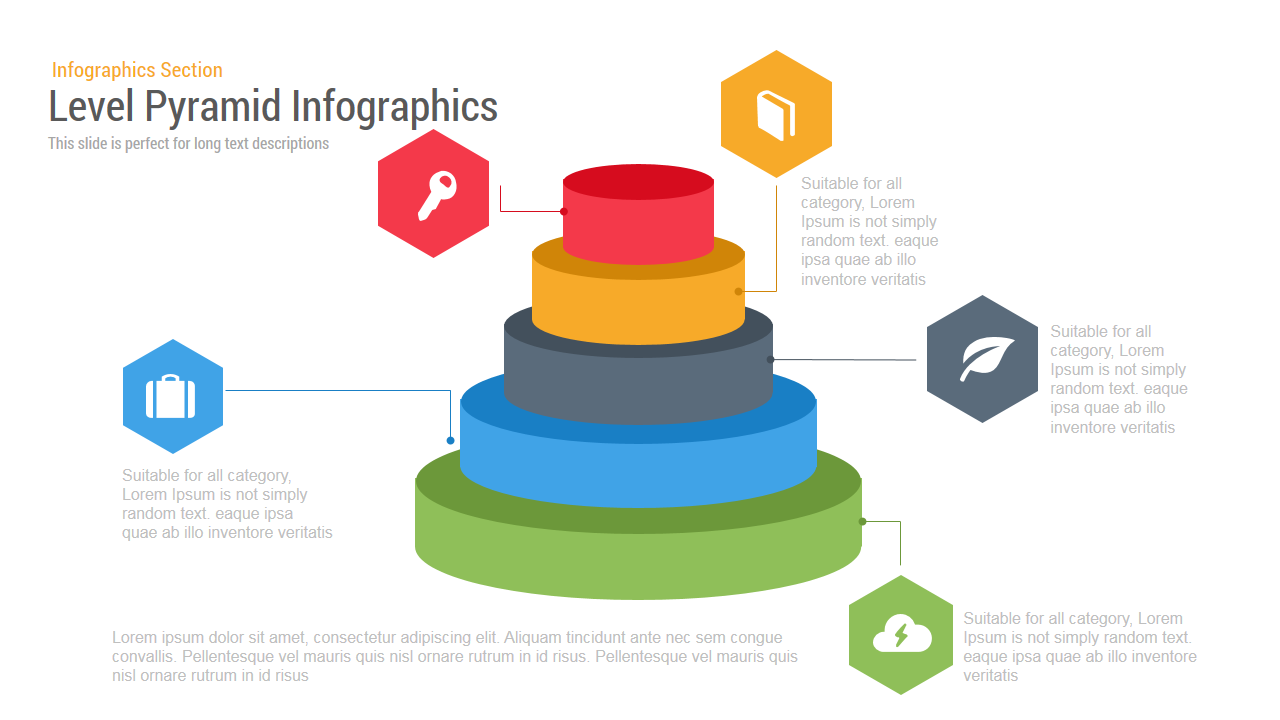
Pyramid infographic template for PowerPoint & Google Slides
Pyramid
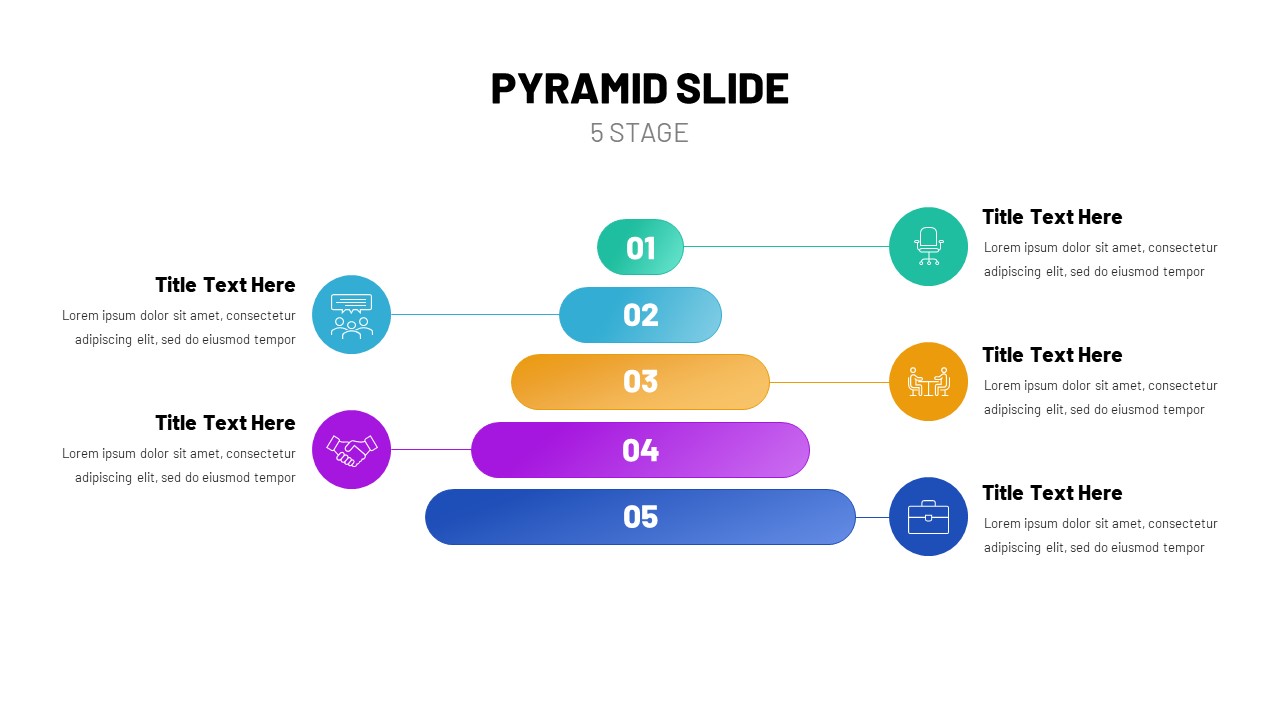
5 Stage Pyramid template for PowerPoint & Google Slides
Pyramid
7-Level 3D Pyramid Infographic Diagram Template for PowerPoint & Google Slides
Pyramid
Five-Level 3D Pyramid Hierarchy Template for PowerPoint & Google Slides
Pyramid
4-Step 3D Pyramid Diagram with Callouts template for PowerPoint & Google Slides
Pyramid
Four-Level 3D Pyramid Infographic Template for PowerPoint & Google Slides
Pyramid
Professional 5-Stage Pyramid Diagram Template for PowerPoint & Google Slides
Pyramid
Professional 4-Piece 3D Pyramid Diagram Template for PowerPoint & Google Slides
Pyramid
Five-Stage Pyramid Infographics Diagram Template for PowerPoint & Google Slides
Pyramid
Segmented Pyramid Diagram Infographic Template for PowerPoint & Google Slides
Pyramid
Editable Six-Level 3D Pyramid Diagram Template for PowerPoint & Google Slides
Pyramid

Four-Level Business Pyramid Diagram Template for PowerPoint & Google Slides
Pyramid
Five-Level Staged Pyramid Diagram Template for PowerPoint & Google Slides
Pyramid
Five Stages Pyramid with Ribbons Diagram Template for PowerPoint & Google Slides
Pyramid
Stacked Cubes Pyramid Infographic Template for PowerPoint & Google Slides
Pyramid
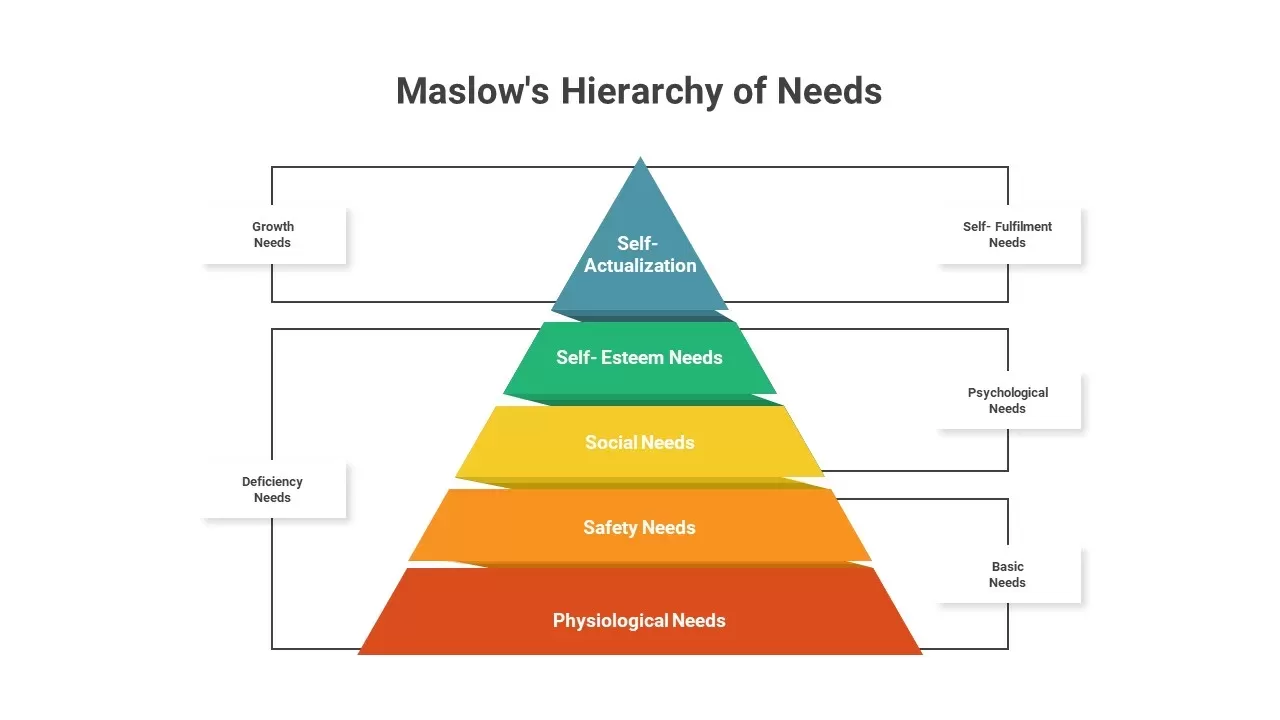
Maslow’s Hierarchy of Needs Pyramid Template for PowerPoint & Google Slides
Pyramid
5-Stage Strategic Planning Pyramid Template for PowerPoint & Google Slides
Business Strategy
Five-Stage Pyramid Infographics Process Template for PowerPoint & Google Slides
Pyramid
Maslow’s Hierarchy of Needs Pyramid template for PowerPoint & Google Slides
Pyramid
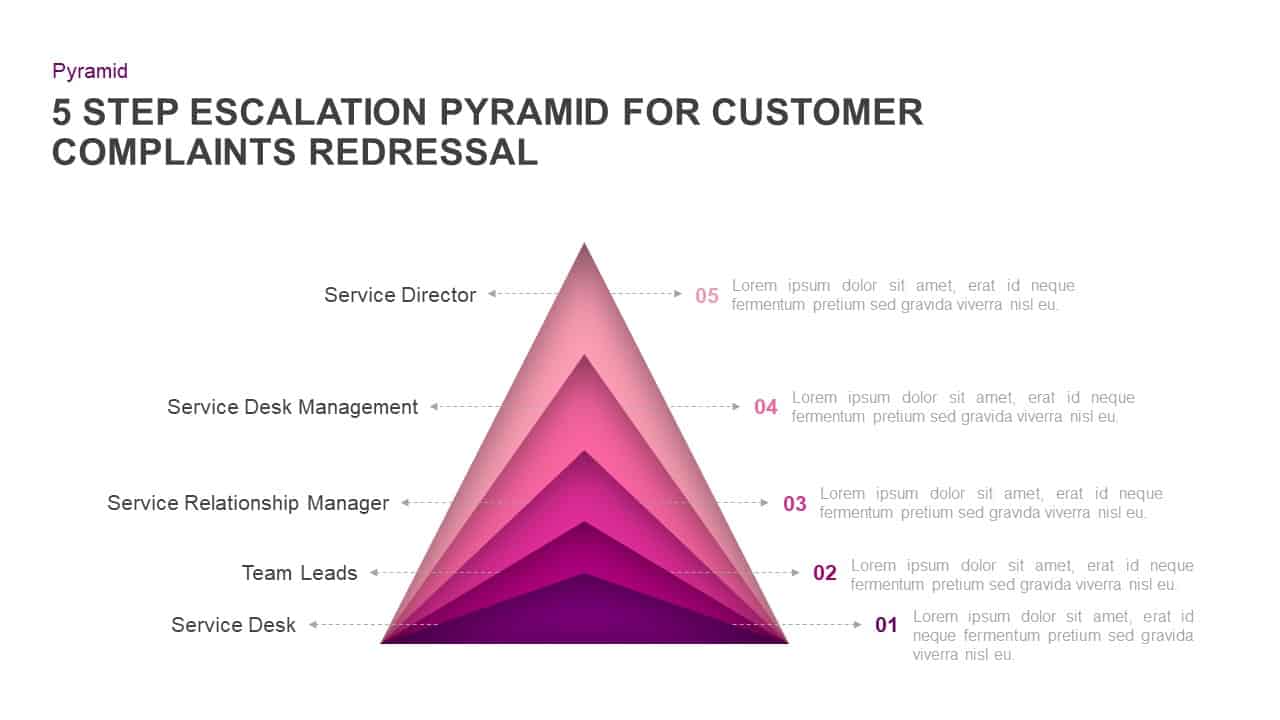
Customer Complaints Escalation Pyramid Template for PowerPoint & Google Slides
Infographics
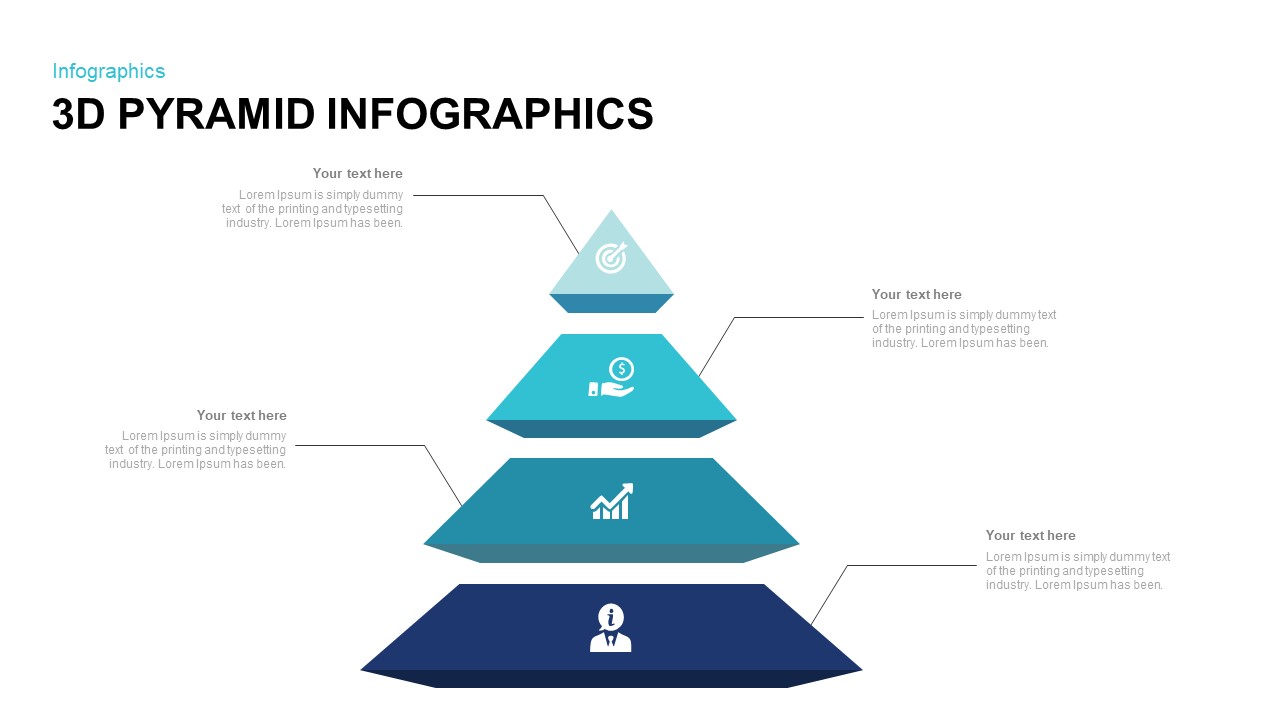
3D Pyramid Infographics Slide Template for PowerPoint & Google Slides
Pyramid
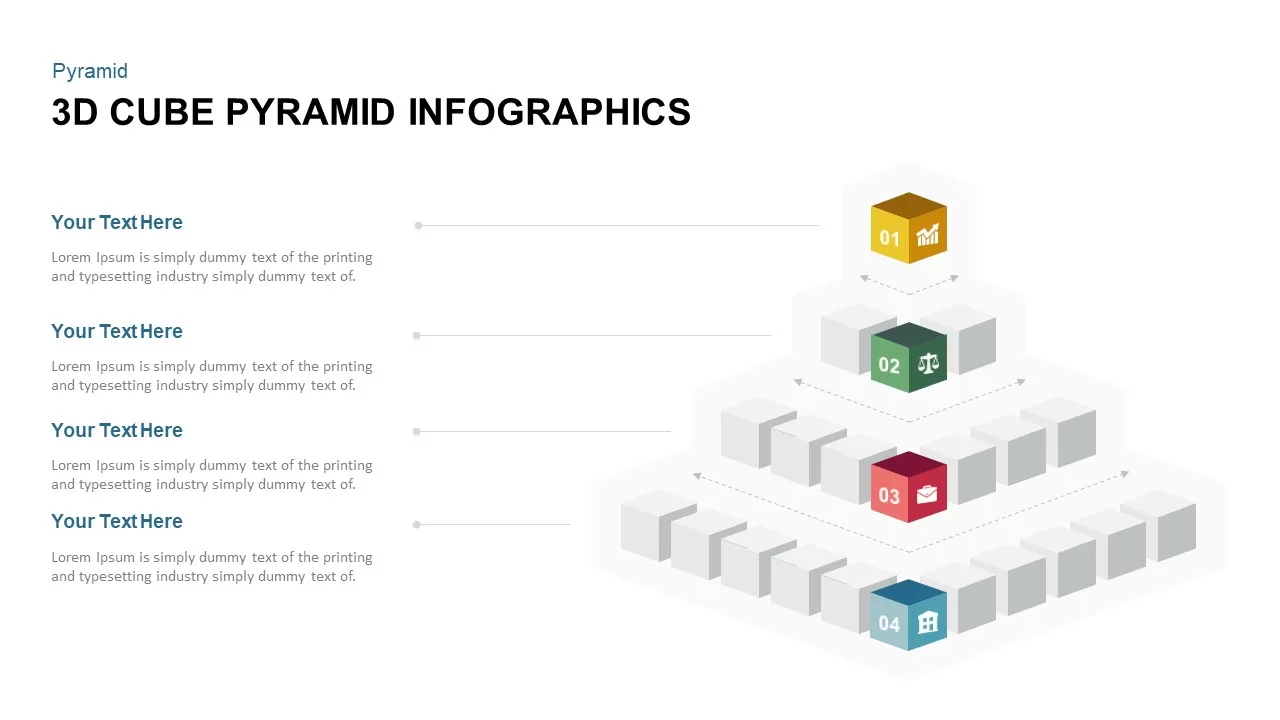
3D Cube Pyramid Infographics Slide Template for PowerPoint & Google Slides
Pyramid
Stacked Cubes Pyramid Six-Option Diagram Template for PowerPoint & Google Slides
Pyramid
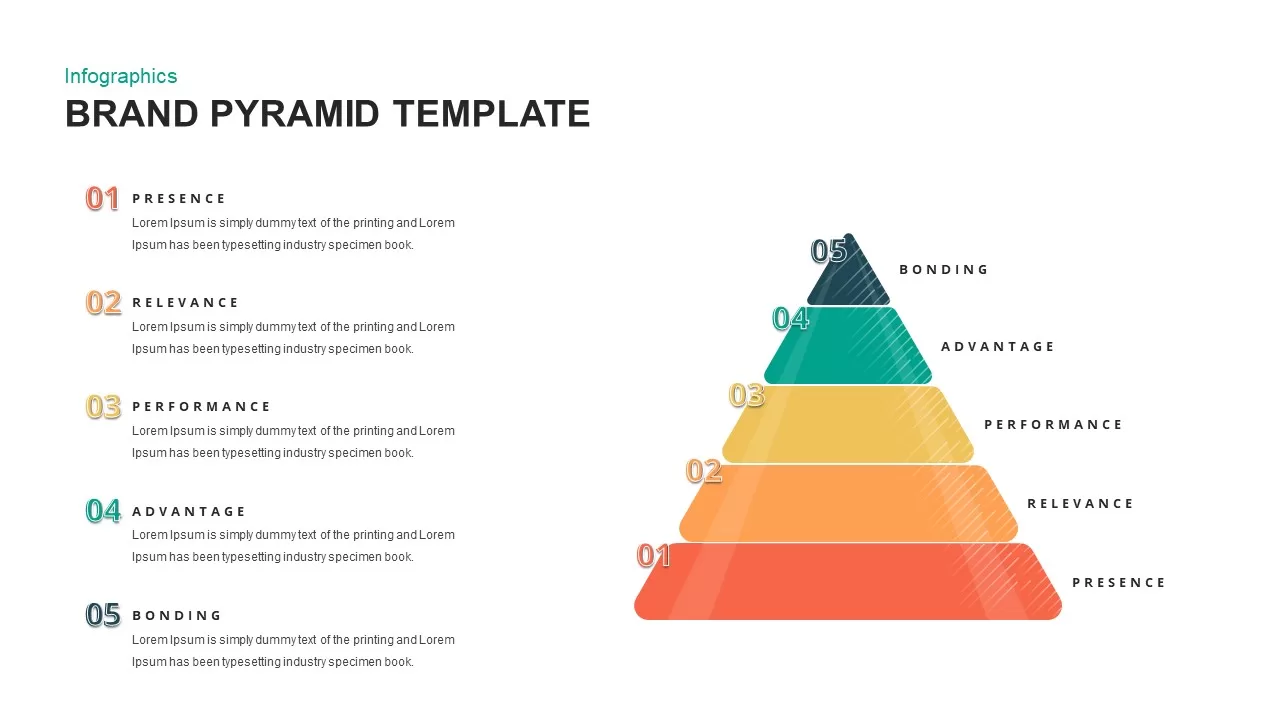
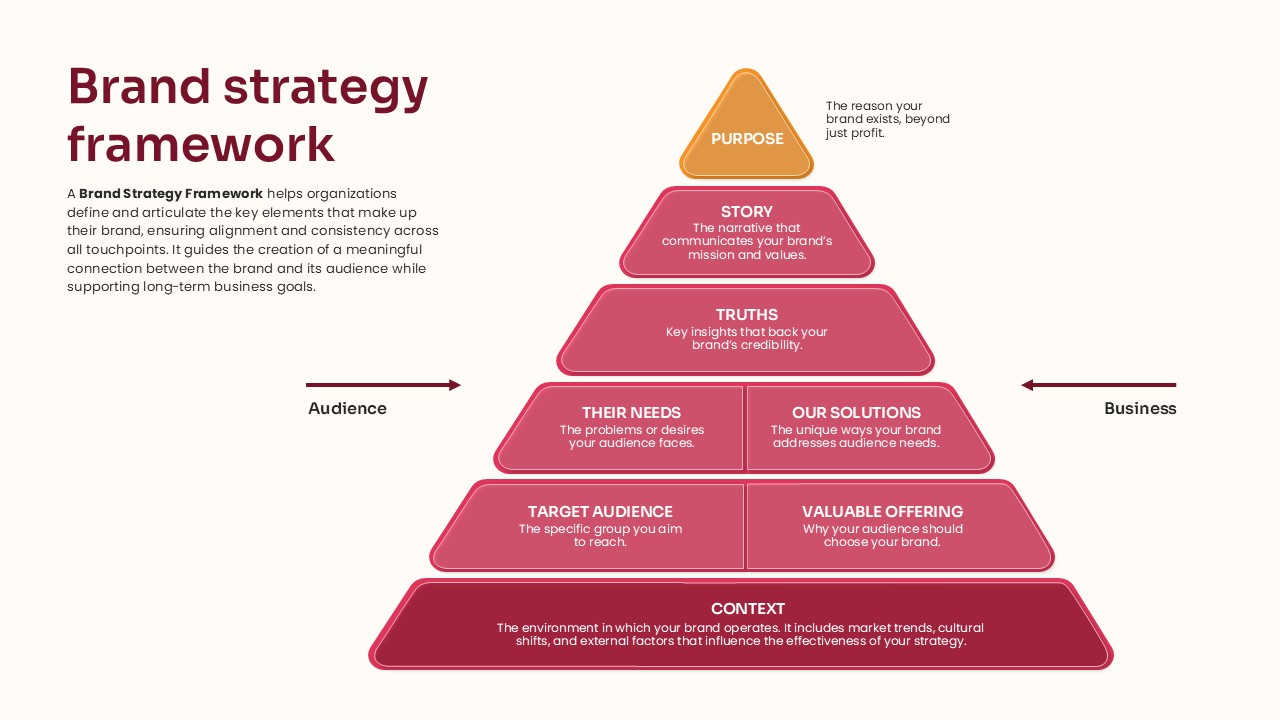
Brand Pyramid Framework template for PowerPoint & Google Slides
Pyramid
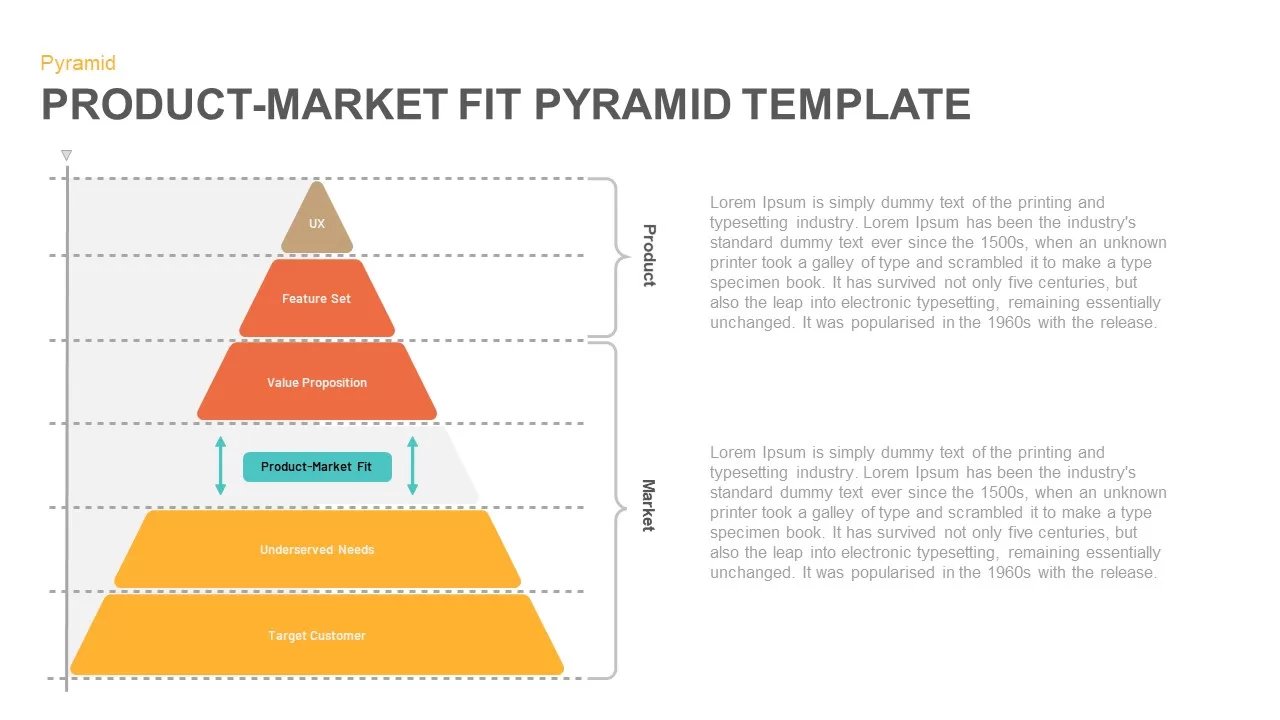
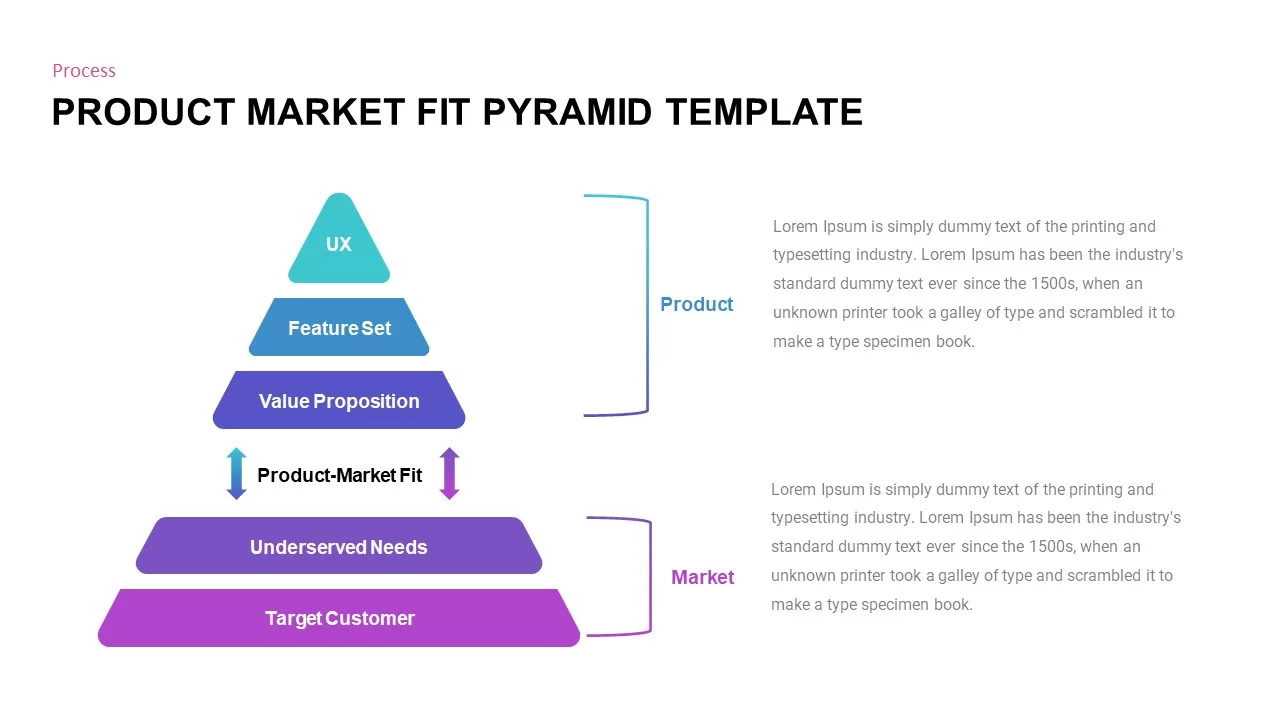
Product-Market Fit Pyramid template for PowerPoint & Google Slides
Pyramid
Professional Product Market Fit Pyramid Template for PowerPoint & Google Slides
Pyramid
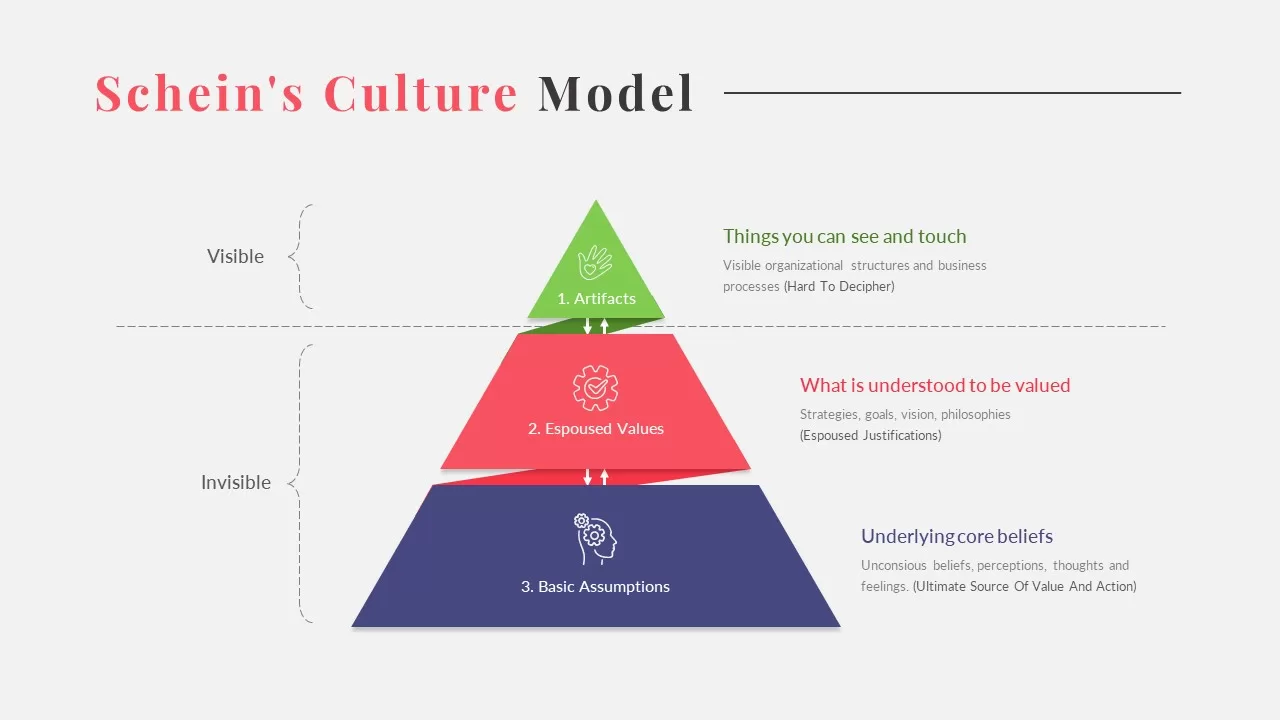
Schein’s Culture Pyramid Model Template for PowerPoint & Google Slides
Pyramid
DIKW Data to Wisdom Pyramid Model Template for PowerPoint & Google Slides
Pyramid
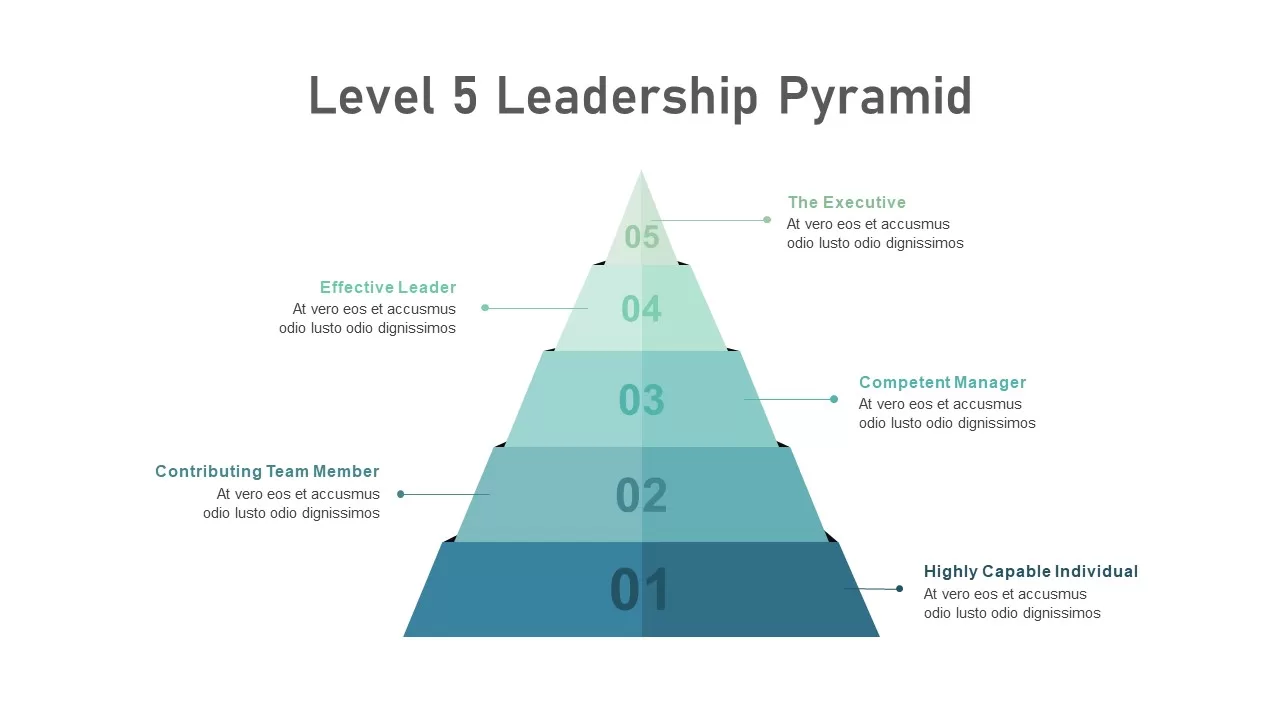
Level 5 Leadership Pyramid Infographic Template for PowerPoint & Google Slides
Pyramid
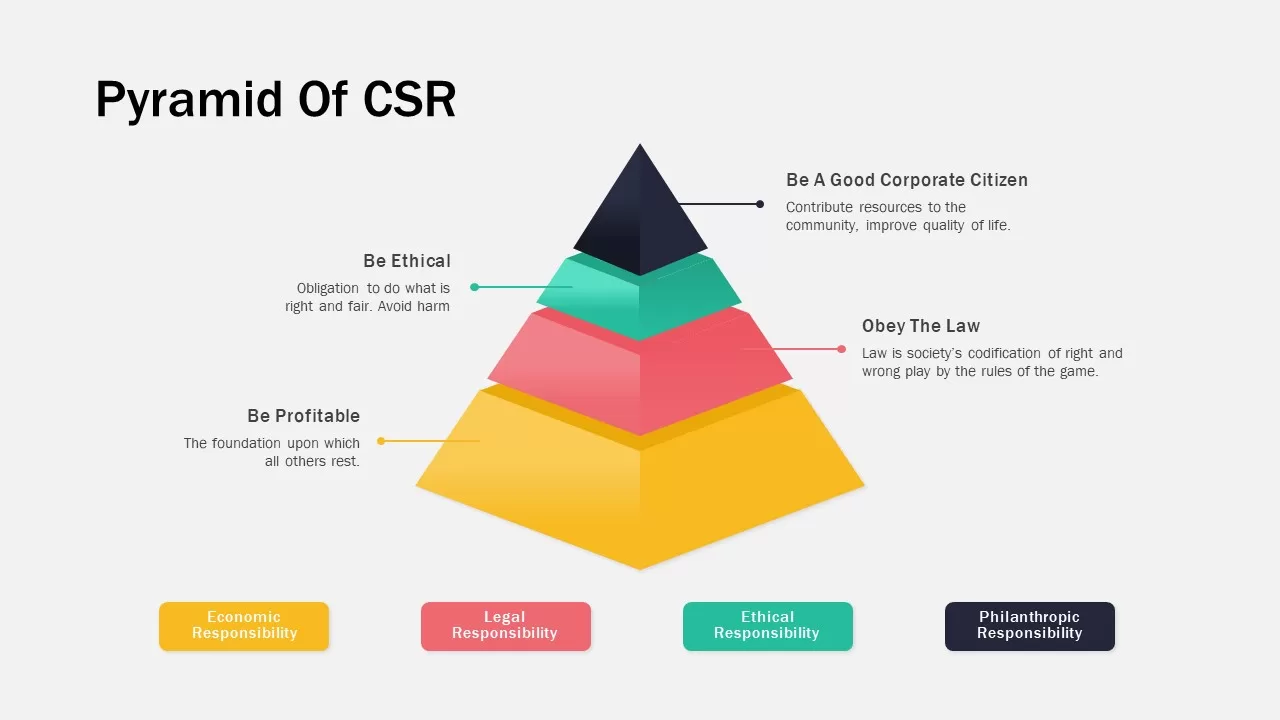
Corporate Social Responsibility Pyramid Template for PowerPoint & Google Slides
Pyramid
Maslow’s Colorful Pyramid of Needs Template for PowerPoint & Google Slides
Pyramid
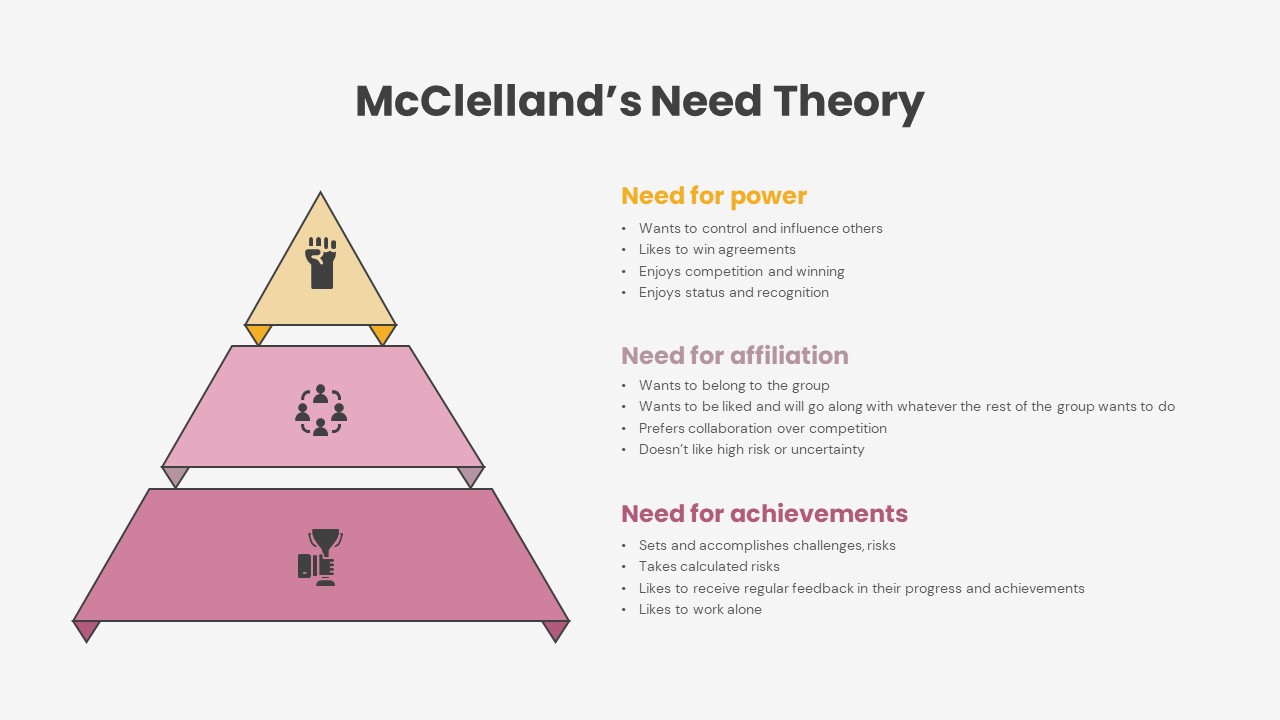
McClelland Theory of Motivation PPT
Pyramid
Five-Stage Pyramid Process Slide Template for PowerPoint & Google Slides
Pyramid
Six-Stage Pyramid Process Slide Template for PowerPoint & Google Slides
Pyramid
3D Four-Stage Pyramid Diagram Template for PowerPoint & Google Slides
Pyramid
Four-Level Colorful Pyramid Diagram Template for PowerPoint & Google Slides
Pyramid
3D Six-Level Pyramid Diagram Infographic Template for PowerPoint & Google Slides
Pyramid
3D Five-Stage Pyramid Diagram Slide Template for PowerPoint & Google Slides
Pyramid
Modern Four-Level Pyramid Diagram Template for PowerPoint & Google Slides
Pyramid
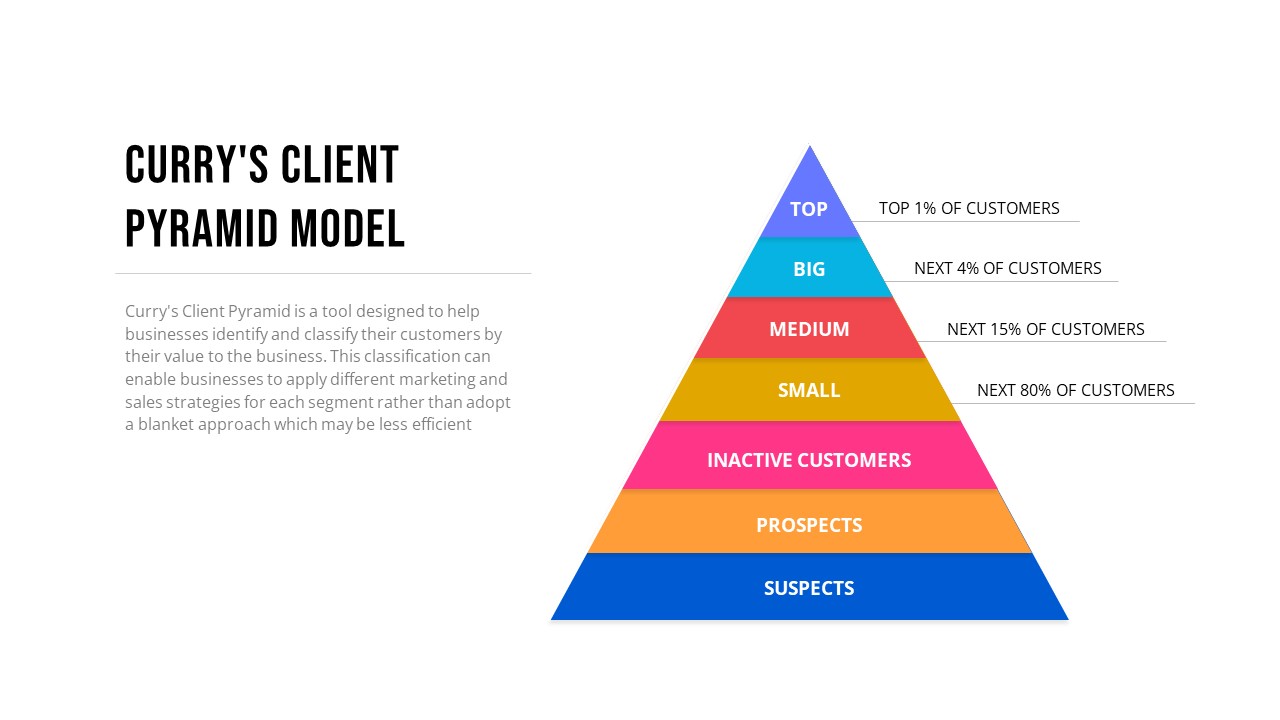
Curry’s Client Segmentation Pyramid Model Template for PowerPoint & Google Slides
Pyramid
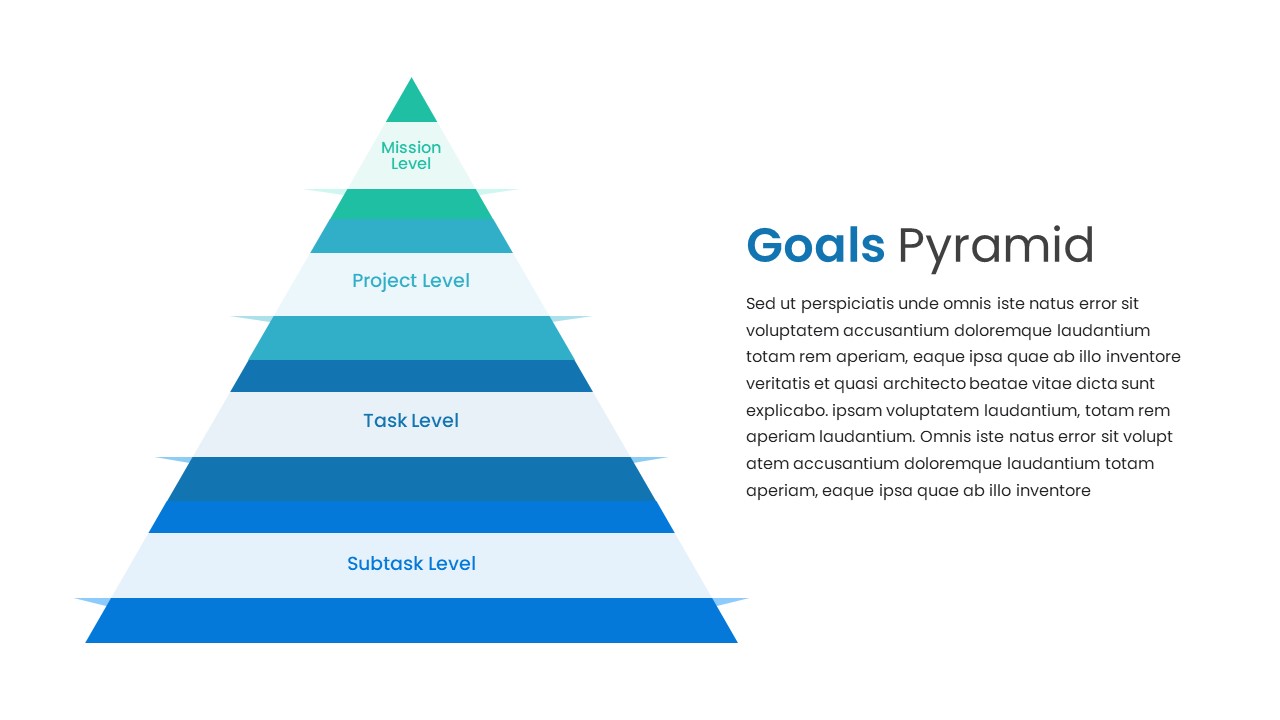
Goals Pyramid Hierarchy Slide Design Template for PowerPoint & Google Slides
Pyramid
Risk Pyramid Hierarchy Analysis Template for PowerPoint & Google Slides
Pyramid
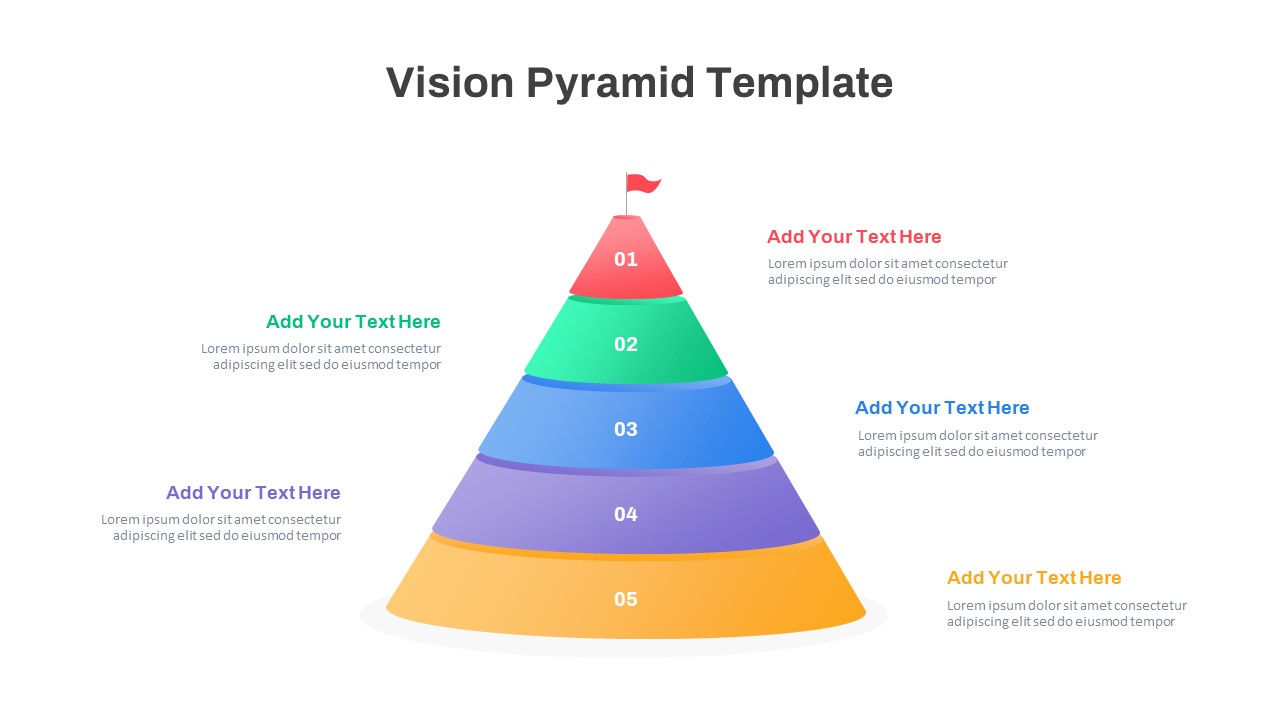
Five-Level Vision Pyramid Diagram Template for PowerPoint & Google Slides
Pyramid
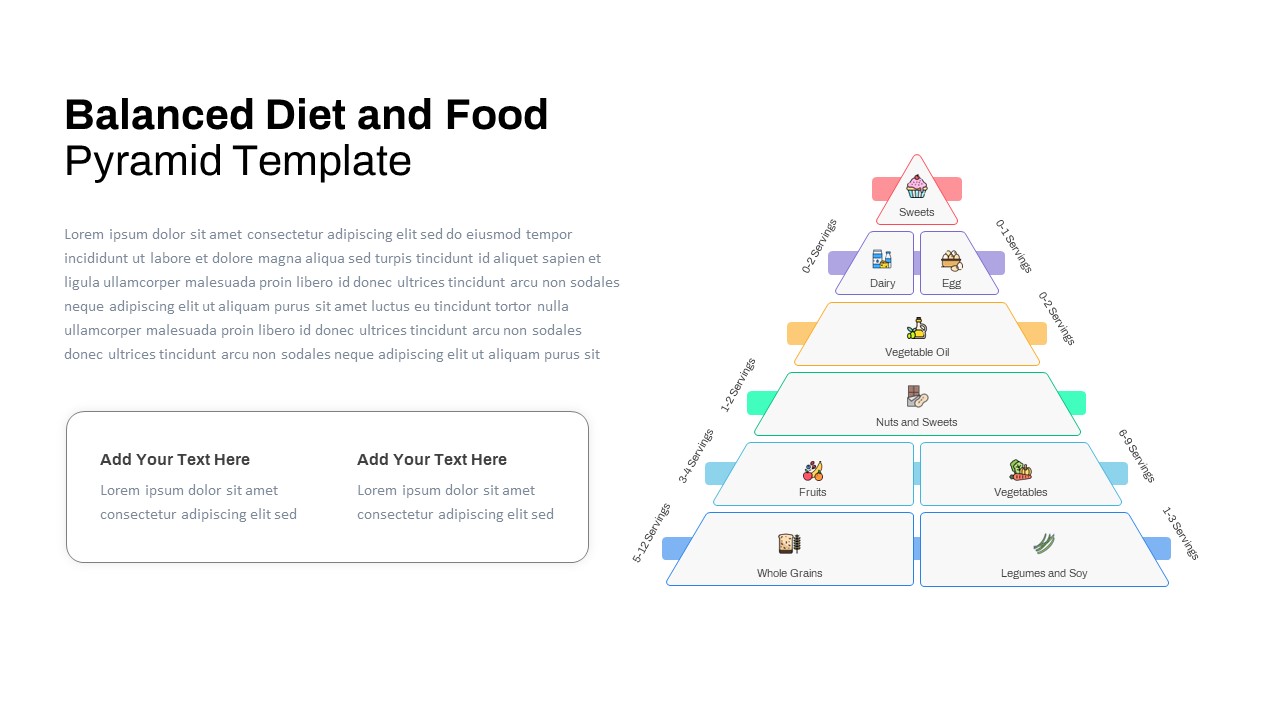
Free Balanced Diet and Food Pyramid Template for PowerPoint & Google Slides
Pyramid
Free
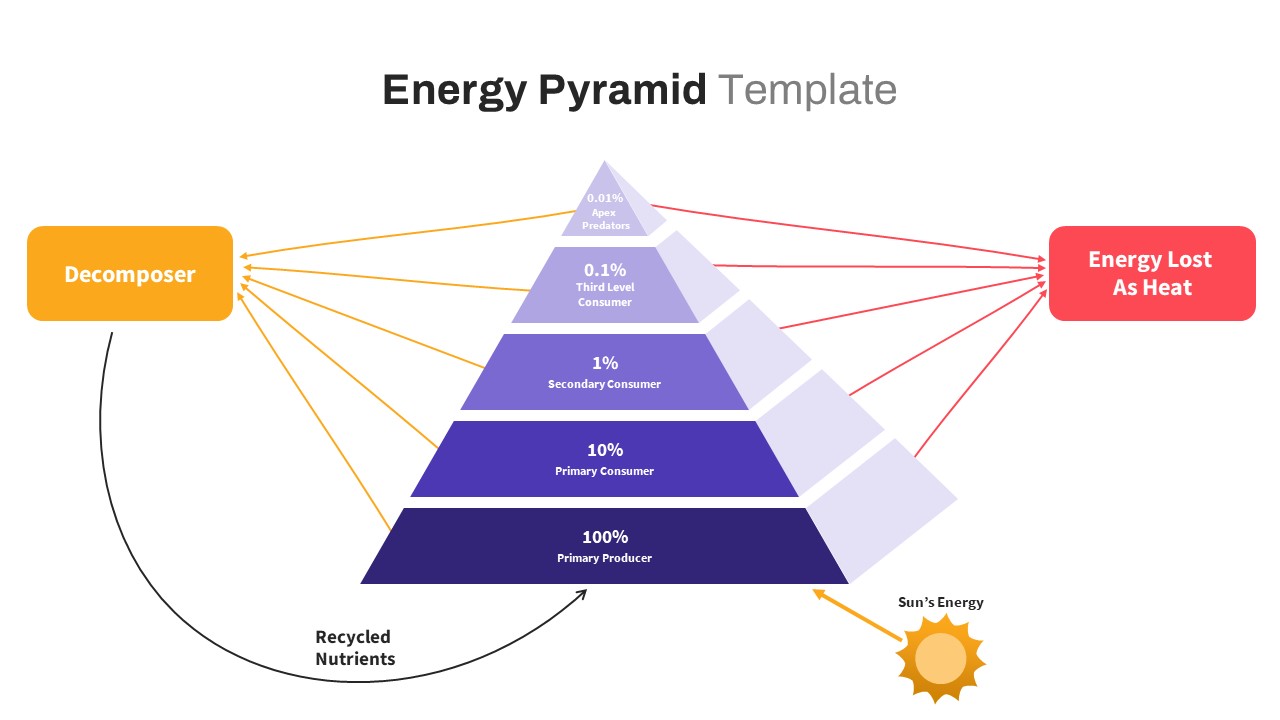
Free Ecological Energy Flow Pyramid Template for PowerPoint & Google Slides
Pyramid
Free
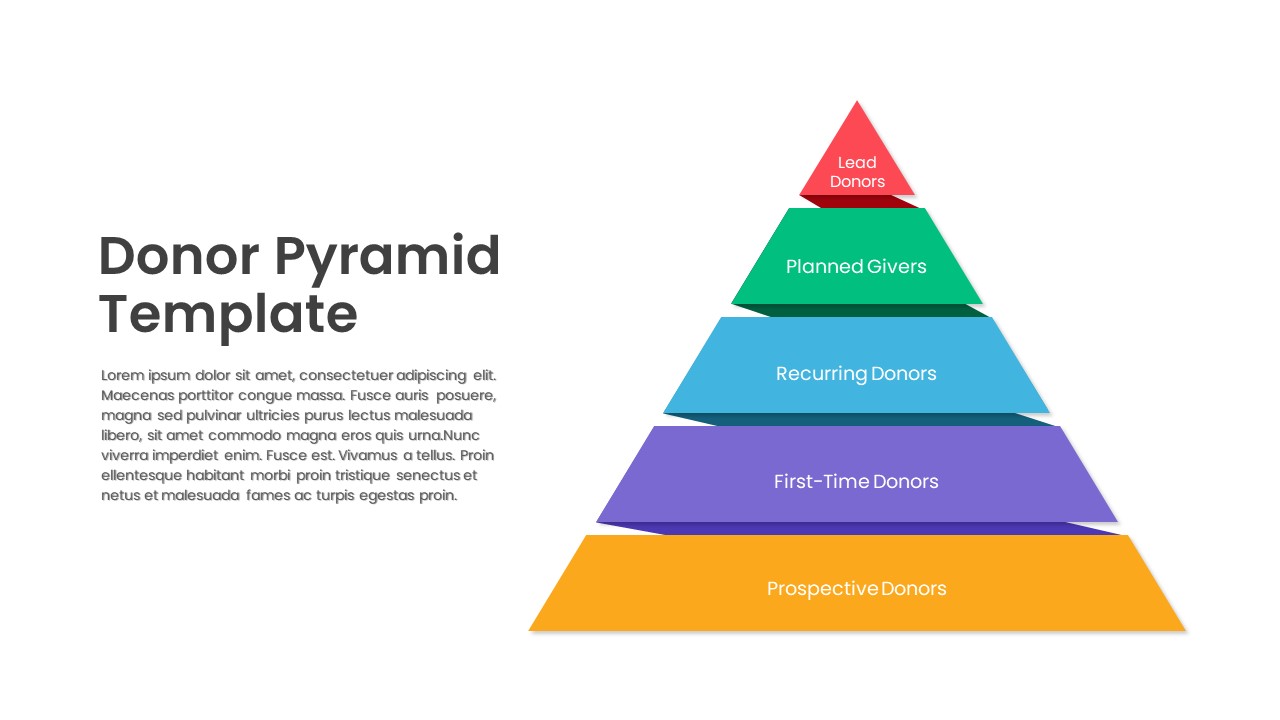
Five-Level Donor Pyramid Philanthropy Template for PowerPoint & Google Slides
Pyramid
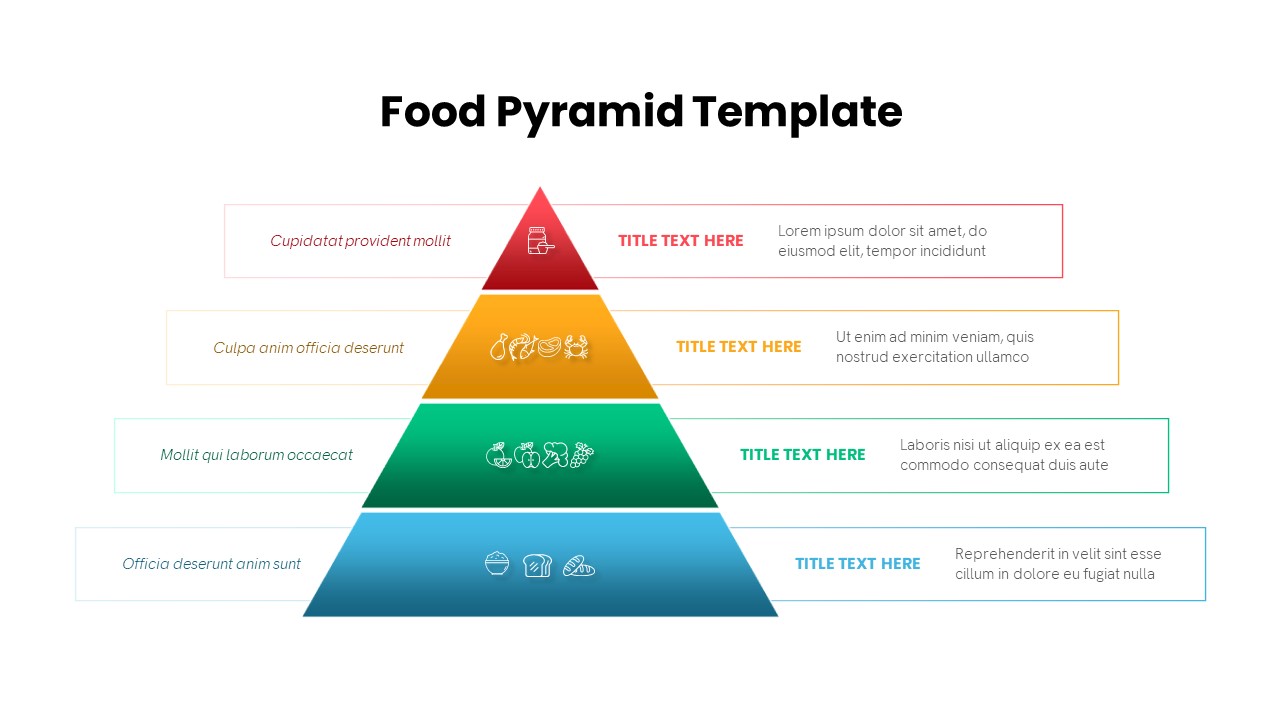
Four-Level Food Pyramid Infographic Template for PowerPoint & Google Slides
Pyramid
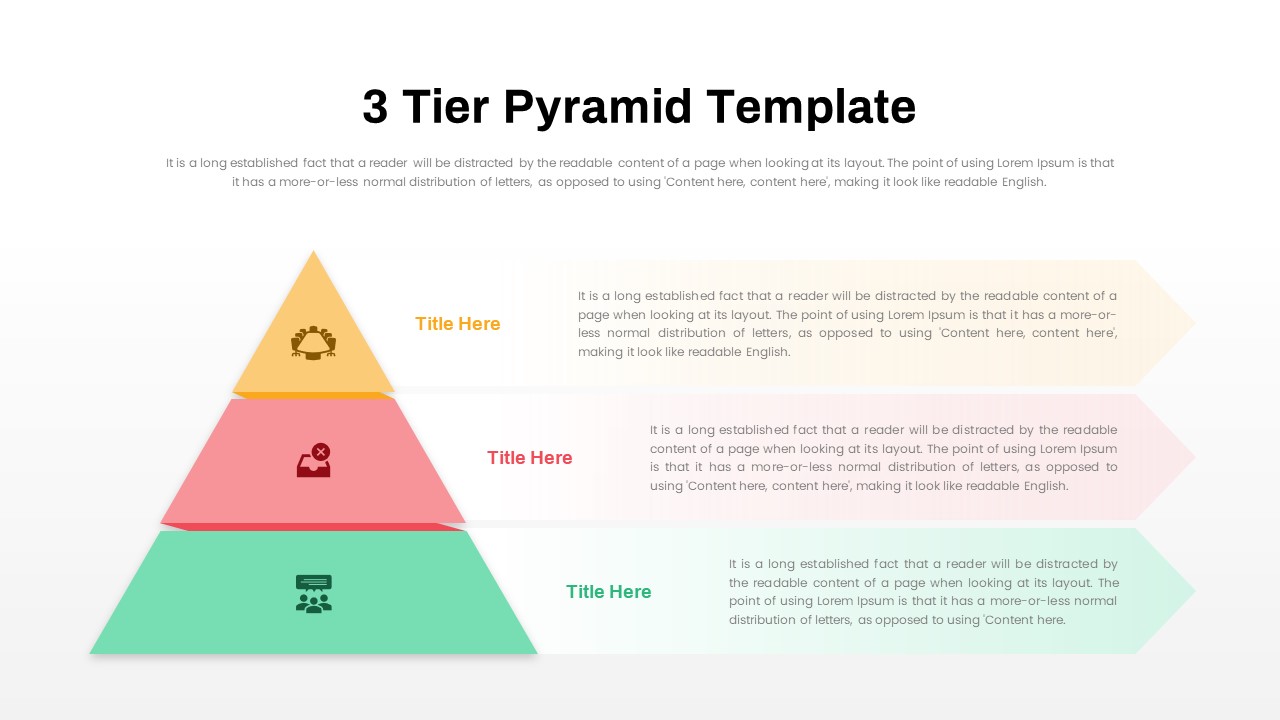
3 Tier Pyramid Template for PowerPoint & Google Slides
Pyramid
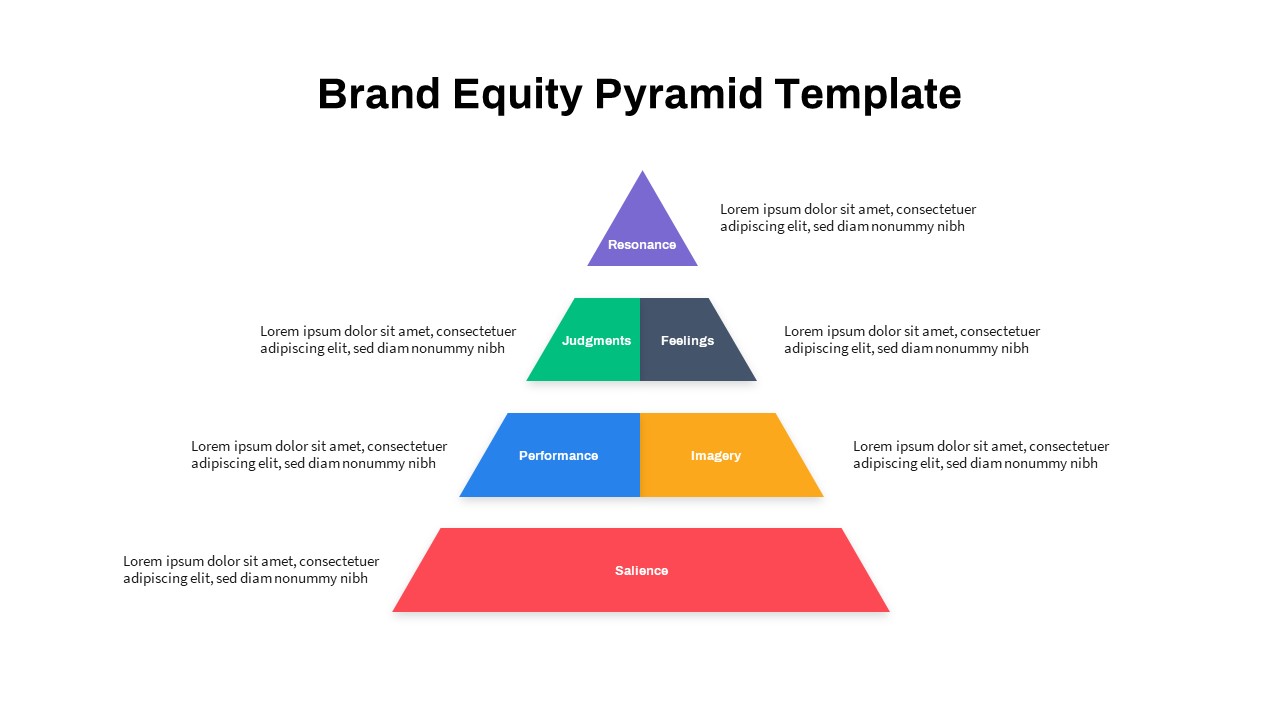
Strategic Brand Equity Pyramid Diagram Template for PowerPoint & Google Slides
Pyramid
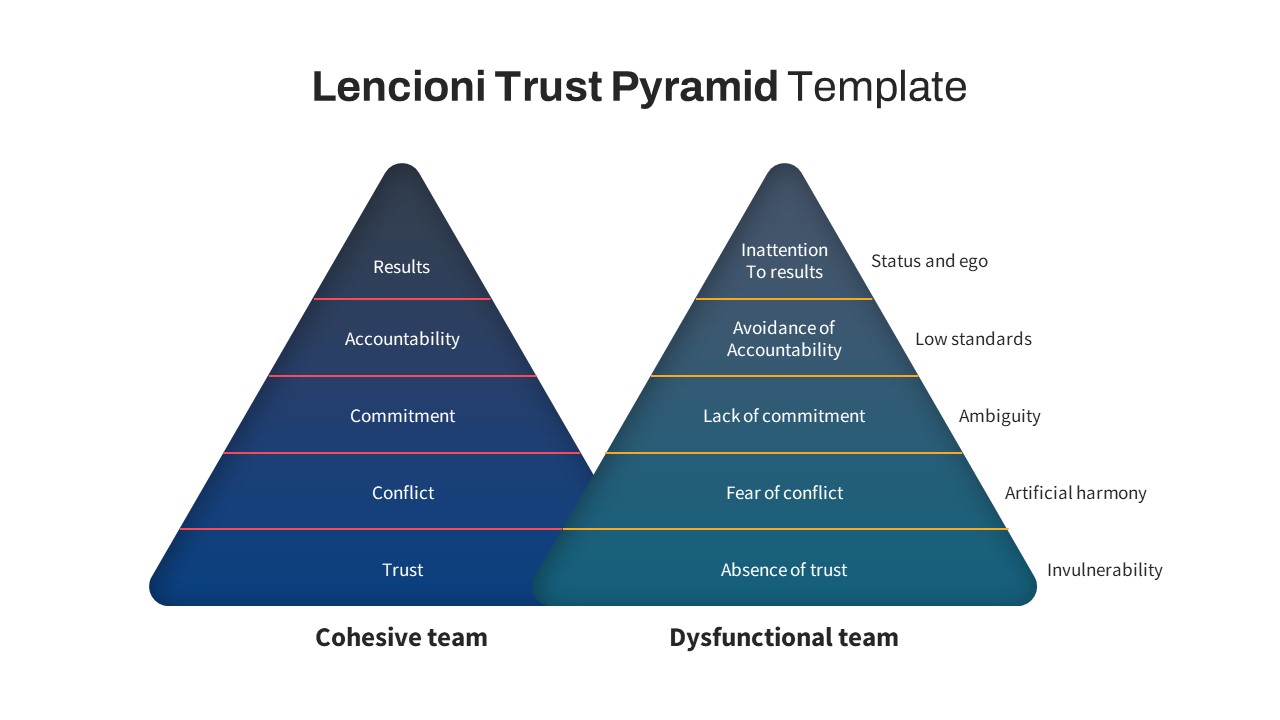
Lencioni Trust Pyramid Diagram Template for PowerPoint & Google Slides
Pyramid
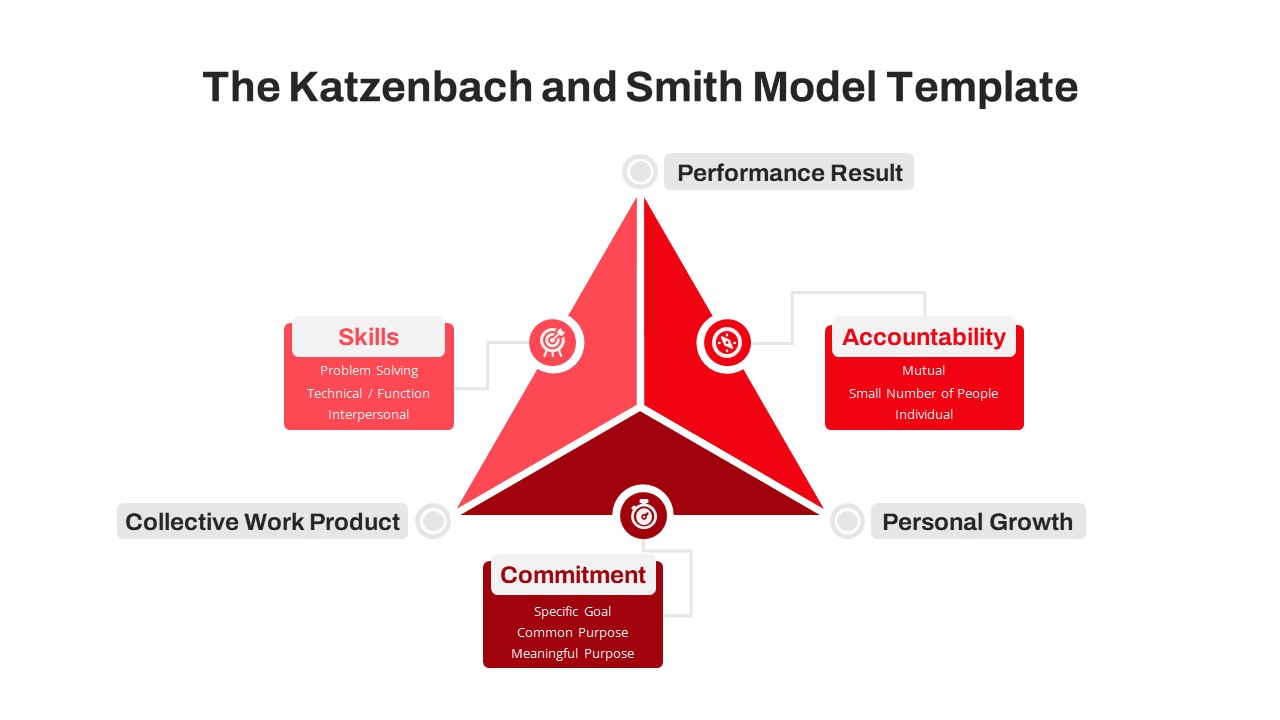
Katzenbach & Smith Model Pyramid Template for PowerPoint & Google Slides
Pyramid
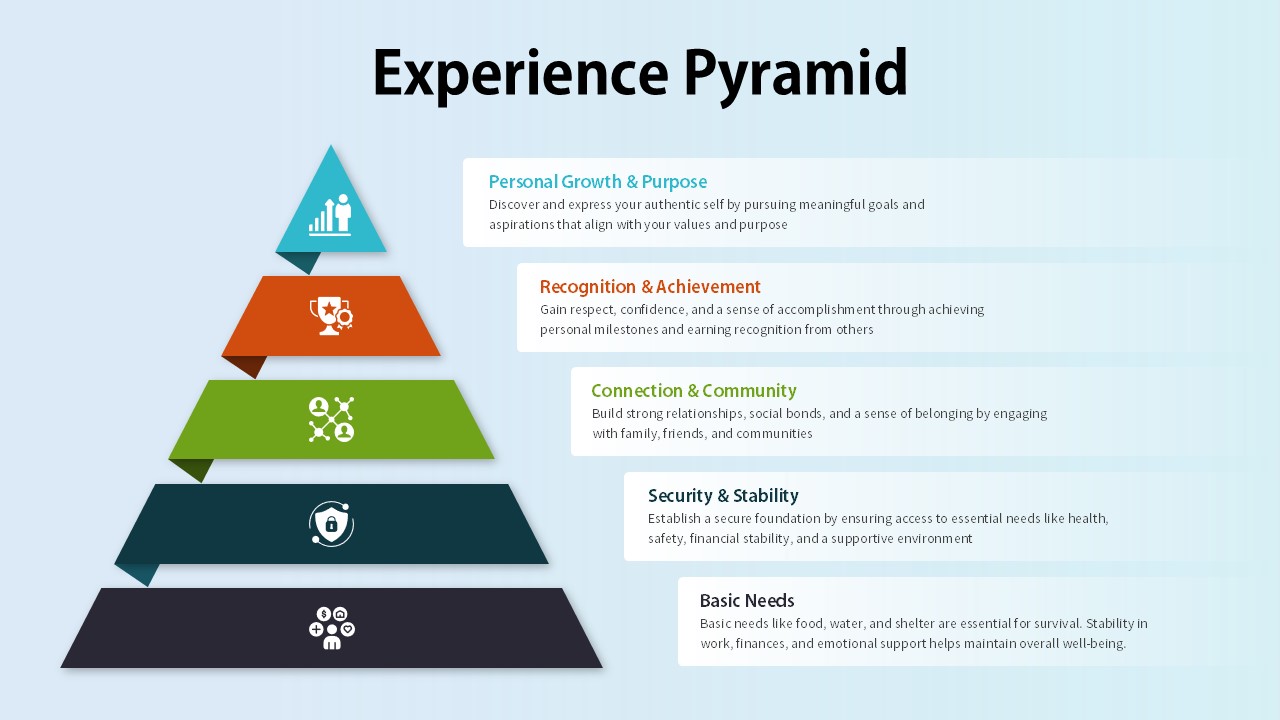
Experience Pyramid Hierarchy Diagram Template for PowerPoint & Google Slides
Pyramid
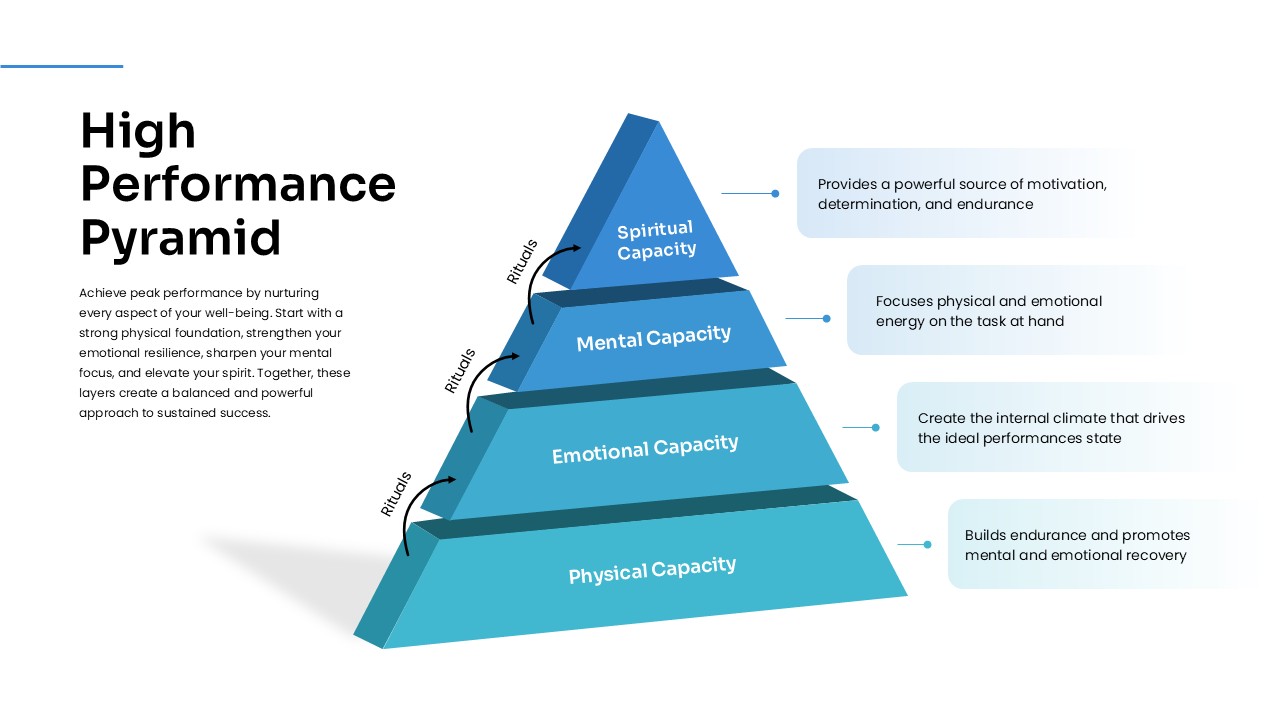
High Performance Pyramid Diagram Template for PowerPoint & Google Slides
Pyramid
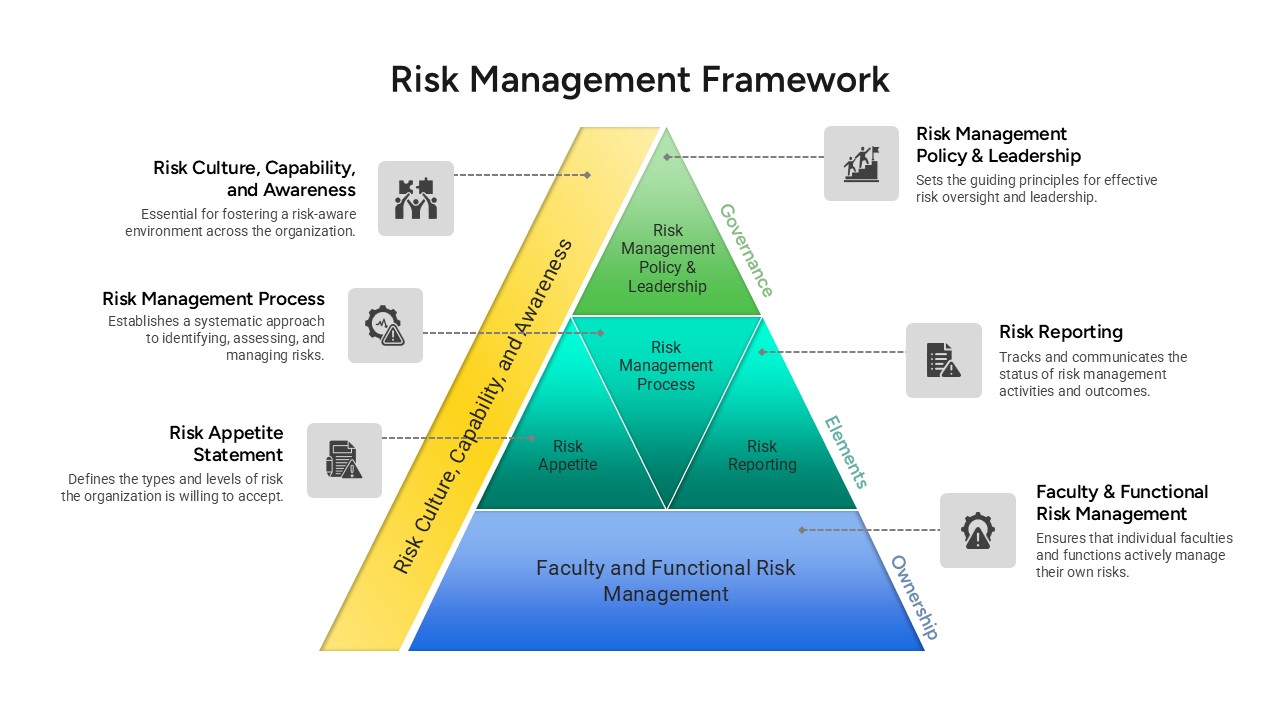
Risk Management Framework Pyramid Template for PowerPoint & Google Slides
Risk Management
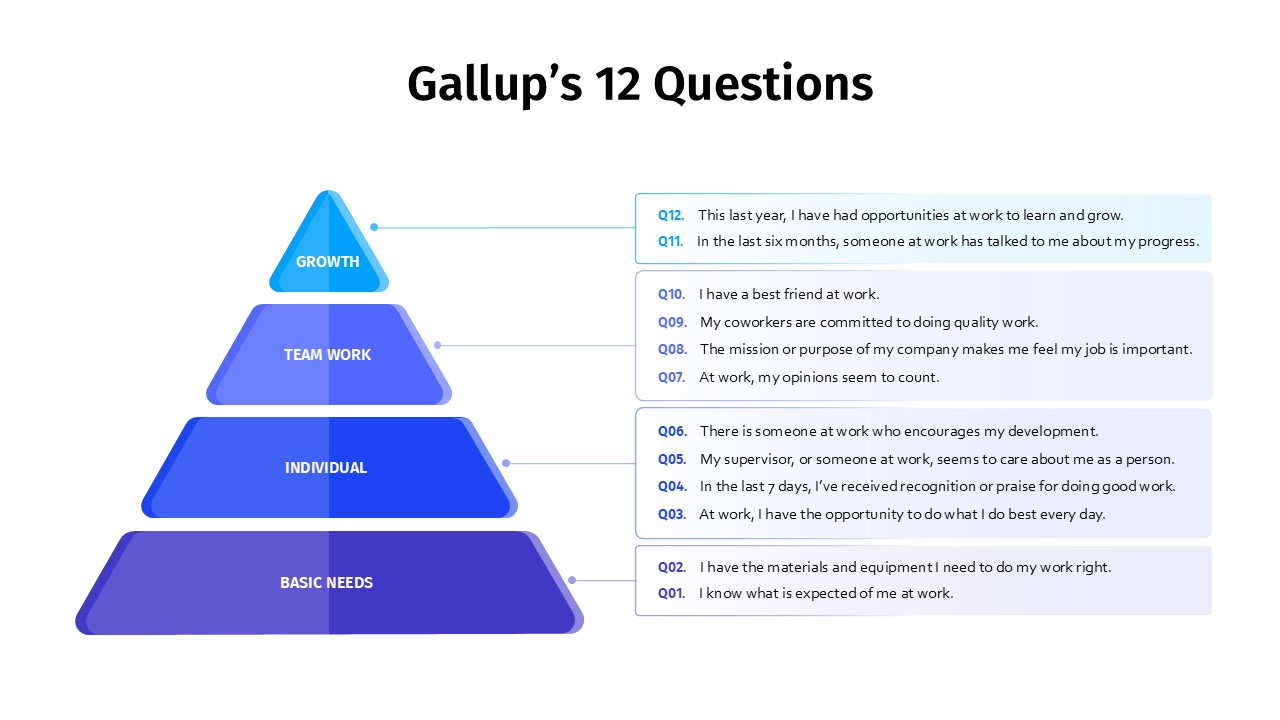
Gallup’s 12 Questions Engagement Pyramid Template for PowerPoint & Google Slides
Pyramid
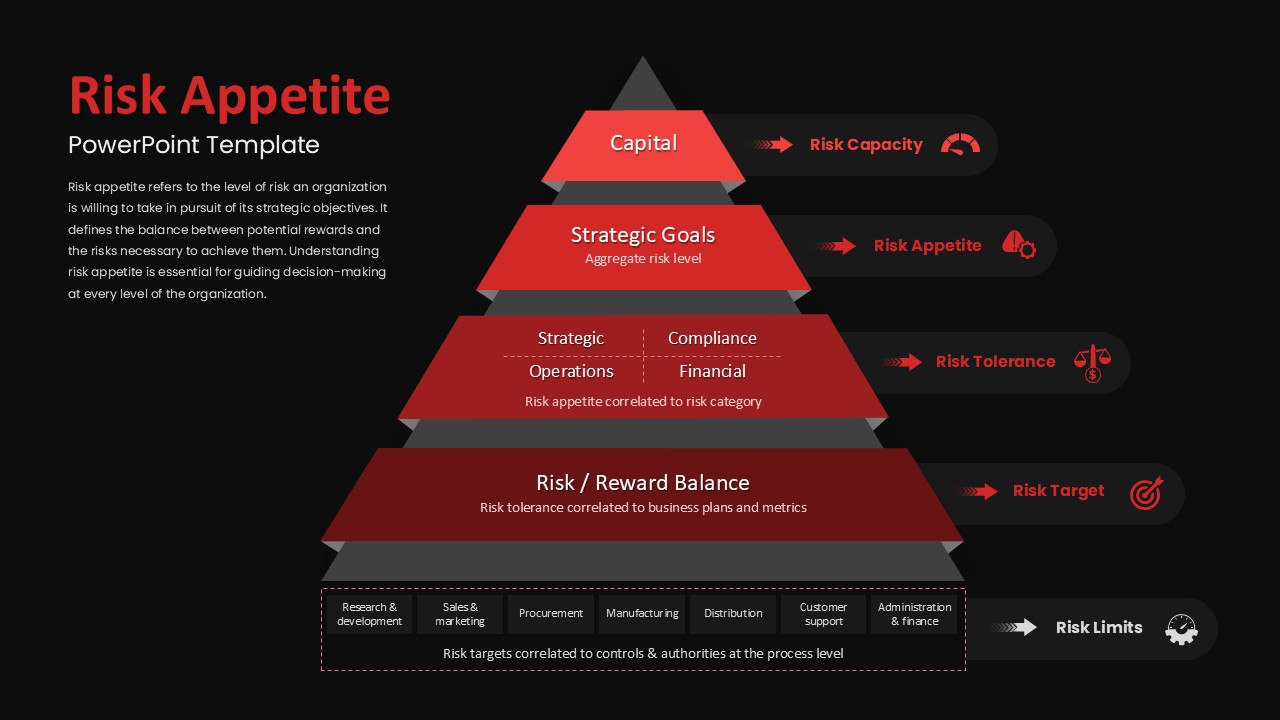
Risk Appetite Pyramid Framework Template for PowerPoint & Google Slides
Pyramid
Pyramid Brand Strategy Framework Template for PowerPoint & Google Slides
Business Strategy
Data Governance Roles Pyramid Diagram Template for PowerPoint & Google Slides
Pyramid
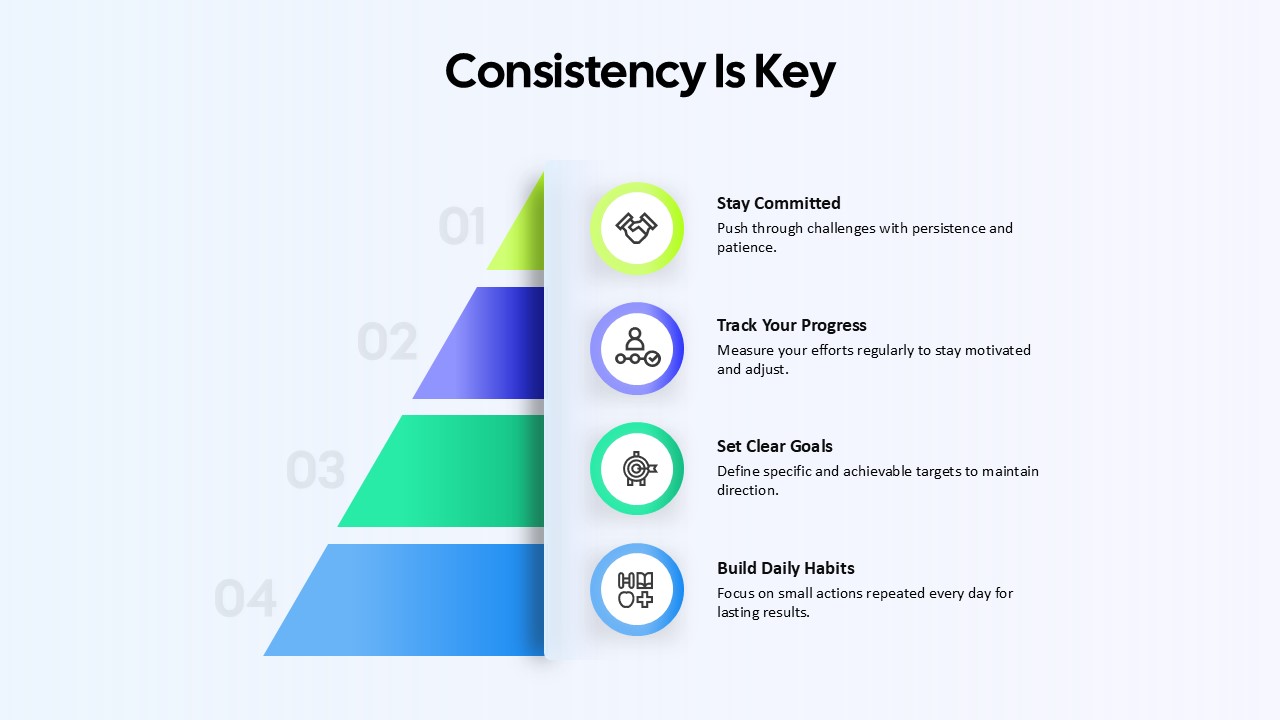
Consistency Is Key Four-Step Pyramid Template for PowerPoint & Google Slides
Process
Five-Stage Pyramid Template for PowerPoint & Google Slides
Pyramid
Four Level Pyramid Infographic Template for PowerPoint & Google Slides
Pyramid
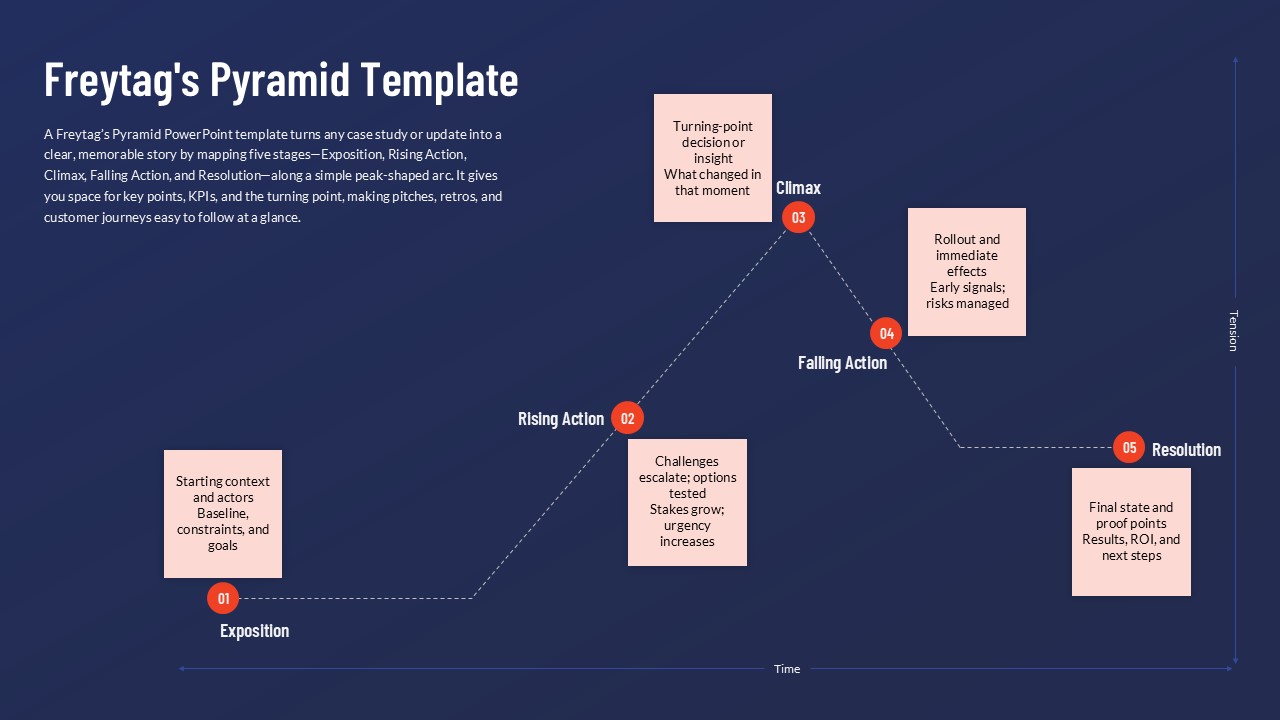
Freytag’s Pyramid Template for PowerPoint & Google Slides
Process
Four-Level Colorful Pyramid Diagram Template for PowerPoint & Google Slides
Pyramid
5 Level Hierarchy Pyramid Template for PowerPoint & Google Slides
Pyramid

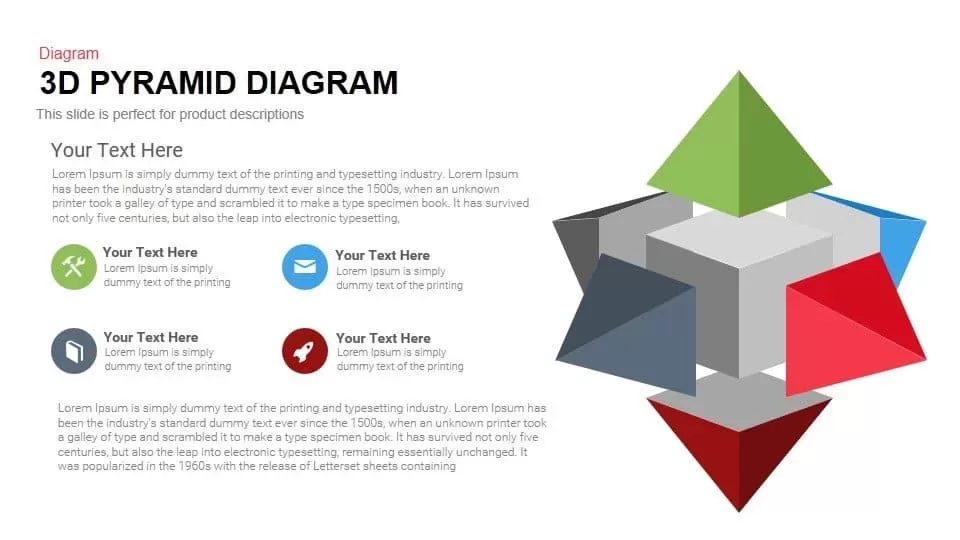
3D Pyramid Diagram for PowerPoint & Google Slides
Pyramid
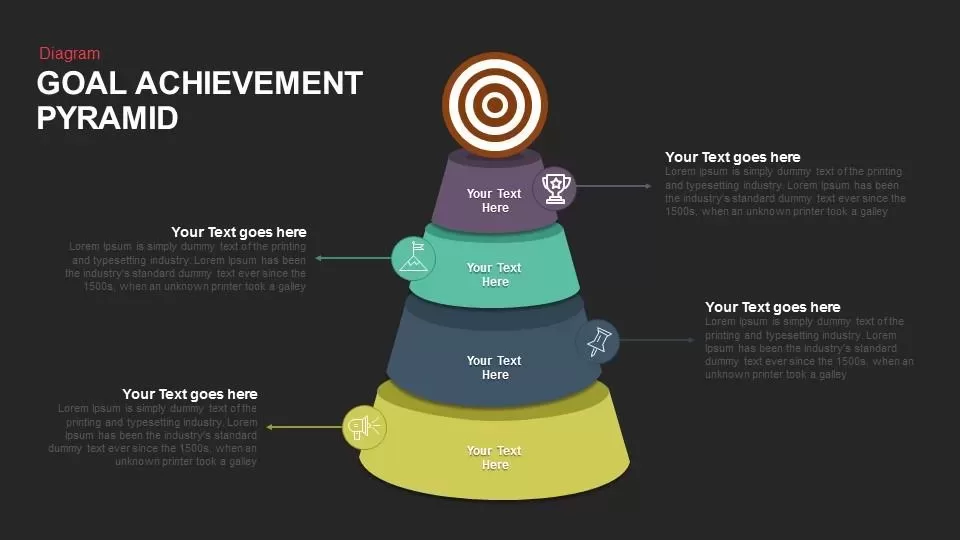
Goal Achievement Pyramid Diagram for PowerPoint & Google Slides
Pyramid
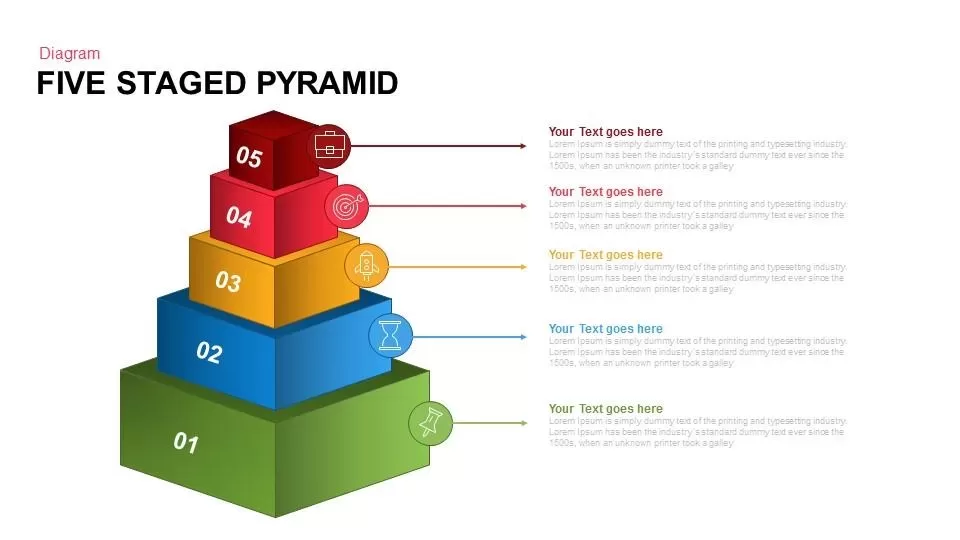
Five Staged Pyramid Diagram for PowerPoint & Google Slides
Pyramid
5 Stage Pyramid Slide for PowerPoint & Google Slides
Pyramid
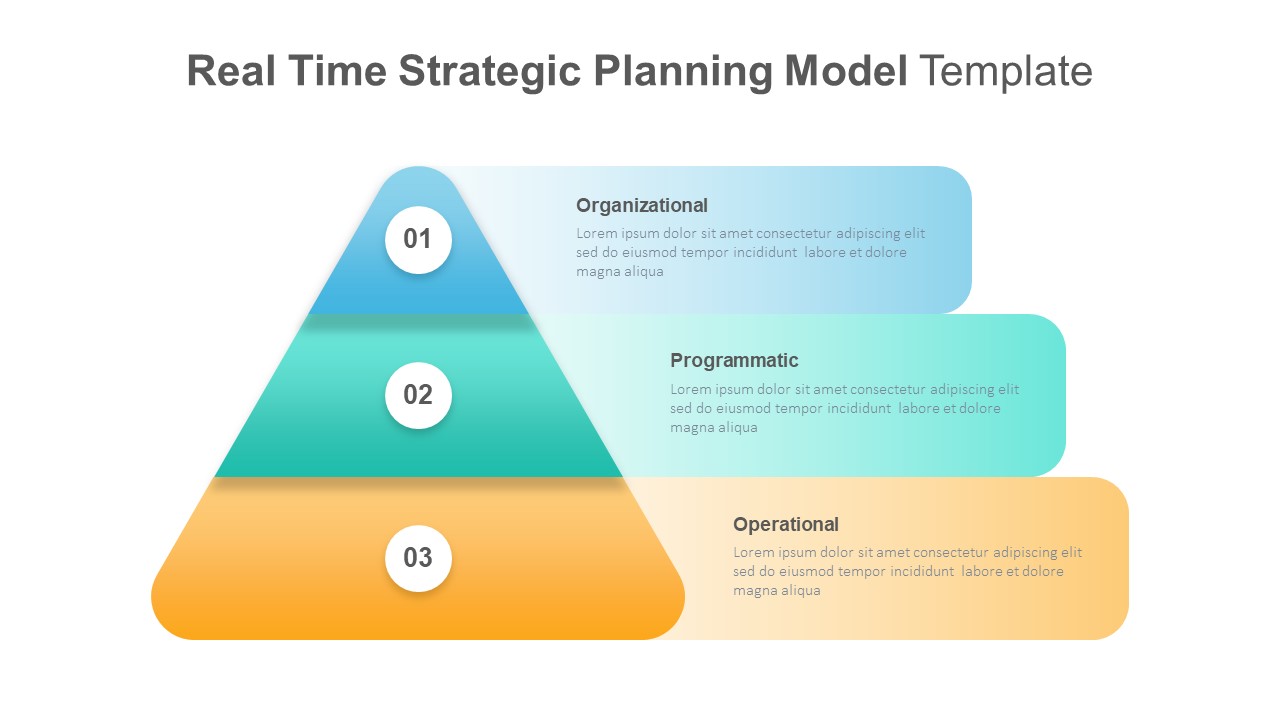
Real-Time Strategic Planning Pyramid Slide for PowerPoint & Google Slides
Business Strategy
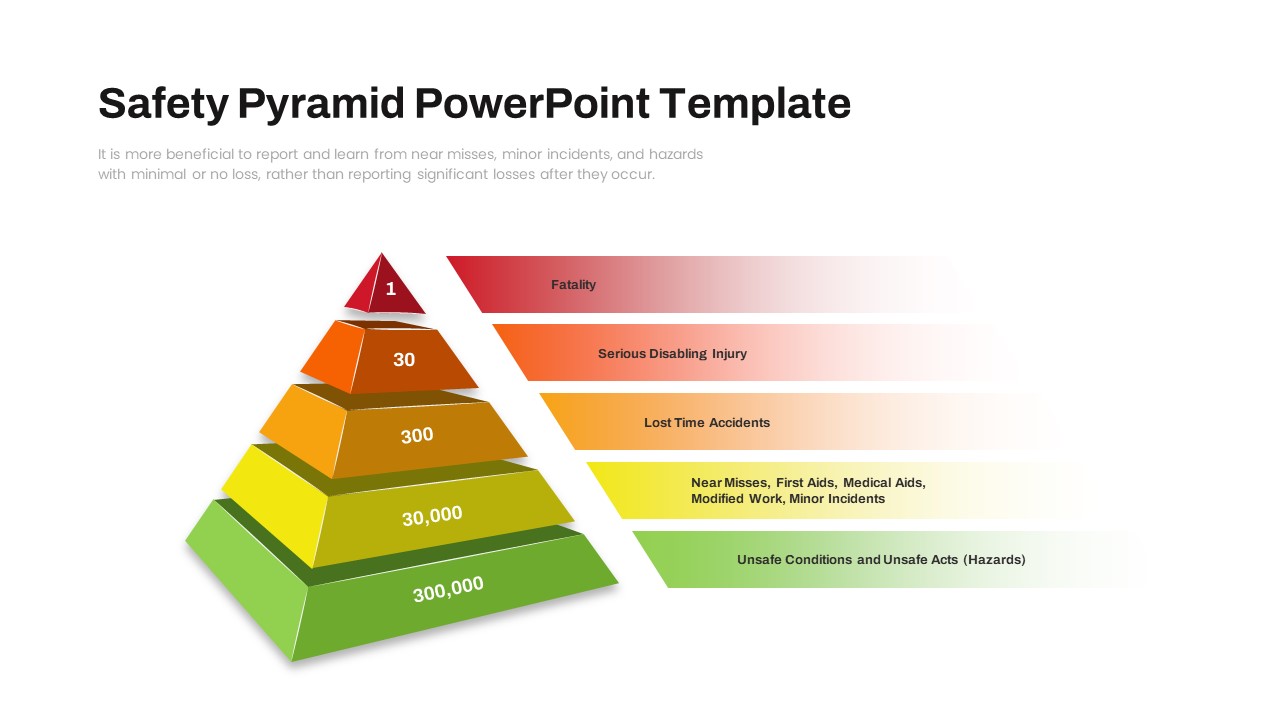
Safety Pyramid PowerPoint Template
Risk Management
True vs. Incomplete MVP Pyramid Slide for PowerPoint & Google Slides
Pyramid
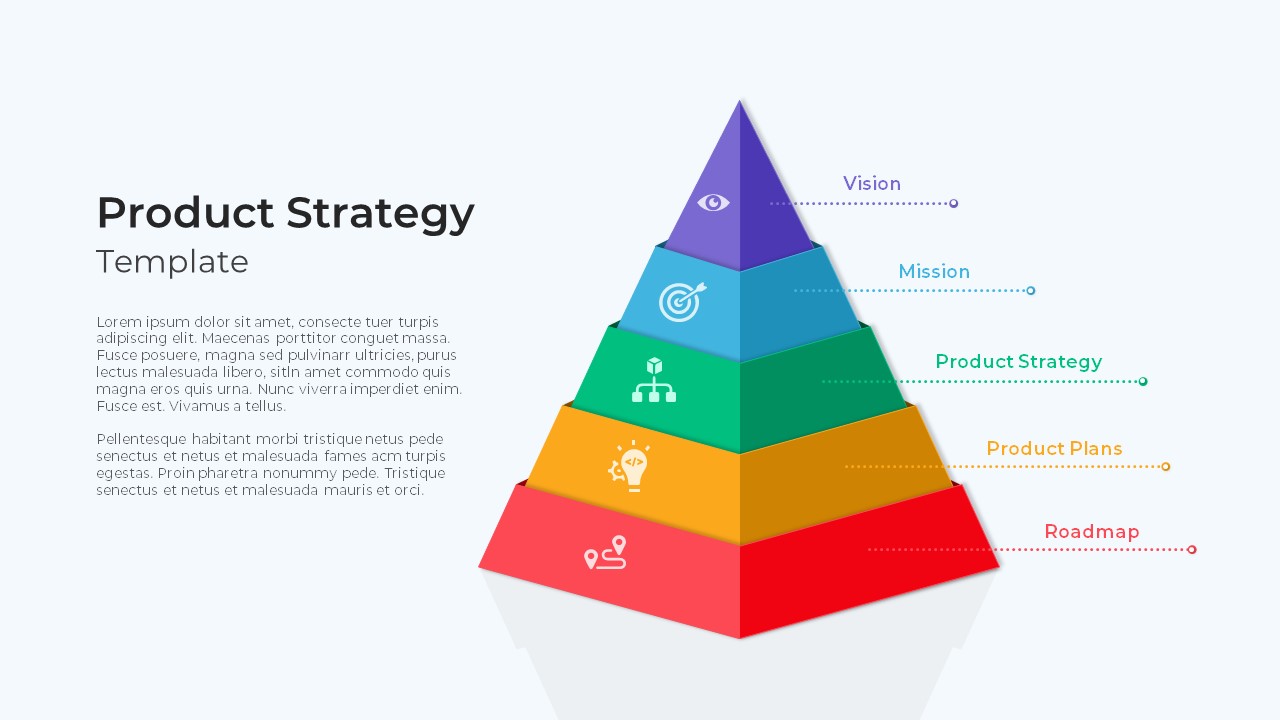
Product Strategy Pyramid Diagram for PowerPoint & Google Slides
Business Strategy
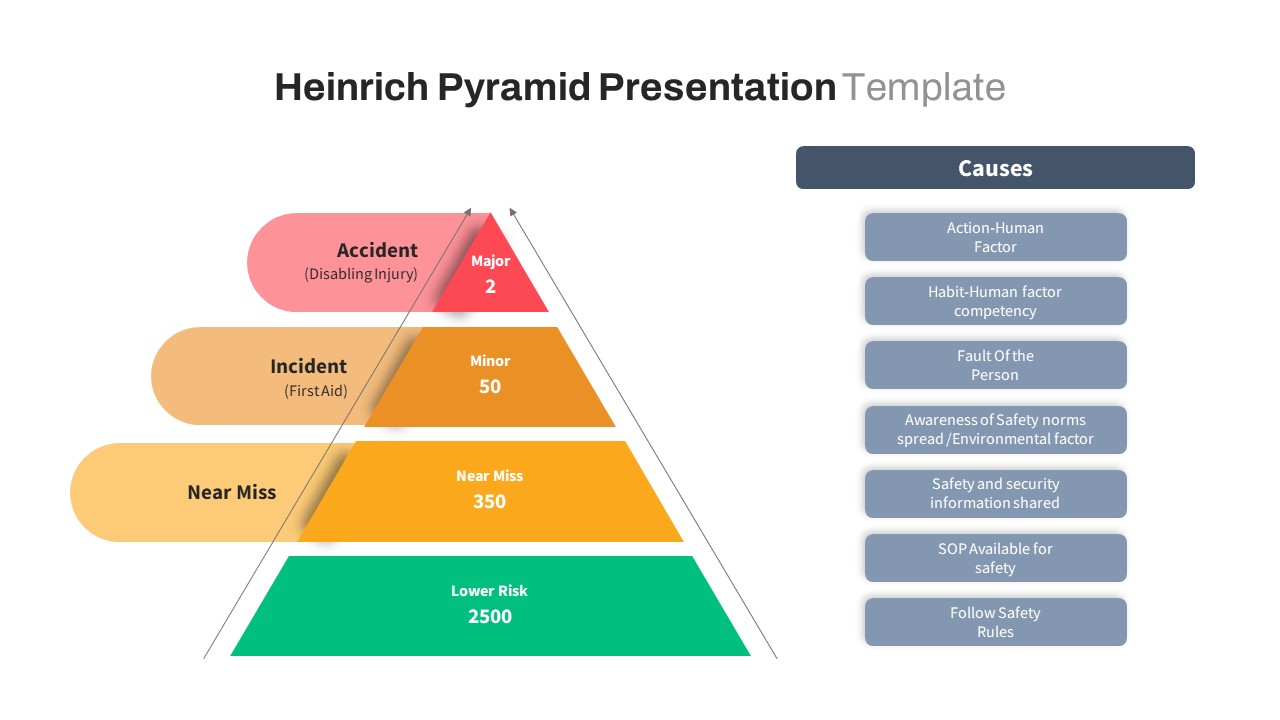
Heinrich Safety Pyramid Theory PPT & Google Slides
Pyramid
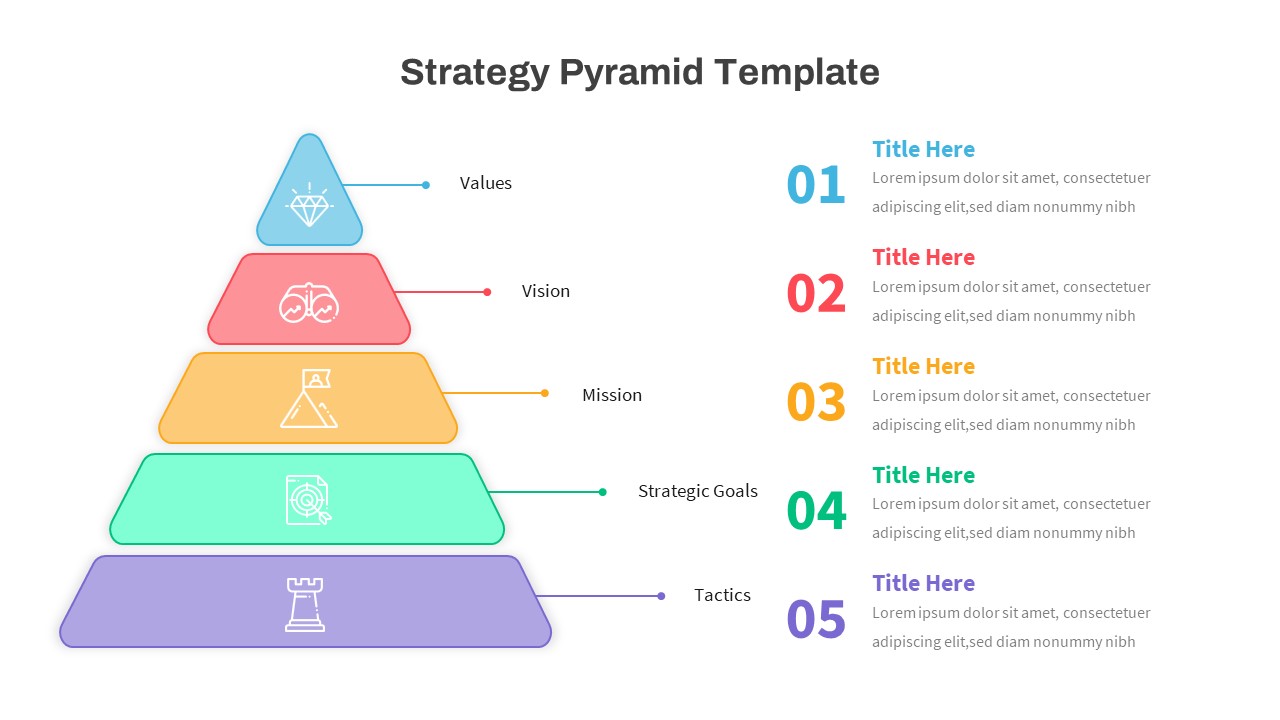
Business Strategy Pyramid with Goals and Tactics for PowerPoint & Google Slides
Pyramid
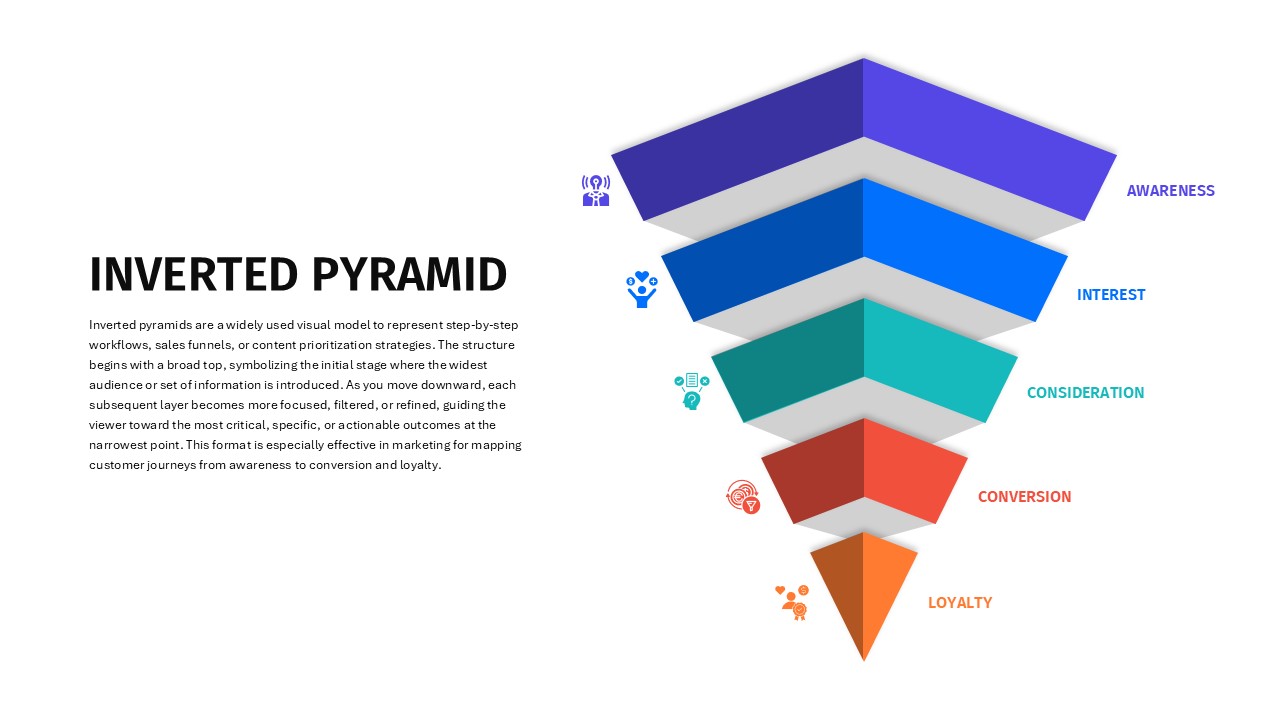
Inverted Pyramid for PowerPoint & Google Slides
Funnel
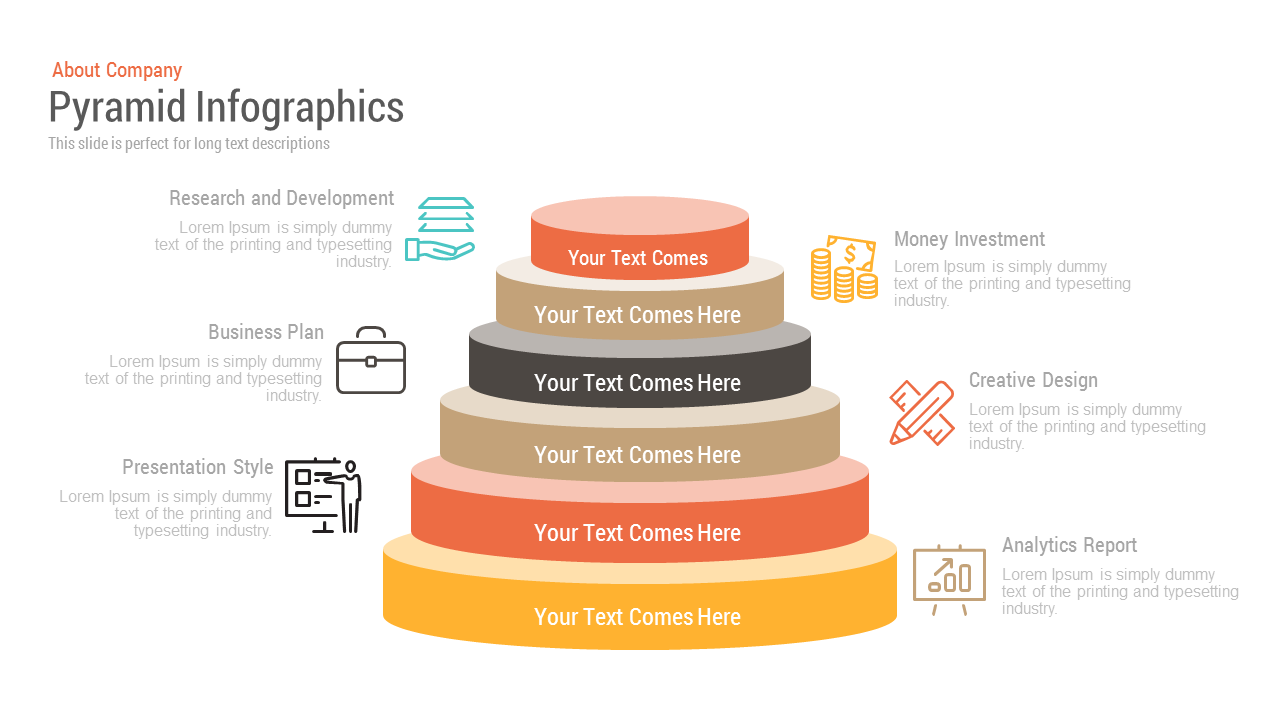
Free Pyramid Diagram Infographics PowerPoint Template
Pyramid
Free
Quad Chart Infographic Pack of 8 Slides Template for PowerPoint & Google Slides
Comparison Chart
Free Professional Gantt Chart Pack – 4 Slides Template for PowerPoint & Google Slides
Gantt Chart
Free
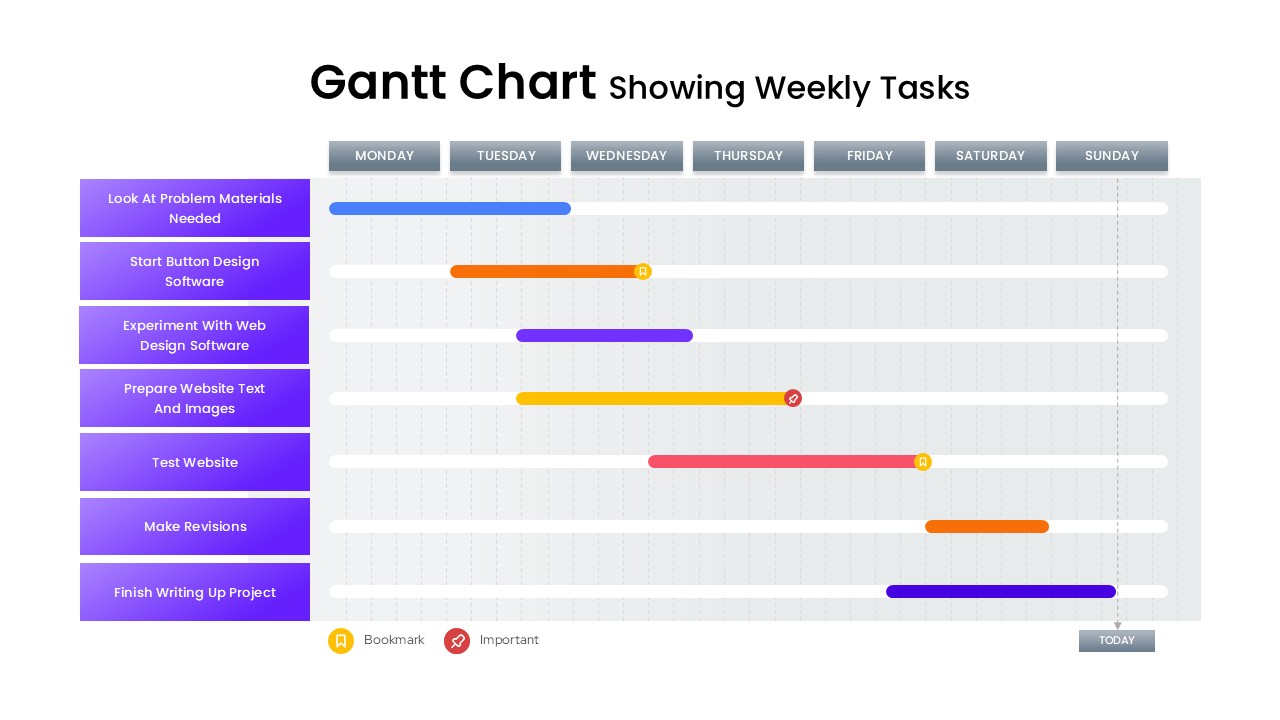
Gantt Chart Template Showing Weekly Tasks Template for PowerPoint & Google Slides
Gantt Chart

Fully Editable Gantt Chart Timeline template for PowerPoint & Google Slides
Gantt Chart
Business Growth Metaphor Chart Template for PowerPoint & Google Slides
Business
Timeline Comparison Slide PowerPoint Template
Comparison Chart
Multi-Series Line Chart with Icons Template for PowerPoint & Google Slides
Comparison Chart