


Data Over Timeline Chart Template for PowerPoint


Timeline Chart Template – Data Visualization PowerPoint Template
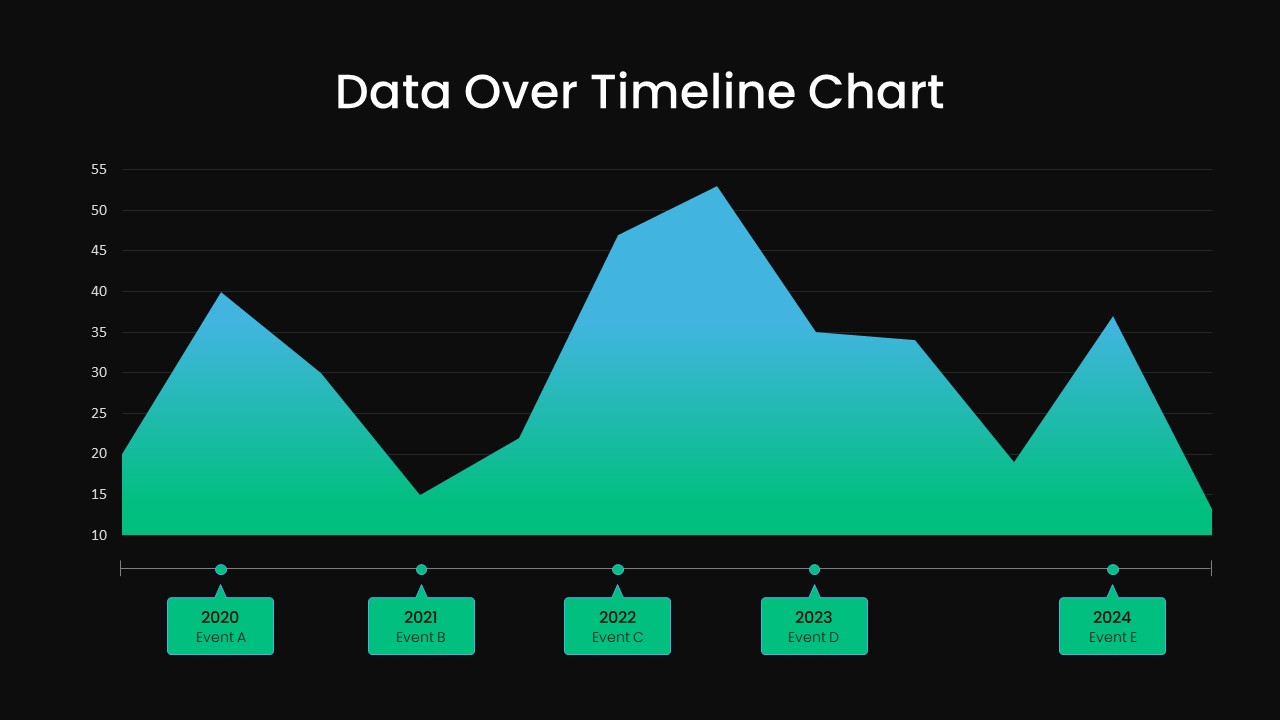
The Line Chart PowerPoint Template for Time-based Data Visualization is the best PowerPoint chart to show trends over time. This chart combines the characteristics of a line graph and an area chart, using vibrant colors to enhance its visual appeal. It is particularly useful for researchers and professionals as it allows for easy updates of statistical values. Unlike a simple line graph, this chart resembles an area graph, capturing the audience’s attention and ensuring a clear understanding of the data points. Its purpose is to showcase a range of potential future values based on past trends. These charts are ideal for presenting business reports, sales figures, market trends, and linear movements. When shown in a PowerPoint timeline chart, the audience can easily understand fluctuations in business.
The Line Chart PowerPoint Template for Time-based Data Visualization is useful for project forecasting reports. The crystal-clear appearance and green color mix is one of the key highlights of the data chart in PowerPoint. It helps present financial outcomes, and the uncertainty has been clutching over time. The chart looks like a mountain with ups and downs and is perfect for delivering how the market has moved over the years. The presenters can show the numerical values on the Y-axis. The X-axis will establish the chronology of the timeline chart. The presenters can use the bottom boxes to present events over time.
What is a Timeline Chart
A timeline chart is a visual tool used to track metric evolution and data changes over a specific period. It maps key data points, performance trends, and significant chronological fluctuations along a horizontal axis, making historical spikes, dips, and milestones easy to interpret at a glance. Utilizing a professional timeline chart template helps eliminate visual clutter, highlights key business events, and delivers clear, data-driven narratives that support informed decision-making.
The Line Chart PowerPoint Template for Time-based Data Visualization for PowerPoint presentation is a simple presentation graph in two background colors. The black and white background choices allow the presenter to pick a template according to the color sense. As an editable chart in PowerPoint, users can add their text points in preferred places. It also allows the users to easily update values in real time. So, you can add data on an Excel sheet or PowerPoint to update predictable values. Use captivating PowerPoint graphs and charts for your business presentations. Check out more charts and graph templates here.
Target Audience and Uses of this Timeline Chart Template
This versatile timeline chart template is designed for product managers, financial analysts, marketing teams, project managers, executives, and educators who need to deliver clear trend analyses, performance reviews, and strategic forecasts. Beyond traditional annual reporting, this clean layout can be seamlessly repurposed for budget tracking, user growth visualization, project milestone mapping, sales velocity comparisons, and resource allocation over time. Whether you are building an investor pitch deck, conducting a quarterly business review, or presenting academic research data, this adaptive slide provides the perfect visual structure to highlight critical operational phases and keep stakeholders aligned.
Login to download this file

Item ID
SB03629
Related Templates

Circle Chart Data template for PowerPoint & Google Slides
Pie/Donut
Creative Data Analysis Bar Chart template for PowerPoint & Google Slides
Bar/Column
3D Bar Chart Data Infographics Template for PowerPoint & Google Slides
Bar/Column
Pencil Bar Chart Data Analysis Template for PowerPoint & Google Slides
Bar/Column
Data Bar Chart Template for PowerPoint and Keynote
Bar/Column

Data-Driven Line Chart Diagram Template for PowerPoint
Comparison Chart
Clustered Column Chart Data Analysis Template for PowerPoint
Bar/Column
Tornado Chart Data Comparison Slide Template for PowerPoint & Google Slides
Bar/Column
Donut Chart Data Breakdown template for PowerPoint & Google Slides
Pie/Donut
Waffle Chart Data Visualization Template for PowerPoint & Google Slides
Comparison Chart
Free Stacked Column Chart Data Visualization Template for PowerPoint & Google Slides
Bar/Column
Free
Simple Bar Chart Data Visualization Template for PowerPoint & Google Slides
Bar/Column
Simple Area Chart Data Trends Analysis Template for PowerPoint & Google Slides
Comparison Chart
Waterfall Chart Data Visualization Template for PowerPoint & Google Slides
Comparison Chart
Multipurpose Spline Chart Data Trend Template for PowerPoint & Google Slides
Bar/Column
Interactive Jump Line Data Chart Template for PowerPoint & Google Slides
Comparison Chart
Segmented Scatter Chart Data Visualization Template for PowerPoint & Google Slides
Business Strategy
Data Analysis Bar Chart with Insights Template for PowerPoint & Google Slides
Bar/Column
Free
Weekly Data Chart Slide for PowerPoint & Google Slides
Comparison Chart

3D Column Chart with Data Table for PowerPoint & Google Slides
Bar/Column


