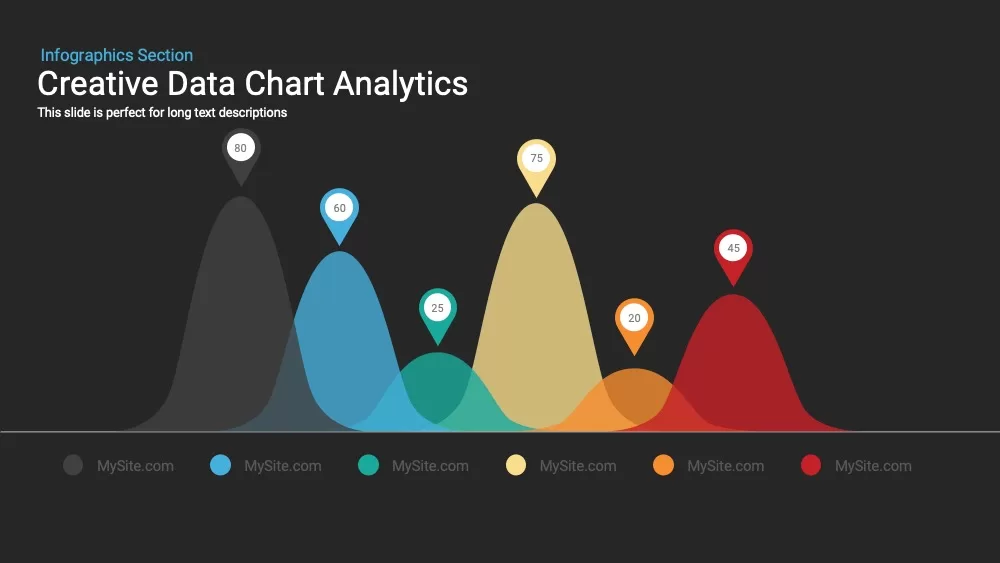
Creative data chart Analytics Presentation Template


If you work with data regularly, you already know how difficult it can be to turn numbers into a story that your audience actually understands. The Creative Data Chart Analytics template solves that problem directly. It is fully editable in PowerPoint and Google Slides, easy to customize, and built for anyone who needs to present data clearly without spending hours on design. Whether you are a business analyst, a researcher, or a team lead, this template gives you a professional starting point that is ready to use in minutes.
- Business presentations
- Academic reports
- Team meetings
Think of this template as your data presentation toolkit. The layered chart style lets you display multiple data points side by side, so your audience can spot trends, compare results, and draw conclusions without needing you to explain every detail. Color updates, label edits, and layout adjustments all happen quickly, meaning you spend less time formatting and more time focusing on the insights that matter. Every element is pre-aligned and visually balanced so your slides always look intentional and polished.
Where does this template work best? In business presentations, it helps teams make faster, better-informed decisions by putting key metrics front and center. In academic settings, it gives researchers and students a clean, credible format for displaying findings. In team meetings, it cuts through confusion by replacing dense spreadsheets with visuals that everyone in the room can follow immediately.
Data should speak for itself, and this template makes sure it does. You can also explore data visualization PowerPoint templates to find more designs suited to different analytics formats. For consistent styling across your full deck, browse business PowerPoint templates to match your reporting needs. Download this template today and make every data presentation clearer, faster, and more convincing.
Login to download this file

Item ID
SB00012
Related Templates

Data Analytics Dashboard Design template for PowerPoint & Google Slides
Bar/Column

Free Project Dashboard PowerPoint Template
Charts
Free
Data Management and Analytics Diagram Template for PowerPoint & Google Slides
Circular
Creative Data Analysis Bar Chart template for PowerPoint & Google Slides
Bar/Column

Product Usage Analytics Dashboard Chart Template for PowerPoint & Google Slides
Bar/Column

Dynamic Marketing Radar Chart Analytics Template for PowerPoint & Google Slides
Comparison
Digital Marketing Templates
Digital Marketing
Creative Lab Beakers Data Infographic template for PowerPoint & Google Slides
Infographics
Multi-Series Curved Line Graph Analytics Template for PowerPoint & Google Slides
Comparison Chart
E-commerce Analytics Dashboard Template for PowerPoint & Google Slides
Bar/Column
Business Dashboard Analytics & KPIs Template for PowerPoint & Google Slides
Bar/Column
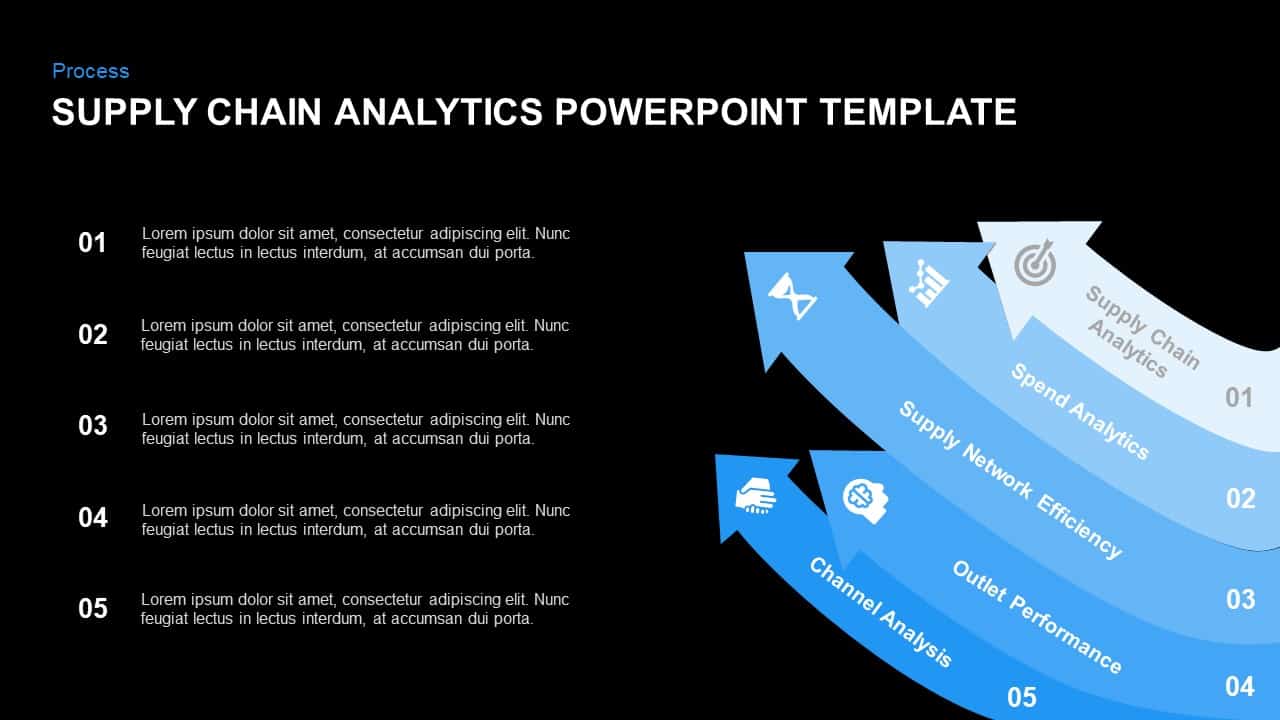
Supply Chain Analytics Process Template for PowerPoint & Google Slides
Process
Social Media Analytics PowerPoint Template
Digital Marketing
Free Tiktok PowerPoint Template
Company Profile
Free
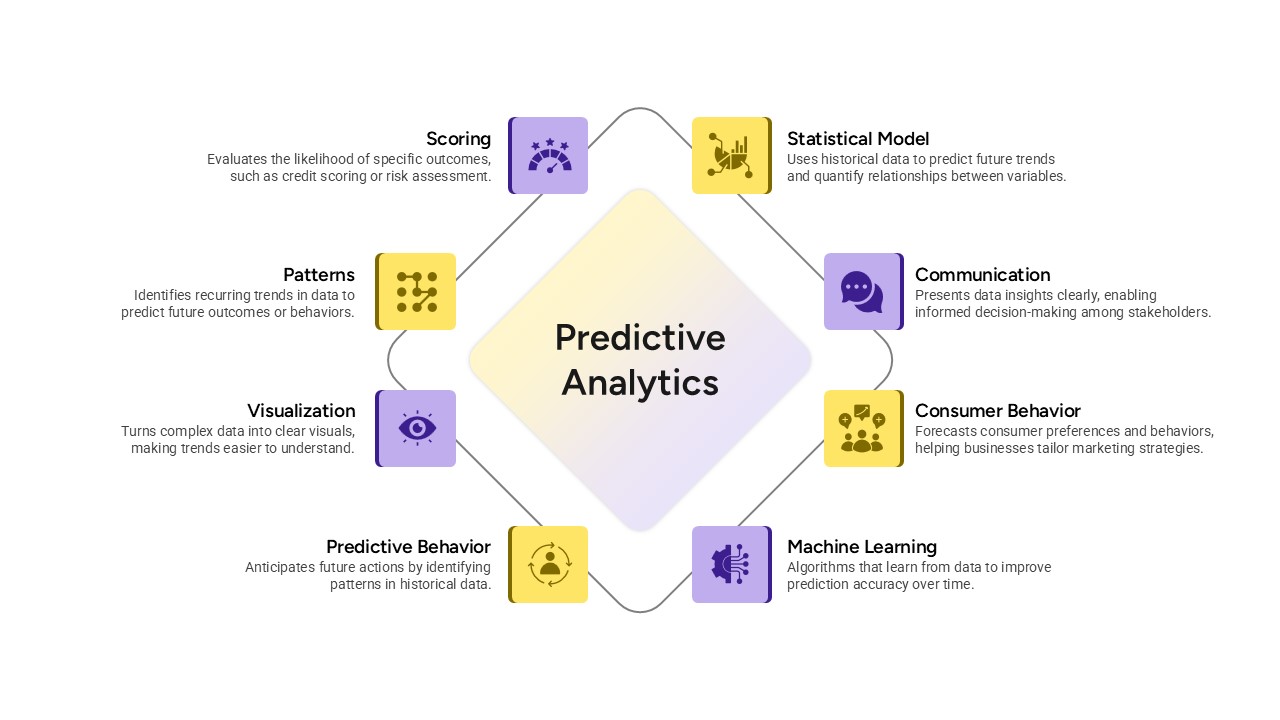
Predictive Analytics Diagram Template for PowerPoint & Google Slides
Process
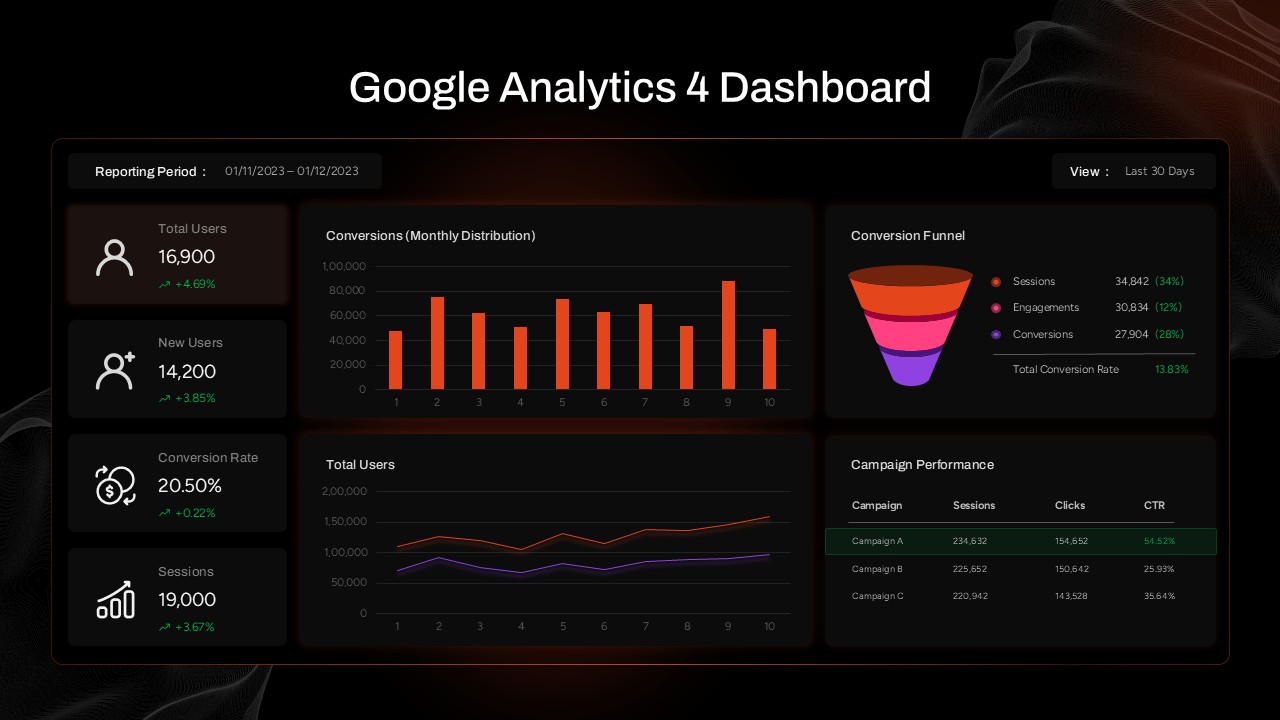
Google Analytics 4 (GA4) Dashboard Template for PowerPoint & Google Slides
Digital Marketing
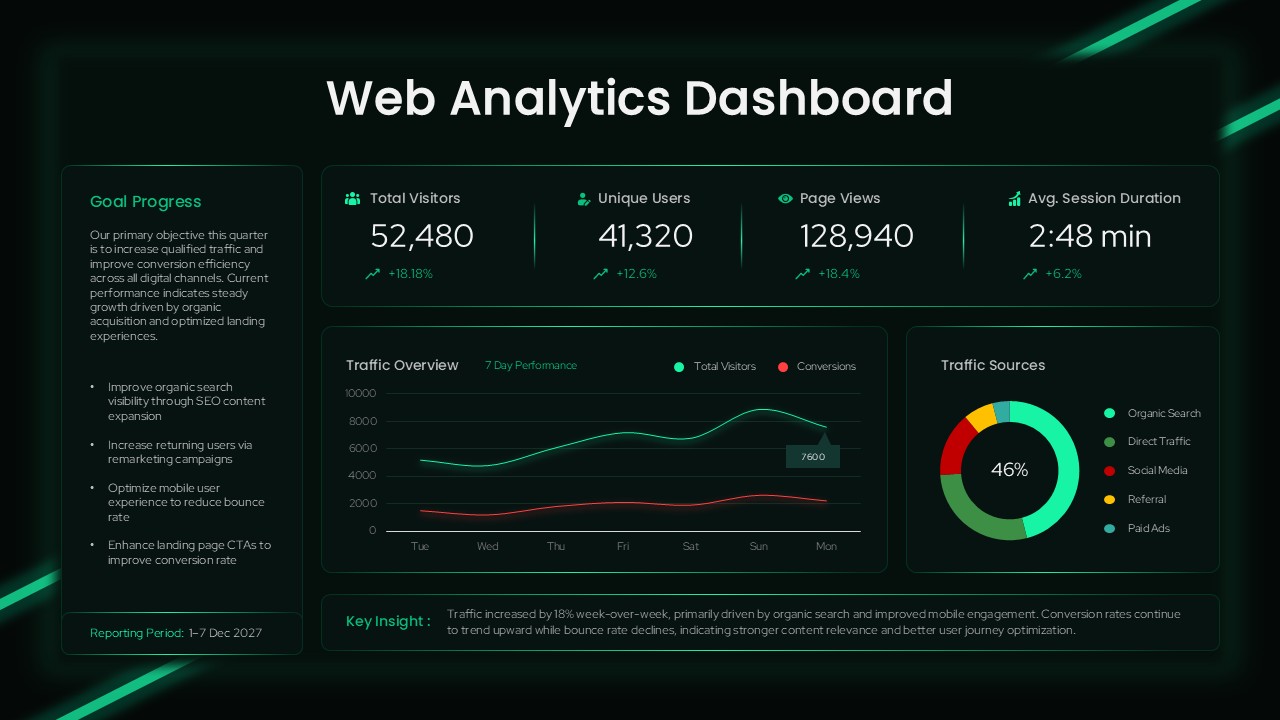
Web Analytics Dashboard Template for PowerPoint & Google Slides Presentations
Business
Free Facebook Presentation Template PowerPoint & Google Slides
Customer Experience
Free
Creative Smartphone Feature PowerPoint Template
Charts
Circle Chart Data template for PowerPoint & Google Slides
Pie/Donut
3D Bar Chart Data Infographics Template for PowerPoint & Google Slides
Bar/Column
Pencil Bar Chart Data Analysis Template for PowerPoint & Google Slides
Bar/Column
3D Cone Chart Data Visualization template for PowerPoint & Google Slides
Bar/Column
Data-Driven Line Chart Diagram Template for PowerPoint
Comparison Chart
Clustered Column Chart Data Analysis Template for PowerPoint
Bar/Column
Tornado Chart Data Comparison Slide Template for PowerPoint & Google Slides
Bar/Column
Donut Chart Data Breakdown template for PowerPoint & Google Slides
Pie/Donut
Waffle Chart Data Visualization Template for PowerPoint & Google Slides
Comparison Chart
Free Stacked Column Chart Data Visualization Template for PowerPoint & Google Slides
Bar/Column
Free
Simple Bar Chart Data Visualization Template for PowerPoint & Google Slides
Bar/Column
X Y Bubble Chart PowerPoint Template
Comparison Chart
Simple Area Chart Data Trends Analysis Template for PowerPoint & Google Slides
Comparison Chart
Data Over Timeline Chart Template for PowerPoint
Charts
Waterfall Chart Data Visualization Template for PowerPoint & Google Slides
Comparison Chart
Multipurpose Spline Chart Data Trend Template for PowerPoint & Google Slides
Bar/Column
Interactive Jump Line Data Chart Template for PowerPoint & Google Slides
Comparison Chart
Segmented Scatter Chart Data Visualization Template for PowerPoint & Google Slides
Business Strategy
Data Analysis Bar Chart with Insights Template for PowerPoint & Google Slides
Bar/Column
Free
Data Bar Chart Template for PowerPoint and Keynote
Bar/Column
Weekly Data Chart Slide for PowerPoint & Google Slides
Comparison Chart

3D Column Chart with Data Table for PowerPoint & Google Slides
Bar/Column

Cone Data Chart for PowerPoint & Google Slides
Charts
Creative SWOT Chart template for PowerPoint & Google Slides
SWOT
Creative Dynamic Gantt Chart Timeline Template for PowerPoint & Google Slides
Timeline
Creative Bar Chart template for PowerPoint & Google Slides
Charts
Creative Organization Chart Diagram Template for PowerPoint & Google Slides
Org Chart
Creative Organizational Chart Template for PowerPoint & Google Slides
Org Chart
Circle Strategy Creative Chart for PowerPoint
Business Strategy
Data Science PowerPoint Template
Pitch Deck
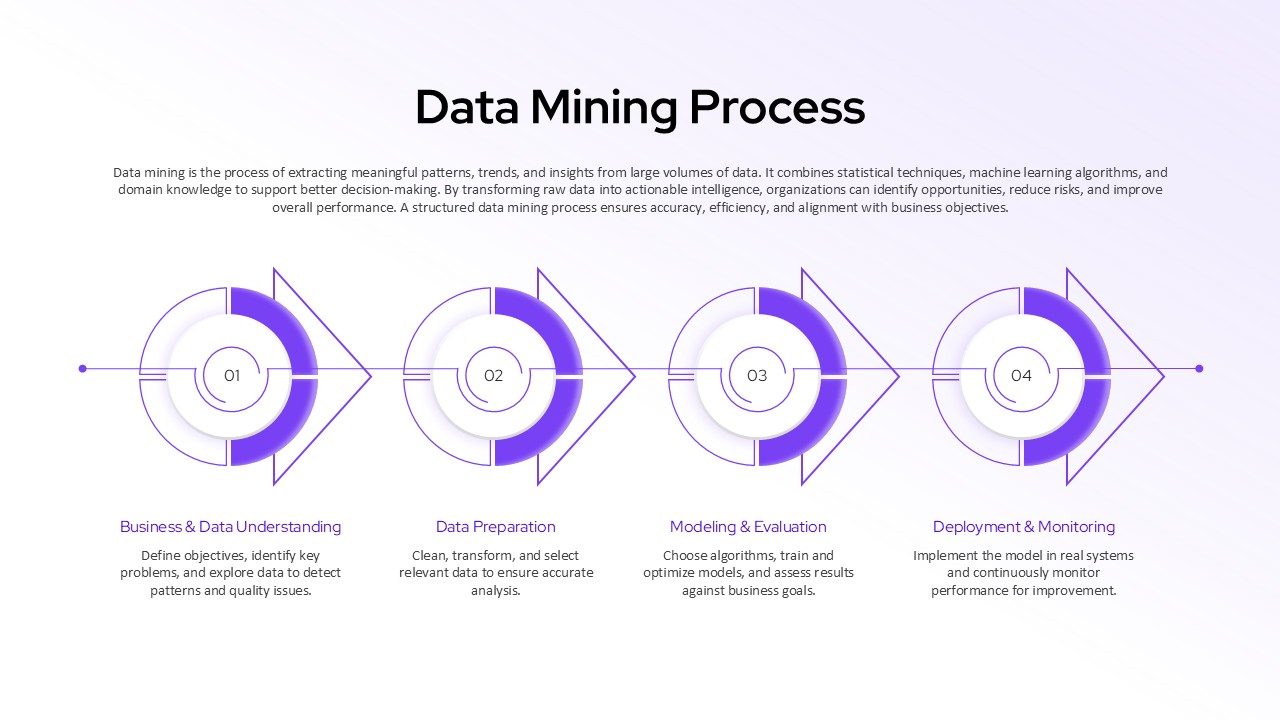
Data Mining Process Diagram Template for PowerPoint & Google Slides Presentation
Manufacturing
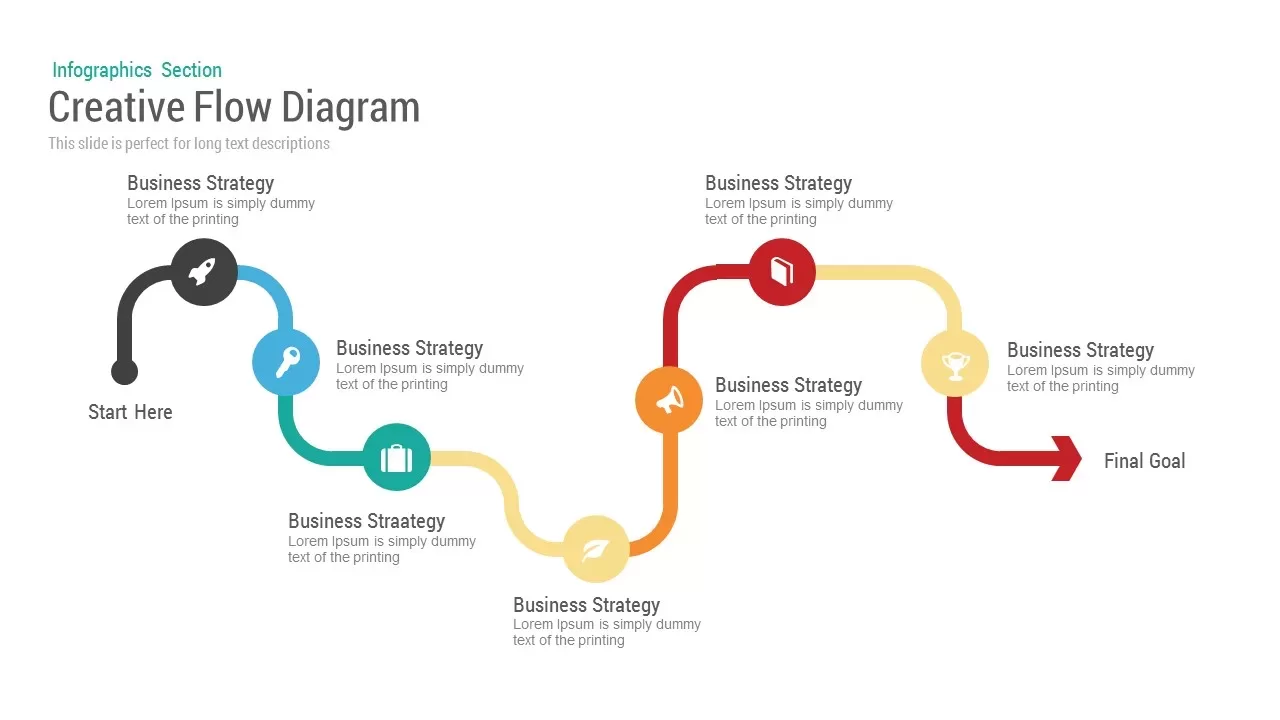
Creative Flow Diagram Presentation Template
Process

PIXELS – Free Creative Presentation Template for PowerPoint & Google Slides
Pitch Deck
Free
Pop Art PowerPoint Template
Decks

Creative Portfolio Showcase Presentation Template for PowerPoint & Google Slides
Decks
Memphis Style Creative Presentation Template for PowerPoint & Google Slides
Pitch Deck
Creative Books Theme Presentation Template for PowerPoint & Google Slides
Pitch Deck
Colorful Creative Presentation Deck Template for PowerPoint & Google Slides
Company Profile
Creative Clothing Line Presentation Template for PowerPoint & Google Slides
Pitch Deck
Creative Meet Our Team Presentation Slide for PowerPoint & Google Slides
Our Team
World Map Data template for PowerPoint & Google Slides
World Maps
Smartphone User Data PowerPoint Template
Charts
Interactive US Population Data Map Slide Template for PowerPoint & Google Slides
World Maps
Circle Graph Data Visualization Template for PowerPoint & Google Slides
Circular
Gear Pie Diagram Data Visualization Template for PowerPoint & Google Slides
Pie/Donut
Data-Driven Marketing Cycle Diagram Template for PowerPoint & Google Slides
Customer Journey
Leaf Infographic Data Visualization Template for PowerPoint & Google Slides
Infographics
Mobile Infographics Data Visualization Template for PowerPoint & Google Slides
Infographics
Medical infographics PowerPoint Templates
Health
DIKW Data to Wisdom Pyramid Model Template for PowerPoint & Google Slides
Pyramid
Data-driven GDP Growth Infographic Pack Template for PowerPoint & Google Slides
Infographics
KPI Dashboard Data Visualization Template for PowerPoint & Google Slides
Bar/Column
KPI Dashboard Data Overview Slide Template for PowerPoint & Google Slides
Bar/Column
North American Map
World Maps

Modern Big Data Infographic Deck Template for PowerPoint & Google Slides
Decks
Layered Data Governance Maturity Model Template for PowerPoint & Google Slides
Process
Editable Africa Map Infographic Data Template for PowerPoint & Google Slides
World Maps
UK Counties Map Data Visualization Template for PowerPoint & Google Slides
World Maps
Advanced Data Flow Diagram Pack Template for PowerPoint & Google Slides
Flow Charts
Free Big Data Network Visualization Template for PowerPoint & Google Slides
Circular
Free
Syria Regional Data Map Infographic Template for PowerPoint & Google Slides
World Maps
Data Lake Hub-and-Spoke Diagram Template for PowerPoint & Google Slides
Cloud Computing
ETL Data Pipeline Workflow Diagram Template for PowerPoint & Google Slides
Process
Data Center PowerPoint Template for PowerPoint & Google Slides
Information Technology
Data Privacy template for PowerPoint & Google Slides
Information Technology
Data Protection PowerPoint Template
Information Technology
Comprehensive Data & AI Capability Model Template for PowerPoint & Google Slides
AI
Data Privacy and Compliance in ML template for PowerPoint & Google Slides
Technology
Data-Driven AI in Insurance Infographic Template for PowerPoint & Google Slides
Circular
AI and Data Ecosystem Map Template for PowerPoint & Google Slides
AI
Data Protection & Encryption in the Cloud Overview template for PowerPoint & Google Slides
Cloud Computing
Customer Data Platform Workflow Diagram Template for PowerPoint & Google Slides
Information Technology
Data-Driven Marketing Lifecycle Diagram Template for PowerPoint & Google Slides
Process
Data-Driven Decision Making overview template for PowerPoint & Google Slides
Business
First Party Data Overview Template for PowerPoint & Google Slides
Business
Business Data Table Template for PowerPoint & Google Slides
Table
Colorful Business Data Comparison Table Template for PowerPoint & Google Slides
Table
Six Column Data Table Template for PowerPoint & Google Slides
Table
Data Gap Analysis Template for PowerPoint & Google Slides
Business
Data-Driven Sales Strategy Diagram Template for PowerPoint & Google Slides
Marketing
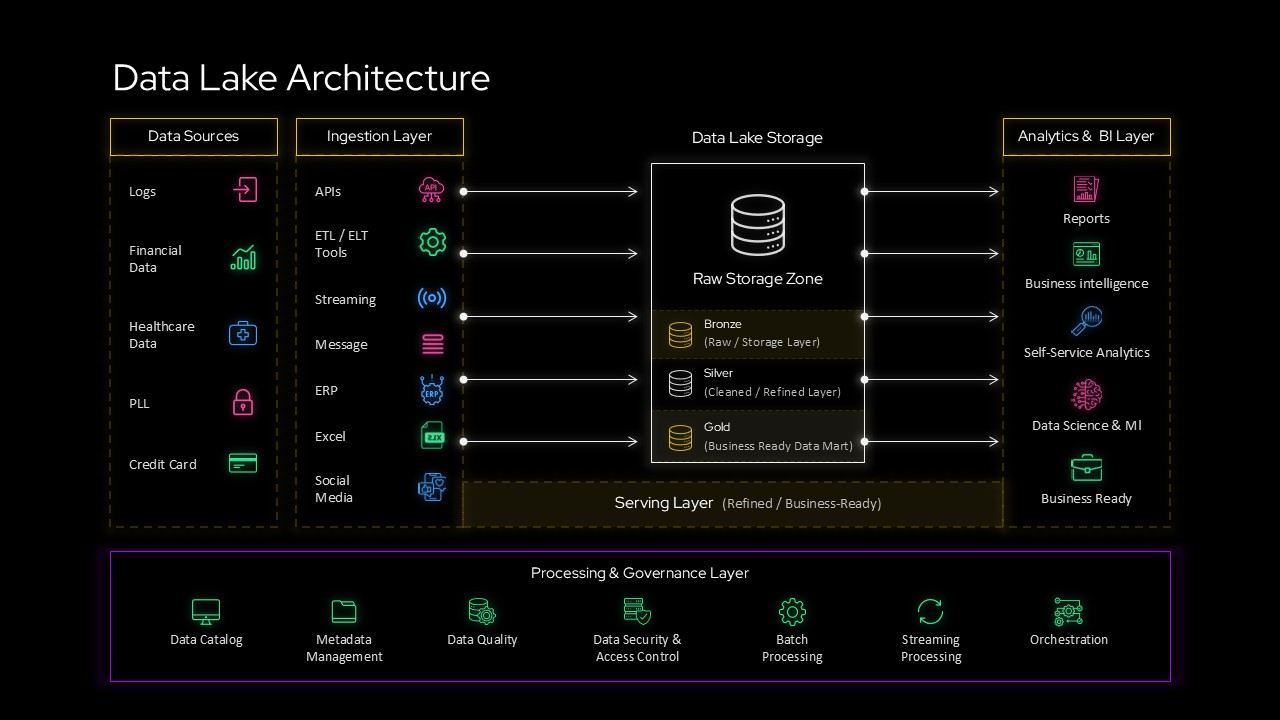
Data Lake Architecture Diagram Template for PowerPoint & Google Slides
Information Technology