Multi-Series Vertical Dot Chart Template for PowerPoint & Google Slides

Description
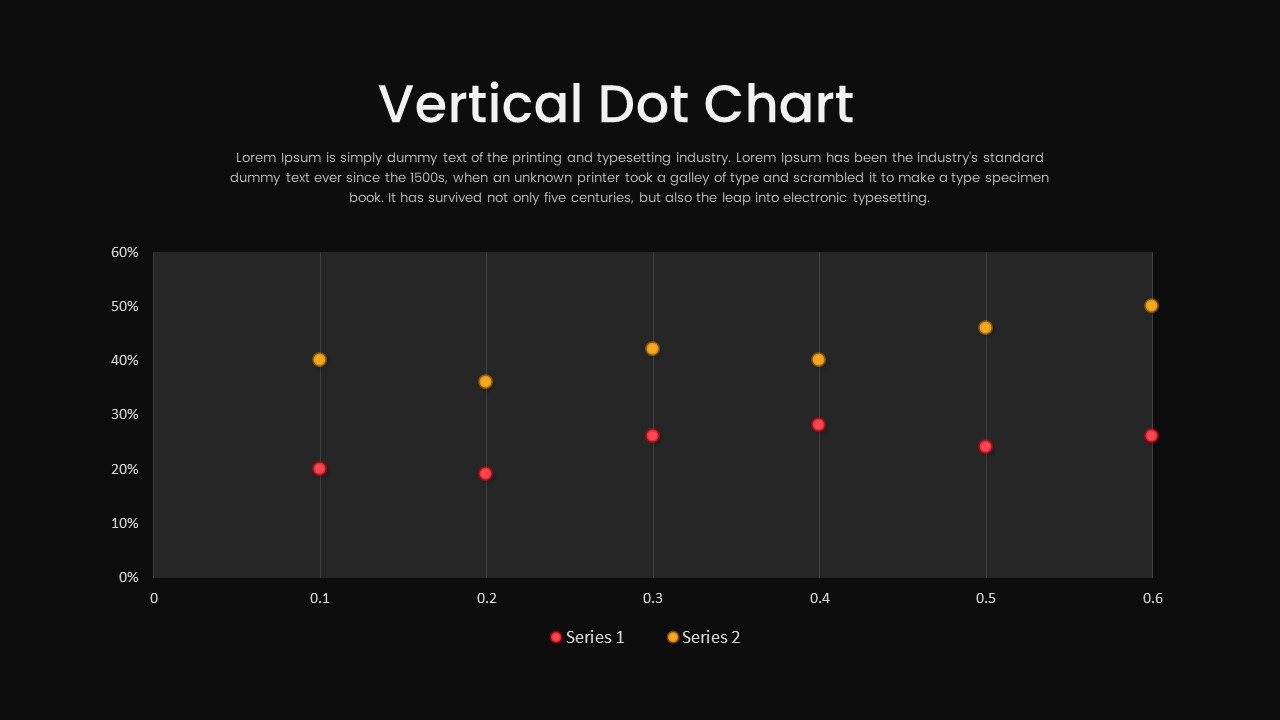
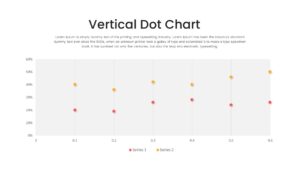
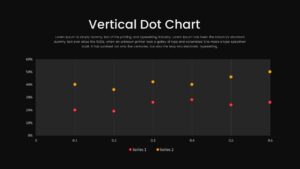
Present precise, side-by-side comparisons with this multi-series vertical dot chart slide. A clean white canvas features six evenly spaced vertical axes (0.1 to 0.6), each accented by subtle alternating gray bands to guide the eye. Two distinct data series—one in vibrant red and one in warm yellow—are plotted as circular markers along percentage values from 0% to 60%. A concise legend at the bottom clarifies series names, while a shaded top-right text box offers space for an executive summary or descriptive note.
Built on master slides, every element—from axis labels and gridlines to marker size and color—can be tailored in seconds. Swap axis scales, recolor data points, or adjust band shading to match your brand palette. Vector-based assets ensure crisp clarity on large screens or printed reports, and intuitive layer names simplify edits. Optional entrance animations can sequentially reveal each series or data point, drawing attention to key performance shifts.
Fully compatible with PowerPoint and Google Slides, this chart maintains pixel-perfect fidelity across devices and supports multiple aspect ratios. Right-to-left language support makes it ideal for global audiences. Whether you’re reporting quarterly KPIs, showcasing product comparisons, or illustrating survey results, this slide empowers you to communicate complex data with clarity and professionalism.
Who is it for
Financial analysts, marketing managers, and operations leads will find this slide invaluable for comparing performance metrics over time. Consultants, educators, and C-suite executives can also leverage its clear design to teach data literacy or highlight strategic insights.
Other Uses
Repurpose this layout for customer satisfaction scores, competitive benchmarking, sales funnel stage comparisons, or as a component in an executive dashboard. Simply swap marker colors, adjust axis labels, or replace the legend icons to fit any context.
Login to download this file

Item ID
SB03714
Related Templates

Multi-Series Stacked Bar Chart Template for PowerPoint & Google Slides
Bar/Column
Editable Multi-Series Peak Line Chart Template for PowerPoint & Google Slides
Comparison Chart
Multi-Series Line Chart with Icons Template for PowerPoint & Google Slides
Comparison Chart
Multi-Series Curved Line Graph Analytics Template for PowerPoint & Google Slides
Comparison Chart
Dynamic Three-Series Stacked Area Chart Template for PowerPoint & Google Slides
Comparison Chart
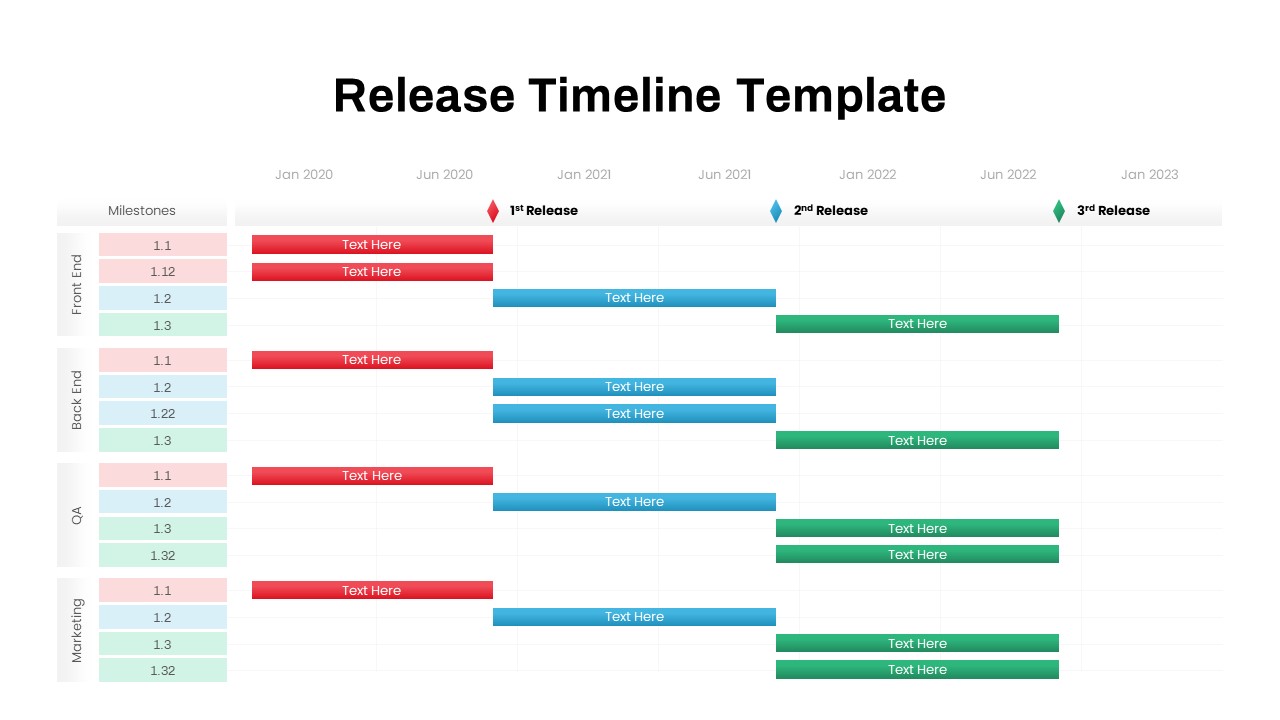
Multi-Team Multi-Phase Release Timeline Template for PowerPoint & Google Slides
Timeline
Fishbone Timeline Infographic Series Template for PowerPoint & Google Slides
Manufacturing
Colorful Polka Dot Background Theme Template for PowerPoint & Google Slides
Decks
Horizontal Multi-Level Hierarchy Chart template for PowerPoint & Google Slides
Org Chart
Free Circular Multi-Step Flow Chart Diagram Template for PowerPoint & Google Slides
Flow Charts
Free
Minimal Multi-Year Column Chart Template for PowerPoint & Google Slides
Bar/Column
Multi-Variation Thermometer Chart Template for PowerPoint & Google Slides
Bar/Column
Multi-Style Clock Chart Diagram Template for PowerPoint & Google Slides
Circular
Multi-Variation Circular Chart Diagram Template for PowerPoint & Google Slides
Circular
Modern Multi-Color Polar Chart Diagram Template for PowerPoint & Google Slides
Charts
Multi-Level Wheel Chart Diagram template for PowerPoint & Google Slides
Pie/Donut
Multi-Level Colorful Pyramid Chart Template for PowerPoint & Google Slides
Pyramid
Vertical Split Flow Chart Diagram Template for PowerPoint & Google Slides
Flow Charts
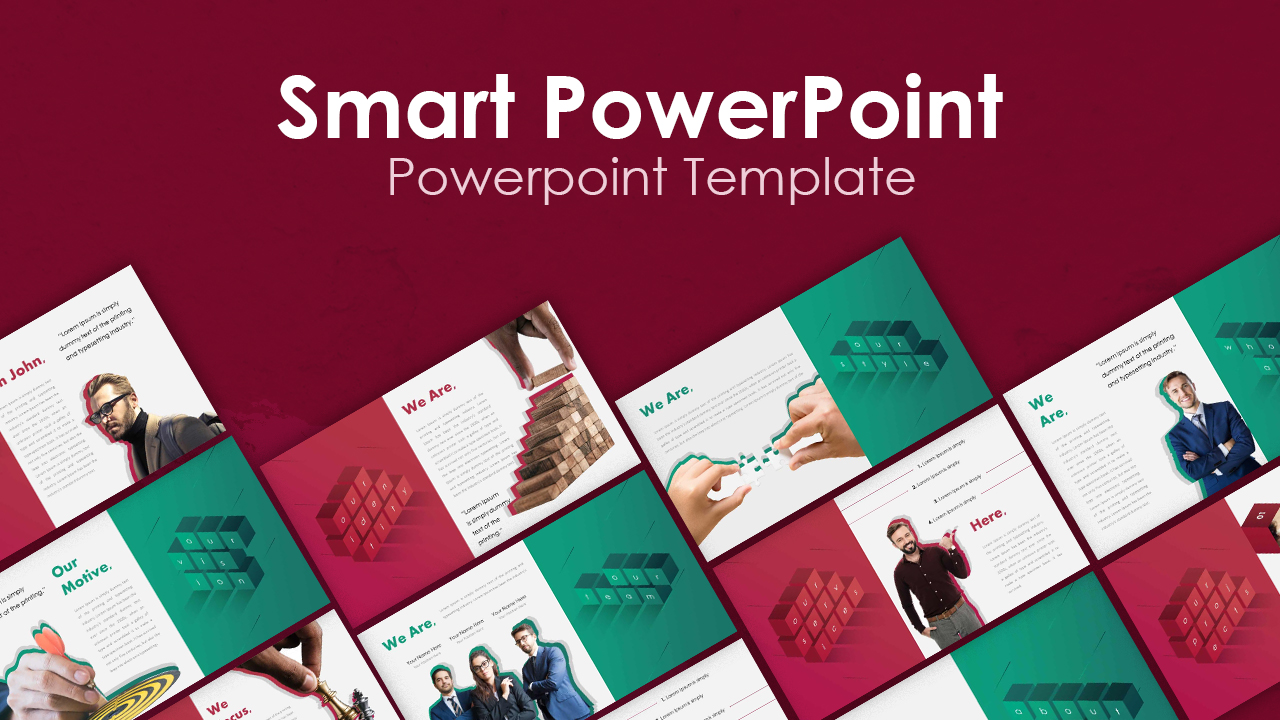
Smart Multi-Purpose PowerPoint Template for PowerPoint & Google Slides
Company Profile
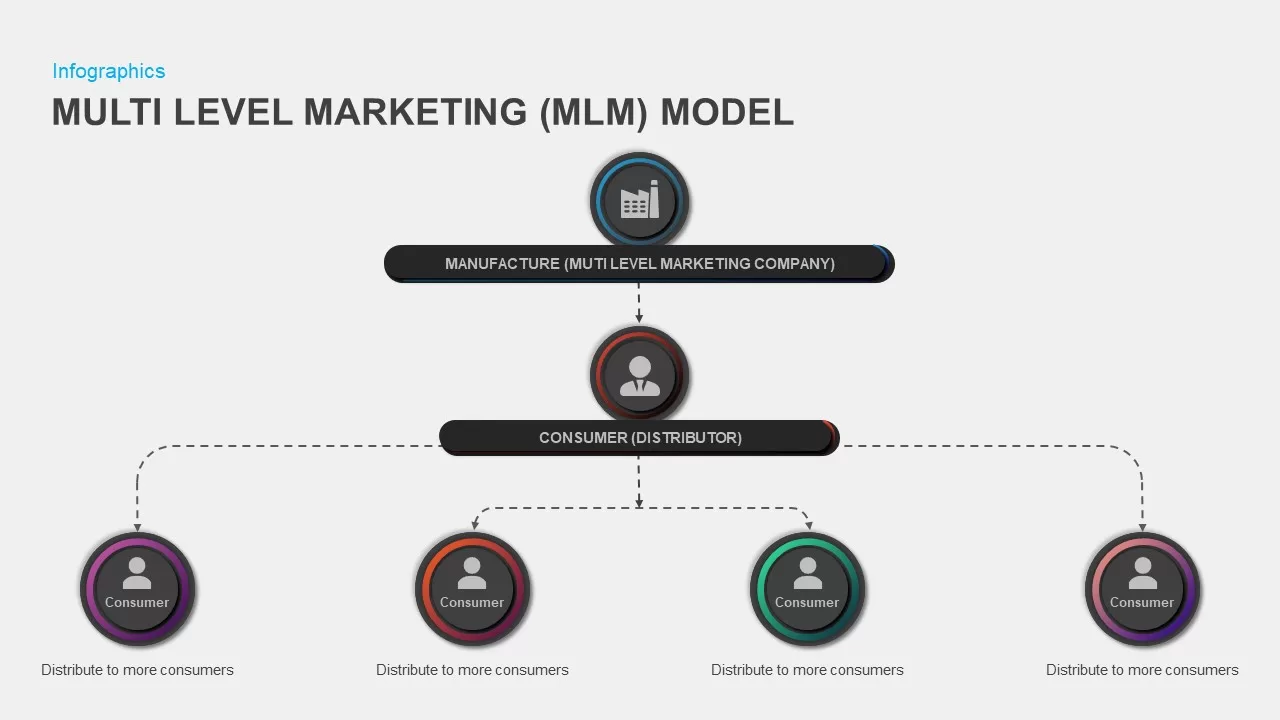
Multi-Level Marketing PowerPoint Template for PowerPoint & Google Slides
Business Models
Multi-Segment Circle Split Diagram template for PowerPoint & Google Slides
Circular

Simple Multi-Branch Mind Map Template for PowerPoint & Google Slides
Mind Maps
Multi-layout Circle Spoke Diagram Template for PowerPoint & Google Slides
Circular
Canada Provinces Map Multi-Layout Template for PowerPoint & Google Slides
World Maps
Multi-Stage Timeline Infographics Template for PowerPoint & Google Slides
Timeline
Modern Multi-Section Circle Diagram Template for PowerPoint & Google Slides
Circular
Multi-Organ Human Body Infographic Template for PowerPoint & Google Slides
Comparison
Multi-Color Eight-Step Ribbon Diagram Template for PowerPoint & Google Slides
Process
Multi-Style Presentation Agenda Template for PowerPoint & Google Slides
Agenda
Multi-Year Timeline Infographic Template for PowerPoint & Google Slides
Timeline

Multi-Cluster Mind Map Infographic Template for PowerPoint & Google Slides
Mind Maps
Multi-Style Project Life Cycle Diagram Template for PowerPoint & Google Slides
Process
Multi-Functional Presentation Template for PowerPoint & Google Slides
Pitch Deck
Multi-Purpose Corporate Infographic Template for PowerPoint & Google Slides
Company Profile
Free
Multi-Color Enneagram Circular Diagram Template for PowerPoint & Google Slides
Circular
Multi-Item Agenda Hub-and-Spoke Diagram Template for PowerPoint & Google Slides
Agenda
Doodle Multi Presentation Template for PowerPoint & Google Slides
Company Profile

Free Multi-Year Arrow Timeline Infographic Template for PowerPoint & Google Slides
Timeline
Free
Free Multi-Level Roadmap Infographic Template for PowerPoint & Google Slides
Roadmap
Free
Multi-Step Infographic Process Layout Template for PowerPoint & Google Slides
Process
Multi-Style Flow Infographic Slide template for PowerPoint & Google Slides
Process
Multi-Color Five-Step Curved Arrow Template for PowerPoint & Google Slides
Process
Automotive Infographic Multi-Layout Template for PowerPoint & Google Slides
Comparison
Animated Multi-Gear Cluster Infographic Template for PowerPoint & Google Slides
Process
January to December 12 Month Timeline PowerPoint Template
Timeline
Multi-Color Milestone Timeline Layout Template for PowerPoint & Google Slides
Timeline
Multi-Style Event Timeline Agenda Template for PowerPoint & Google Slides
Timeline
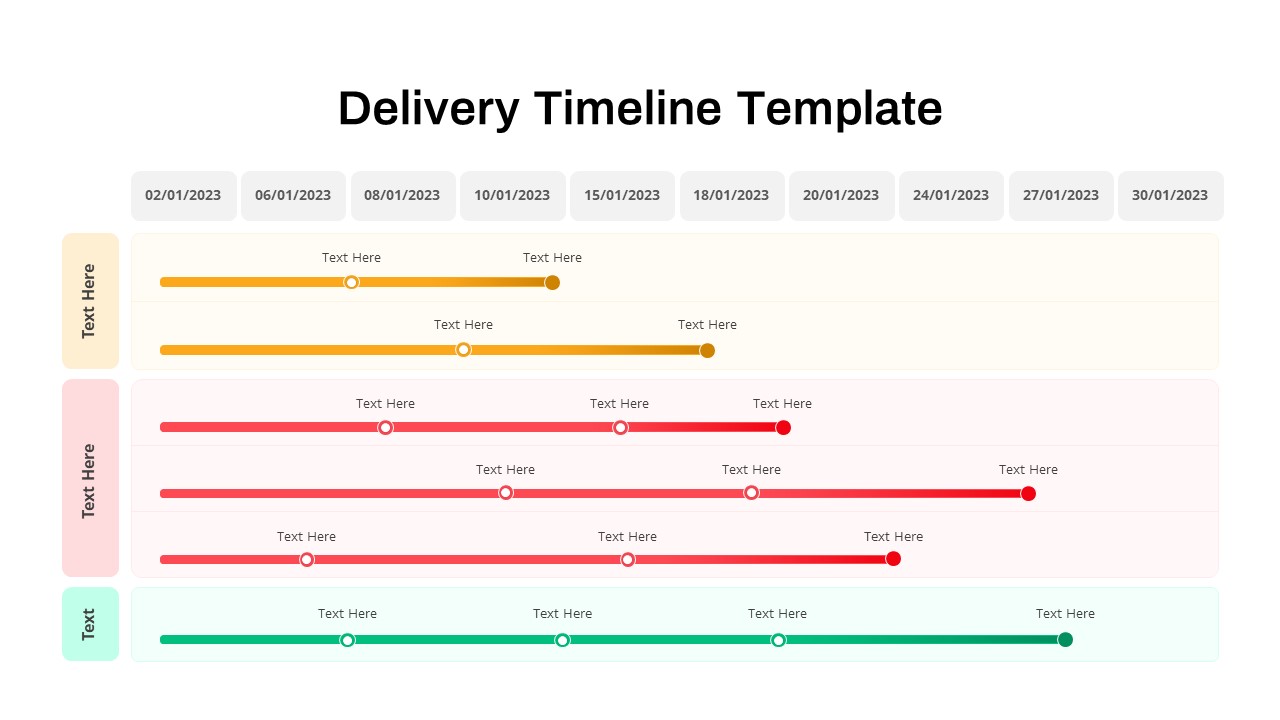
Delivery Timeline Multi-Row Template for PowerPoint & Google Slides
Timeline
Interactive Multi-Use Cost Comparison Template for PowerPoint & Google Slides
Comparison
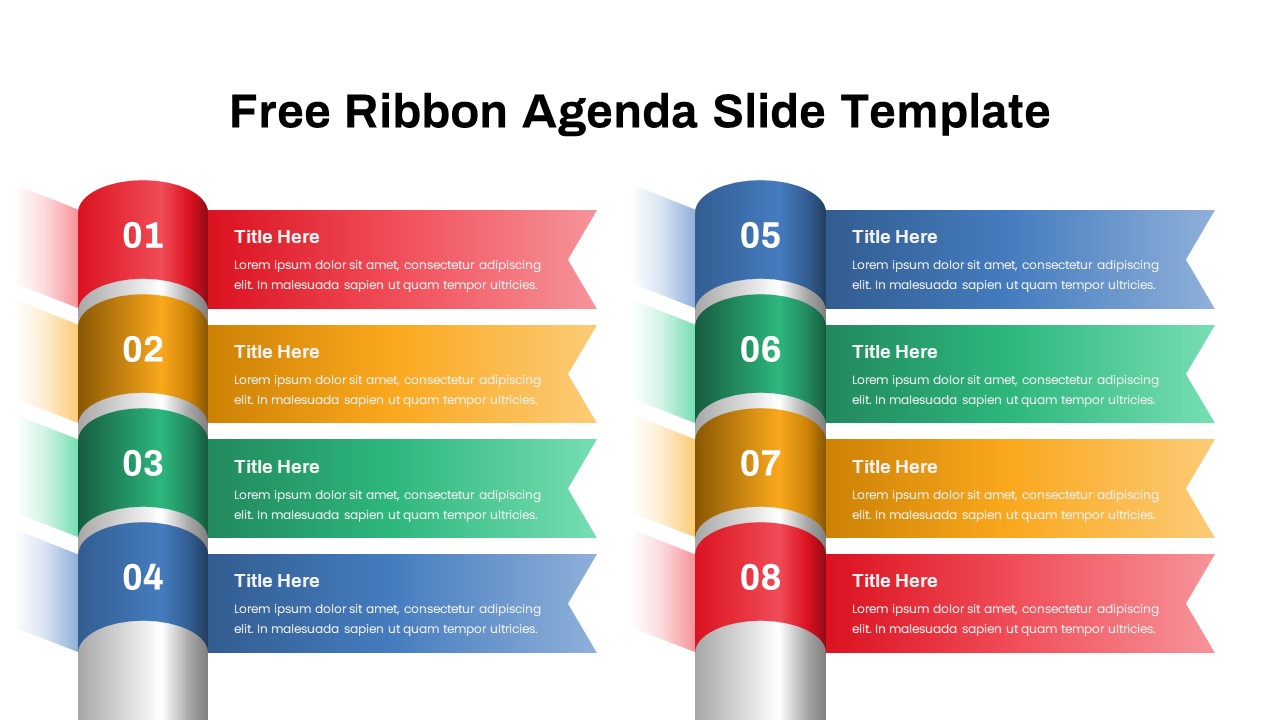
Free Editable Multi-Step Ribbon Agenda Slide Template for PowerPoint & Google Slides
Agenda
Free
Multi-Phase Research Roadmap Infographic Template for PowerPoint & Google Slides
Roadmap
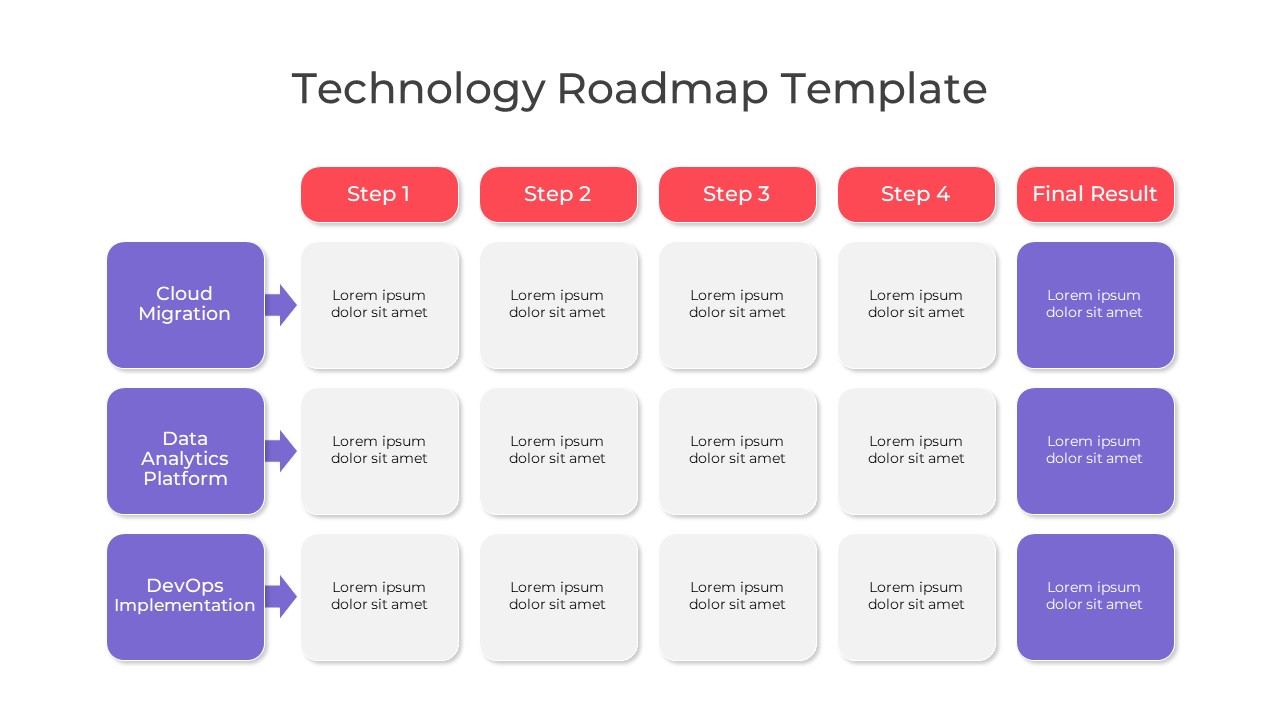
Multi-Color Technology Roadmap Template Pack for PowerPoint & Google Slides
Roadmap
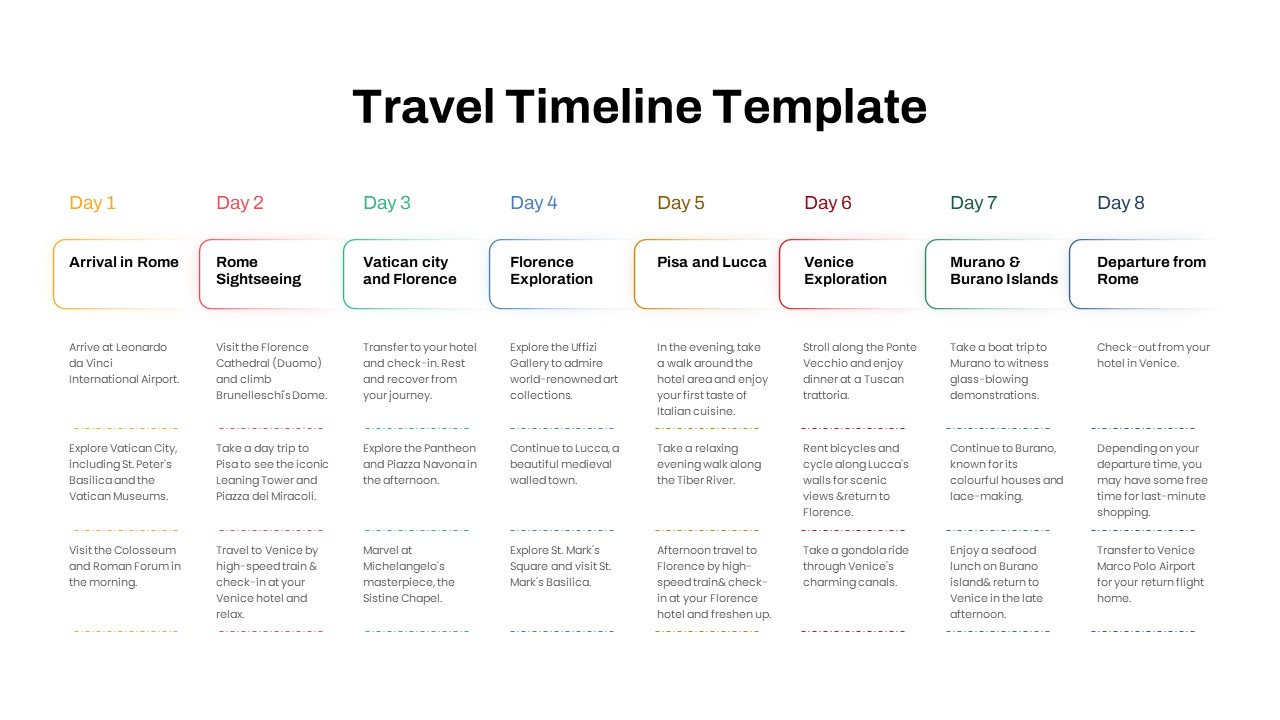
Free Elegant Multi-Day Travel Timeline Template for PowerPoint & Google Slides
Timeline
Free
Free Multi-Step Funnel Infographic Slide Pack Template for PowerPoint & Google Slides
Funnel
Free
Free Table Of Contents PowerPoint Slides Template
Agenda
Free
Colorful Multi-Branch Mind Map Slide Template for PowerPoint & Google Slides
Mind Maps
Multi-color Curved Timeline Roadmap Template for PowerPoint & Google Slides
Timeline
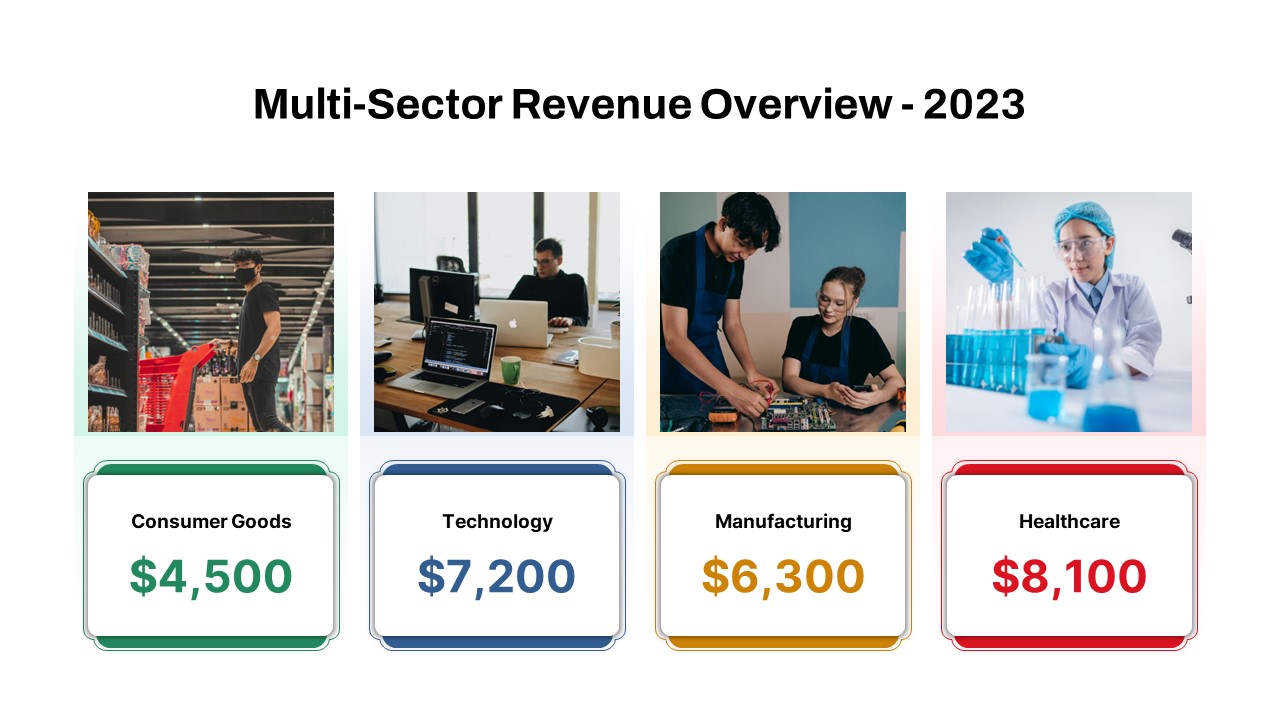
Multi-Sector Revenue Breakdown Cards Template for PowerPoint & Google Slides
Comparison
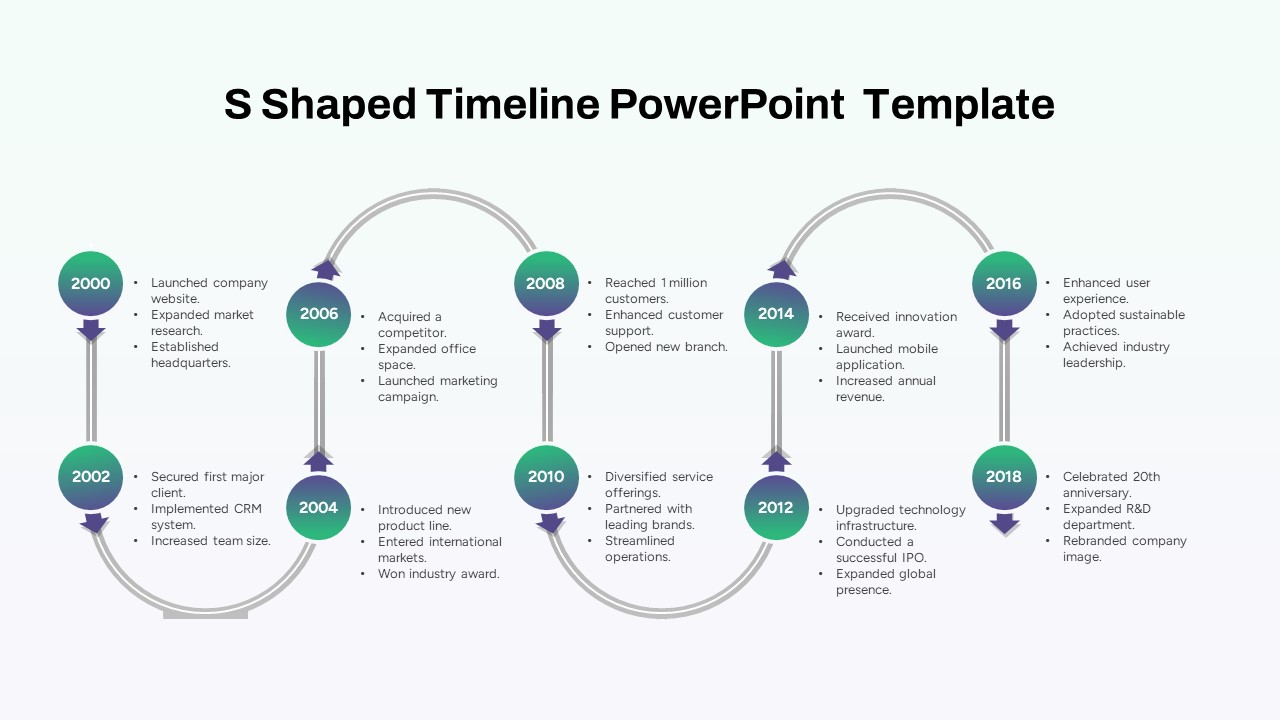
Multi-Year S-Shaped Roadmap Timeline Template for PowerPoint & Google Slides
Timeline
Multi-Style Board of Directors Profile Template for PowerPoint & Google Slides
Our Team
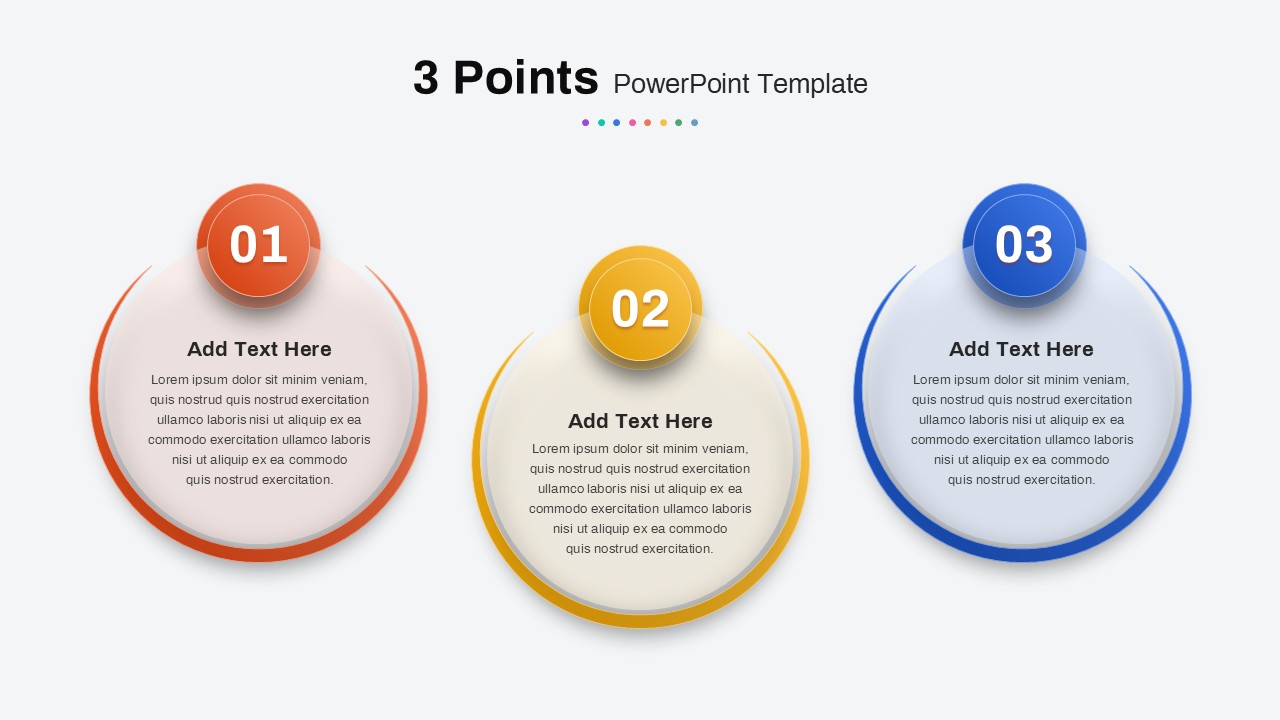
Multi-Point Diagram Presentation Template for PowerPoint & Google Slides
Process
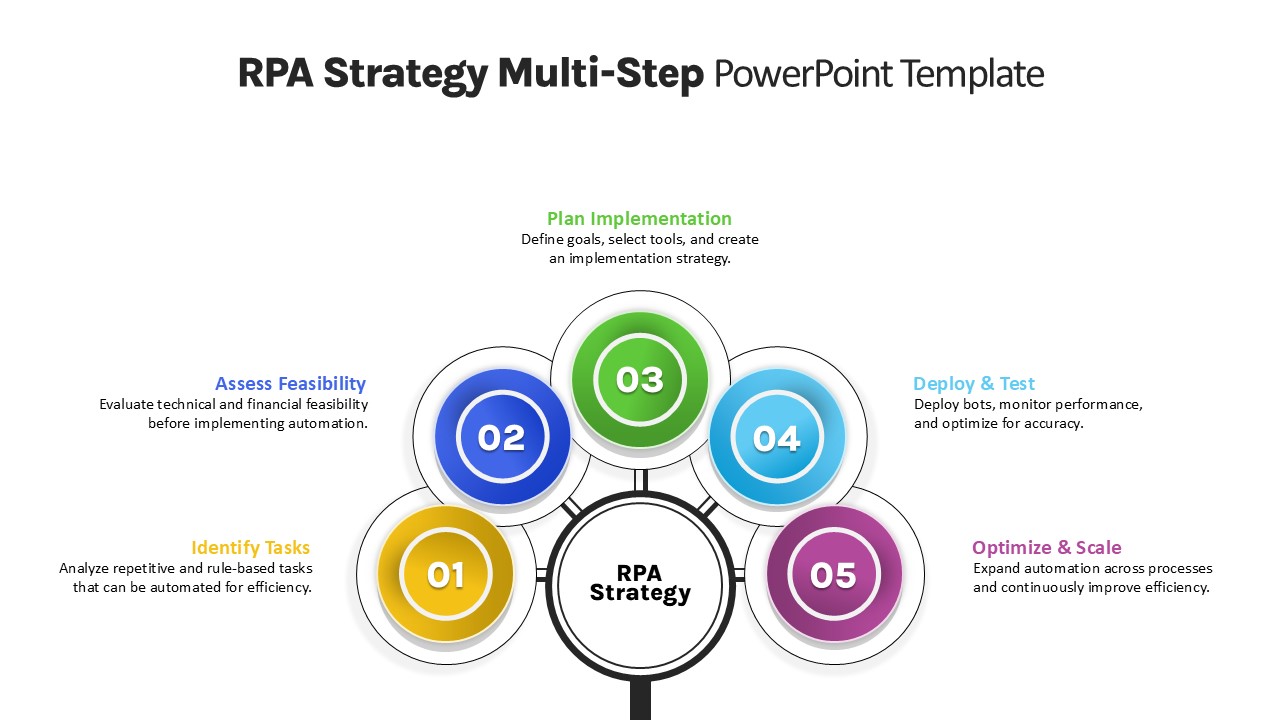
RPA Strategy Multi-Step Diagram Template for PowerPoint & Google Slides
Process
Animated Multi-Milestone Roadmap Template for PowerPoint & Google Slides
Roadmap
Multi-Column Table Presentation Template for PowerPoint & Google Slides
Table
Six-Row Multi-Column Table Presentation Template for PowerPoint & Google Slides
Table
Multi Color SWOT Analysis Quadrant Template for PowerPoint & Google Slides
SWOT
Vertical Business Process Flow Diagram Template for PowerPoint & Google Slides
Process
Vertical Timeline with Alternating Boxes Template for PowerPoint & Google Slides
Timeline
Seven-Step Vertical Sales Process Template for PowerPoint & Google Slides
Process
Six-Step Vertical Process Diagram Template for PowerPoint & Google Slides
Process
Vertical Stacked Process Infographic Template for PowerPoint & Google Slides
Process
Five-Stage Vertical Bar Process Template for PowerPoint & Google Slides
Process
Vertical Four-Step Process Infographic Template for PowerPoint & Google Slides
Process
Vertical Process Infographics Template for PowerPoint & Google Slides
Process
Five-Step Vertical Process Infographic Template for PowerPoint & Google Slides
Process
Vertical 4-Step Puzzle Process Diagram Template for PowerPoint & Google Slides
Process
Animated Vertical Timeline Template for PowerPoint & Google Slides
Timeline
Vertical 30-60-90 Business Plan Flow Template for PowerPoint & Google Slides
Timeline
Colorful Vertical SWOT Analysis Layout Template for PowerPoint & Google Slides
SWOT
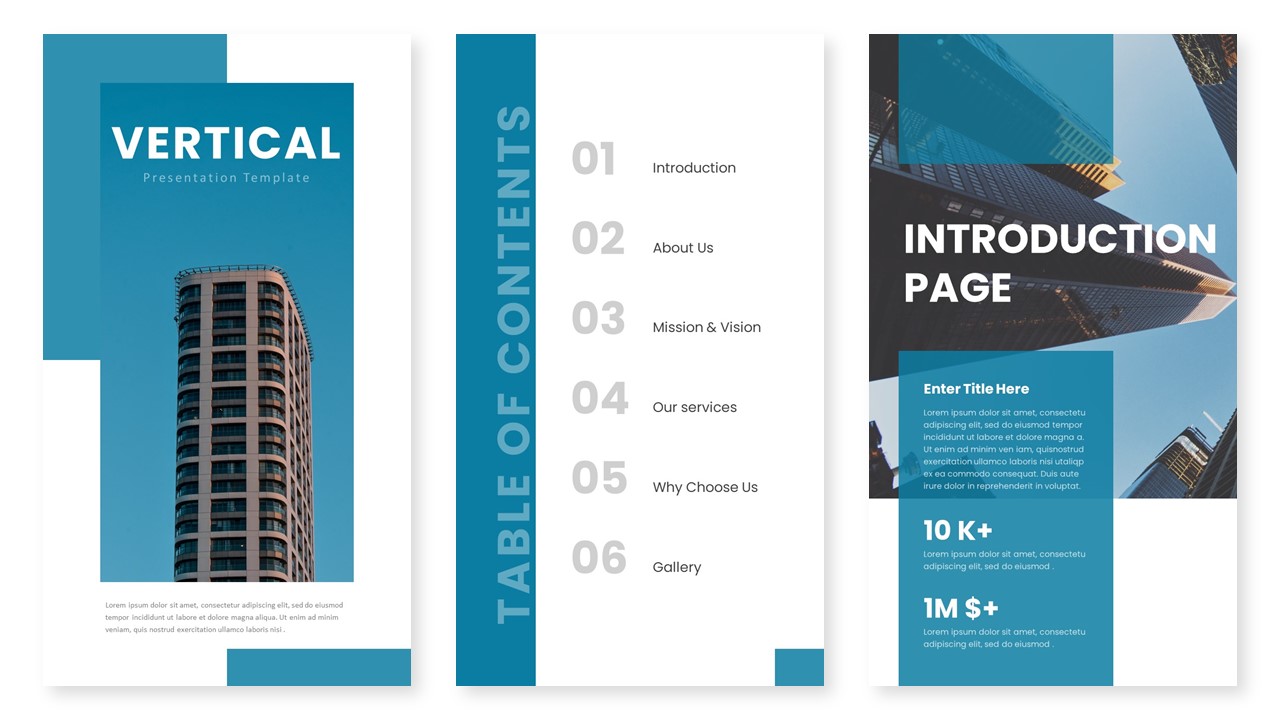
Vertical Presentation Template for PowerPoint & Google Slides
Business Models
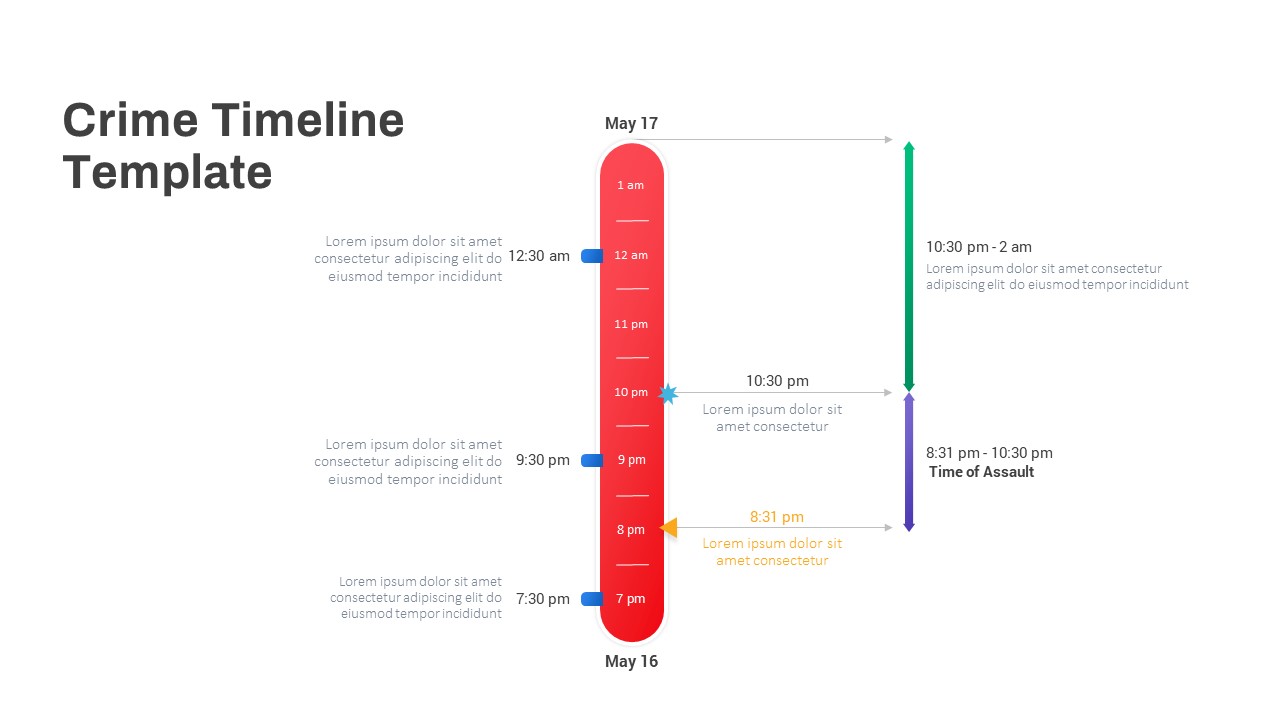
Vertical Crime Timeline Infographic Template for PowerPoint & Google Slides
Timeline
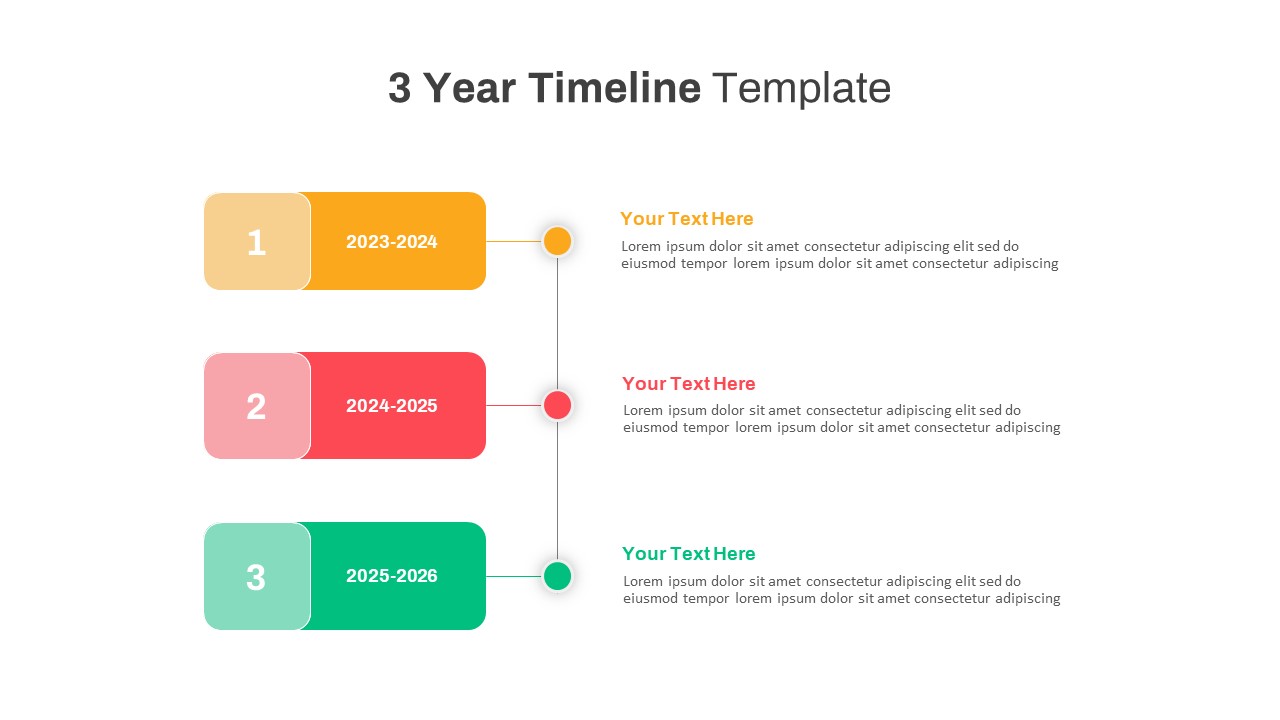
Three-Year Vertical Milestone Timeline Template for PowerPoint & Google Slides
Timeline
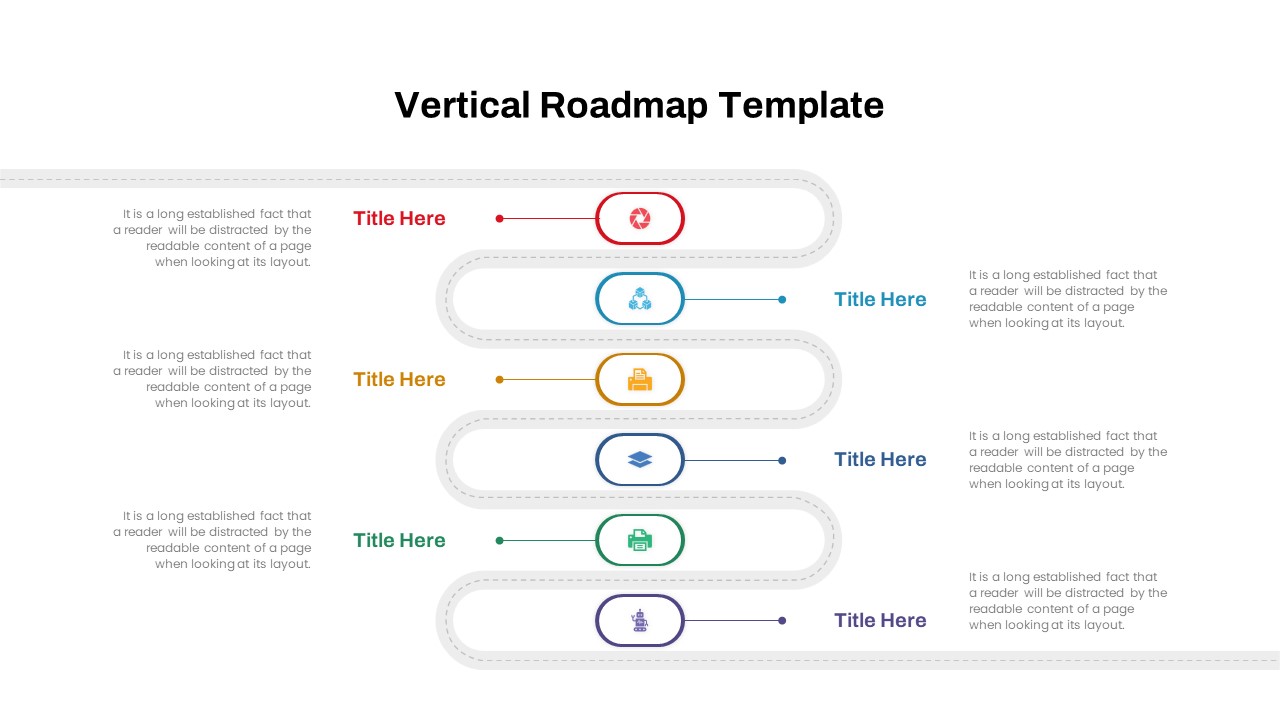
Vertical Roadmap Infographics Template for PowerPoint & Google Slides
Roadmap
Free Vertical Marketing Consultancy Presentation Template for PowerPoint & Google Slides
Company Profile
Free
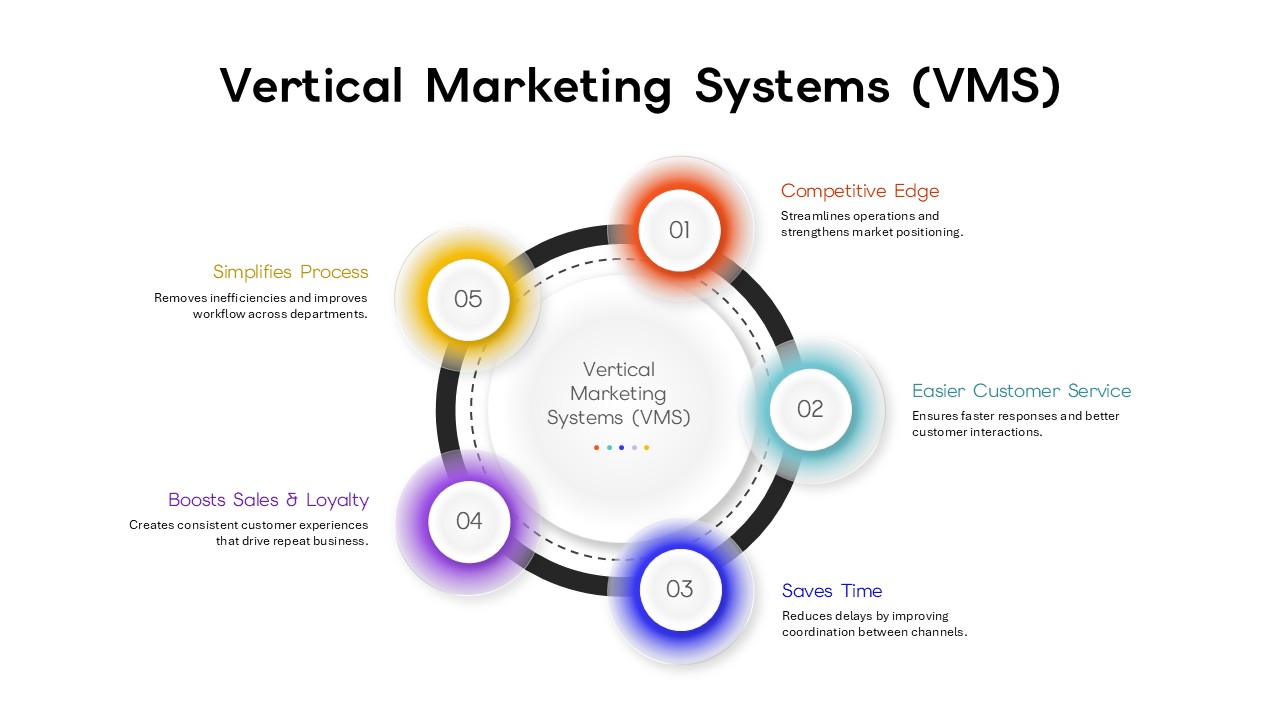
Vertical Marketing Systems (VMS) Circular Diagram Template for PowerPoint & Google Slides
Marketing
Five Staged Vertical Infographic Stacks for PowerPoint & Google Slides
Process
Quad Chart Infographic Pack of 8 Slides Template for PowerPoint & Google Slides
Comparison Chart
Free Professional Gantt Chart Pack – 4 Slides Template for PowerPoint & Google Slides
Gantt Chart
Free
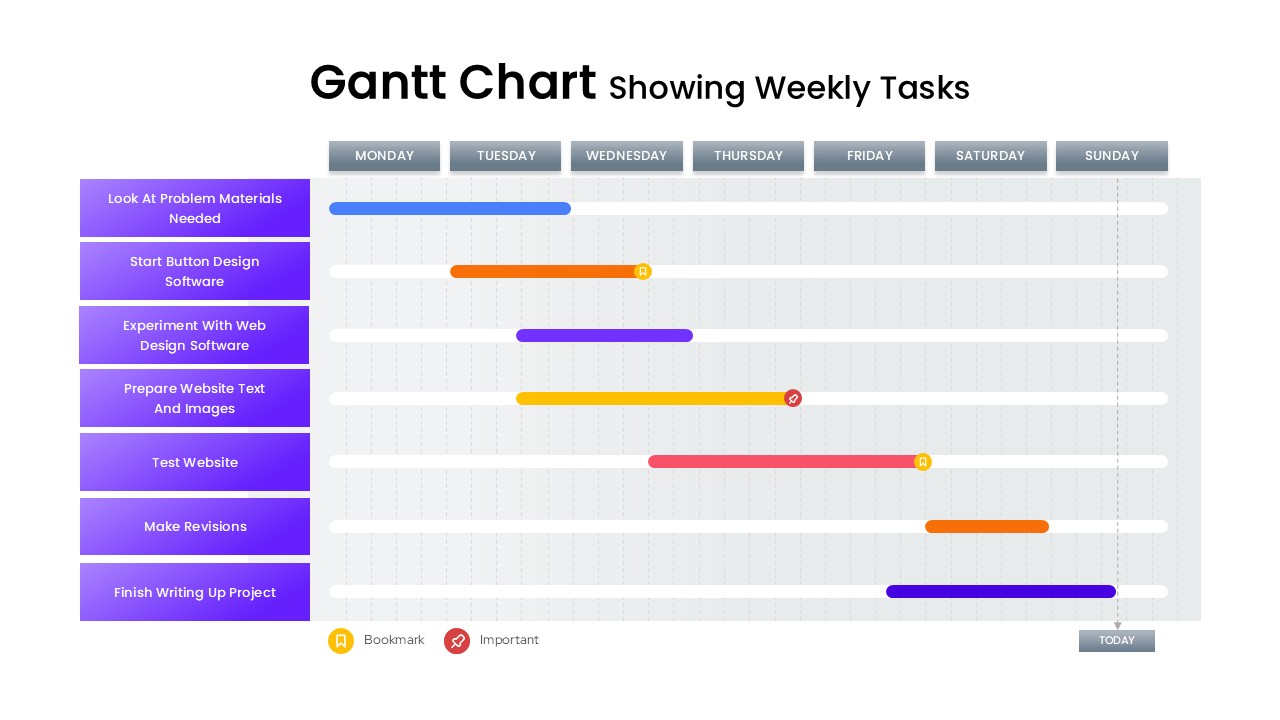
Gantt Chart Template Showing Weekly Tasks Template for PowerPoint & Google Slides
Gantt Chart
Mobile Data Analysis Chart template for PowerPoint & Google Slides
Charts
Business Four Square Chart template for PowerPoint & Google Slides
Business
Donut Chart template for PowerPoint & Google Slides
Pie/Donut
Comparison Bar Chart template for PowerPoint & Google Slides
Comparison Chart
Colorful Radial Bar Chart Template for PowerPoint & Google Slides
Bar/Column
File Structure Organization Chart Template for PowerPoint & Google Slides
Org Chart
Waffle Chart Data Visualization Template for PowerPoint & Google Slides
Comparison Chart
Waterfall Column Chart Analysis Template for PowerPoint & Google Slides
Bar/Column
Upside-Down Organizational Chart Diagram Template for PowerPoint & Google Slides
Org Chart
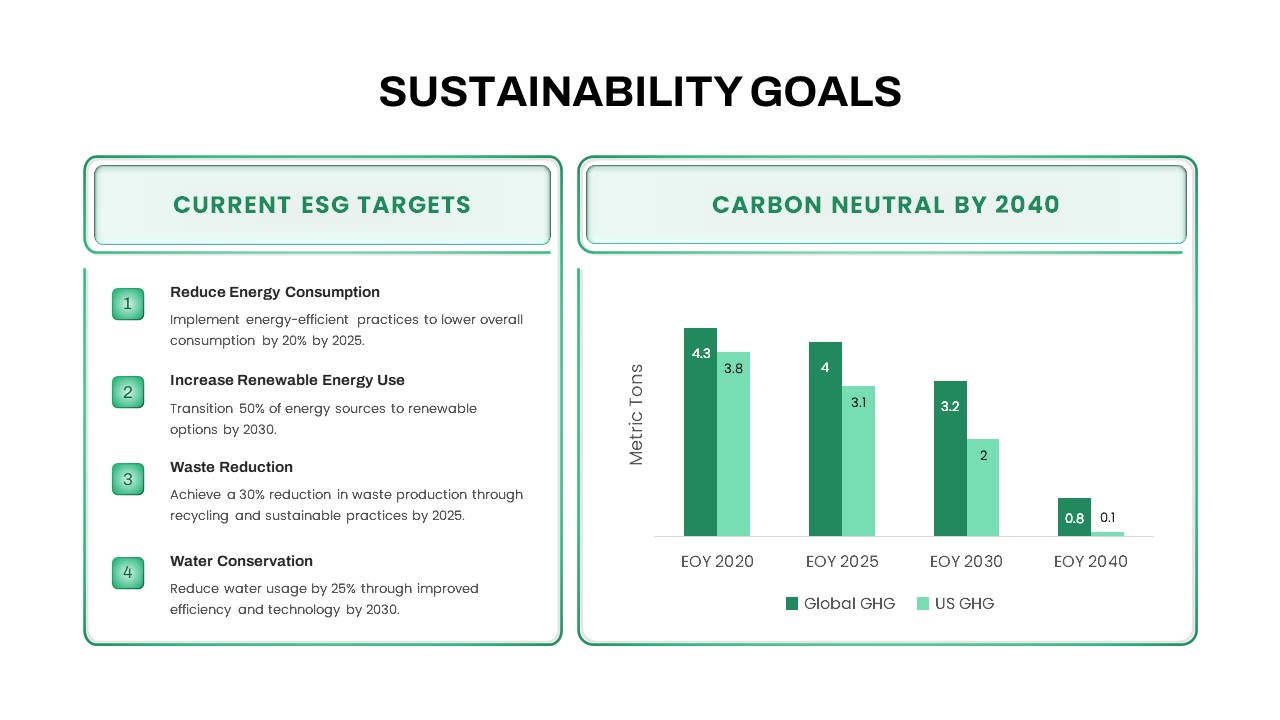
Sustainability Goals and Targets Chart Template for PowerPoint & Google Slides
Goals
Colorful Annual Gantt Chart Project Planner Template for PowerPoint & Google Slides
Gantt Chart