Split Representation Donut Chart Template for PowerPoint and Keynote
Split Representation Donut Chart PowerPoint Template
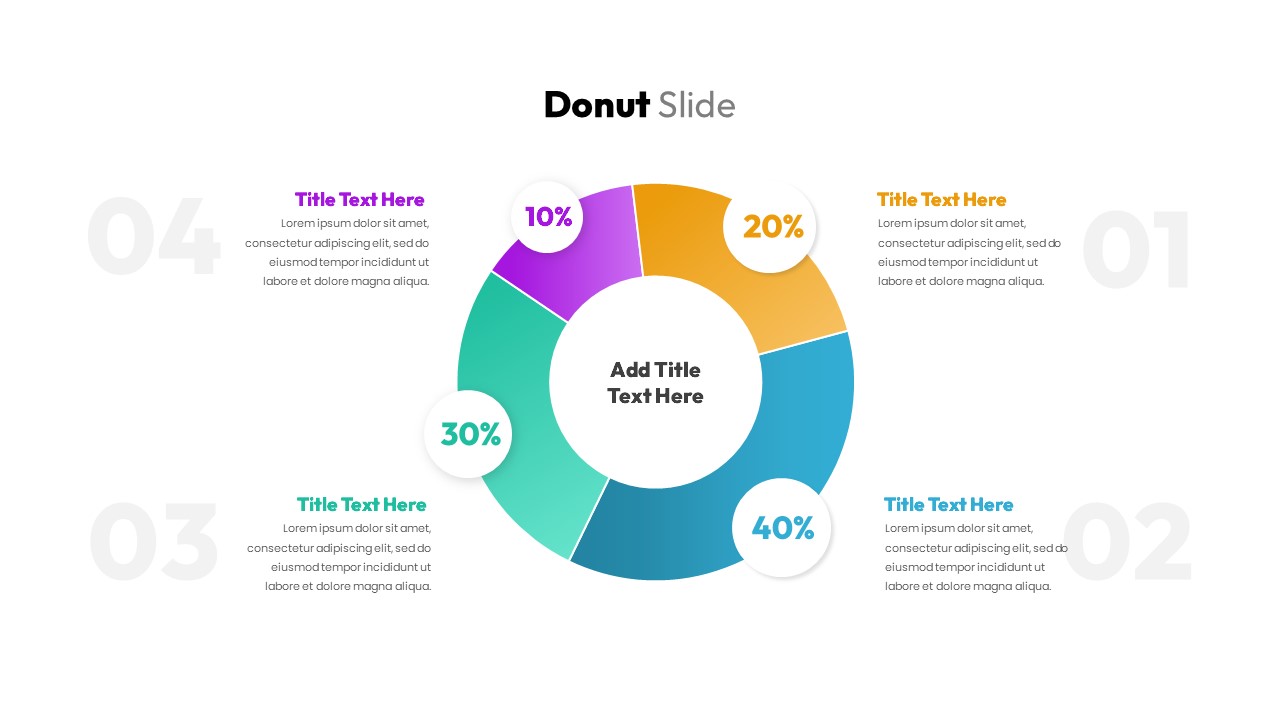
Split representation Donut chart PowerPoint template and keynote is a graphical chart that shows the statistical values of the object. Donut charts are pie diagrams, but having some functional differences. In a donut chart the centre of the diagram is in an empty position. It is one of the most commonly used charts for data visualization, primarily because they are as easy to draw as they are to understand. Technically defined, a doughnut chart is a statistical graph for plotting numerical proportion. Any type of data which have a numerical base can be converted to a pie chart or doughnut chart. The segmented distribution of population and the sales percentages, finance report, investment report and electoral percentages are the commonly used data in a doughnut chart. So the researchers from different areas can use this donut chart split representation PowerPoint for their data representation.
Donut Chart Split Representation is in the shape of a donut which is divided into four different fractions into four colours. The fractions are not uniform and vary according to the value of the concerned subject. This chart can be used when you want to show a segment, proportion or percentage of society, demographics, audience, gender ratio etc.
The Spilt Representation Donut Chart PowerPoint template can be used for business meetings where analysis, research or comparison needs to be shown. Instead of the usually tabular columns and rows, you can adopt this fresh idea of showcasing the data and information through a Donut Chart. The data comparison can be done easily with this donut split chart. The color combination shows the data clearly and neatly. The users and viewers were pleased with this appealing diagram because of the simple and flexible data presentation. It will surely capture the attention of the audience and you can certainly make an impression while doing your presentation. The template is designed in both PowerPoint and keynote in both the aspect ratios 4:3 (Normal) and 16:9 (widescreen).
You can access more Donut Chart Templates here Grab the free ppt now!
Login to download this file
Add to favorites
Add to collection


