Car Sales Market Share Pie Chart Template for PowerPoint & Google Slides

Description
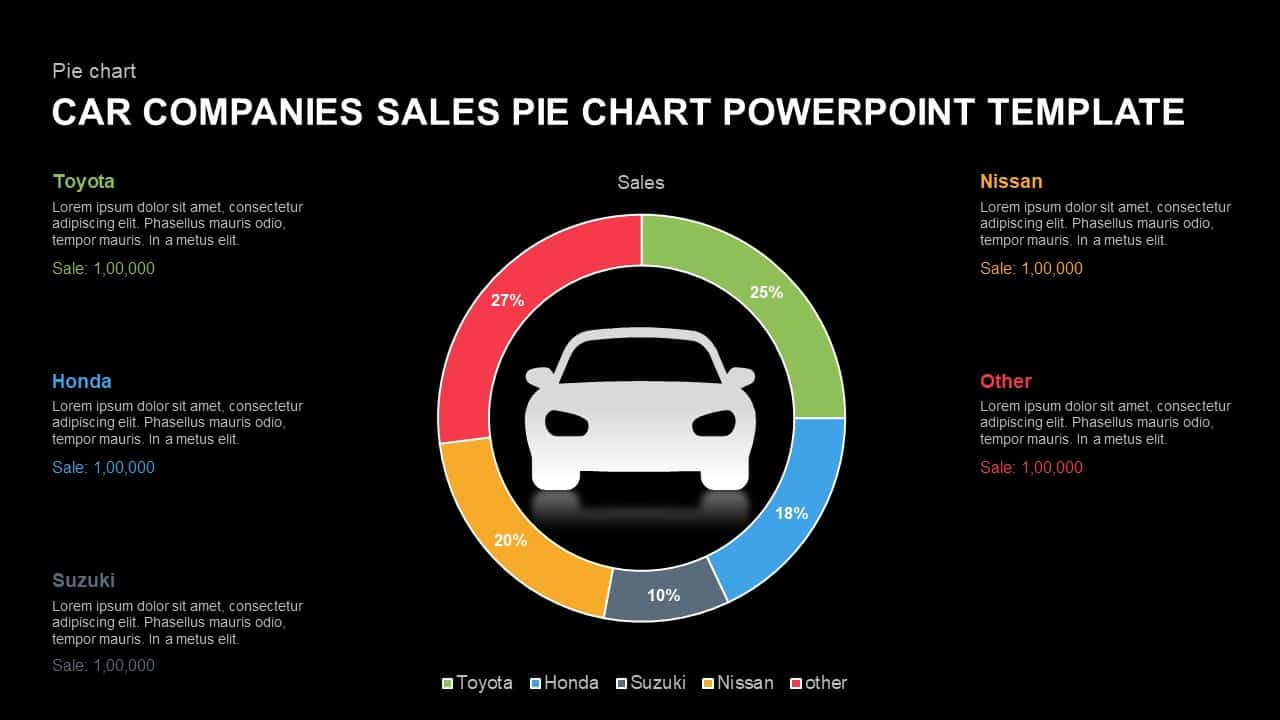
This slide presents a colorful donut chart to visualize car company market share across five segments: Toyota, Honda, Suzuki, Nissan, and Other. Each slice uses a distinct hue—green, blue, gray, orange, and red—and displays percentage labels for quick comparison. A central car icon reinforces the automotive context, while subtle drop shadows and clean typography maintain a modern, professional look. Fully editable vector shapes and master-slide integration allow you to swap icons, adjust segment colors, or update data labels in seconds without disrupting the layout. Ideal for illustrating sales performance, market analysis, or competitive benchmarking, this infographic slide keeps your audience engaged and focused on key metrics.
Who is it for
Sales directors, marketing analysts, business strategists, and automotive industry professionals will leverage this chart to communicate market share insights, sales targets, and competitor performance.
Other Uses
Repurpose this template for any category-based distribution such as product portfolio splits, budget allocations, customer segmentation, or performance dashboards. Simply relabel slices and adjust percentages to fit diverse business scenarios.
Login to download this file

Item ID
SB01332
Related Templates

Social Media Market Share Pie Charts Template for PowerPoint & Google Slides
Pie/Donut
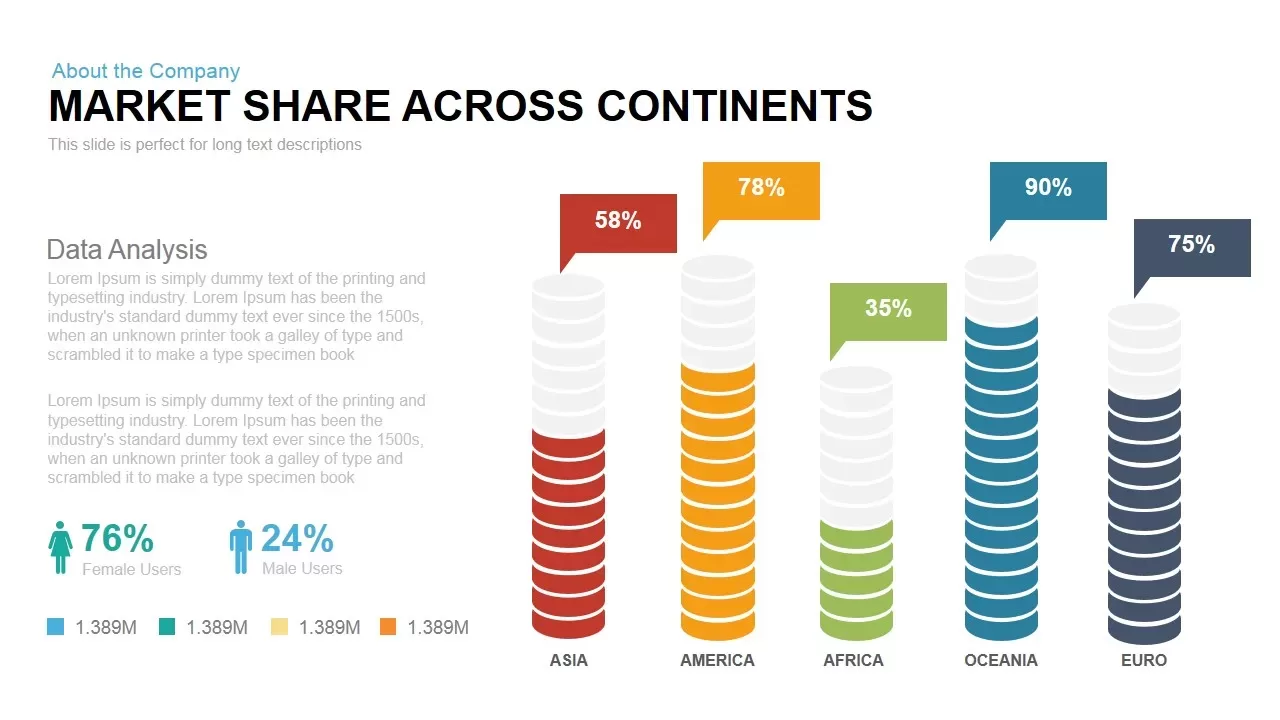
Global Market Share Cylinder Chart Template for PowerPoint & Google Slides
Bar/Column
Market Share Comparison Diagram Template for PowerPoint & Google Slides
Comparison Chart
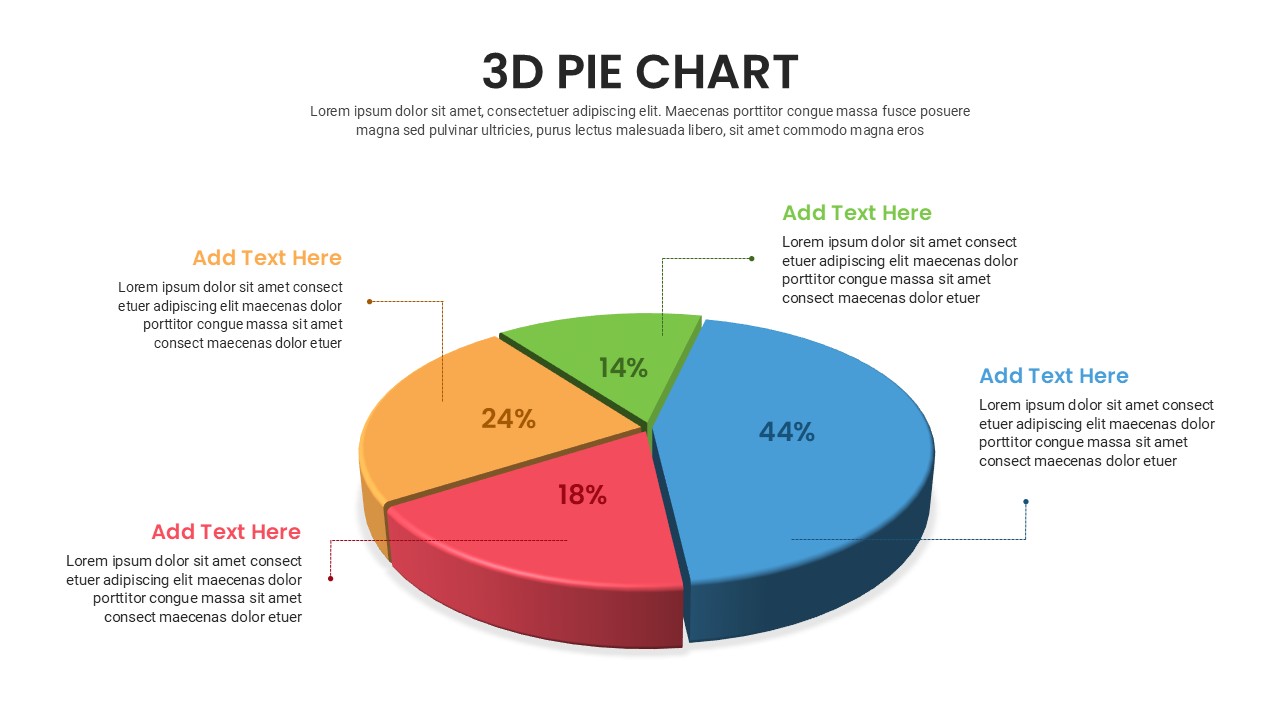
Free 3D Pie Chart PowerPoint Template & Google Slides
Pie/Donut
Free
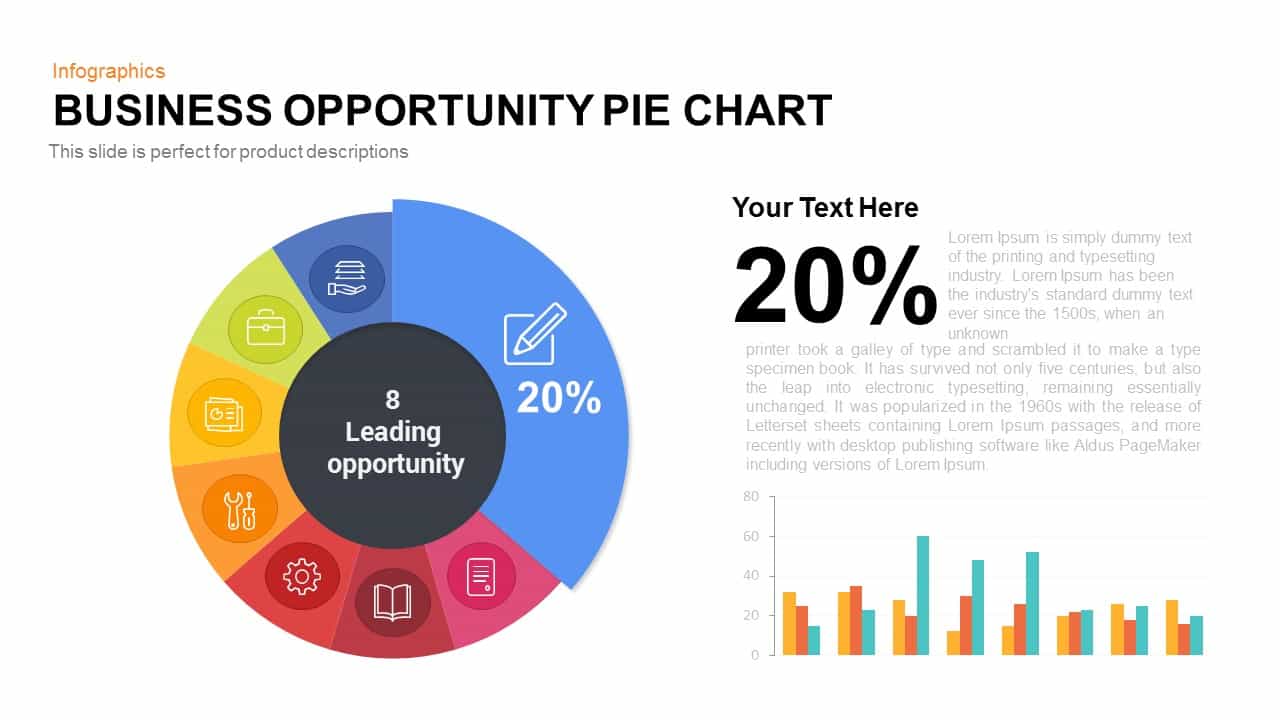
Business Opportunity Pie Chart Template for PowerPoint & Google Slides
Pie/Donut
3D pie chart infographic template for PowerPoint & Google Slides
Pie/Donut
Dynamic Bar-of-Pie Chart Comparison Template for PowerPoint & Google Slides
Pie/Donut
Quarterly Comparison Pie Chart Template for PowerPoint & Google Slides
Pie/Donut
Segmented Pie Chart Infographic with Icons for PowerPoint & Google Slides
Pie/Donut
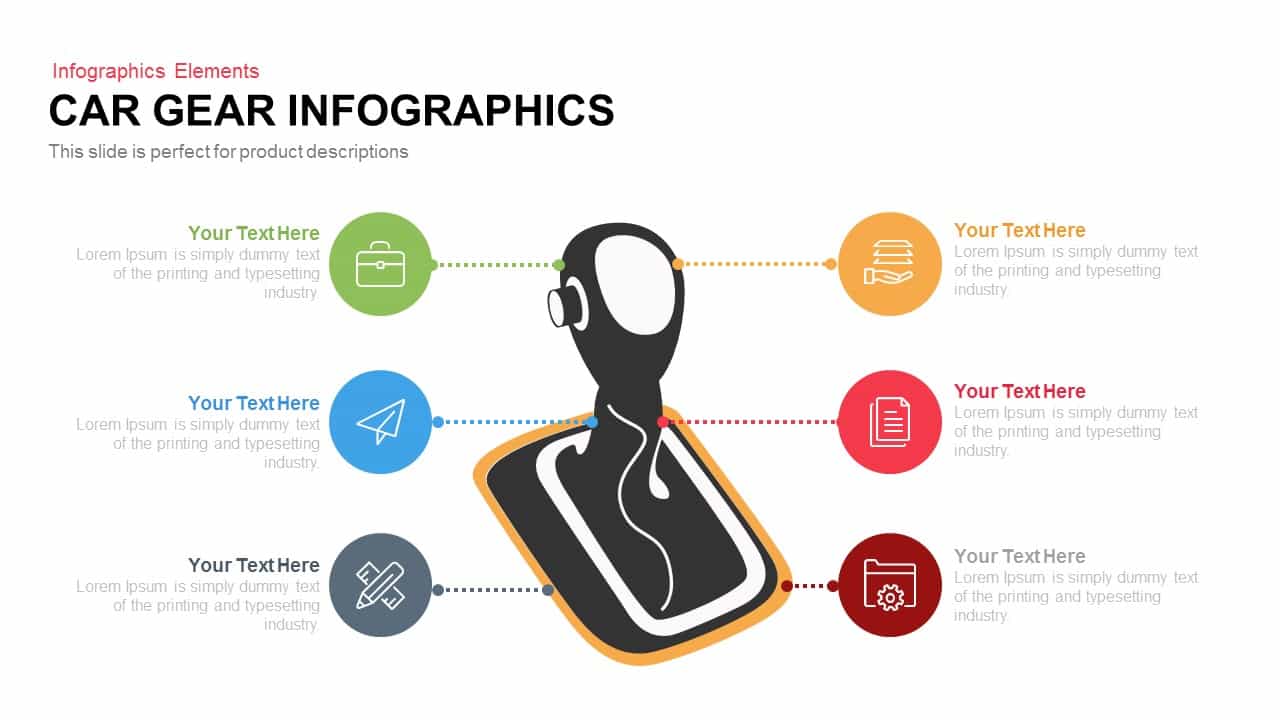
Car Gear Infographics Template for PowerPoint & Google Slides
Infographics
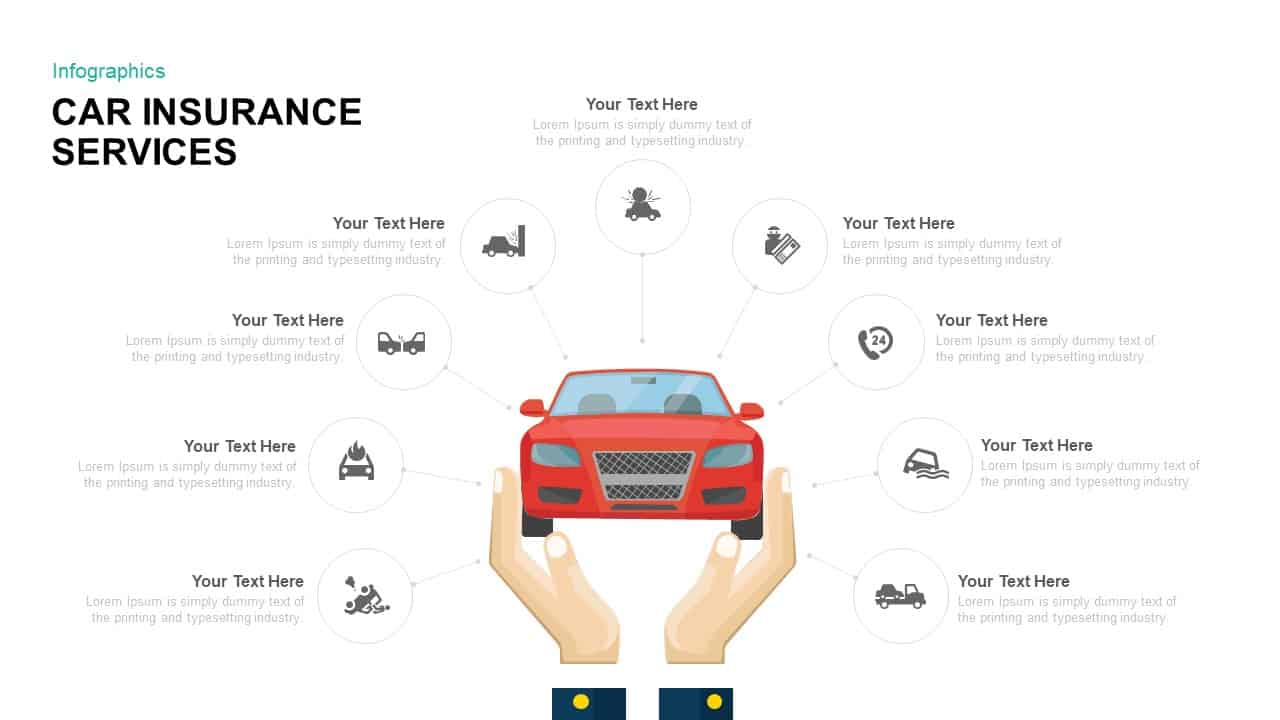
Comprehensive Car Insurance Services Diagram Template for PowerPoint & Google Slides
Business
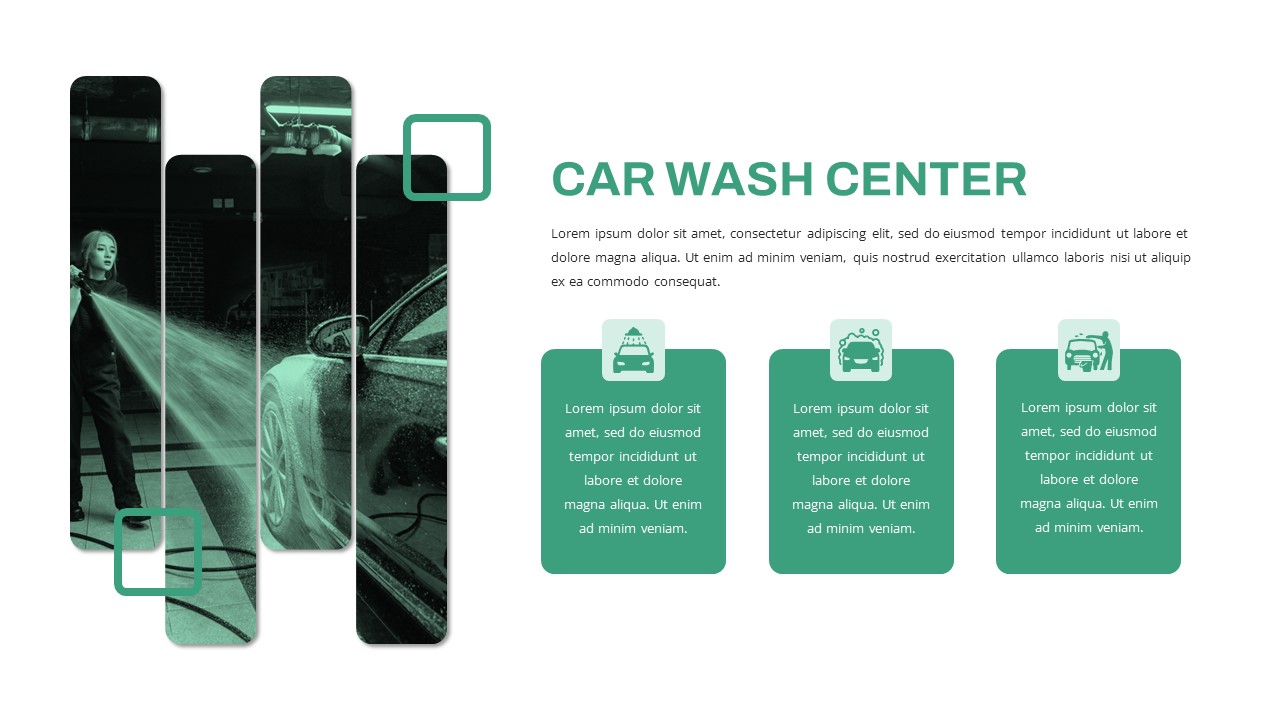
Free Car Wash Center Service Features Slide Template for PowerPoint & Google Slides
Business Proposal
Free
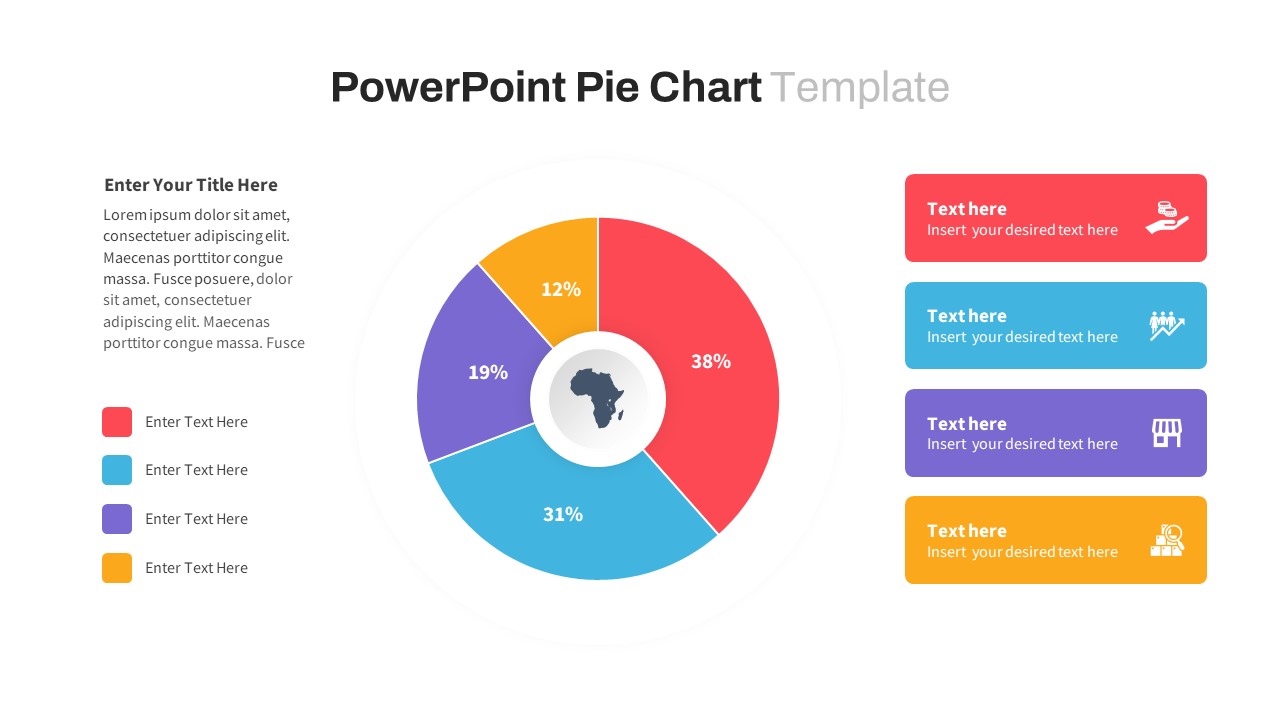
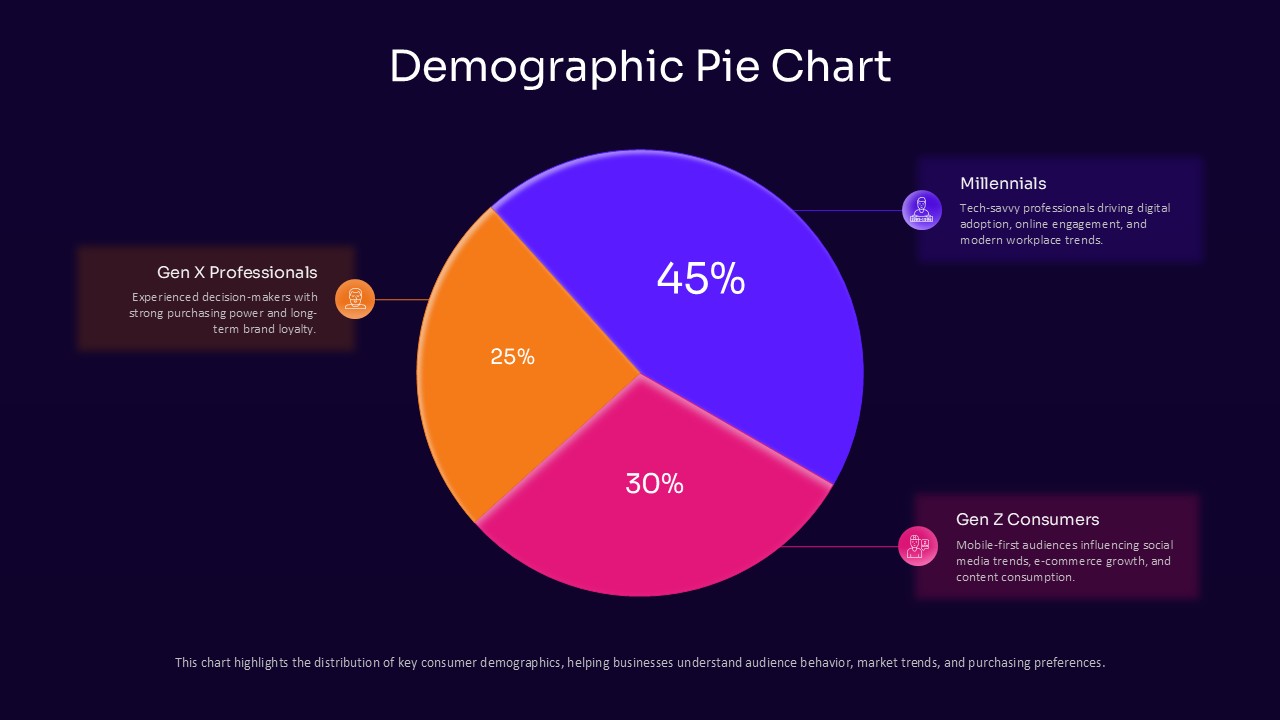
Demographic Pie Chart PowerPoint Template
Pie/Donut
Car Dealership PowerPoint Presentation Template
Company Profile

Pie Segment Diagram Four-Step Process Template for PowerPoint & Google Slides
Pie/Donut
Gear Pie Diagram Data Visualization Template for PowerPoint & Google Slides
Pie/Donut
Project Progress Dashboard Pie Charts Template for PowerPoint & Google Slides
Project
Market Development Matrix Chart Template for PowerPoint & Google Slides
Comparison Chart
Quarterly Sales Review Bar Chart Template for PowerPoint & Google Slides
Bar/Column
Sales Growth Comparison Chart & Table Template for PowerPoint & Google Slides
Bar/Column