Market Development Matrix Chart Template for PowerPoint & Google Slides

Market Development Matrix Chart Template for PowerPoint & Google Slides
Evaluating corporate growth trajectories, expansion risks, or portfolio diversification options demands a structured strategic framework. Plain text lists and basic bullet points often obscure how market reach and product innovation interact during high-level strategic planning. Incorporating a dedicated Ansoff Matrix slide provides business strategists, product managers, and corporate consultants with a clear visual model to compare market expansion avenues side by side.
Key Visual Features
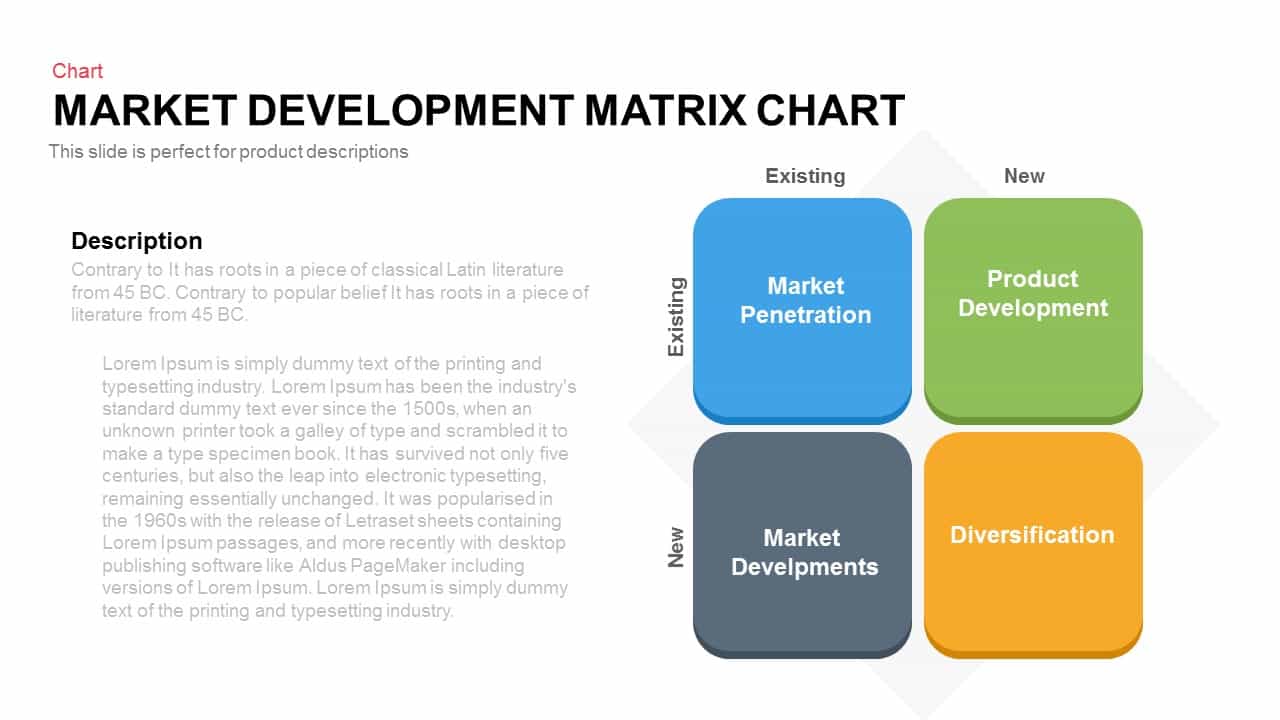
- 4-Quadrant Ansoff Grid: Anchored on the right over a subtle diamond backdrop, four color-coded rounded cards map out core growth strategies: Market Penetration (blue), Product Development (green), Market Development (slate grey), and Diversification (orange).
- Clear Axis Labeling: Bold “Existing” and “New” labels line the horizontal and vertical axes, establishing clear reference points for product capabilities and target market scope.
- Side-by-Side Narrative Area: A dedicated left-hand text column offers ample space for executive summaries, strategic context, and detailed quadrant breakdowns.
- Modern Dark Theme: A sleek black background provides high contrast, helping bright quadrant containers pop during executive presentations.
Best Use Cases
- Corporate Growth Strategy Meetings: Present risk assessments and strategic pathways when evaluating new product launches versus expanding current offerings.
- Product Portfolio Planning: Align cross-functional product, marketing, and sales leadership on resource allocation across existing and emerging markets.
- Investor & Board Presentations: Deliver clear visual models outlining corporate expansion roadmap options during strategic reviews.
Fully Customizing This Template
Personalizing this matrix diagram to fit your brand standards takes minimal effort in PowerPoint and Google Slides. Every vector shape, quadrant container, background background overlay, and text field is a fully editable element. You can easily adjust color schemes to reflect corporate branding, re-title matrix quadrants, and refine descriptive text blocks in just a few quick clicks.
Login to download this file

Item ID
SB00242


Related Templates

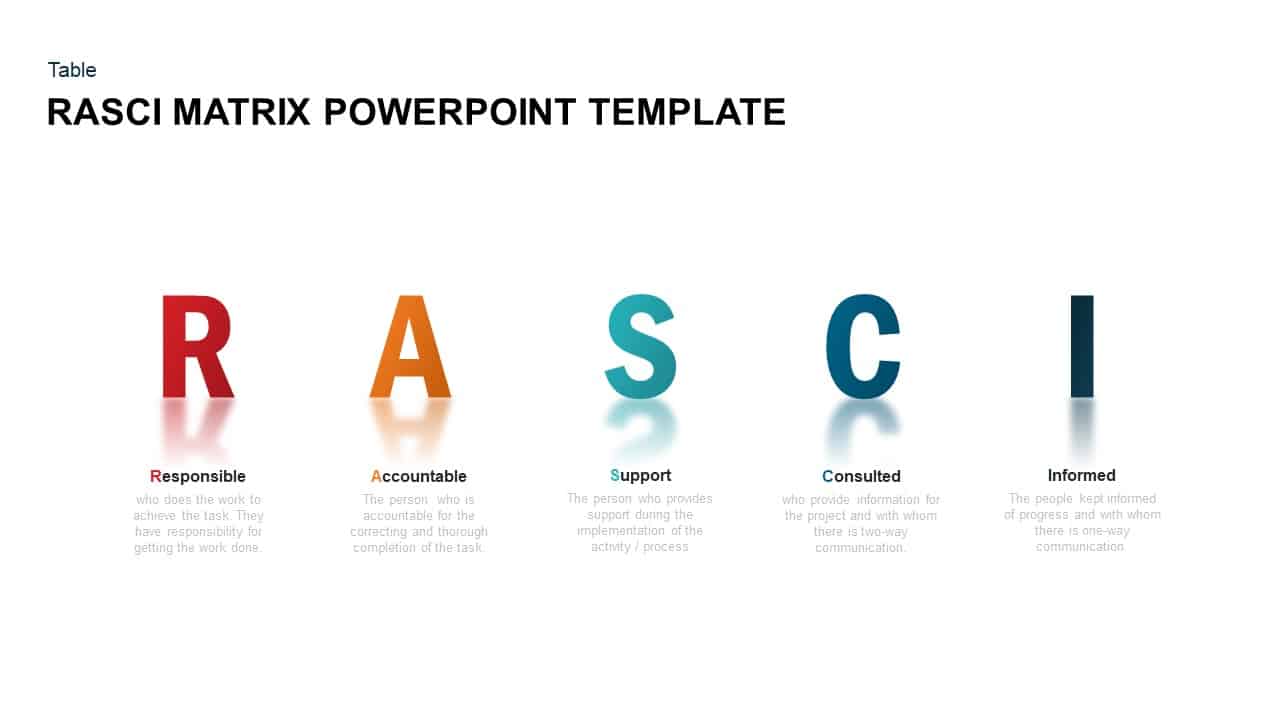
RASCI Responsibility Matrix Chart Template for PowerPoint & Google Slides
Business
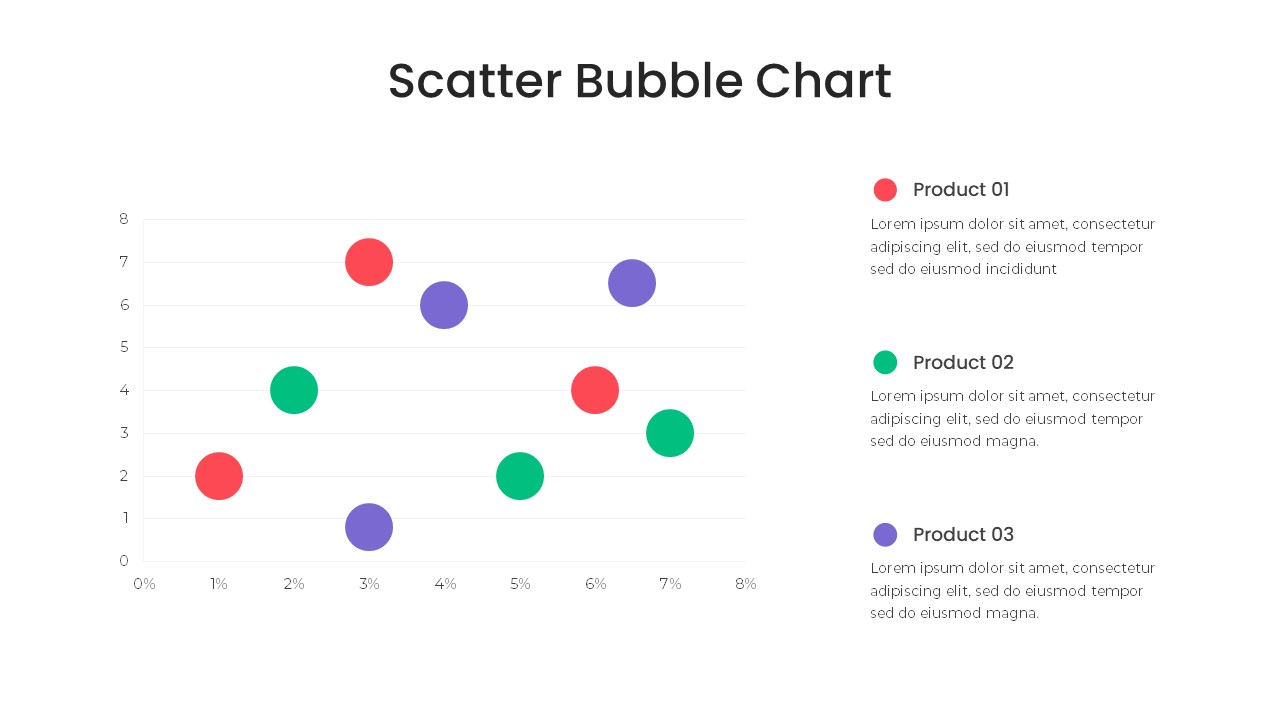
Bubble Chart Scatter, Diagram & Matrix Template for PowerPoint & Google Slides
Comparison Chart
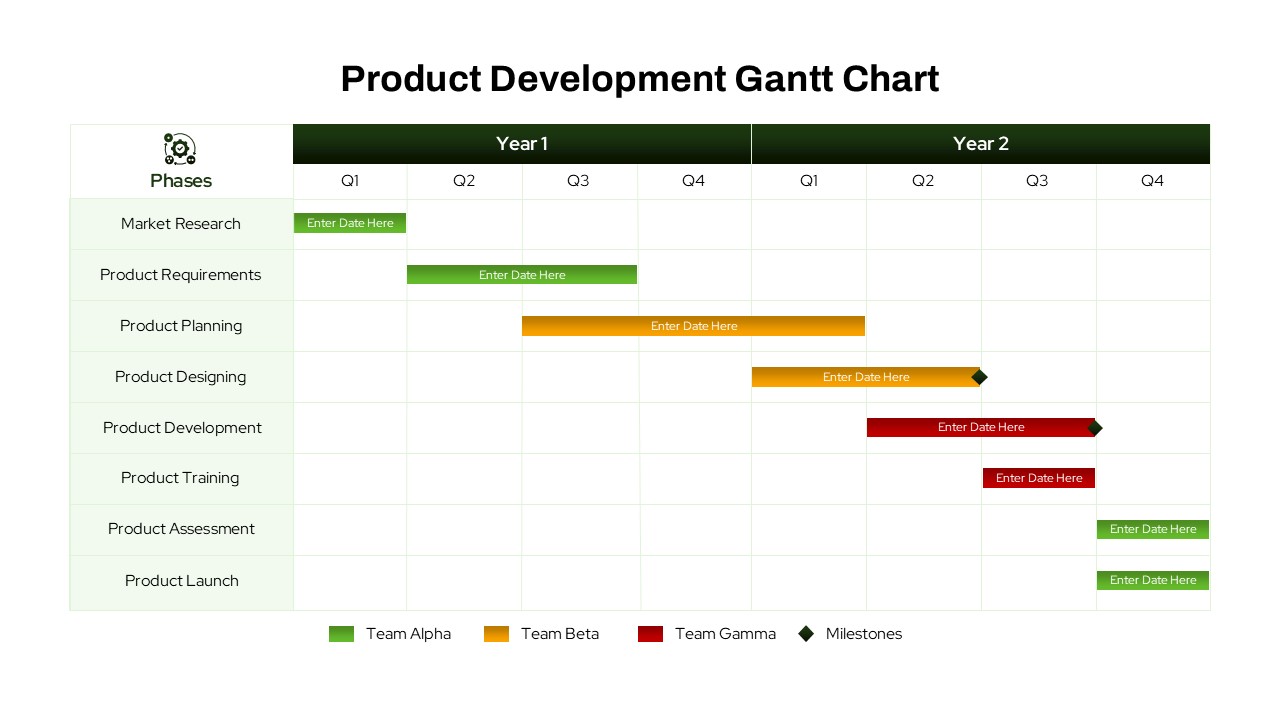
Product Development Gantt Chart template
Gantt Chart
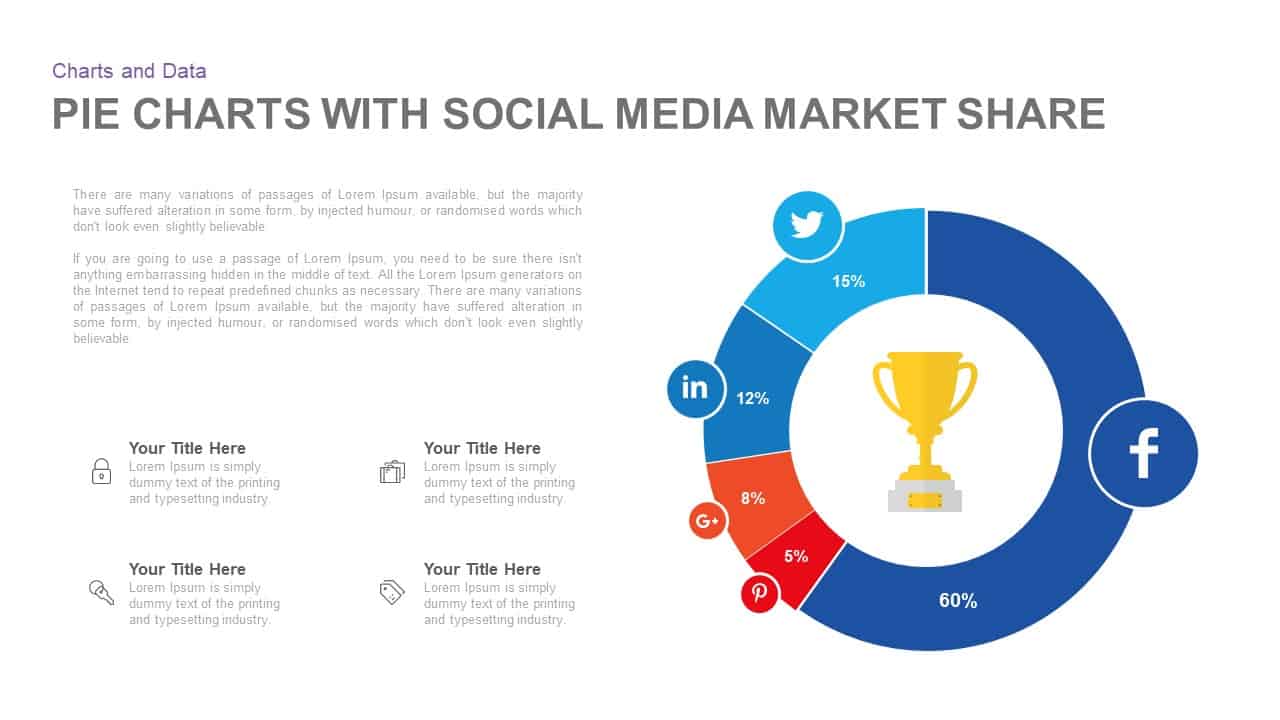
Pie Chart with Social Media Market Share PowerPoint Template
Pie/Donut
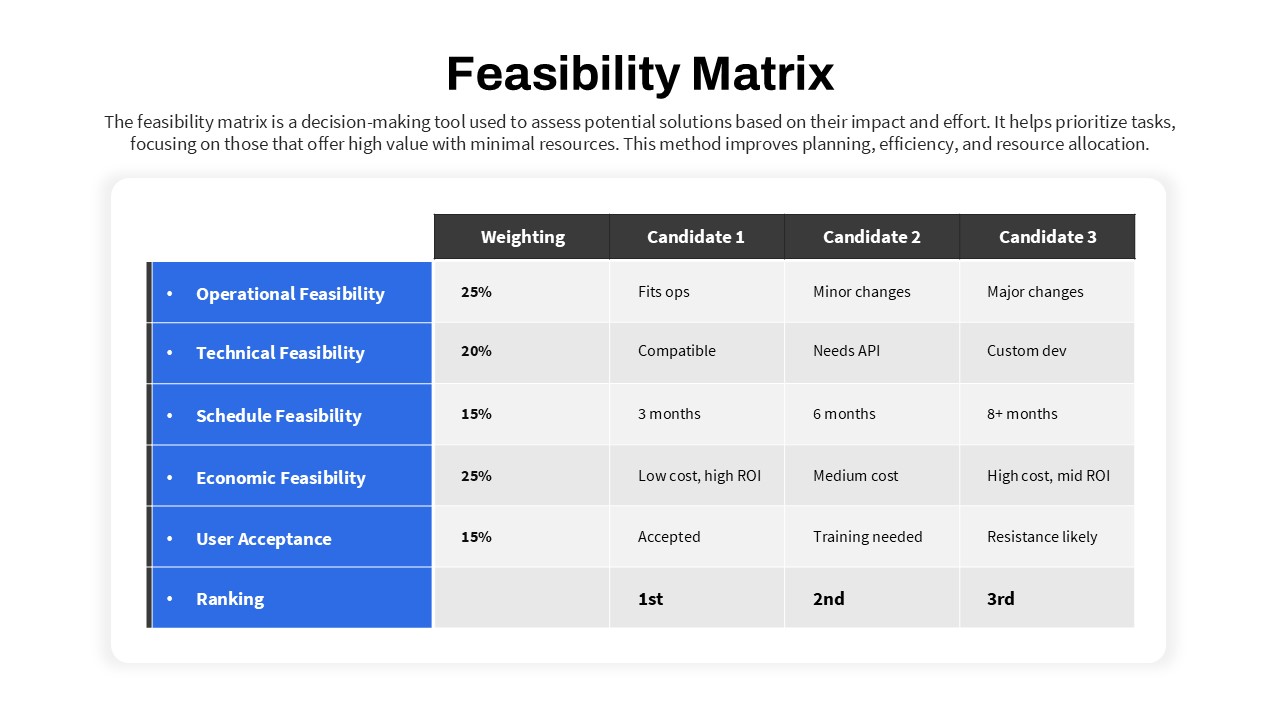
Feasibility Matrix Comparison Chart Template
Comparison Chart
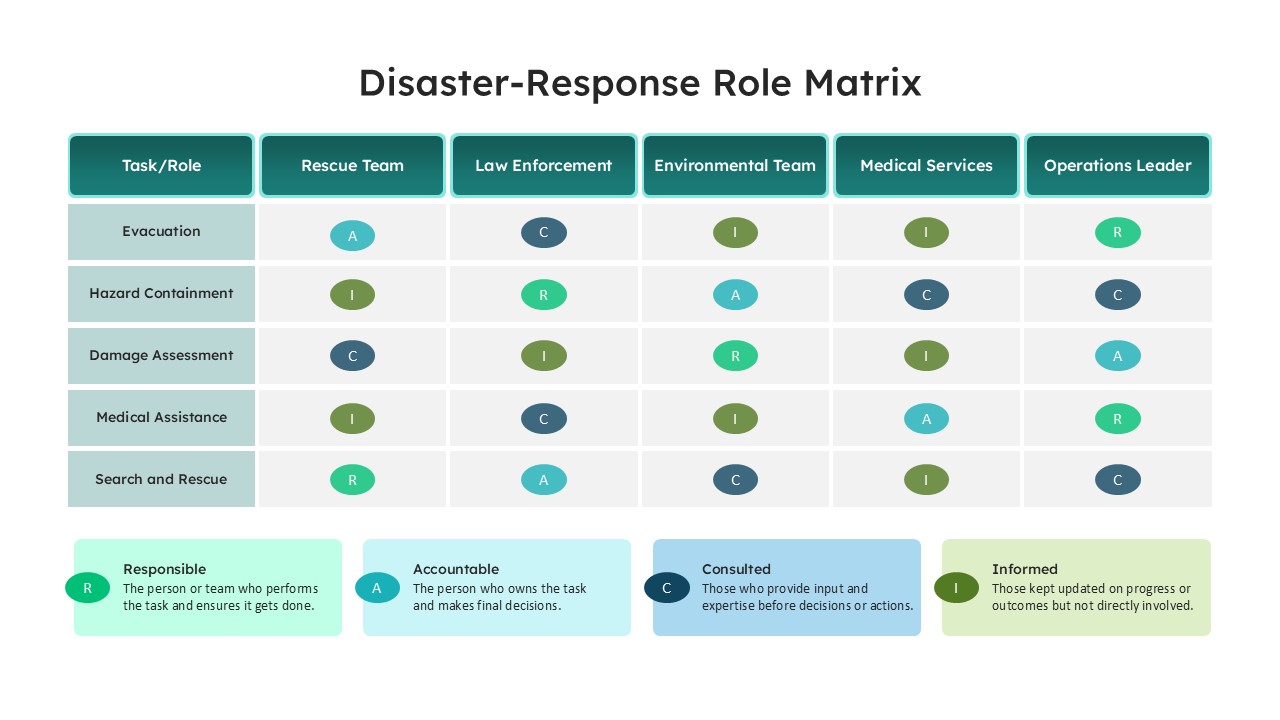
Disaster Response Role Matrix RACI Chart Template
Project Status
Product Development template for PowerPoint & Google Slides
Process
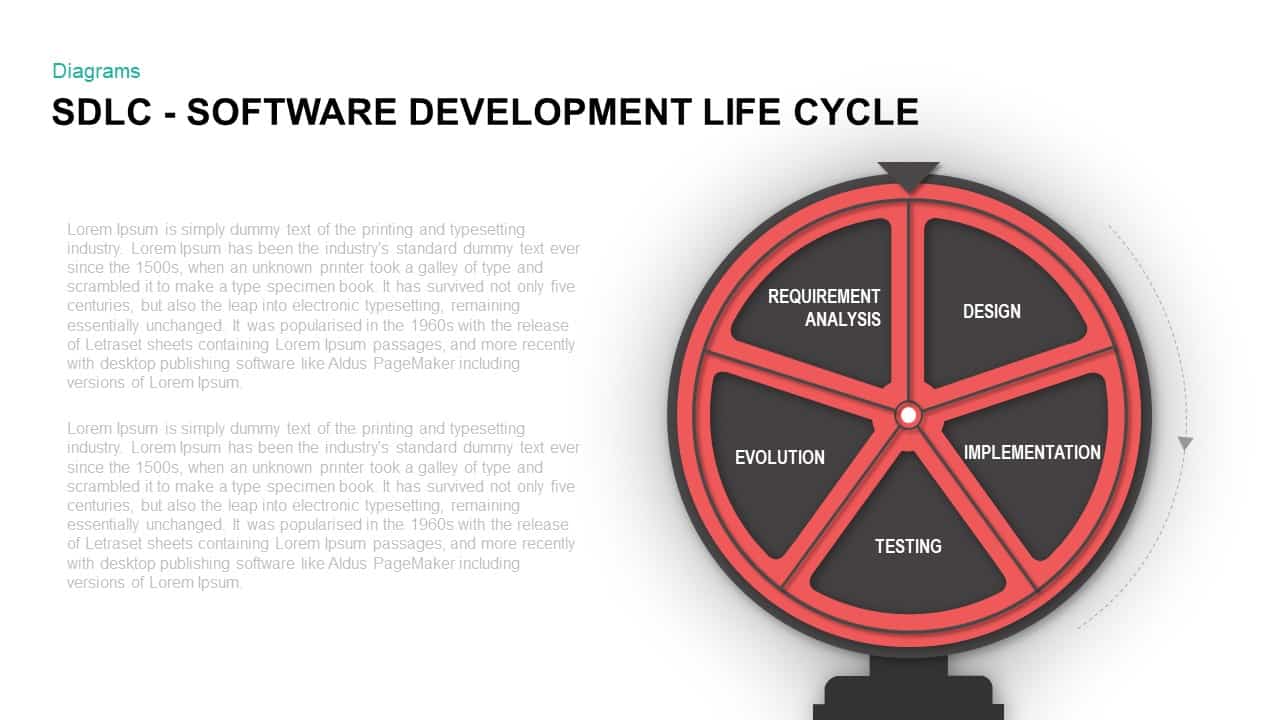
Software Development Life Cycle Diagram Template for PowerPoint & Google Slides
Circular

Traditional Product Development Process Template for PowerPoint & Google Slides
Process
Four-Stage Development Pipeline Template for PowerPoint & Google Slides
Process
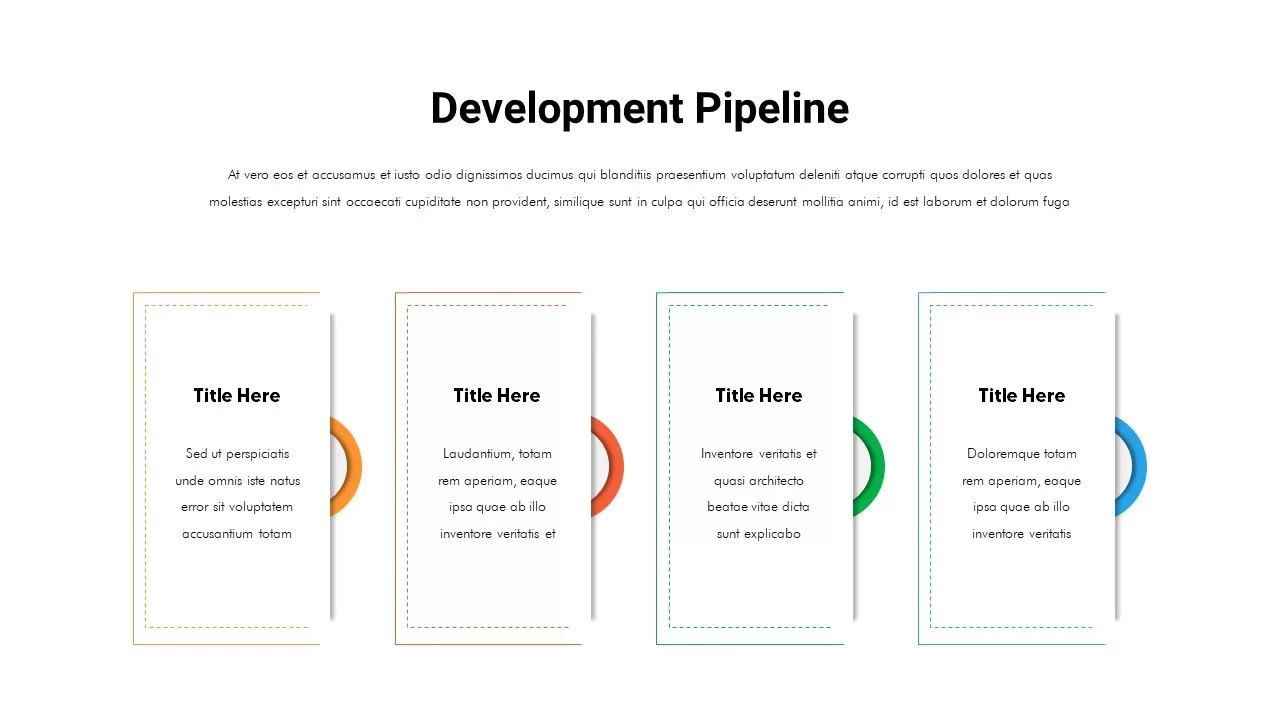
Development Pipeline Process Infographic Template for PowerPoint & Google Slides
Process
ML Development Life Cycle Diagram Template for PowerPoint & Google Slides
Machine Learning
Stage Gate Process for Product Development Template for PPT & Google Slides
Process
Target Market Template for PowerPoint & Google Slides
Circular
Market Segmentation & STP Infographics Pack Template for PowerPoint & Google Slides
Marketing
Business Case Deck with Market Analysis Template for PowerPoint & Google Slides
Business Report
Professional Product Market Fit Pyramid Template for PowerPoint & Google Slides
Pyramid
Business Review Deck with Market Updates Template for PowerPoint & Google Slides
Company Profile
Comparative Market Analysis Template for PowerPoint & Google Slides
Comparison
PESTLE Analysis for Market Entry Template for PowerPoint & Google Slides
PEST