ML Development Life Cycle Diagram Template for PowerPoint & Google Slides
ML Development Life Cycle Slide Template for PowerPoint & Google Slides
Explaining the end-to-end MLOps pipeline, artificial intelligence workflows, or machine learning iteration phases requires a visual structure that captures continuous feedback loops. Linear flowcharts and text-heavy slides often fail to depict how data engineering, model development, and operational deployment continuously feed into one another. Utilizing a dedicated ML development life cycle slide template allows AI engineers, data science leads, and technical product managers to map out MLOps processes across an interconnected triple-loop framework.
Visual Architecture & Layout
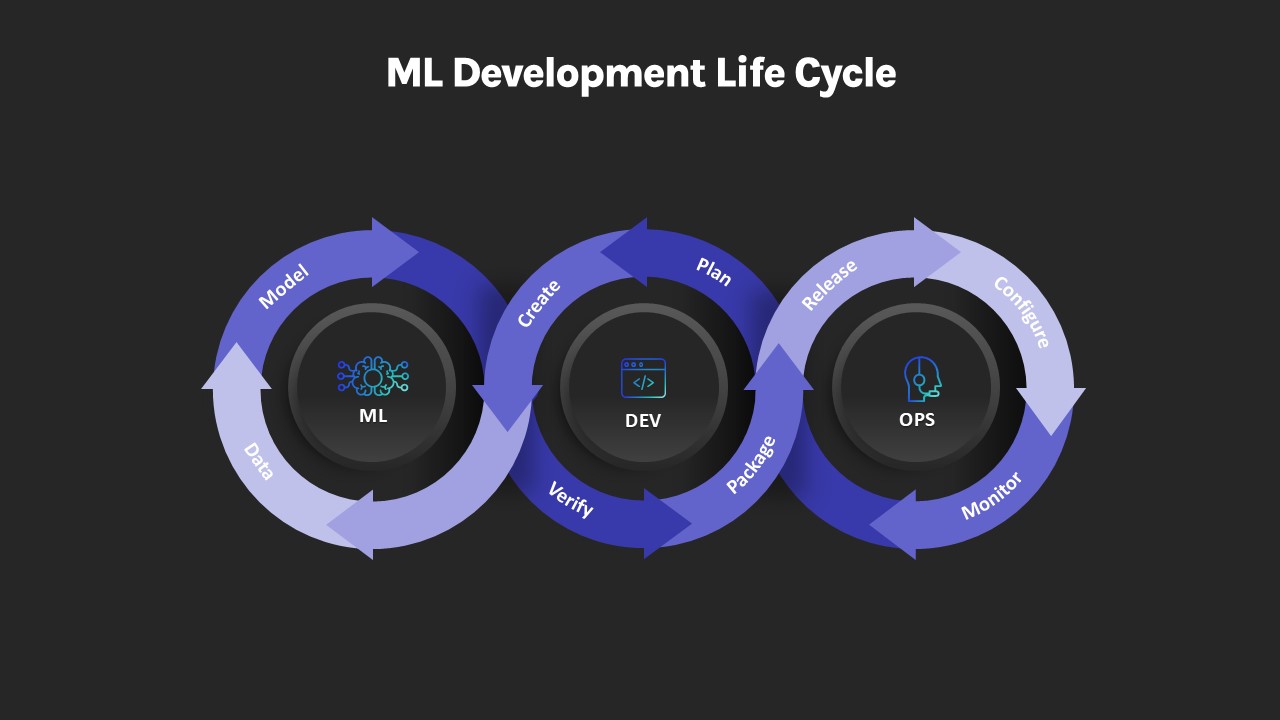
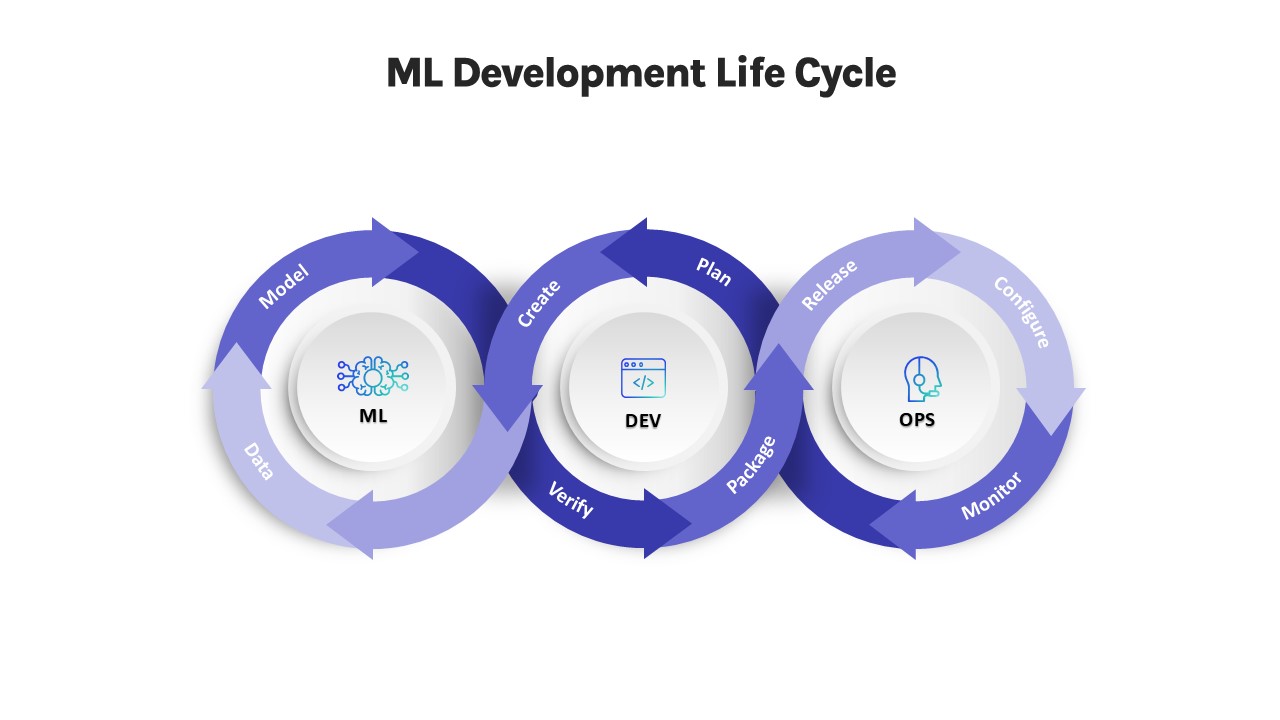
- Interconnected Triple-Loop Design: Three interlocking circular arrow pathways form an infinity-style continuous flow across the slide, visually connecting machine learning, software development, and operations.
- Core Technology Hubs: Three central circular badges anchor each loop section—labeled ML, DEV, and OPS—complete with neon-style line icons representing neural networks, code development, and operational monitoring.
- Sequential Phase Labels: Curving text labels trace the outer arrows to outline essential workflow stages, including Data, Model, Create, Plan, Verify, Package, Release, Configure, and Monitor.
Strategic Applications
- MLOps Framework Presentations: Illustrate how data science models transition into production software environments through continuous integration and deployment loops.
- AI Product Roadmaps: Walk technical stakeholders and executive teams through the iterative stages of data ingestion, model validation, packaging, and real-time monitoring.
- Engineering Team Onboarding: Clarify team handoffs between data engineers, software developers, and IT operations specialists across the software development life cycle.
Customizing this machine learning diagram takes minimal effort across both PowerPoint and Google Slides. Every vector arrow loop, central hub badge, technical line icon, and text curved path is a fully editable element. You can easily adjust color gradients to match corporate branding, swap out central icons, modify phase labels to reflect your custom MLOps architecture, or toggle between light and dark slide themes in just a few clicks.
Login to download this file

Item ID
SB04764


Related Templates

Software Development Life Cycle Diagram Template for PowerPoint & Google Slides
Circular
Project Life Cycle Diagram Template
Process
Employee Life Cycle Activities Template for PowerPoint & Google Slides
Timeline
Employee Life Cycle Activities Process Template for PowerPoint & Google Slides
Employee Performance
Data Migration Life Cycle – Template for PowerPoint Template
Process
Product Life Cycle PowerPoint Template
Business
The Product Life Cycle PowerPoint Template
Process
Project Life Cycle PowerPoint Template
Process
Customer Life Journey PowerPoint Diagram Slide
Customer Journey
Life Roadmap PowerPoint Template
Infographics
Inner Work Life Theory PowerPoint Template
Employee Performance
Wheel of Life Template
Business
Continuous Improvement Cycle Diagram Template for PowerPoint & Google Slides
Circular
Four-Point Arrow Cycle Diagram Template for PowerPoint & Google Slides
Arrow
Communication Cycle Process Diagram template for PowerPoint & Google Slides
Business
Release Management Cycle Circular Diagram Template for PowerPoint & Google Slides
Software Development
Gartner Hype Cycle Adoption Curve Diagram Template for PowerPoint & Google Slides
Infographics
Experiential Learning Cycle Diagram Template
Circular
Agile Methodology PPT Template
Project
Free
Change Management Process PowerPoint Template
Process