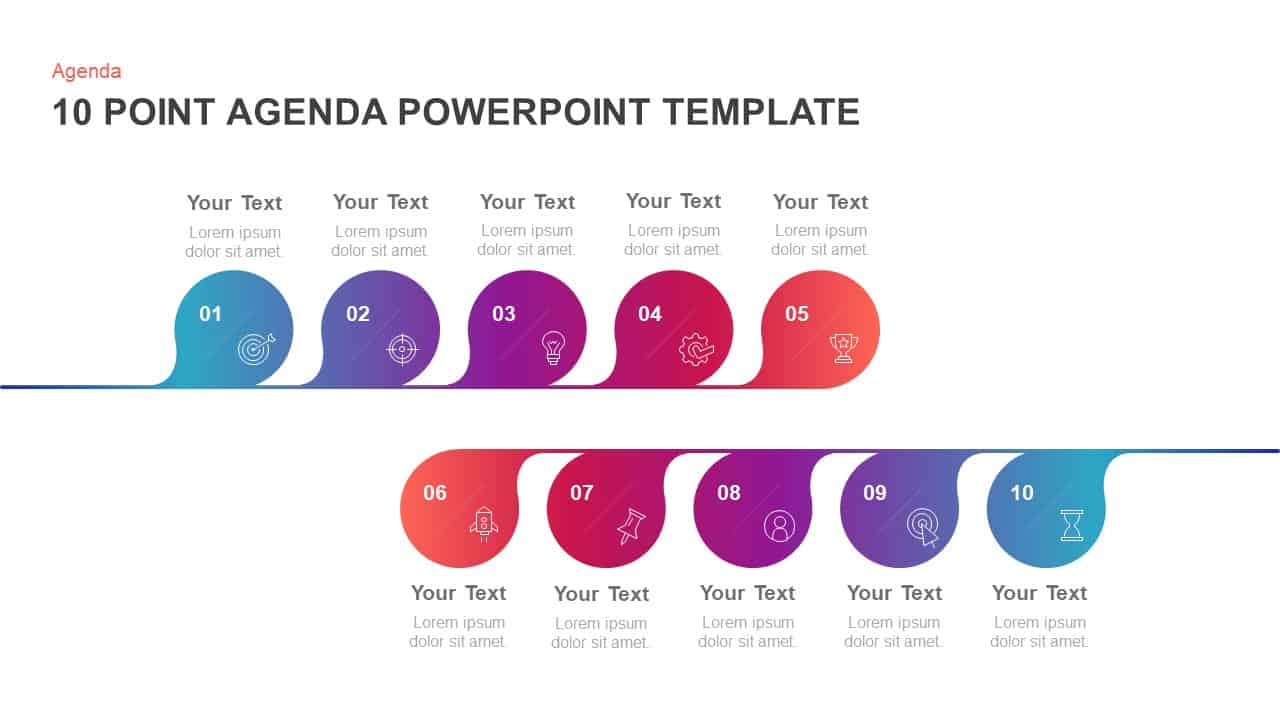
Gradient Ten-Step Flowchart Diagram Template for PowerPoint & Google Slides
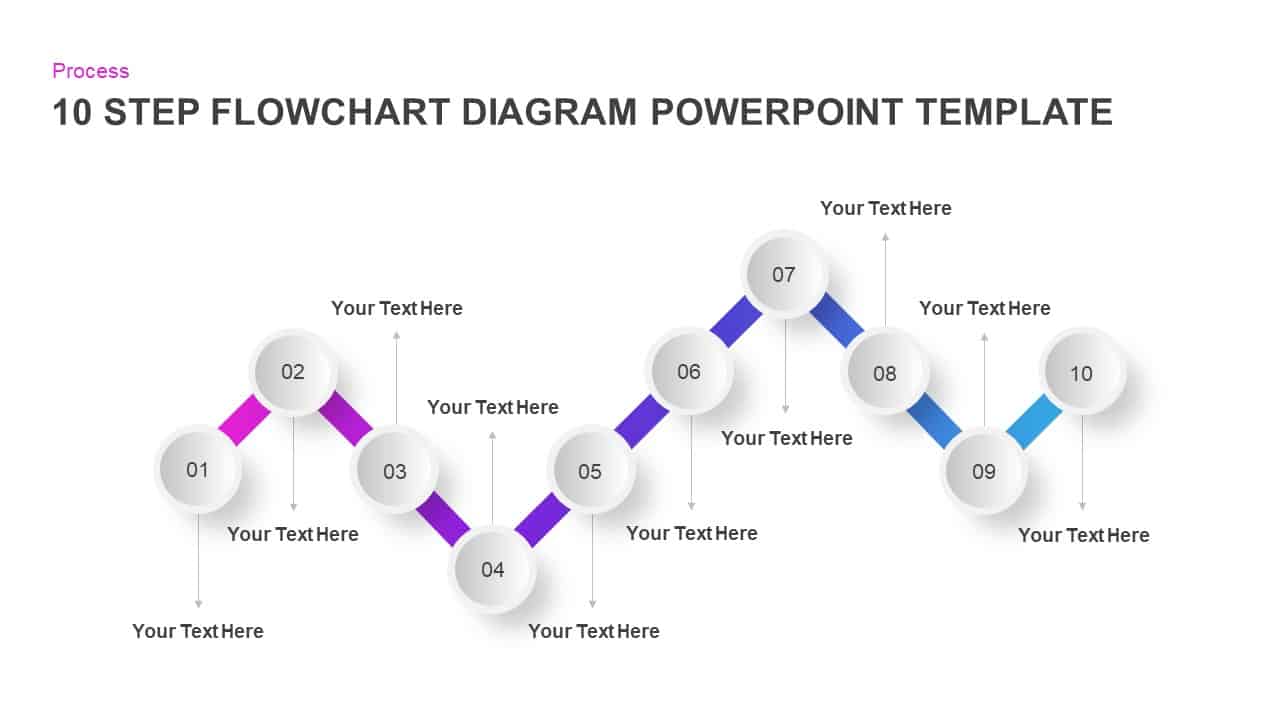
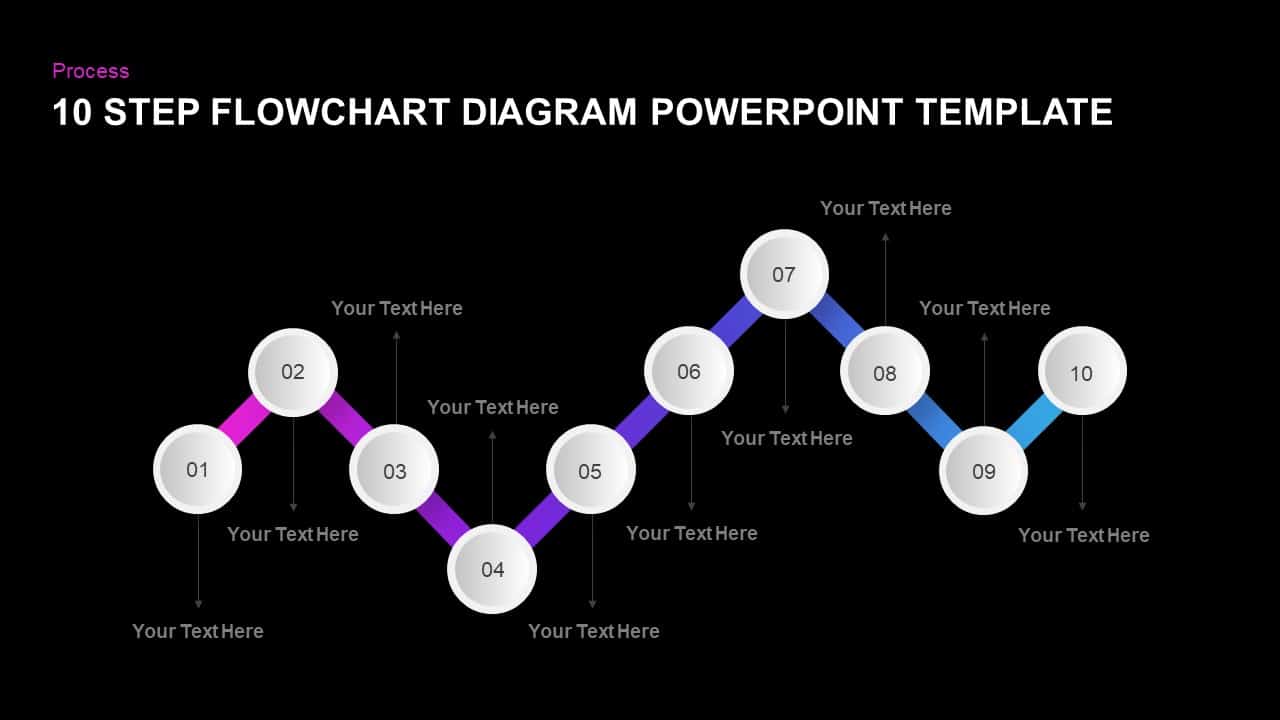
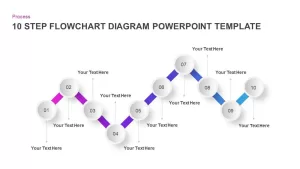
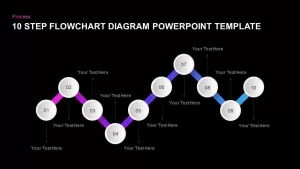
This dynamic ten-step flowchart diagram slide helps you map complex processes with clarity and visual appeal. Ten subtly shaded circles—each numbered 01 through 10—are linked by bold gradient segments that transition from magenta to blue, guiding audiences through every phase of your workflow. Upward and downward connector lines attach to clean text placeholders above and below each circle, providing space for concise headings, action items, or KPI callouts without overcrowding the design. Built on master slides with 100% vector shapes, every element—from the curve of each connector to the gradient stops on the segments—is fully editable in seconds.
The flat-yet-dimensional aesthetic, paired with crisp sans-serif typography and subtle drop shadows, guarantees professional polish and legibility on HD screens, tablets, or printed materials. Ample white space around the flowchart keeps focus on your key messages, while the consistent gradient theme reinforces the sense of progression. Whether you’re outlining a product development lifecycle, illustrating a ten-point audit checklist, or presenting a multi-phase project plan, this slide transforms detailed sequences into an engaging, easy-to-follow visual narrative.
Who is it for
Project managers, process engineers, and business consultants will benefit from this template when presenting phased initiatives, operational procedures, or successive milestones. Trainers, auditors, and strategy teams can also leverage the ten-step layout to structure workshops, compliance reviews, or performance evaluations.
Other Uses
Beyond classic flowcharts, repurpose this template for ten-point risk assessments, feature roadmaps, or customer journey mappings. Swap out numbered circles for icons, recolor gradient segments to match branding, or remove and duplicate steps to adapt the sequence length as needed.
Login to download this file

Item ID
SB01168
Related Templates

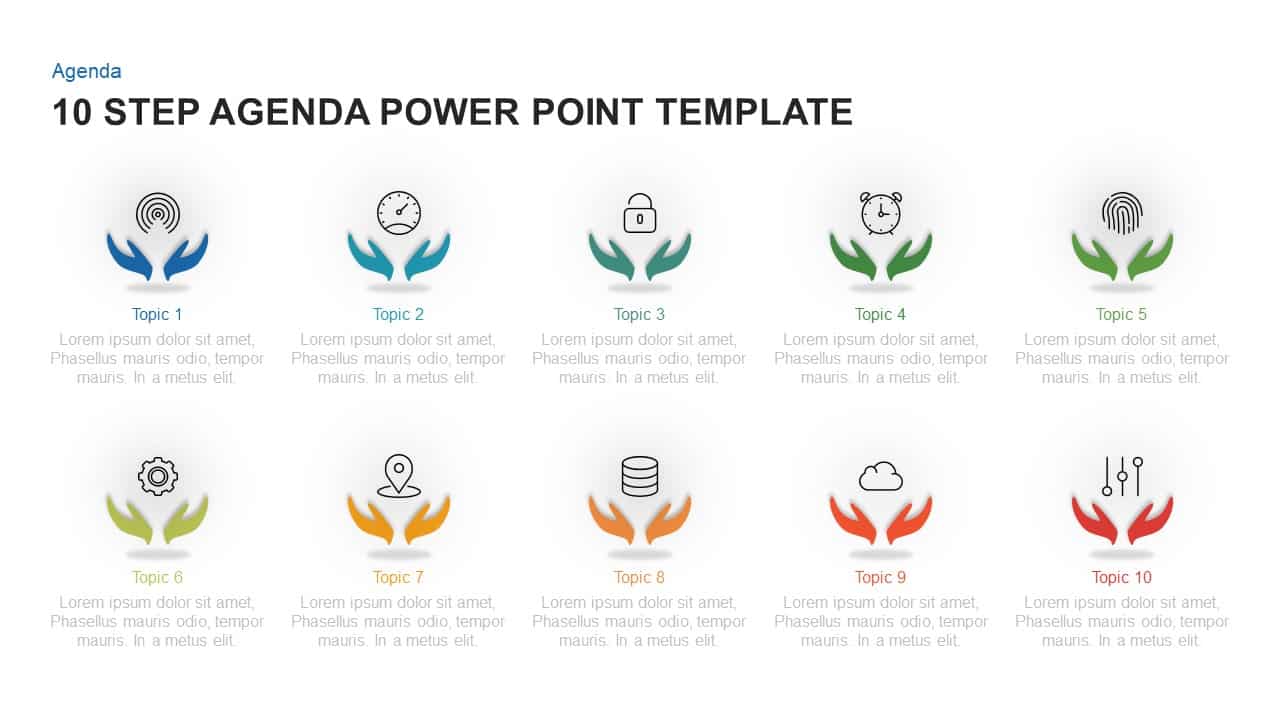
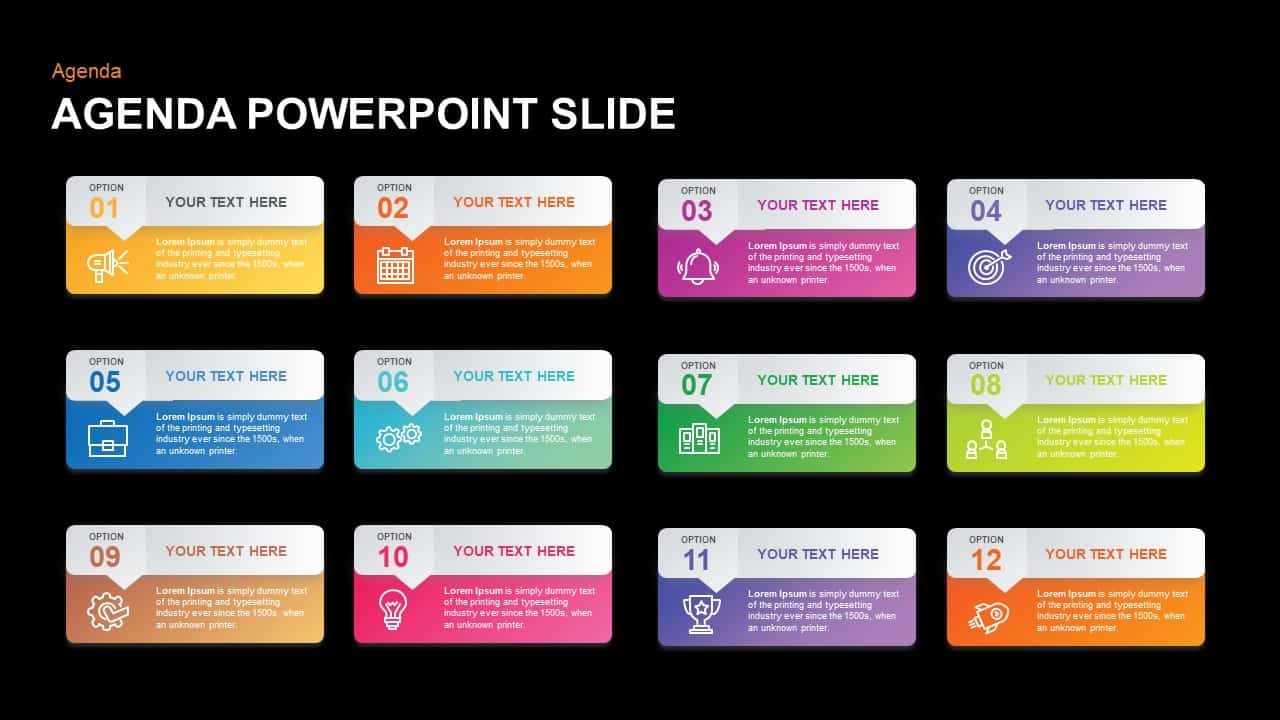
Professional Ten-Step Agenda Slide Template for PowerPoint & Google Slides
Agenda
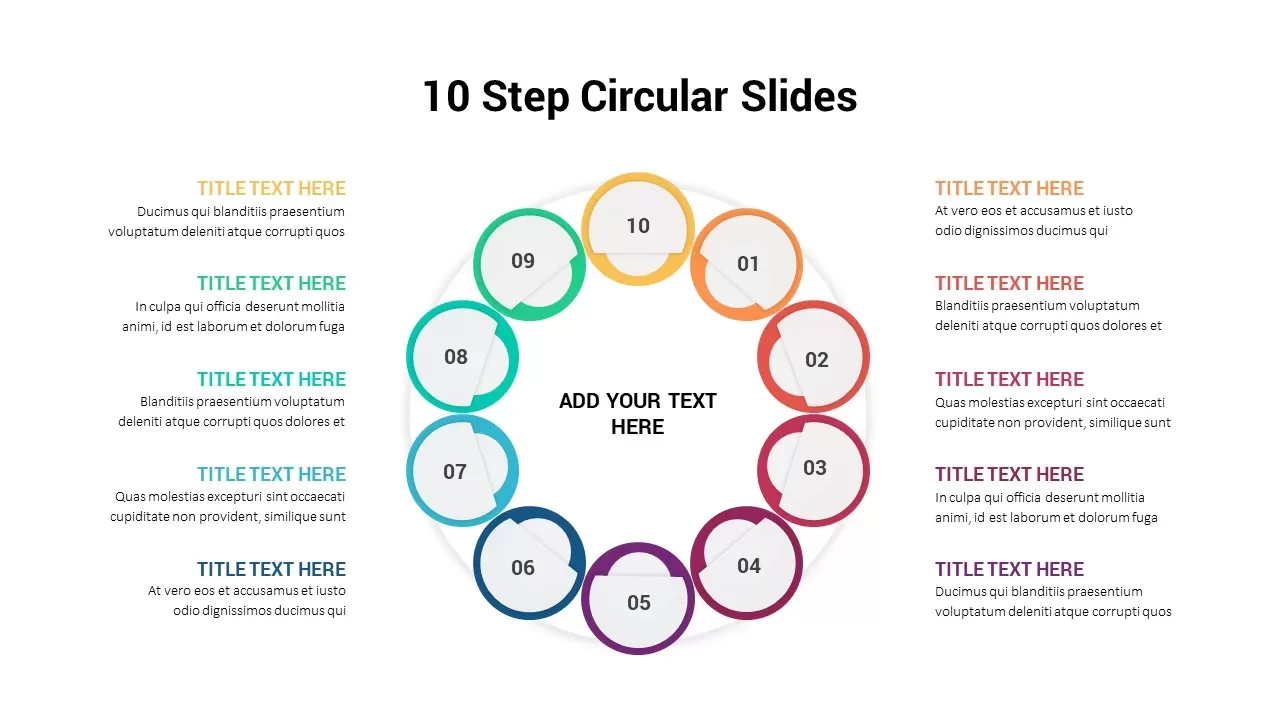
Ten Step Circular Process Infographic Template for PowerPoint & Google Slides
Process
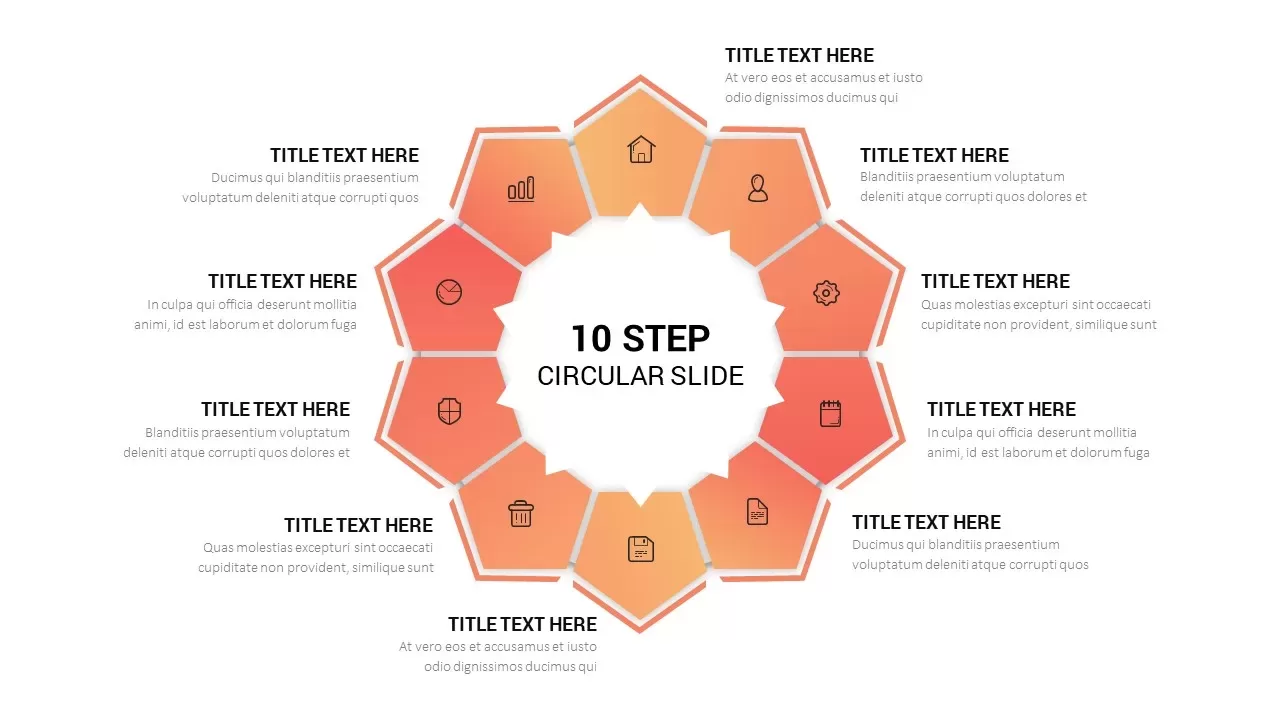
Ten-Step Circular Process Infographic Template for PowerPoint & Google Slides
Circular
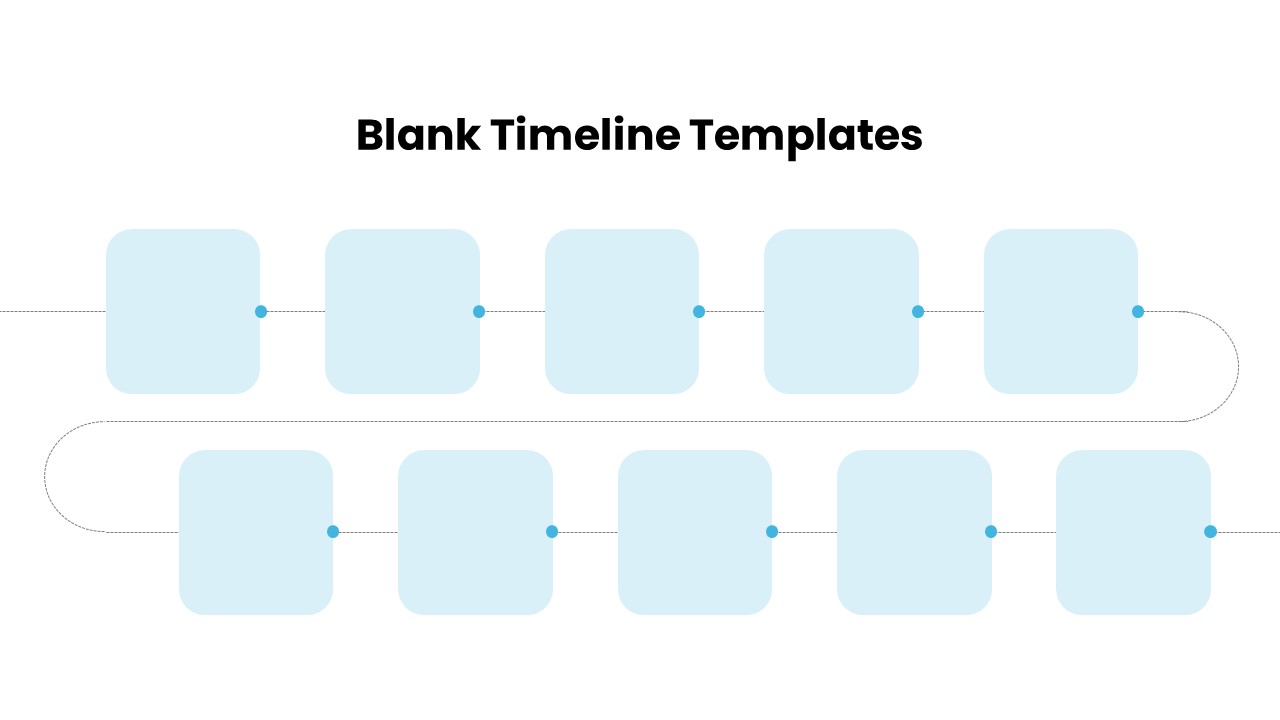
Blank Timeline Infographic Template
Timeline
Flow Chart Template For PowerPoint Presentations
Flow Charts
Five-Step Gradient Blue Funnel Diagram Template for PowerPoint & Google Slides
Funnel
Roadmap Template for PowerPoint Presentation
Roadmap
Gradient Five-Step Roadmap Diagram Template for PowerPoint & Google Slides
Roadmap
Ten-Stage Zig-Zag Process Diagram Template for PowerPoint & Google Slides
Process

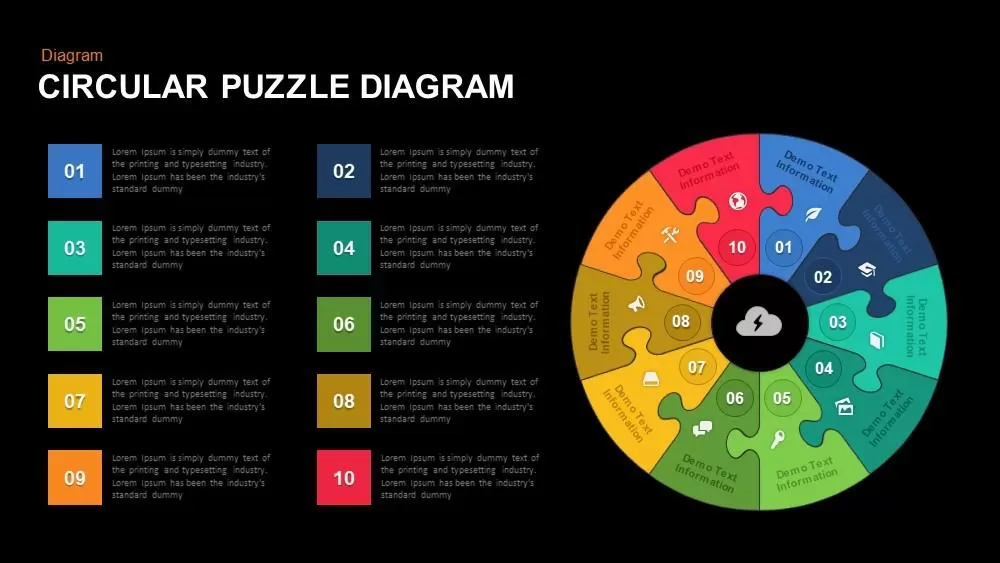
Ten-Piece Circular Puzzle Diagram Template for PowerPoint & Google Slides
Circular
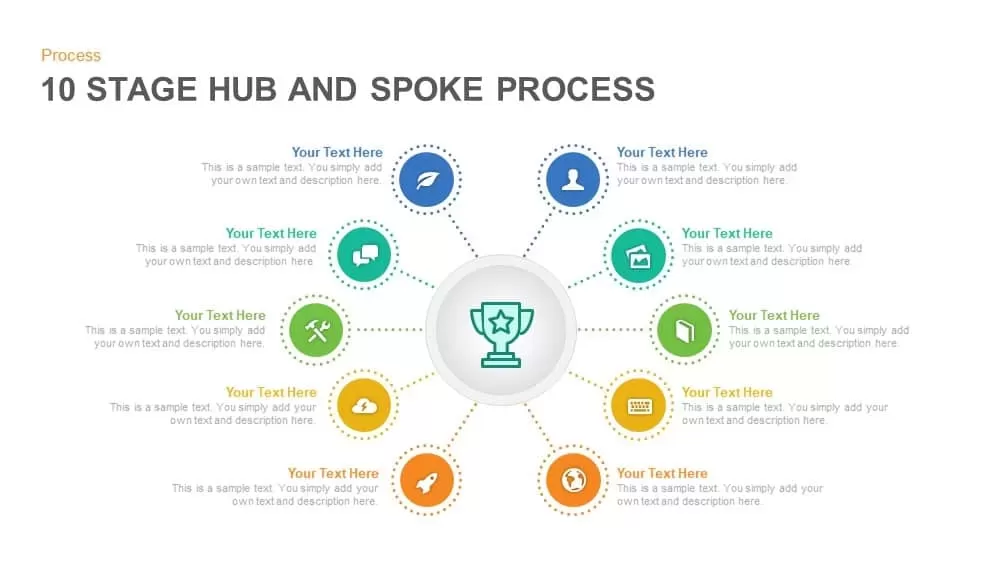
Ten-Stage Hub and Spoke Process Diagram Template for PowerPoint & Google Slides
Process
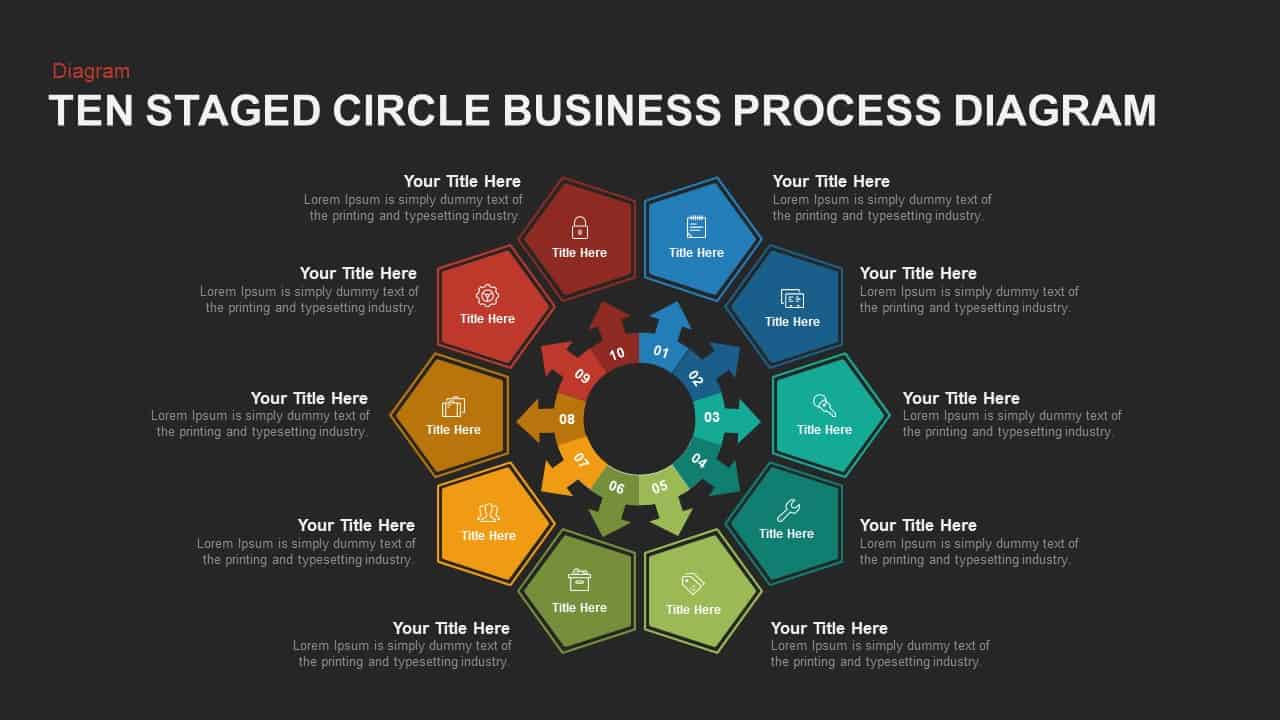
Ten-Stage Business Process Diagram Template for PowerPoint & Google Slides
Process
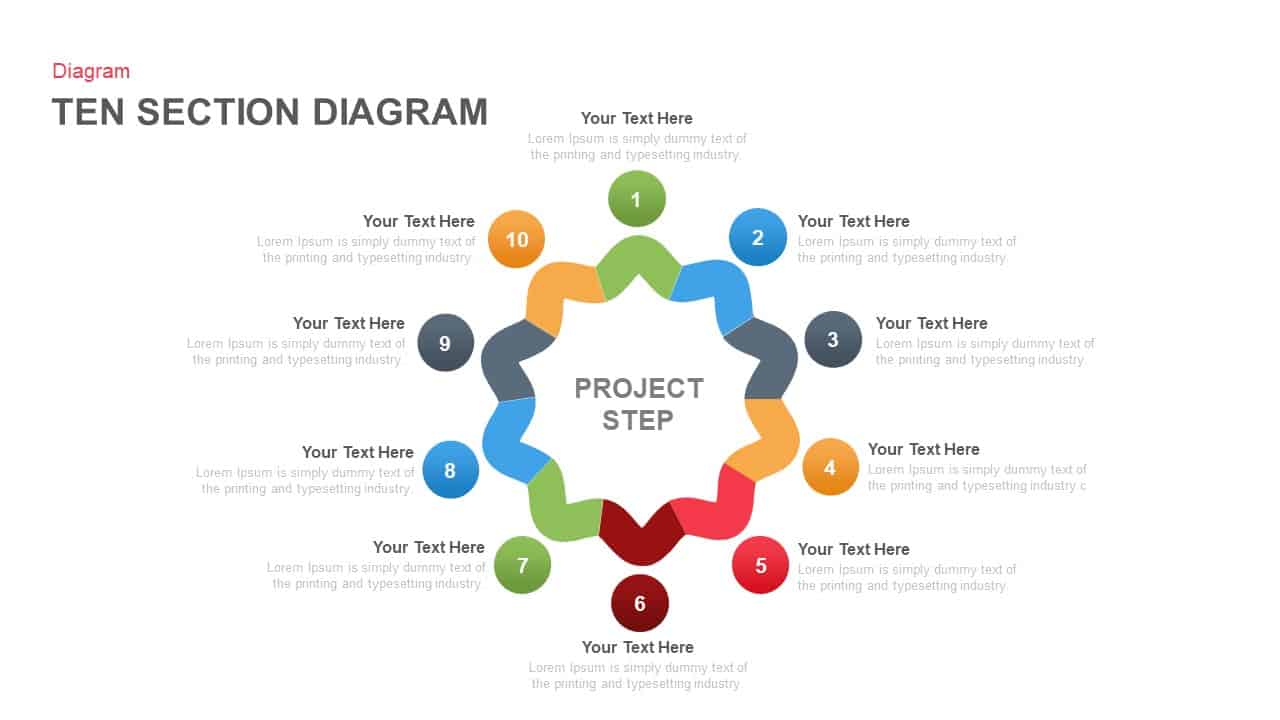
Ten-Section Project Steps Diagram Template for PowerPoint & Google Slides
Process
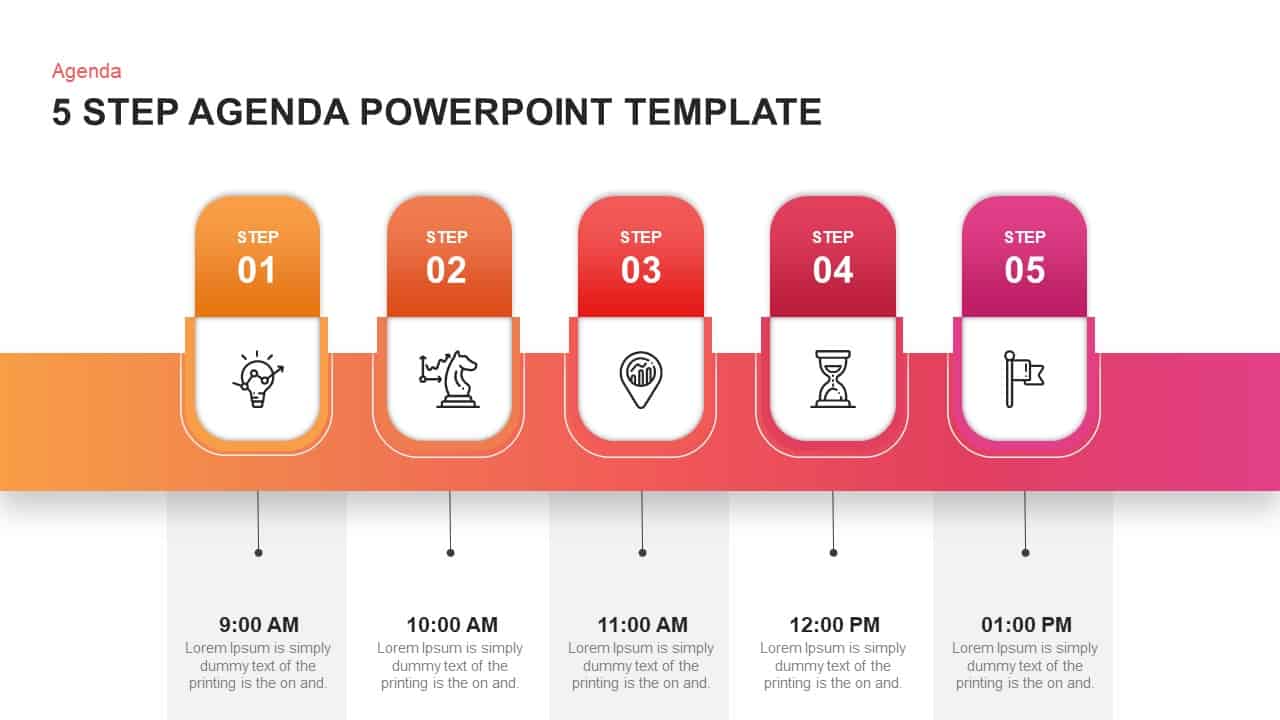
Five-Step Gradient Agenda Timeline Template for PowerPoint & Google Slides
Agenda
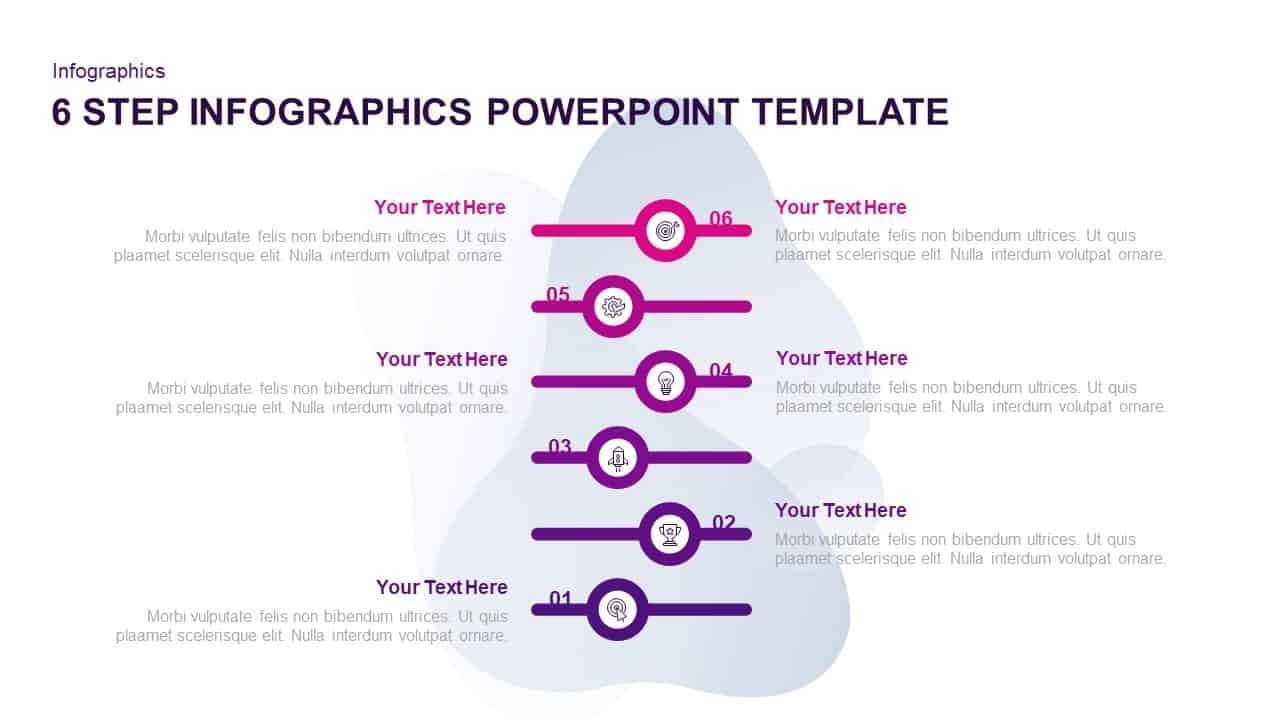
Six-Step Purple Gradient Infographics Template for PowerPoint & Google Slides
Process
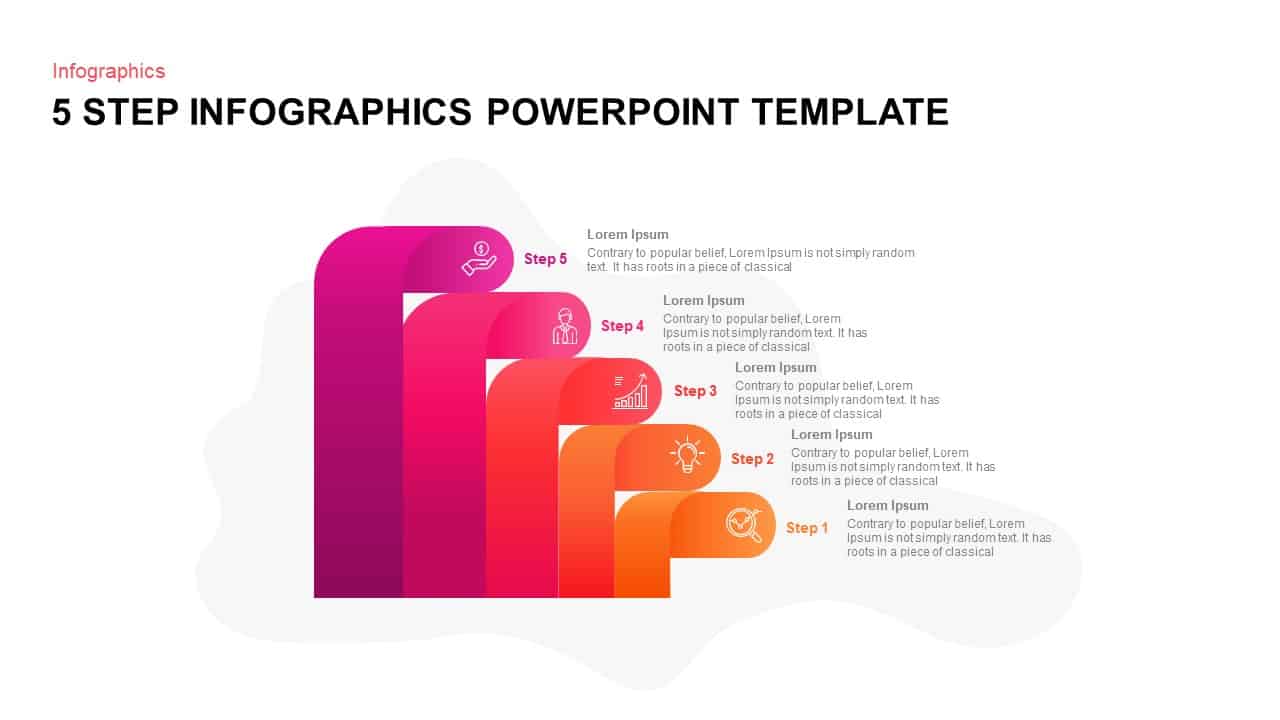
Gradient 5-Step Infographic Process Template for PowerPoint & Google Slides
Process
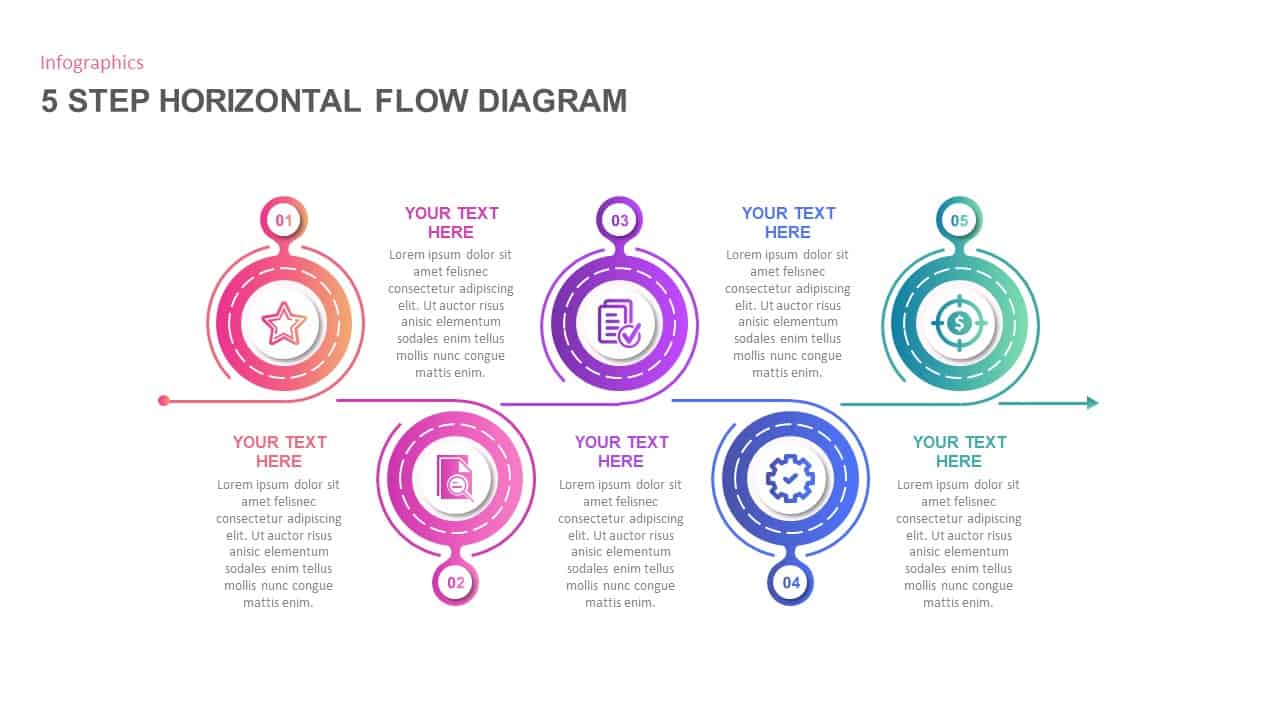
5-Step Circular Gradient Process Flow Template for PowerPoint & Google Slides
Process

Modern Ten-Block Section Title Chart template for PowerPoint & Google Slides
Comparison
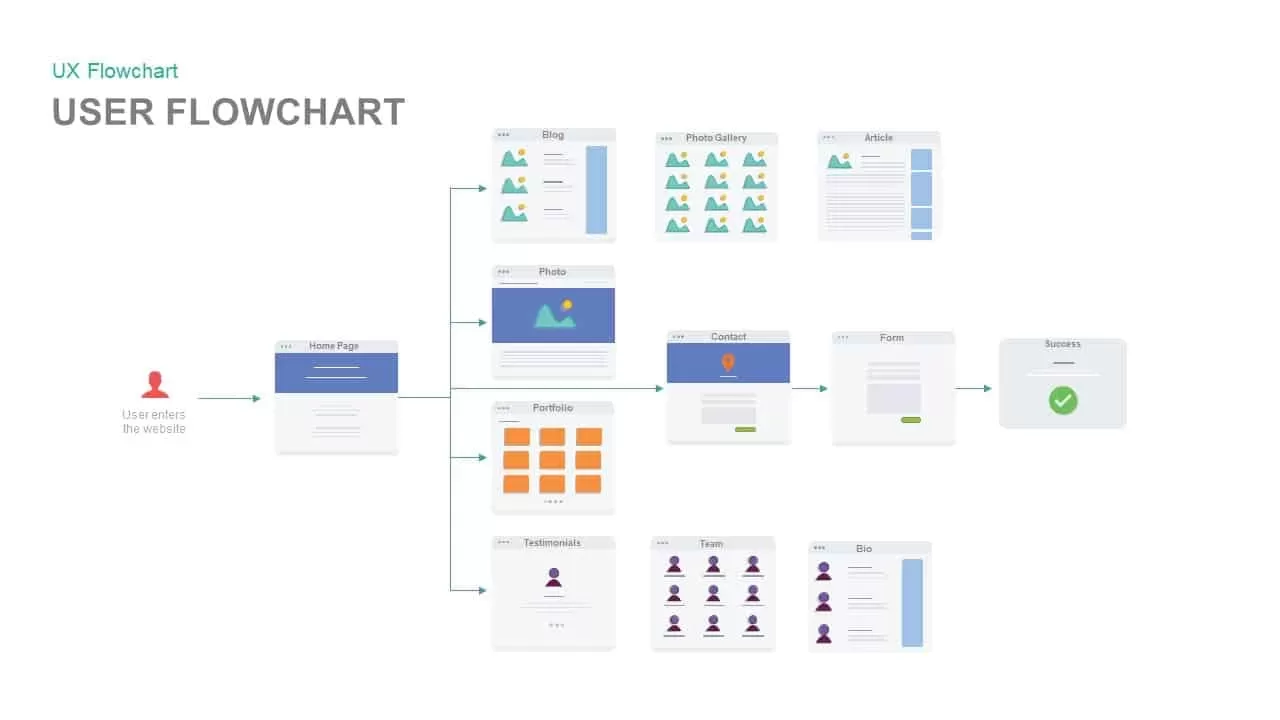
Website User Flowchart Diagram Template for PowerPoint & Google Slides
Process
Simple Flowchart Process Diagram Template for PowerPoint & Google Slides
Flow Charts
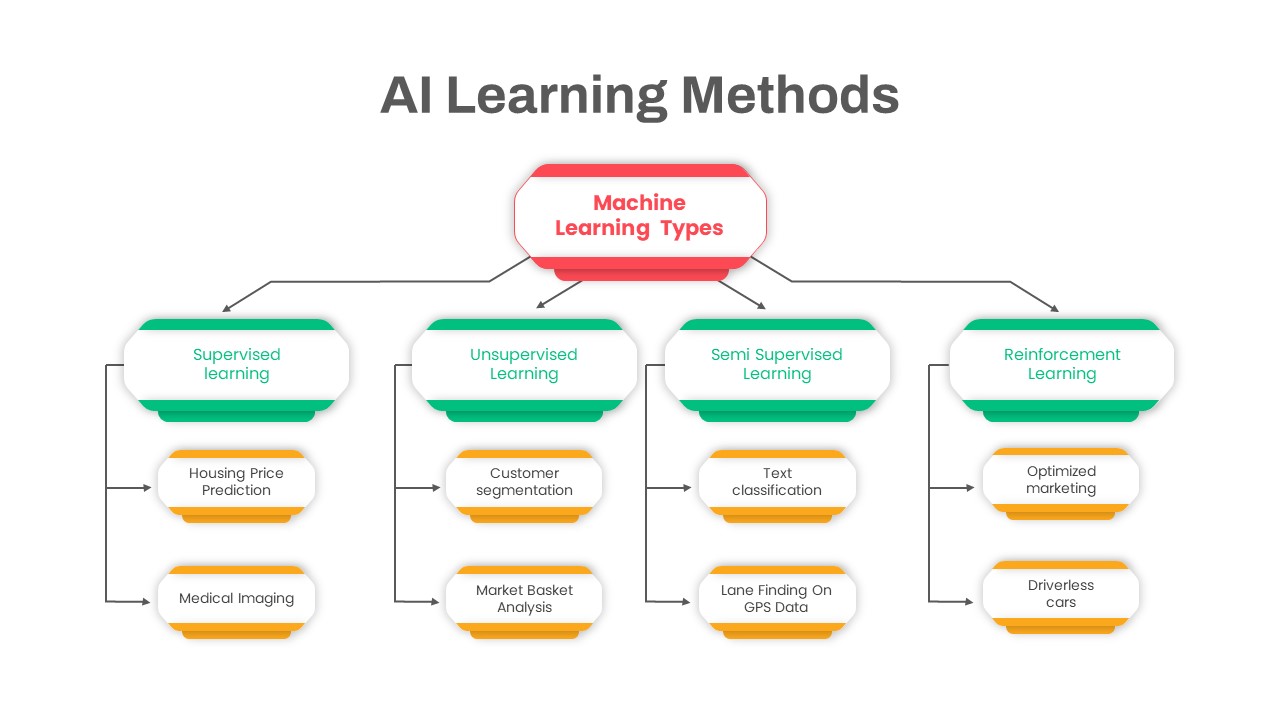
AI Learning Methods Flowchart Diagram Template for PowerPoint & Google Slides
Flow Charts
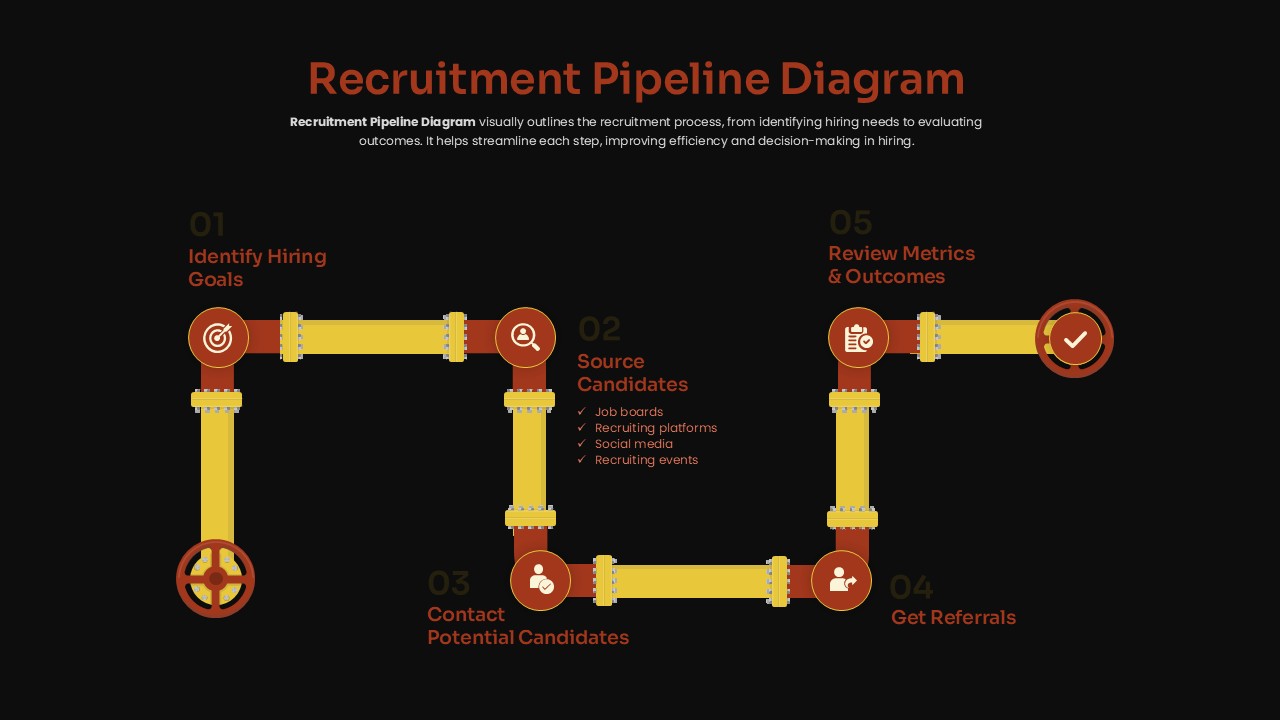
Recruitment Pipeline Flowchart Diagram Template for PowerPoint & Google Slides
Process
10-Point Gradient Agenda Flow Diagram Template for PowerPoint & Google Slides
Agenda
Gradient Clock Agenda Timeline Diagram Template for PowerPoint & Google Slides
Agenda
Gradient SWOT Quadrant Diagram Template for PowerPoint & Google Slides
SWOT
Dark AI Ethics Gradient Diagram Template for PowerPoint & Google Slides
Infographics
Policy Gradient Methods Flow Diagram Template for PowerPoint & Google Slides
AI
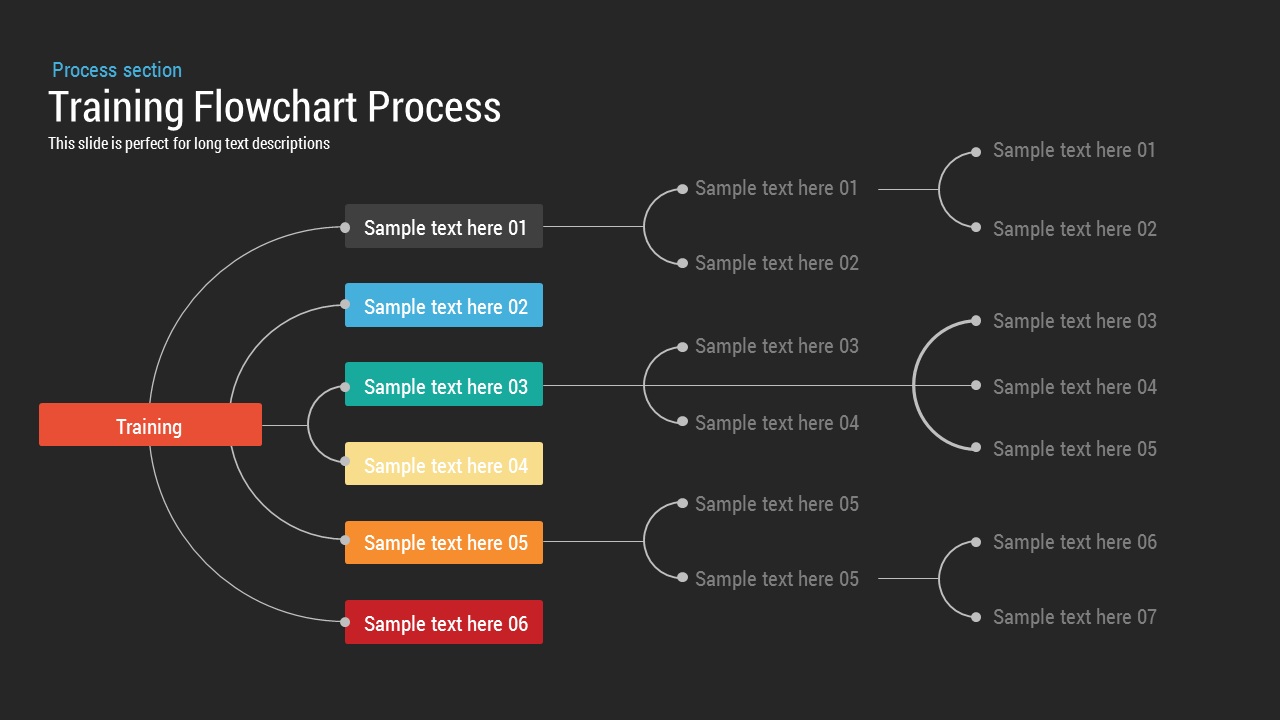
Training Process Flowchart PowerPoint Template
Flow Charts
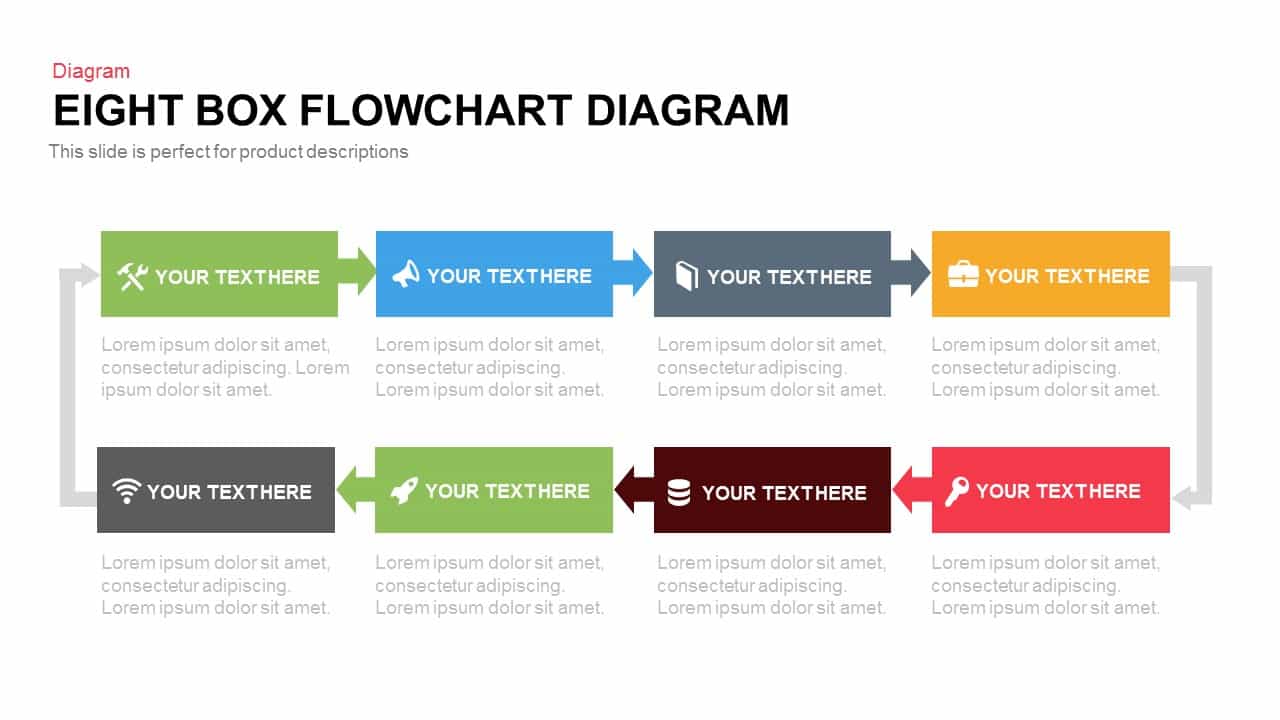
Eight Box Flowchart template for PowerPoint & Google Slides
Flow Charts

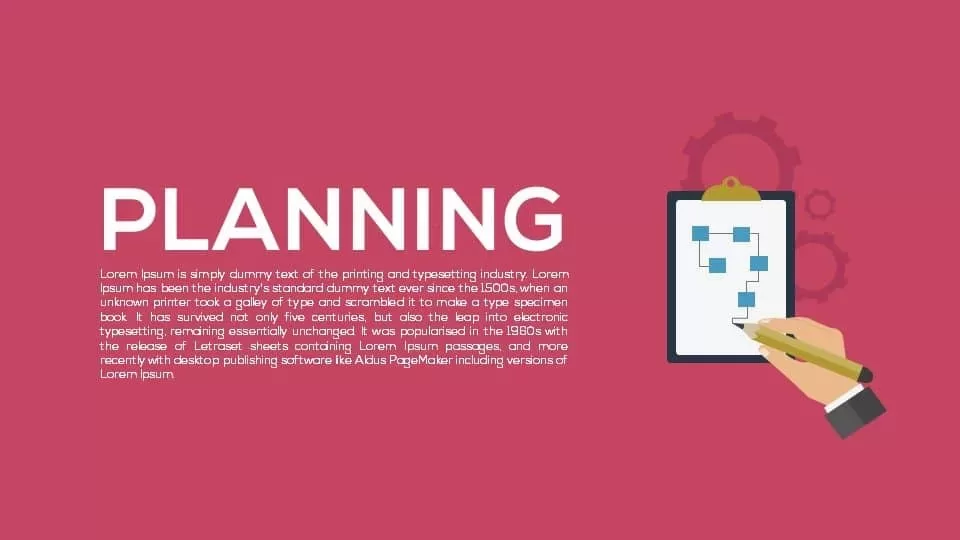
Planning Metaphor Flowchart Slide Template for PowerPoint & Google Slides
Process

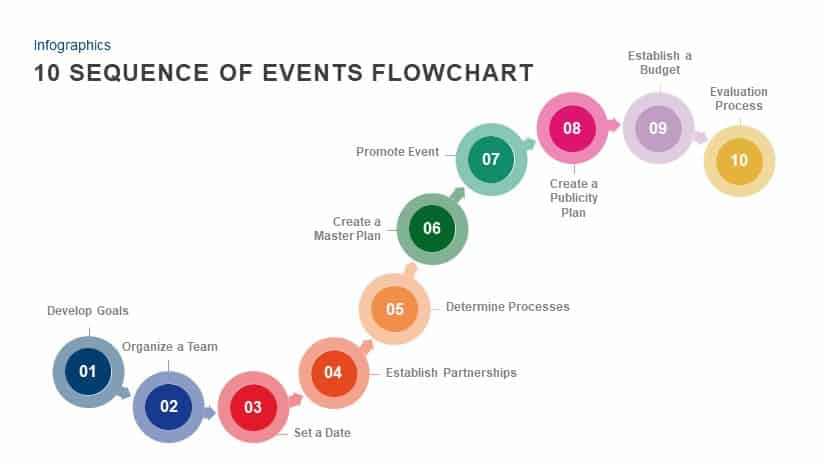
10 Sequence of Events Flowchart template for PowerPoint & Google Slides
Flow Charts
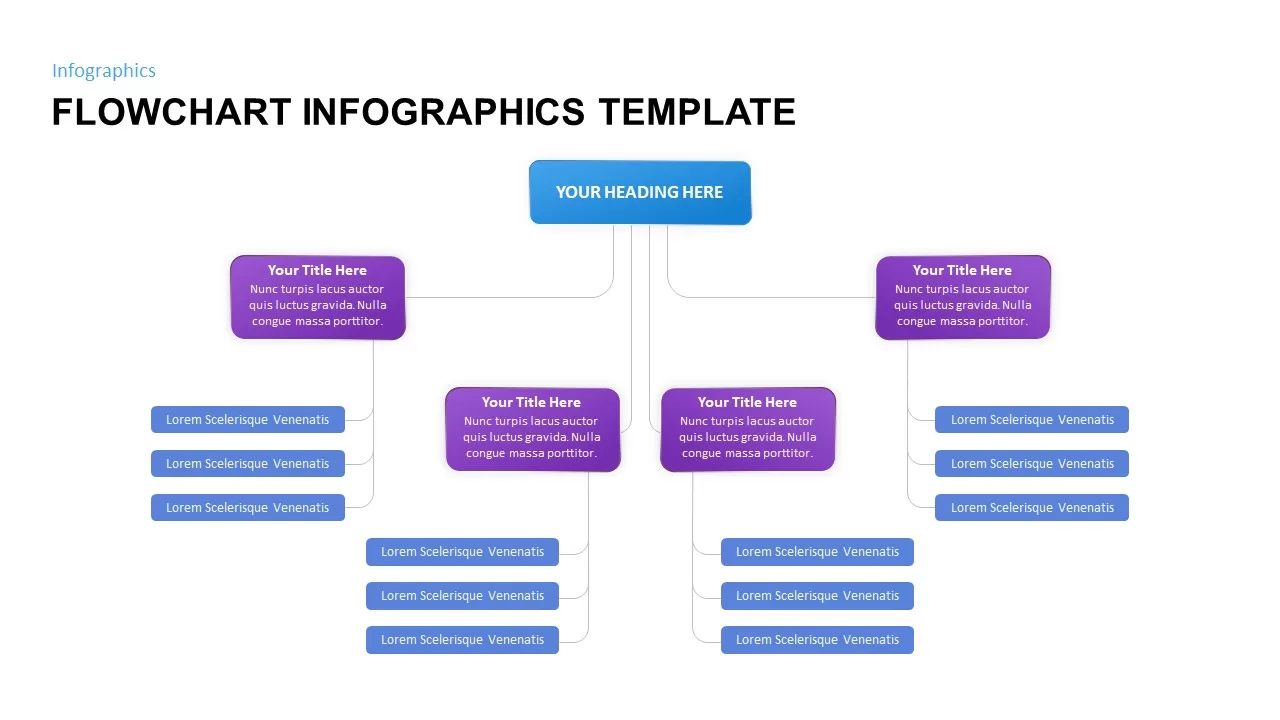
Flowchart Infographics Template for PowerPoint & Google Slides
Infographics
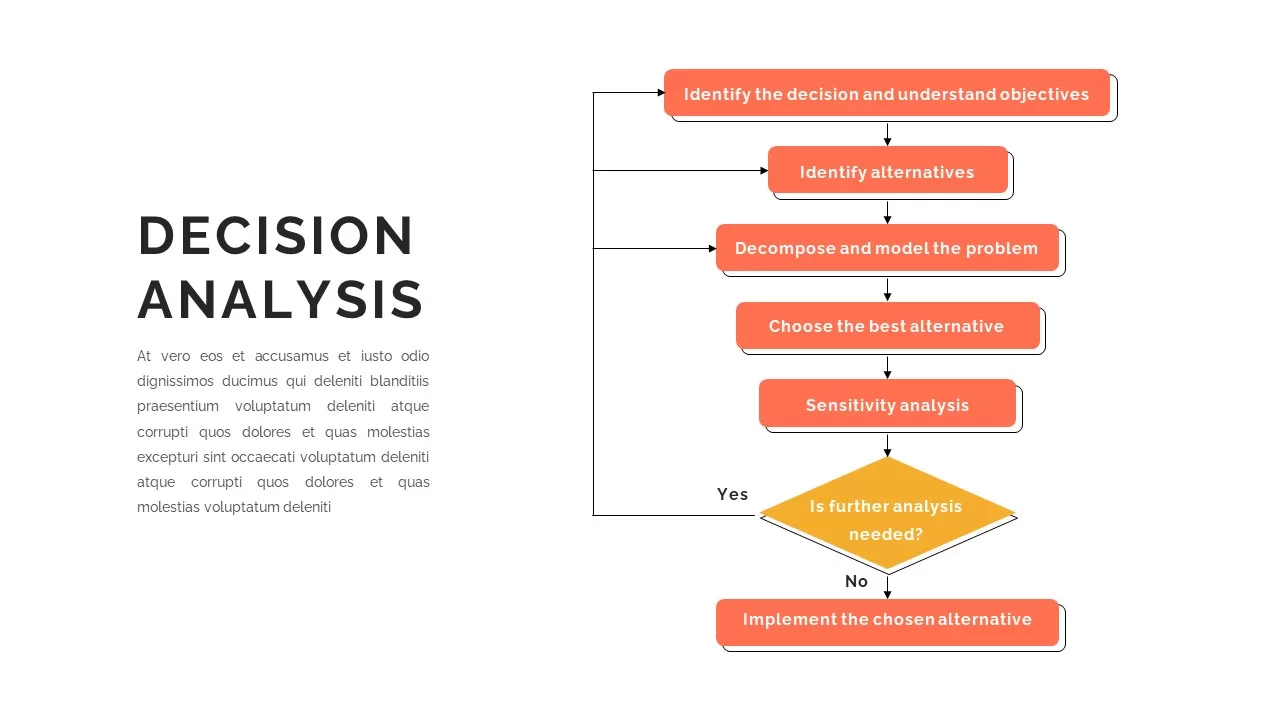
Decision Analysis Process Flowchart Template for PowerPoint & Google Slides
Flow Charts
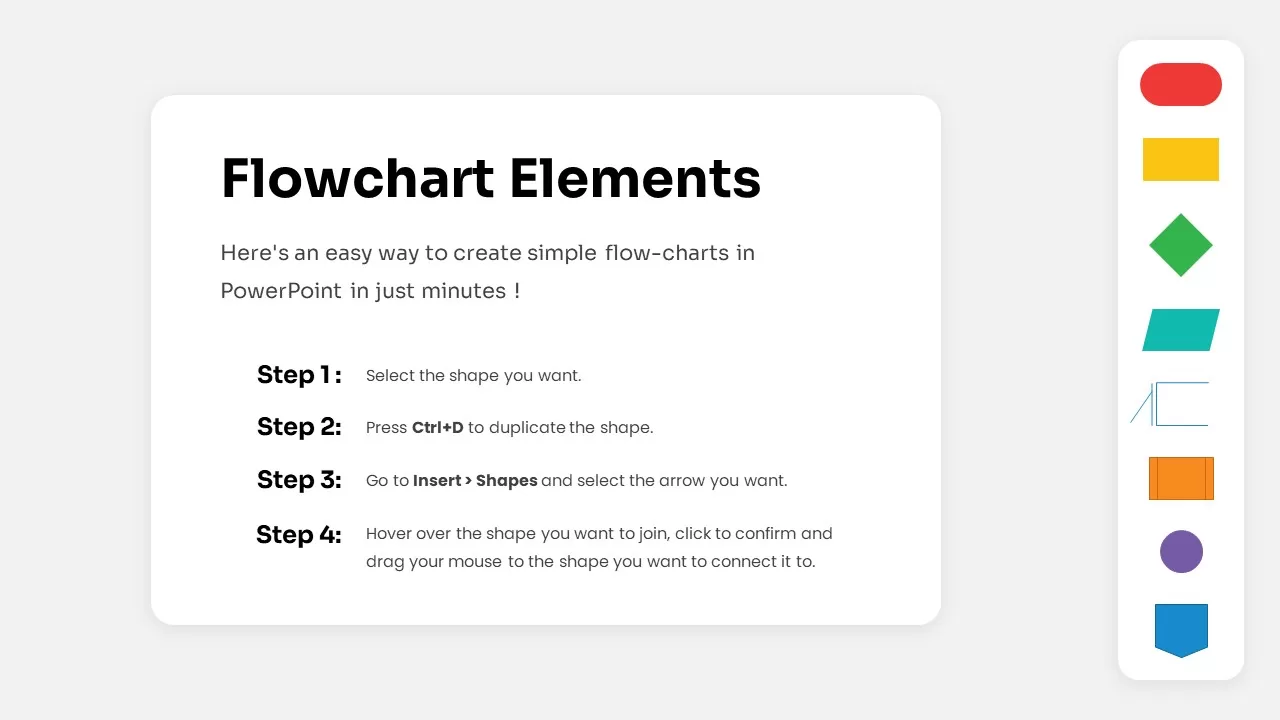
Free Flowchart Elements Tutorial Slide Template for PowerPoint & Google Slides
Flow Charts
Free
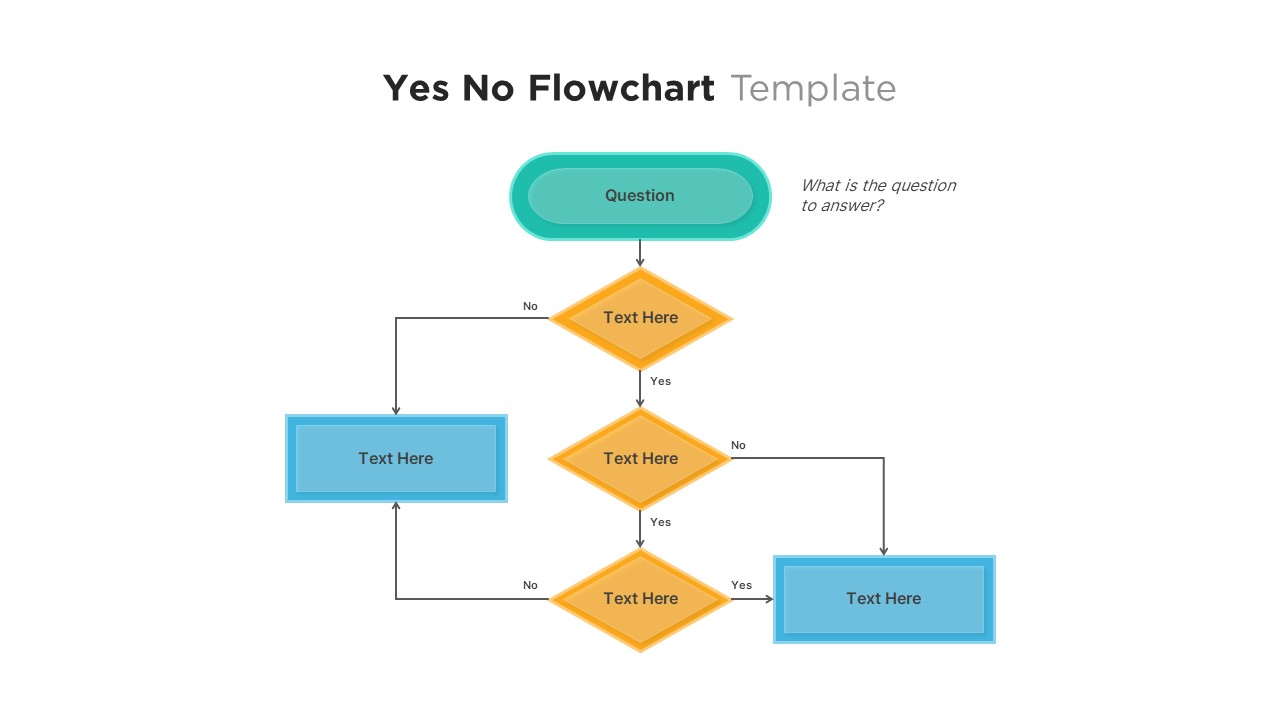
Yes No Flowchart PowerPoint Template
Flow Charts
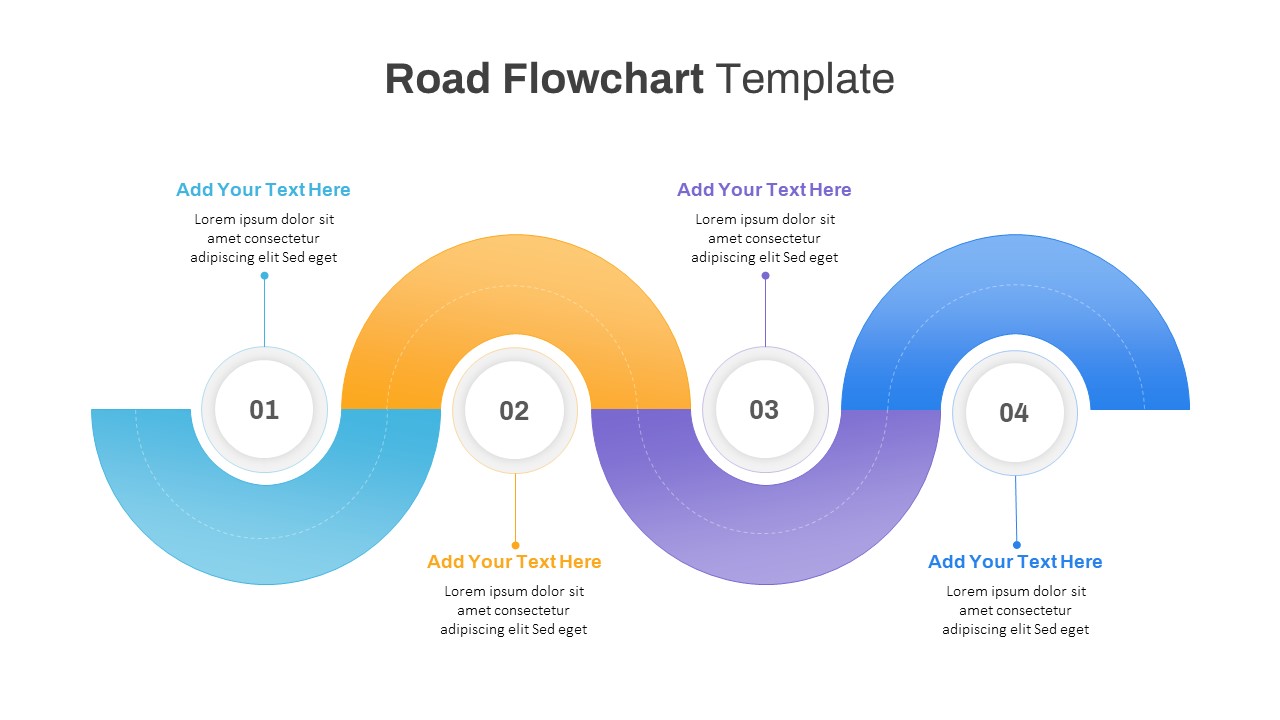
Road Flowchart Process with Four Steps Template for PowerPoint & Google Slides
Flow Charts
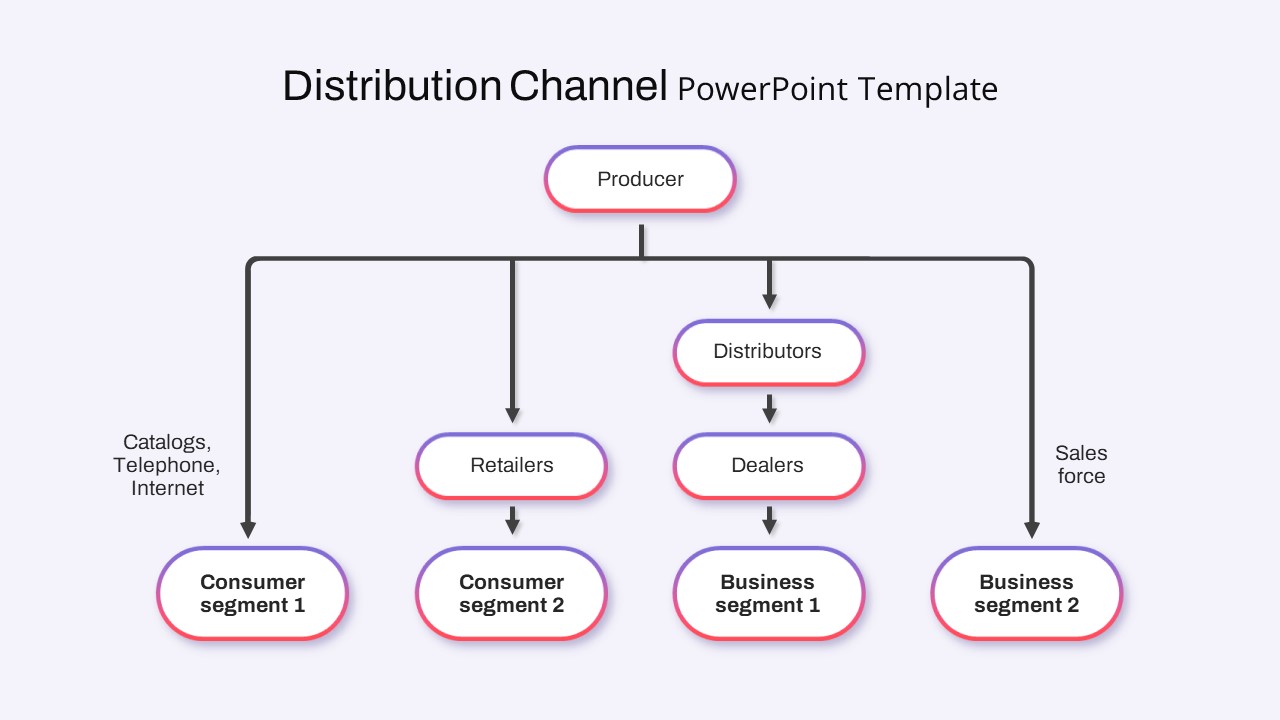
Distribution Channel Flowchart Template for PowerPoint & Google Slides
Business Models
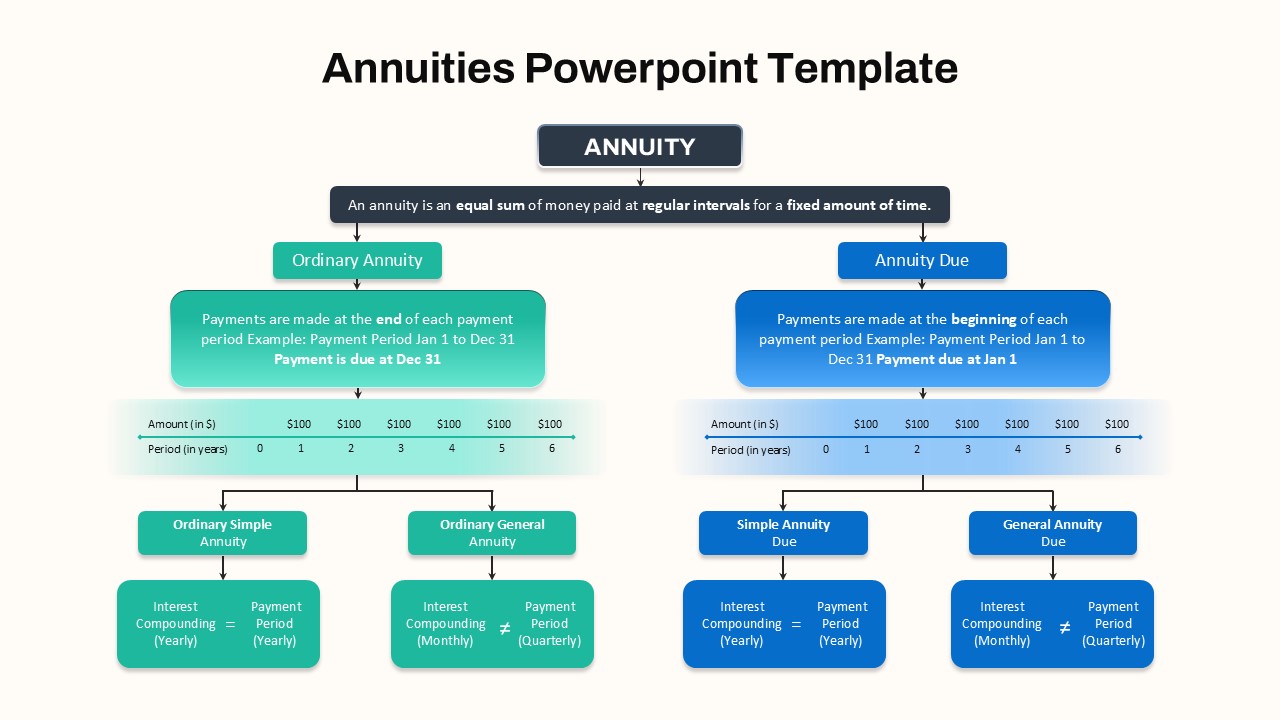
Hierarchical Annuity Comparison Flowchart Template for PowerPoint & Google Slides
Business Report
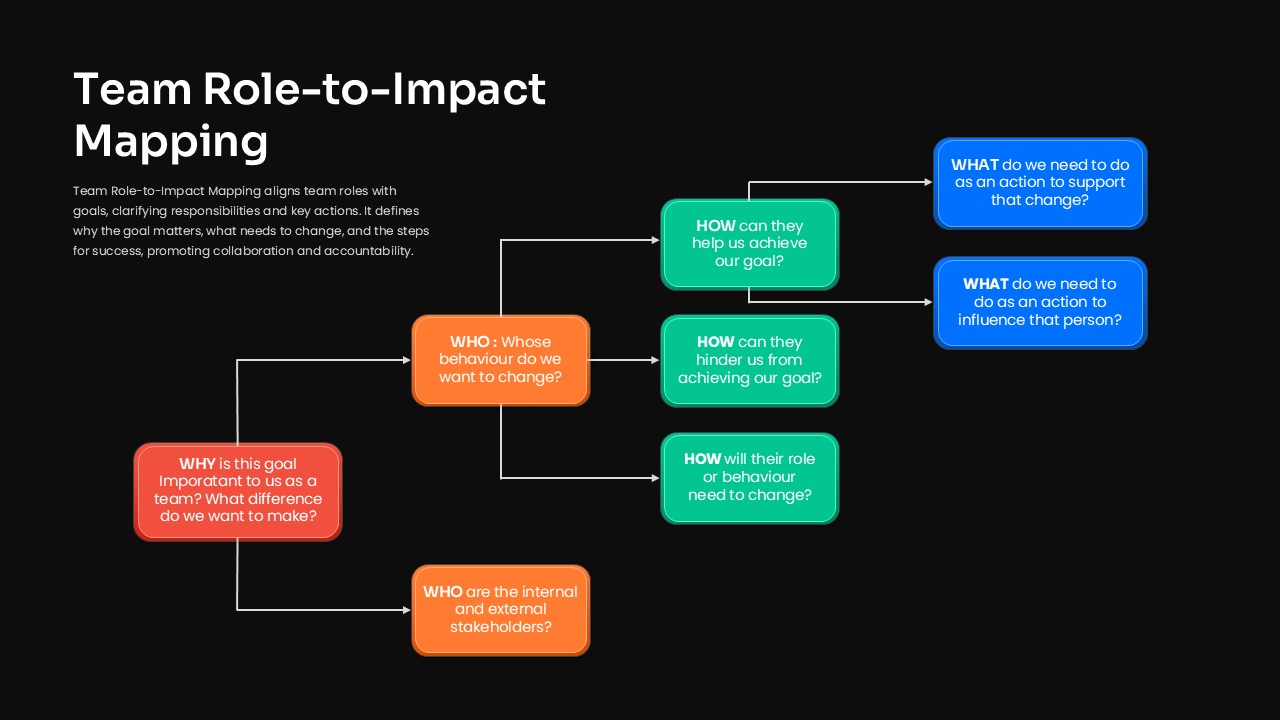
Team Role-to-Impact Mapping Flowchart Template for PowerPoint & Google Slides
Process
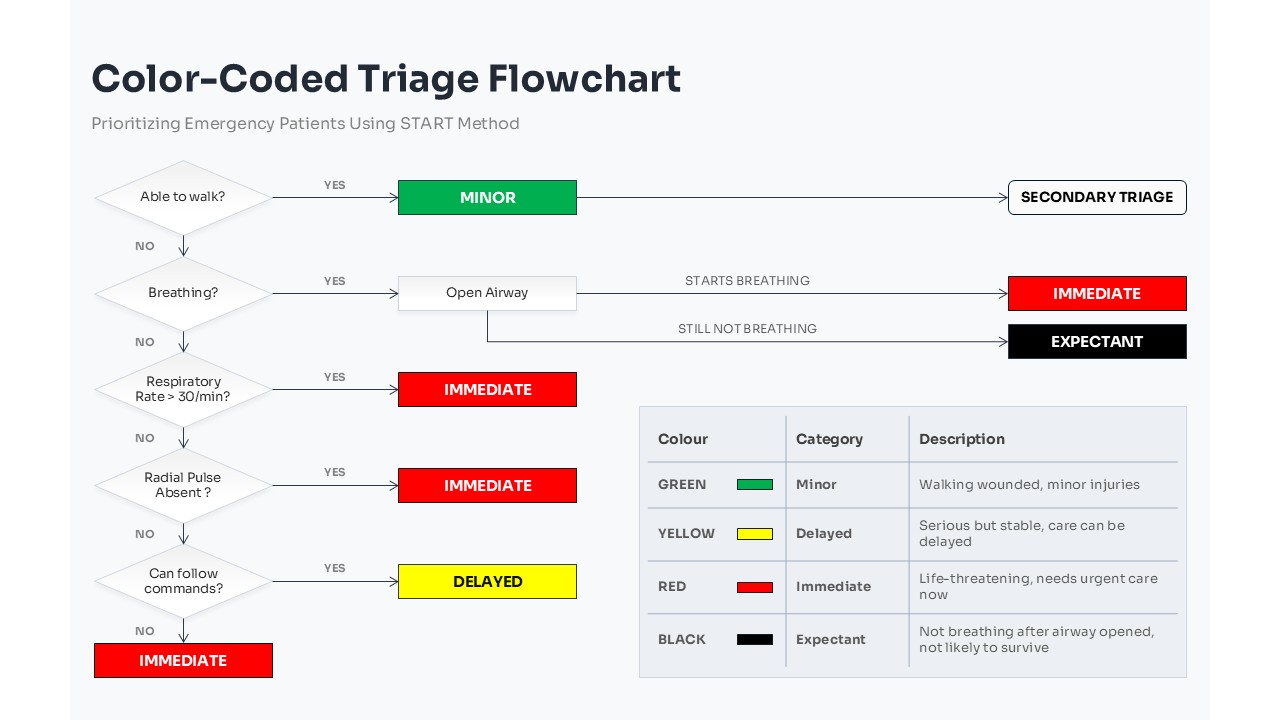
Color-Coded Medical Triage Flowchart Template for PowerPoint & Google Slides
Flow Charts
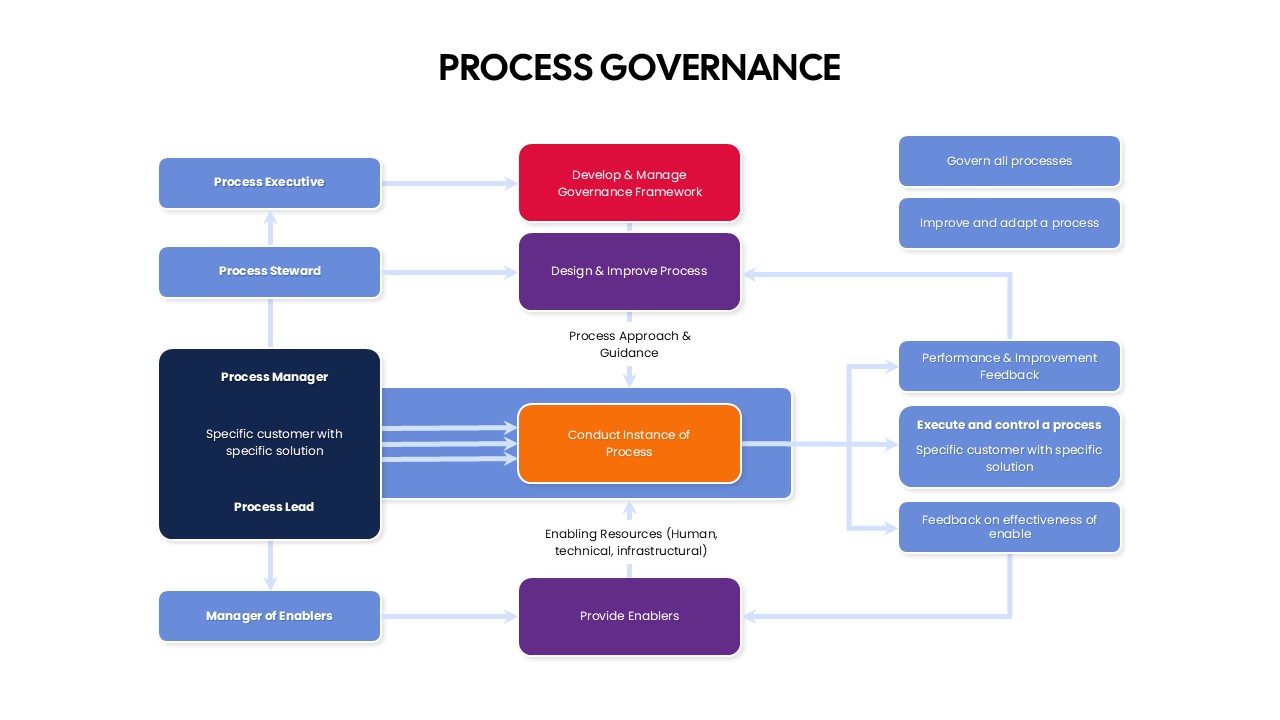
Process Governance Framework Flowchart Template for PowerPoint & Google Slides
Flow Charts
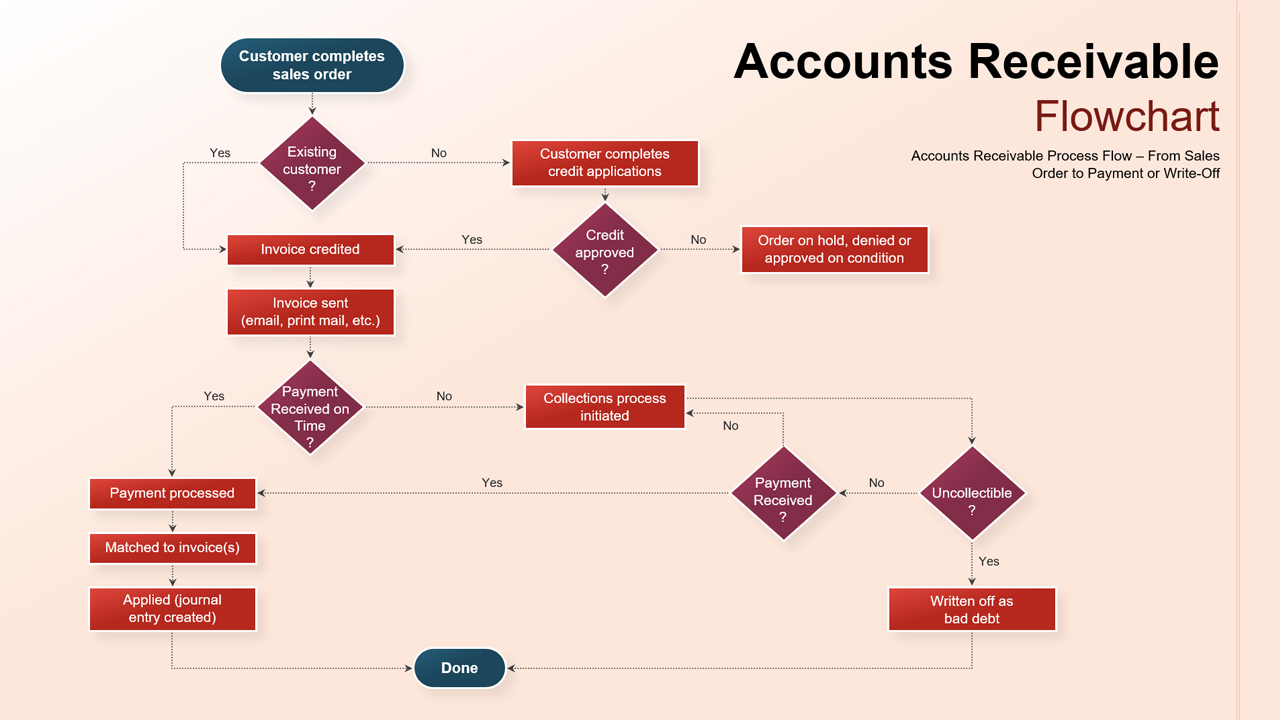
Accounts Receivable Process Flowchart Template for PowerPoint & Google Slides
Flow Charts
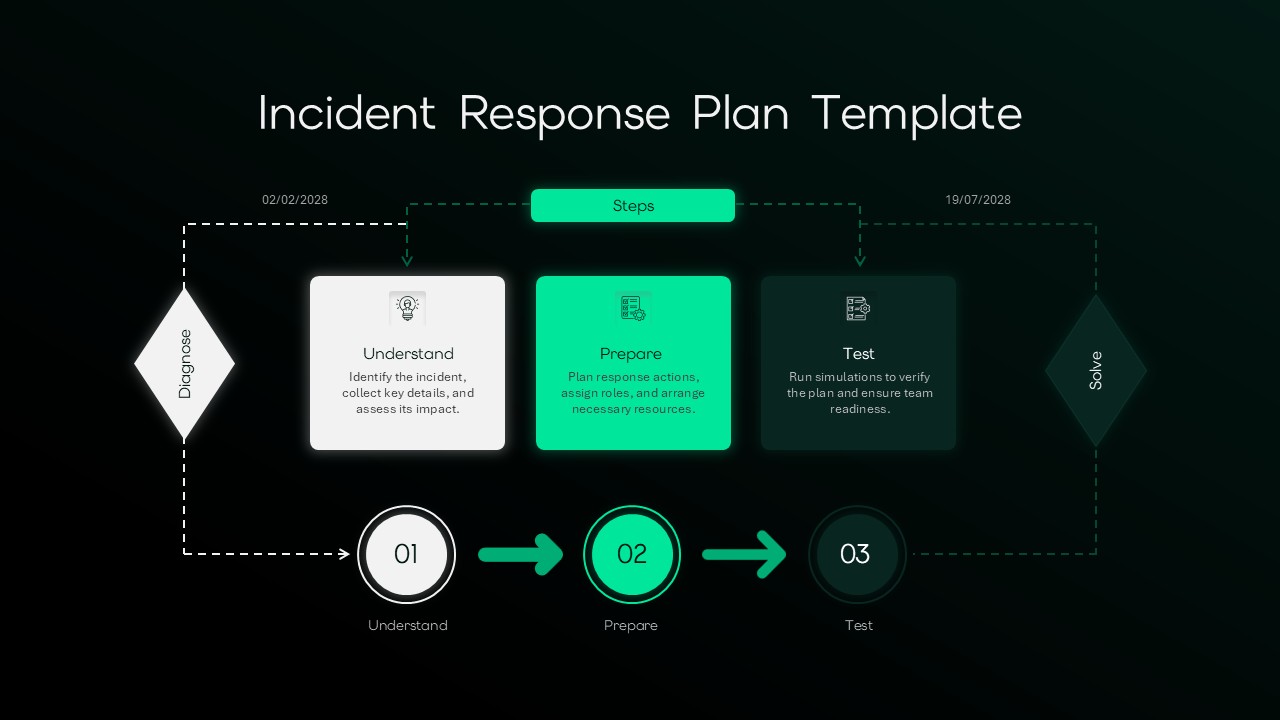
Incident Response Plan Flowchart Template for PowerPoint & Google Slides
Risk Management

Free Modern Gradient Wave Welcome Slides Template for PowerPoint & Google Slides
Free
Free
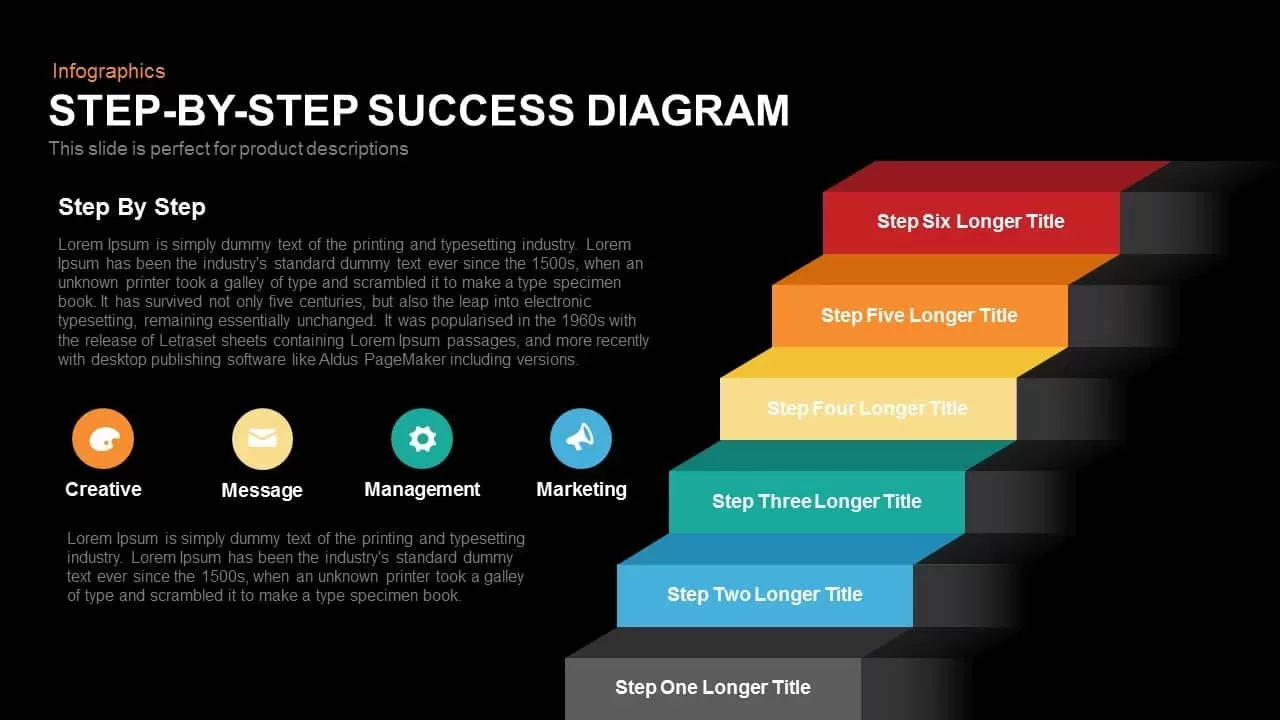
Step-by-Step Success Staircase Diagram template for PowerPoint & Google Slides
Process
PowerPoint Meeting Agenda Template
Business Report
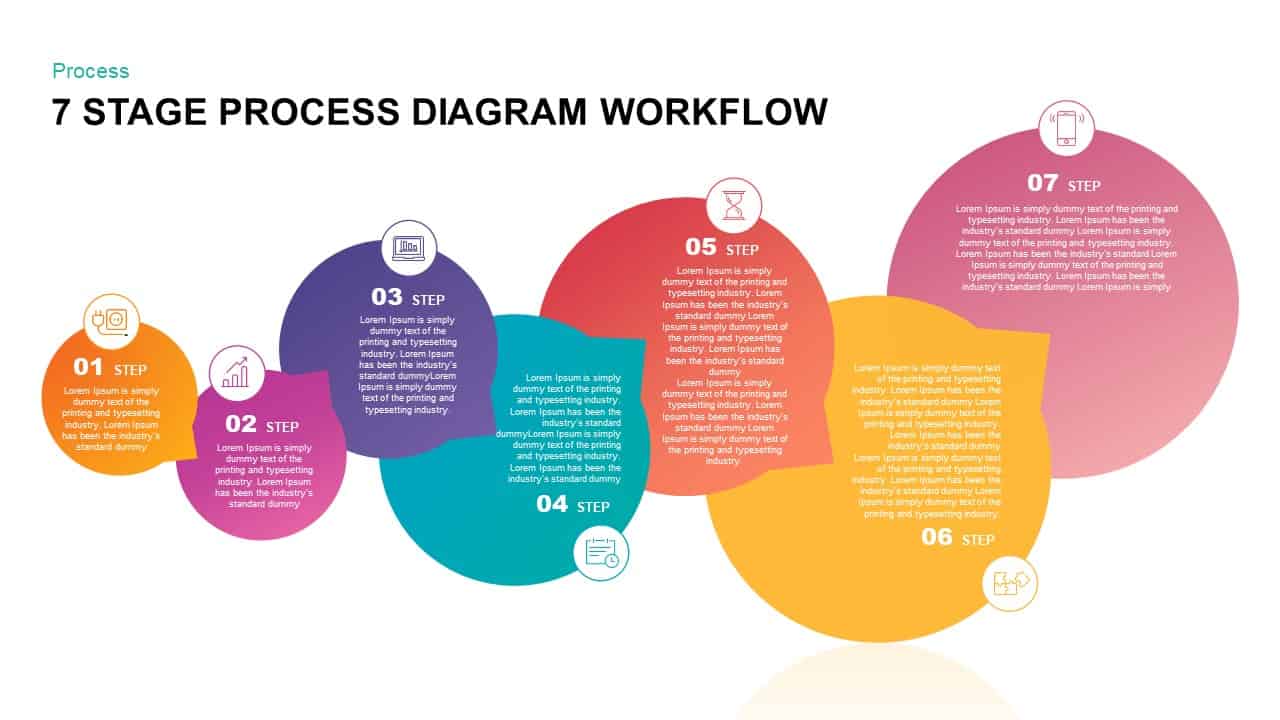
Gradient Seven-Stage Bubble Workflow Template for PowerPoint & Google Slides
Process
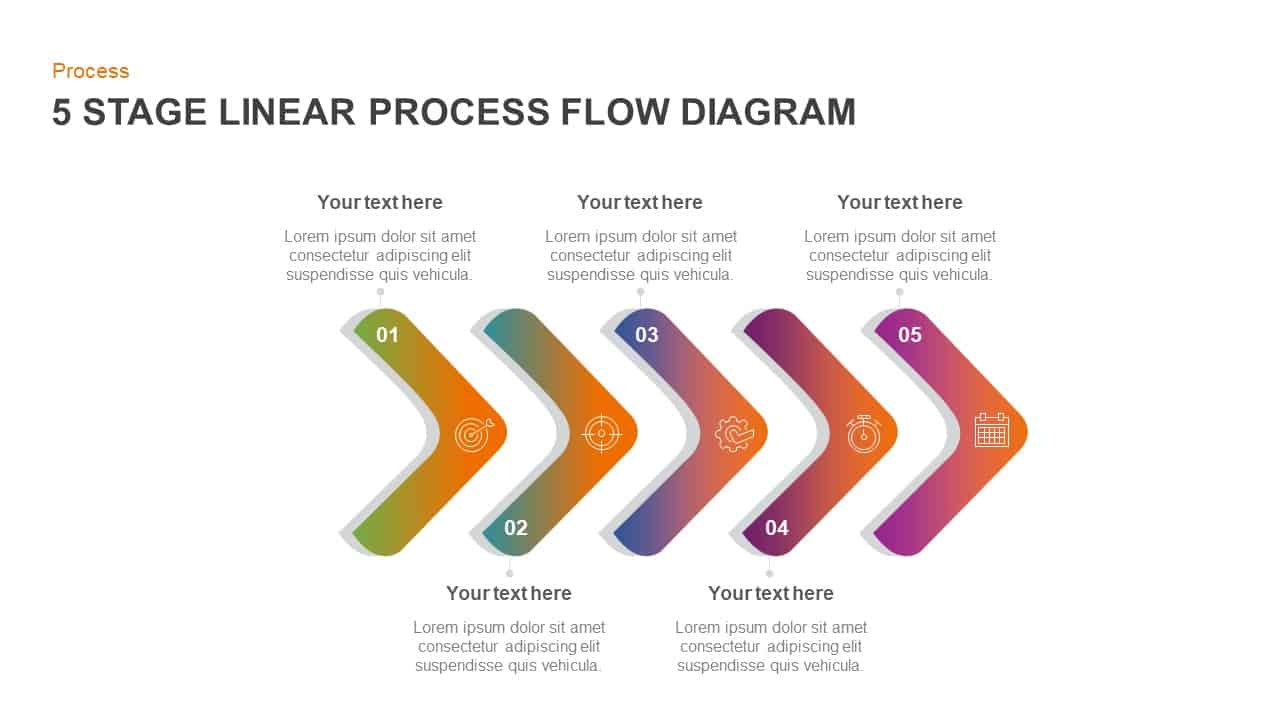
Gradient Chevron Five-Stage Process Flow Template for PowerPoint & Google Slides
Arrow
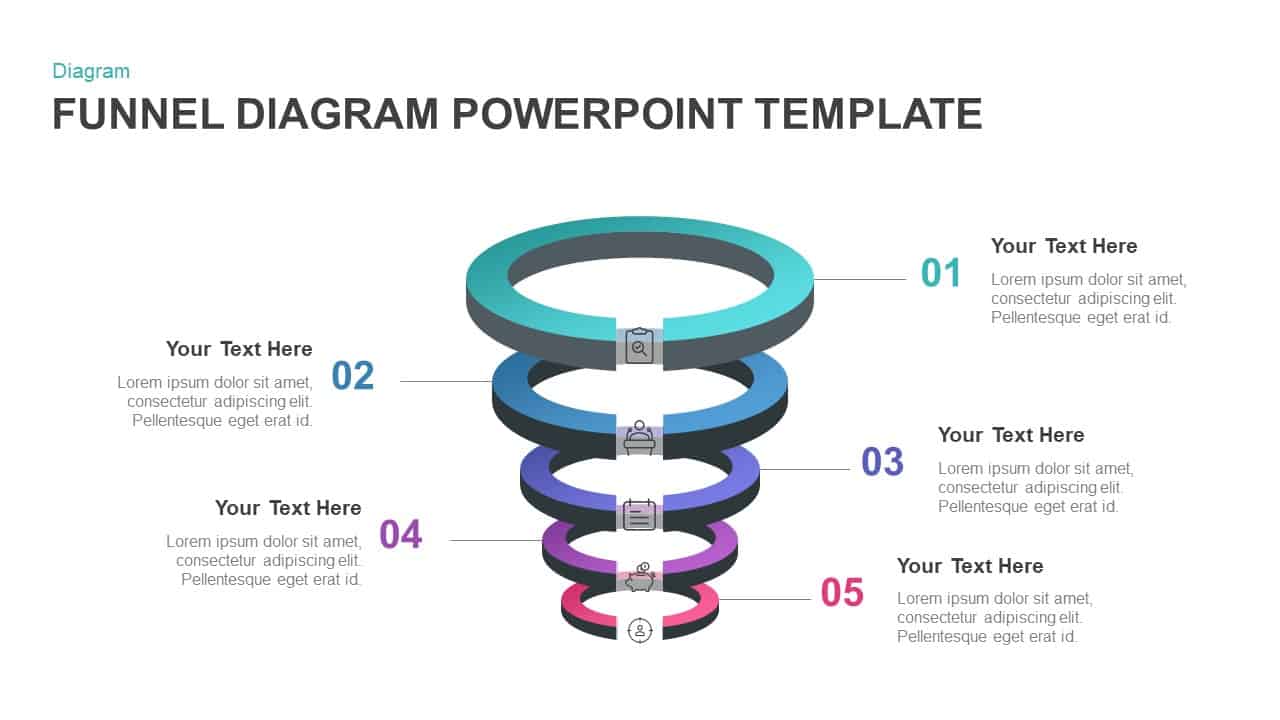
Gradient 5-Stage Funnel Infographic Template for PowerPoint & Google Slides
Funnel
Five-Year Gradient Timeline Infographic Template for PowerPoint & Google Slides
Timeline
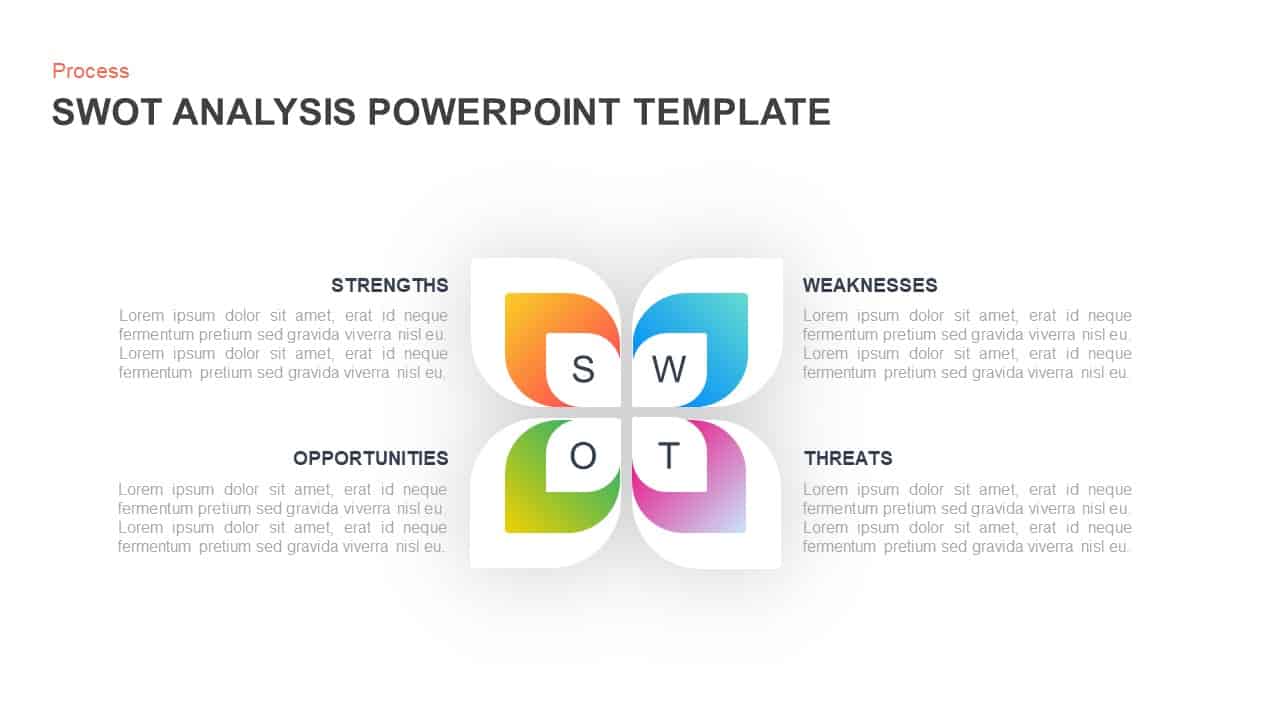
Gradient Petal SWOT Analysis Quadrant Template for PowerPoint & Google Slides
SWOT
Gradient Business Company Profile Template for PowerPoint & Google Slides
Company Profile
Gradient Annual Plan & Strategy Deck Template for PowerPoint & Google Slides
Decks
Purple Gradient Company Profile Deck Template for PowerPoint & Google Slides
Company Profile
Gradient Company Profile Presentation Template for PowerPoint & Google Slides
Company Profile
Cybersecurity Presentation Template
Company Profile
Duotone Gradient PowerPoint & Google Slides Template for Presentations
Technology
Light Duotone Gradient Business Plan PowerPoint & Google Slides Template
Company Profile

Gradient Business Plan Presentation Template for PowerPoint & Google Slides
Business Plan
Cloud Computing PowerPoint Template
Pitch Deck
FinTech Industry Gradient Cover Template for PowerPoint & Google Slides
Pitch Deck
Modern Gradient Startup Pitch Deck Template for PowerPoint & Google Slides
Pitch Deck
Gradient Color Agenda Slide Bundle Template for PowerPoint & Google Slides
Agenda
Modern Gradient Business Plan Deck Template for PowerPoint & Google Slides
Pitch Deck
Vibrant Gradient VC Pitch Deck Template for PowerPoint & Google Slides
Pitch Deck
Gradient Business Strategy Pitch Deck Template for PowerPoint & Google Slides
Pitch Deck
Gradient Triangle Business Plan Deck Template for PowerPoint & Google Slides
Business Plan
IoT Technology Gradient Presentation Template for PowerPoint & Google Slides
Information Technology
Success Marketing Gradient Pamphlet Template for PowerPoint & Google Slides
Marketing
Finance Pitch Deck Template with Green Gradient for PowerPoint & Google Slides
Pitch Deck
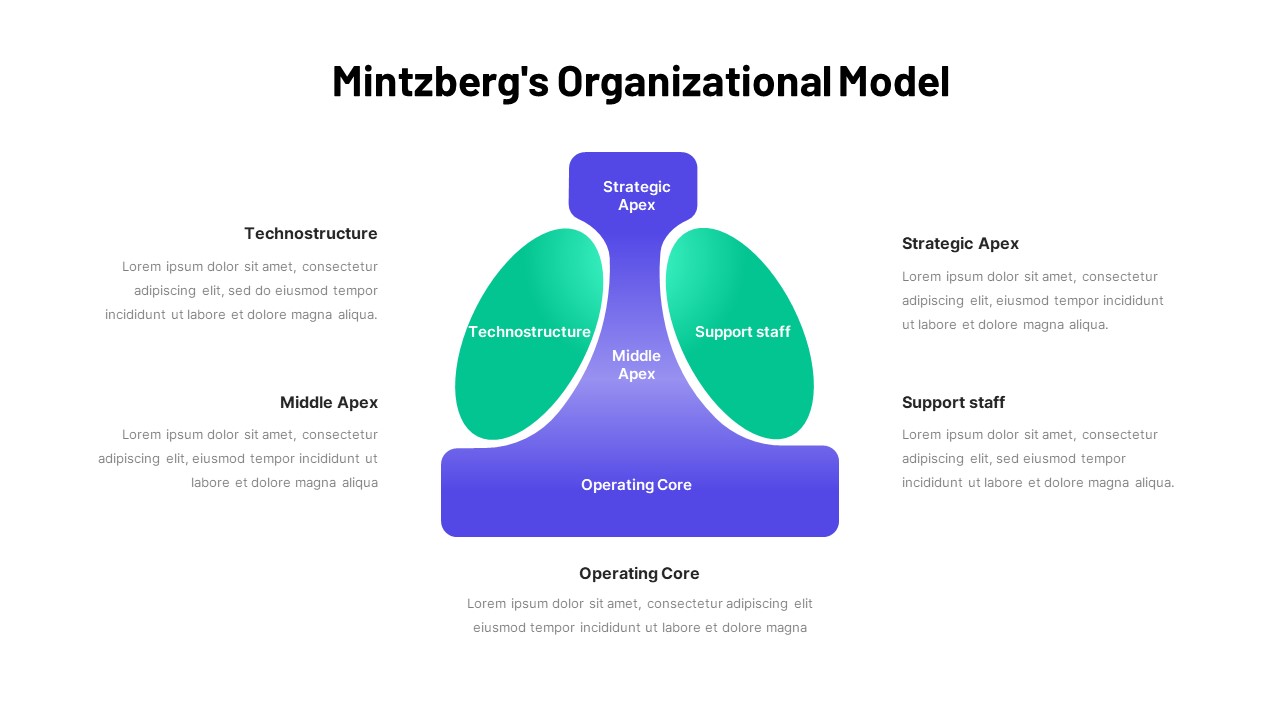
Mintzberg Organizational Model PowerPoint Template
Business
Rectangle Area Chart with Gradient Fill Template for PowerPoint & Google Slides
Comparison Chart
Excel-Driven Gradient Timeline Chart Template for PowerPoint & Google Slides
Free Marketing Plan PowerPoint Template
Marketing
Free
Free Animated Gradient Corporate Presentation Template for PowerPoint & Google Slides
Company Profile
Free
Galaxy Gradient Presentation Template for PowerPoint & Google Slides
Company Profile
Abstract Geometric Gradient Presentation Template for PowerPoint & Google Slides
Pitch Deck
Abstract Gradient Presentation Template for PowerPoint & Google Slides
Pitch Deck
Free Futuristic Neon Gradient Presentation Template for PowerPoint & Google Slides
Pitch Deck
Free
Free Gradient Seminar Workshop Template for PowerPoint & Google Slides
Free
Free
Cyber Security Dark Blue Gradient Template for PowerPoint & Google Slides
Information Technology
Pink Floral Gradient Background Template for PowerPoint & Google Slides
Graphics
Watercolor Splash Gradient Presentation Template for PowerPoint & Google Slides
Pitch Deck
Abstract Dark Gradient Presentation Template for PowerPoint & Google Slides
Pitch Deck
Green Organic Gradient Background Template for PowerPoint & Google Slides
Company Profile
Free Event Management Gradient Template for PowerPoint & Google Slides
Company Profile
Free
AI & Future of Work Gradient Cover Slide Template for PowerPoint & Google Slides
AI
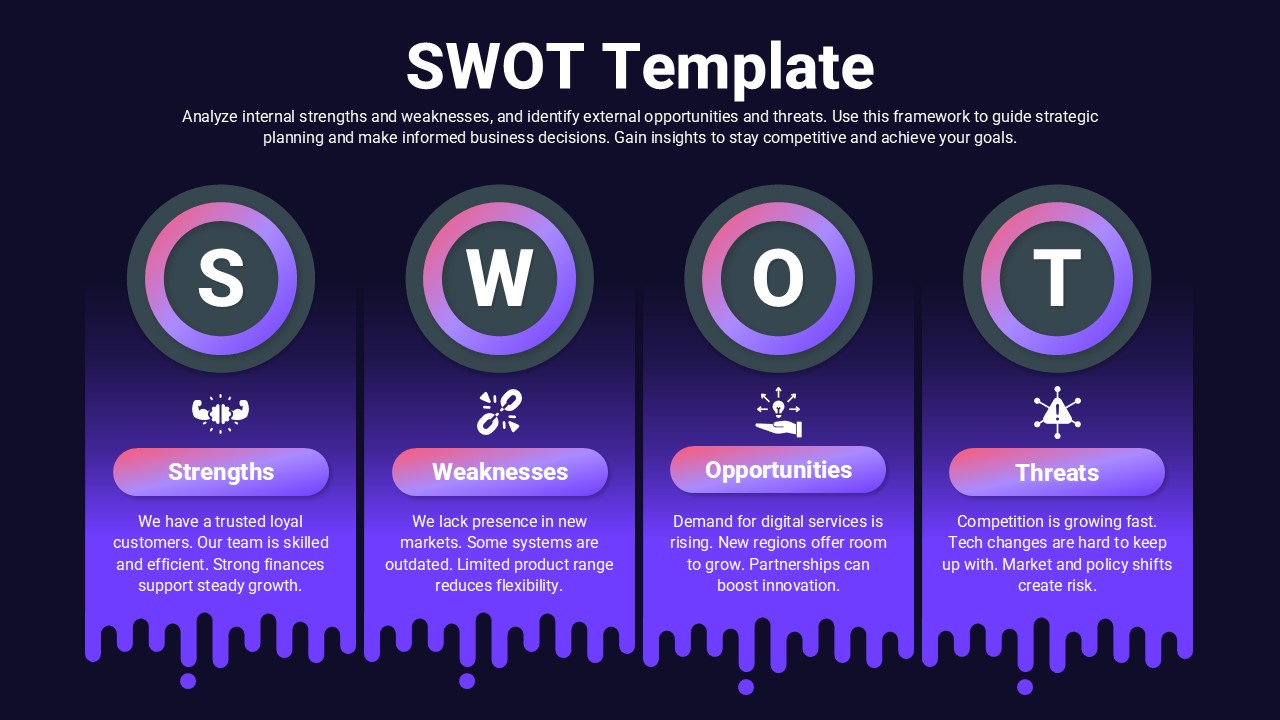
Neon Gradient SWOT Business Template for PowerPoint & Google Slides
SWOT

Active Gradient Business Pitch Deck for PowerPoint & Google Slides
Pitch Deck
Free
Blue Green Gradient PowerPoint Presentation Template
Company Profile
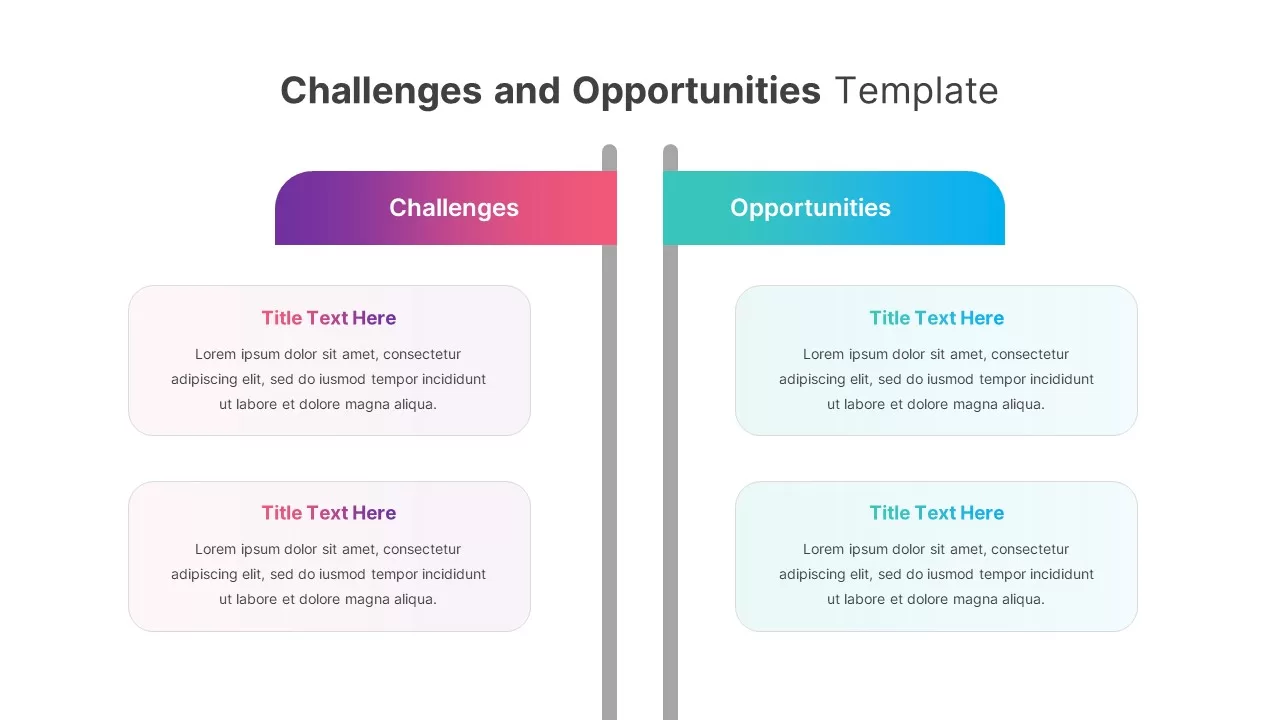
Gradient Challenges and Opportunities Slide for PowerPoint & Google Slides
Opportunities Challenges
Free Gradient Background PowerPoint Template
Graphics
Free
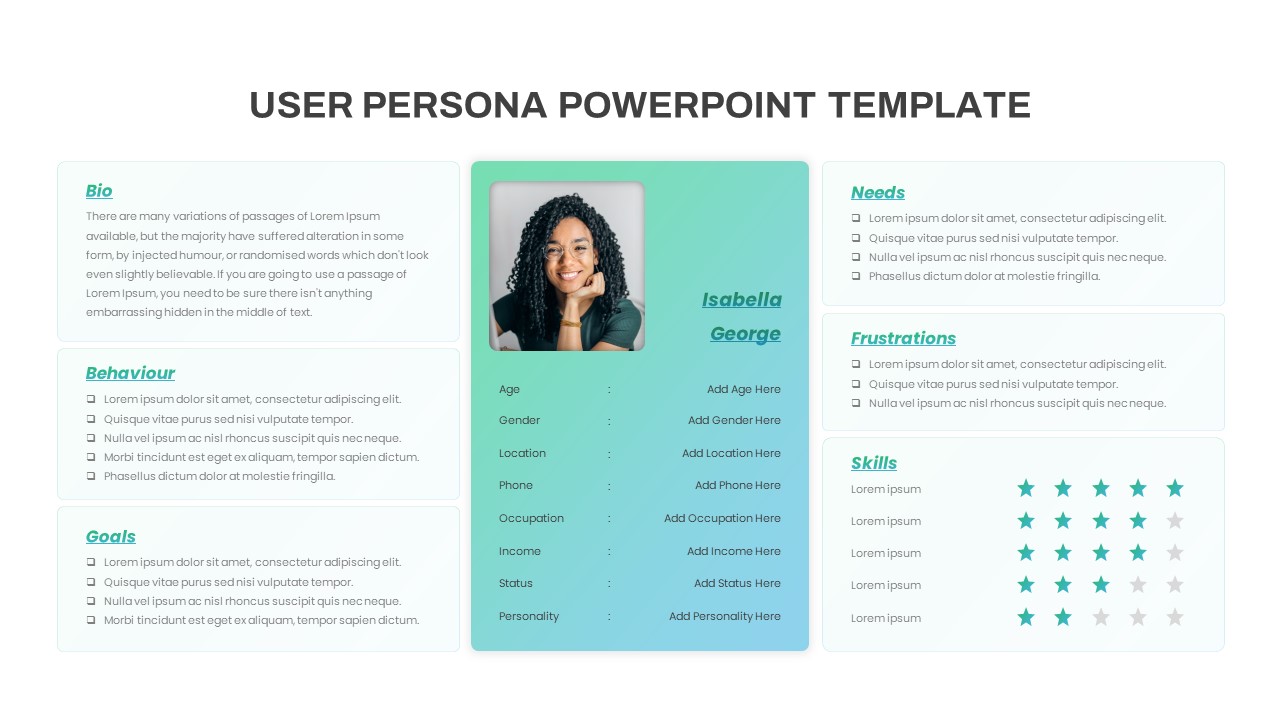
Free Gradient User Persona Profile Slide for PowerPoint & Google Slides
Recruitment
Free
Vibrant Abstract Gradient Theme for PowerPoint & Google Slides
Decks
Fintech Gradient Slide Deck for PowerPoint & Google Slides
Decks
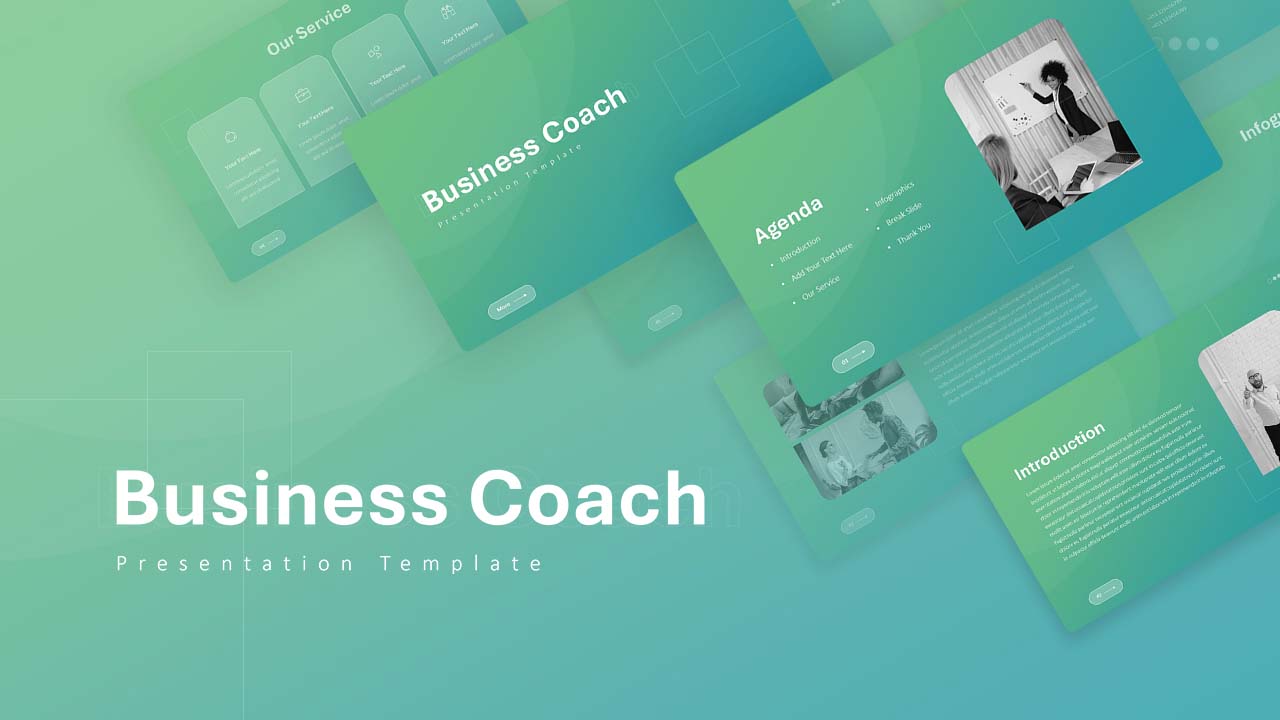
Business Coach Gradient Deck for PowerPoint & Google Slides
Business

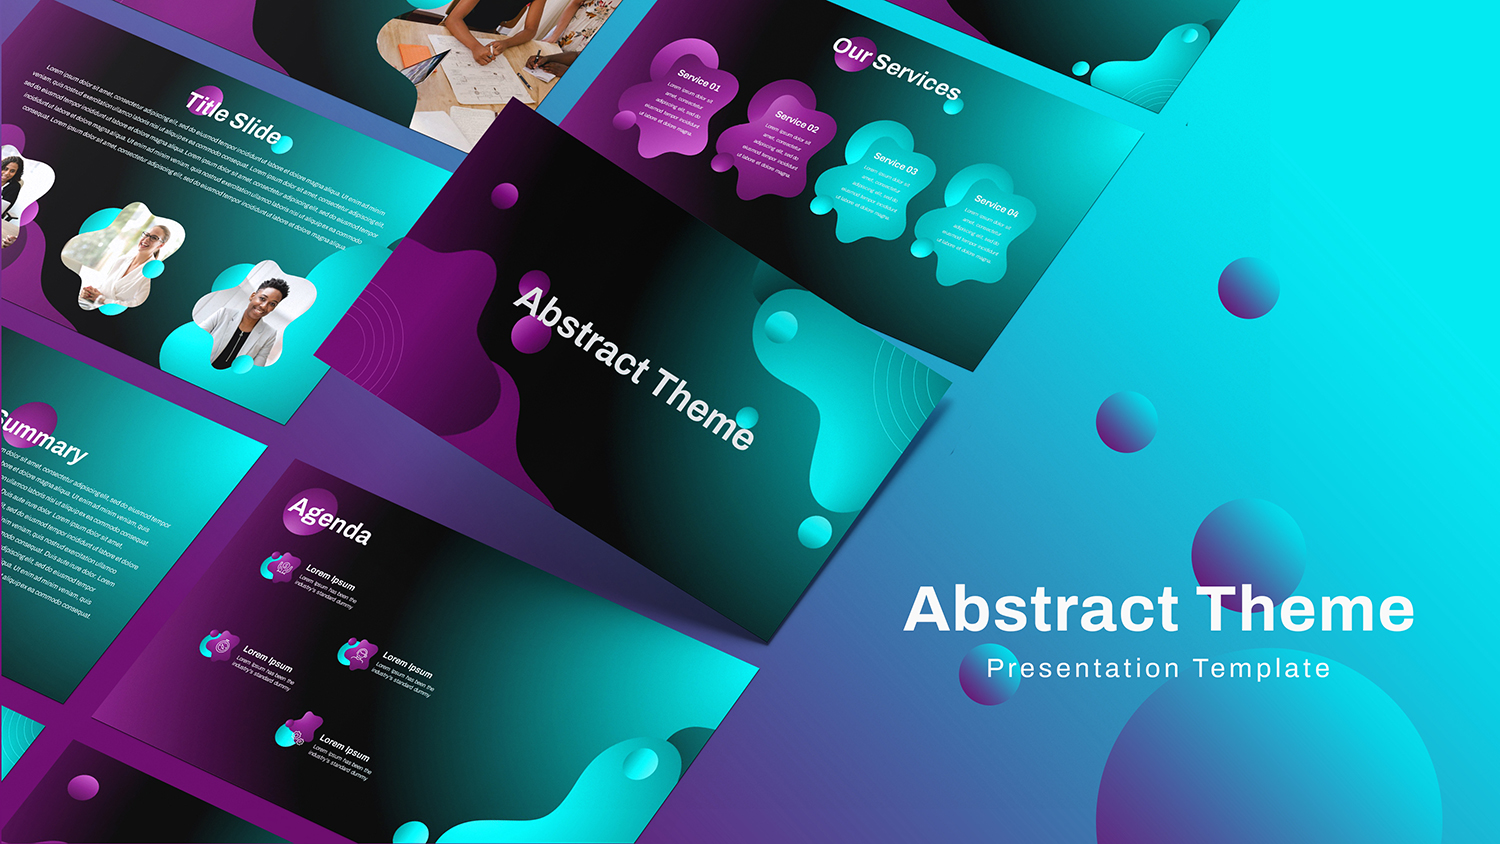
Gradient Abstract Business Deck for PowerPoint & Google Slides
Decks
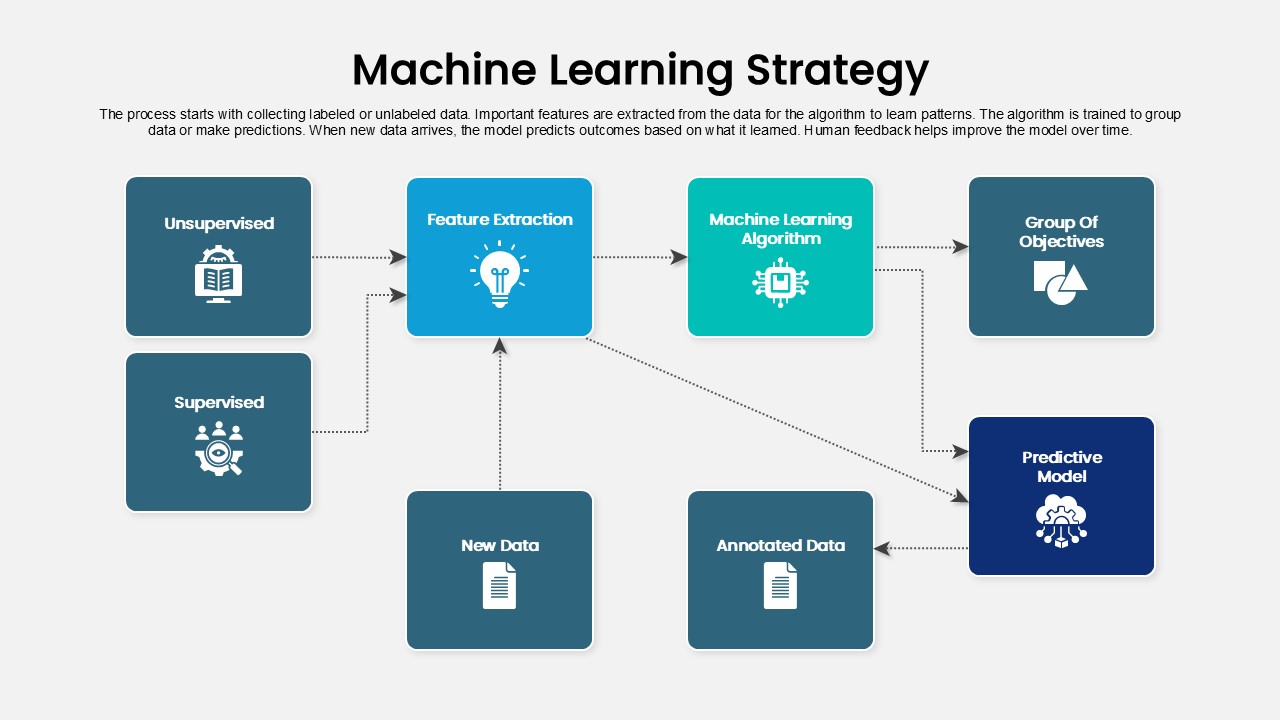
Machine Learning Strategy Flowchart
Machine Learning
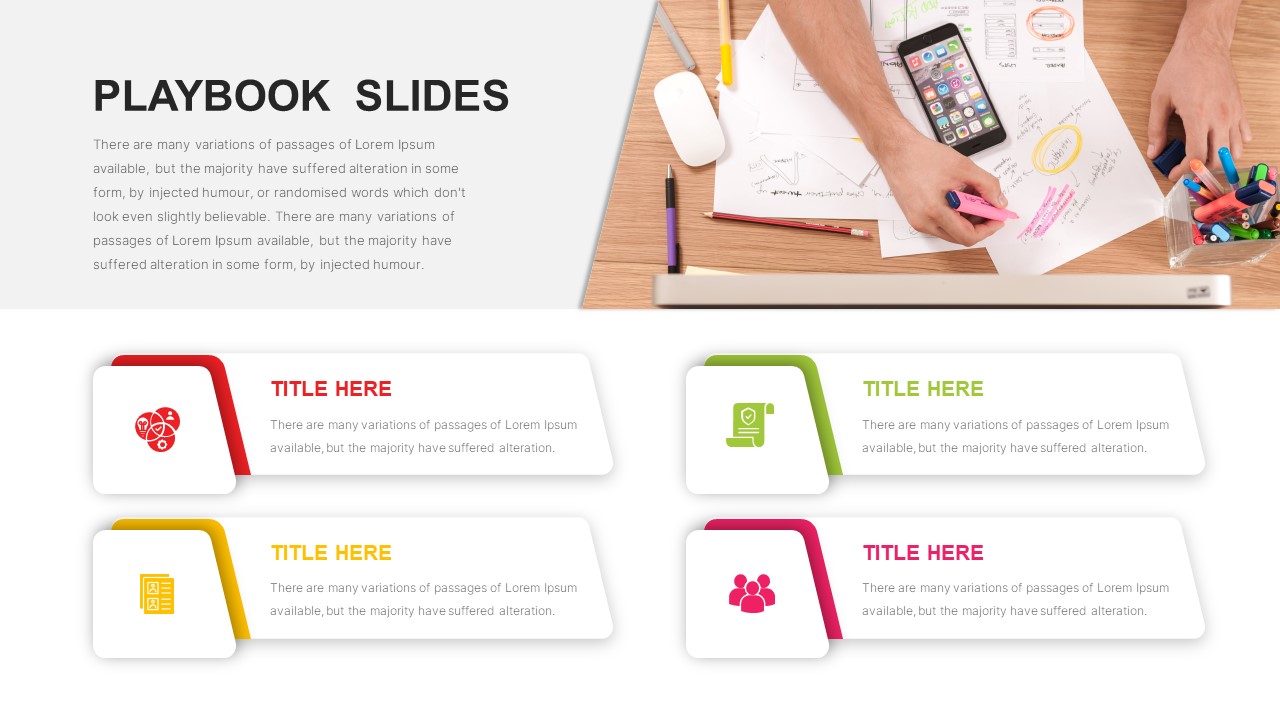
Sales Playbook Step-by-Step Process Template for PowerPoint & Google Slides
Process
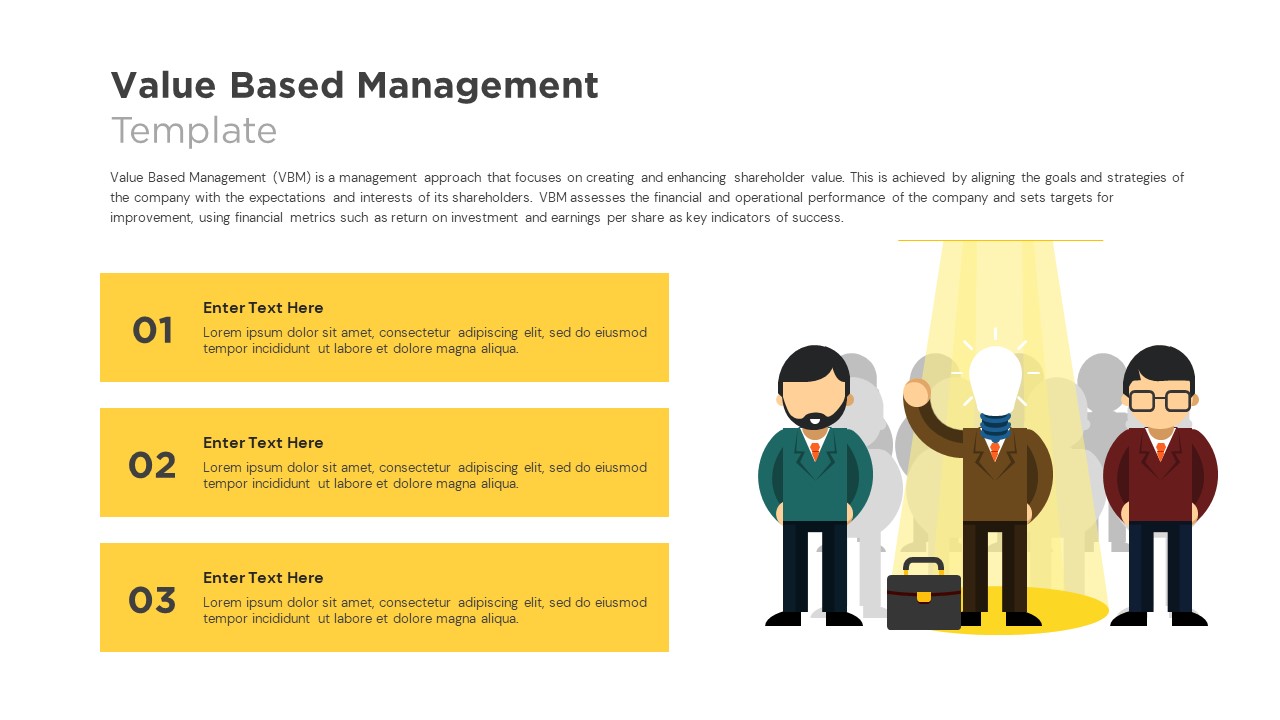
Value Based Management Step-by-Step Template for PowerPoint & Google Slides
Business Strategy