Cross Functional Swimlane Flow Chart Template for PowerPoint & Google Slides


Description
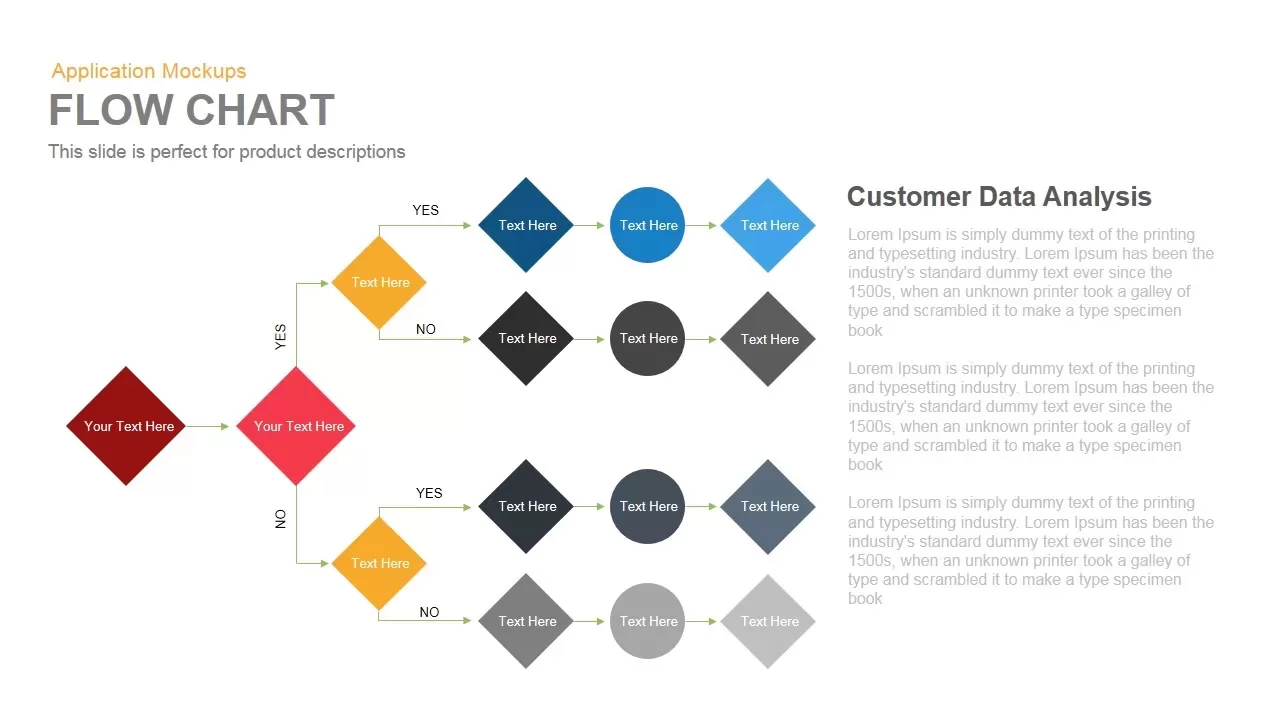
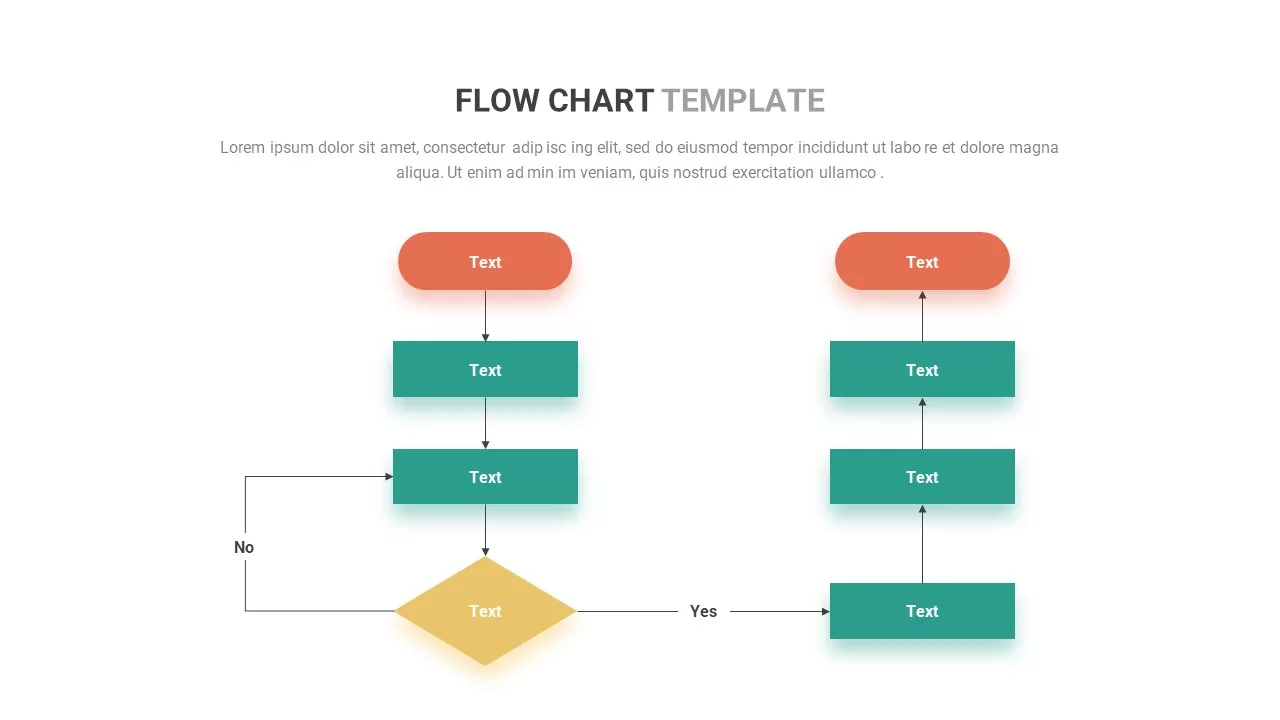
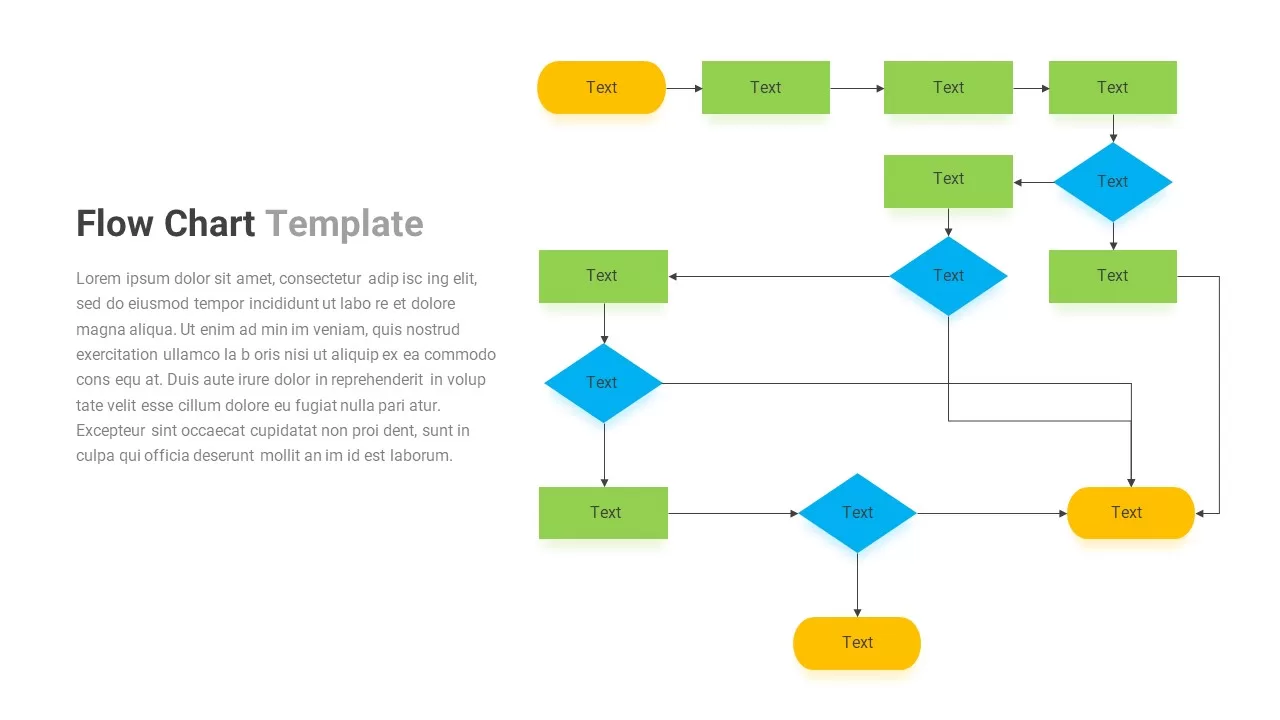
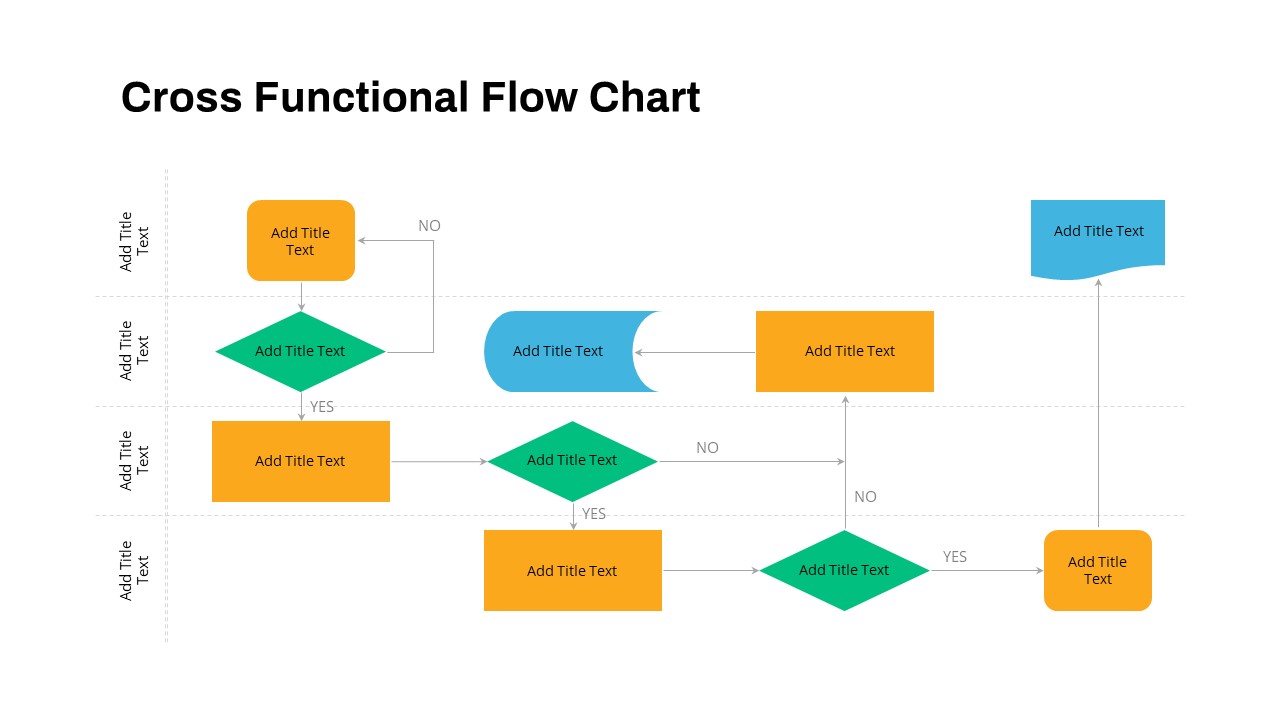
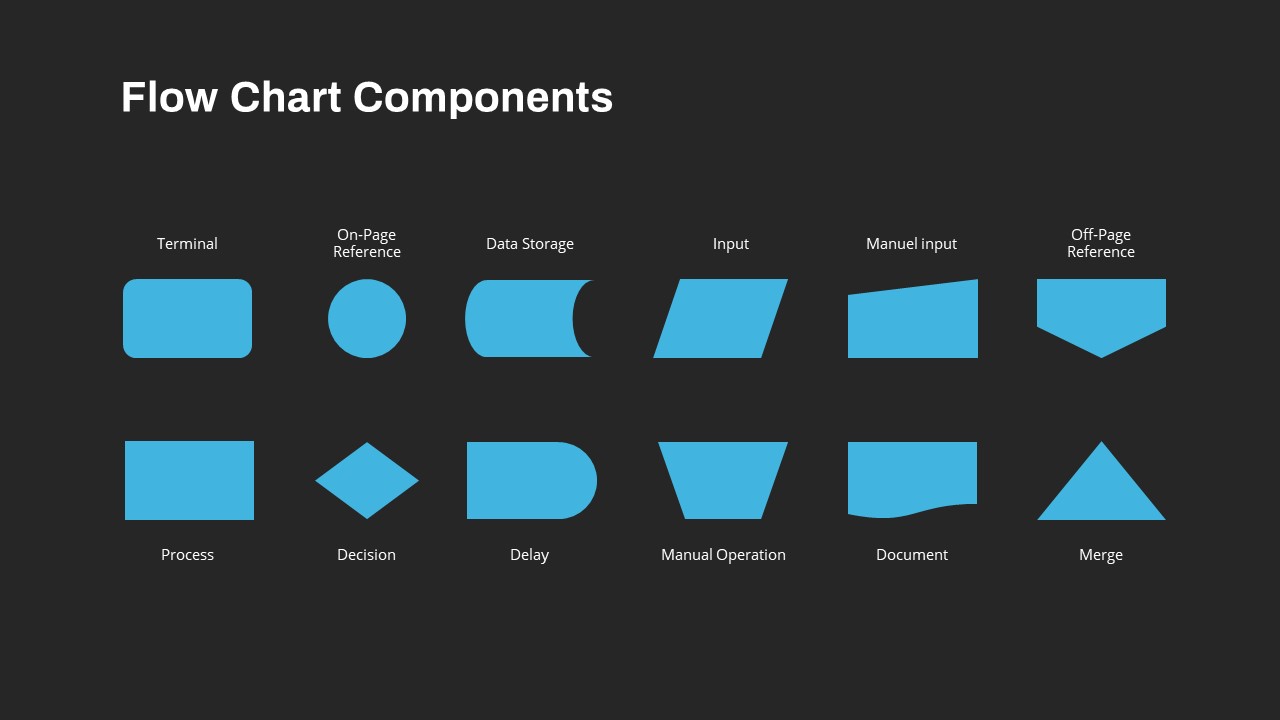
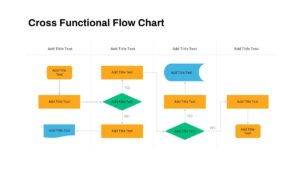
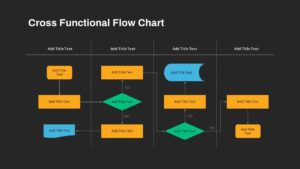
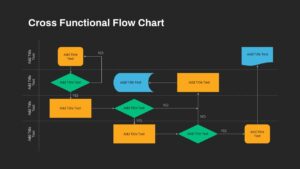
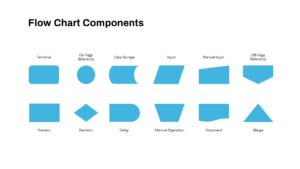
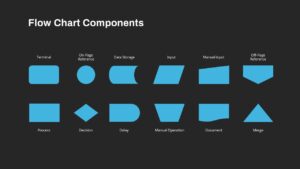
Organize complex operations across departments using this cross-functional swimlane flow chart slide, featuring color-coded process blocks, decision diamonds, and data storage symbols arranged across vertical swimlanes. Each lane is separated by dashed grey dividers and labeled with placeholder titles for teams or functions. Orange process rectangles, green decision diamonds, and blue on-page/off-page reference shapes stand out against a clean white background to clearly delineate workflow steps. Directional arrows connect shapes with “Yes”/“No” callouts to illustrate decision paths. A dedicated legend slide details key flowchart components, making it easy to introduce new users to your process diagram.
Built on master layouts for both PowerPoint and Google Slides, this template offers fully editable shapes, colors, and text placeholders to adapt to your unique process requirements. Simply drag and drop to rearrange steps, resize swimlanes, or change marker styles. Replace labels with your own titles and adjust connector arrow positioning without disrupting the overall layout. High-resolution vector graphics ensure consistency on screens of any size, while intuitive slide structure accelerates collaboration and version control. Leverage intuitive guides on the canvas to lock in alignment and maintain consistent margins across slides.
Ideal for mapping product development workflows, compliance procedures, or customer journey diagrams, this template streamlines documentation and presentation of multi-team processes. Use it to communicate handoff points between departments, visualize approval gates, or train new employees on standard operating procedures. With a separate component slide for easy reference, you can customize symbol definitions, add new shapes, or repurpose lanes for strategic planning tasks.
Who is it for
Operations managers, business analysts, and project leads will benefit from this flow chart when designing or documenting interdepartmental workflows and decision processes. Quality assurance teams and compliance officers can also leverage it for SOP documentation and audit readouts.
Other Uses
Beyond operational workflows, repurpose this slide for service design mapping, IT system architectures, or risk assessment sequences. The component slide can also be adapted for training materials, workshop exercises, or team onboarding.
Login to download this file

Item ID
SB03807
Related Templates

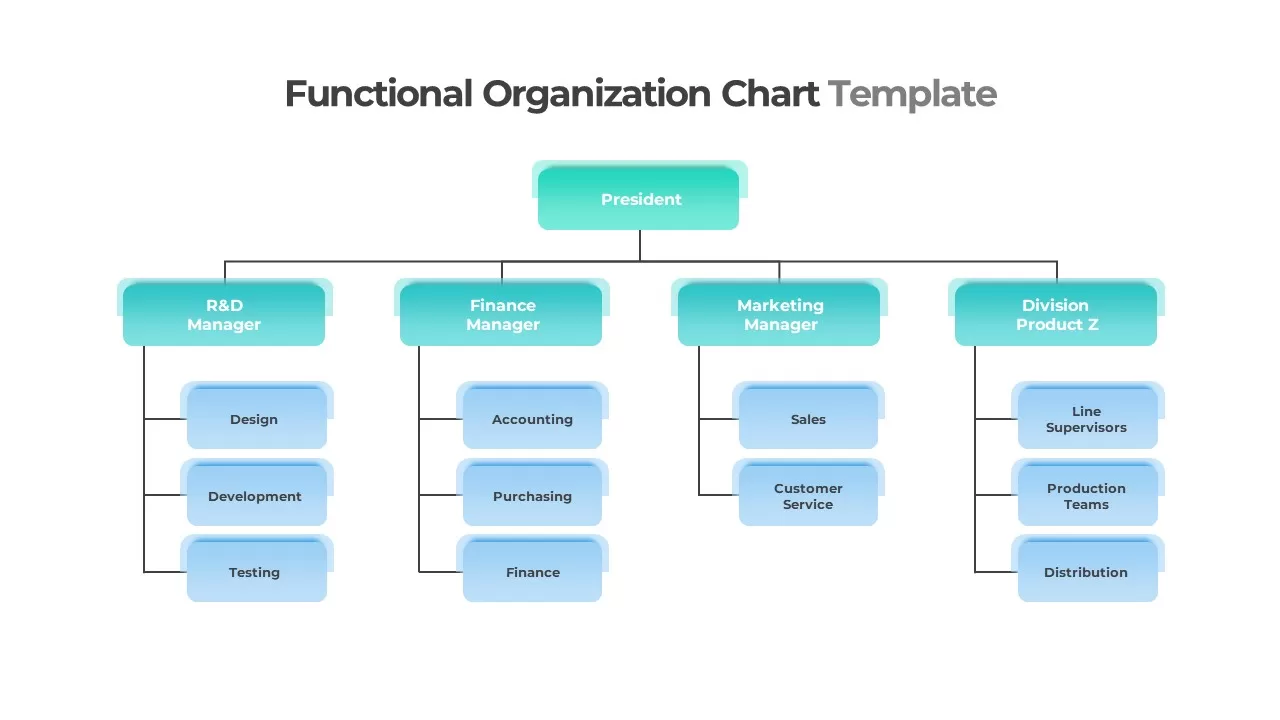
Functional Organization Chart Structure Template for PowerPoint & Google Slides
Org Chart
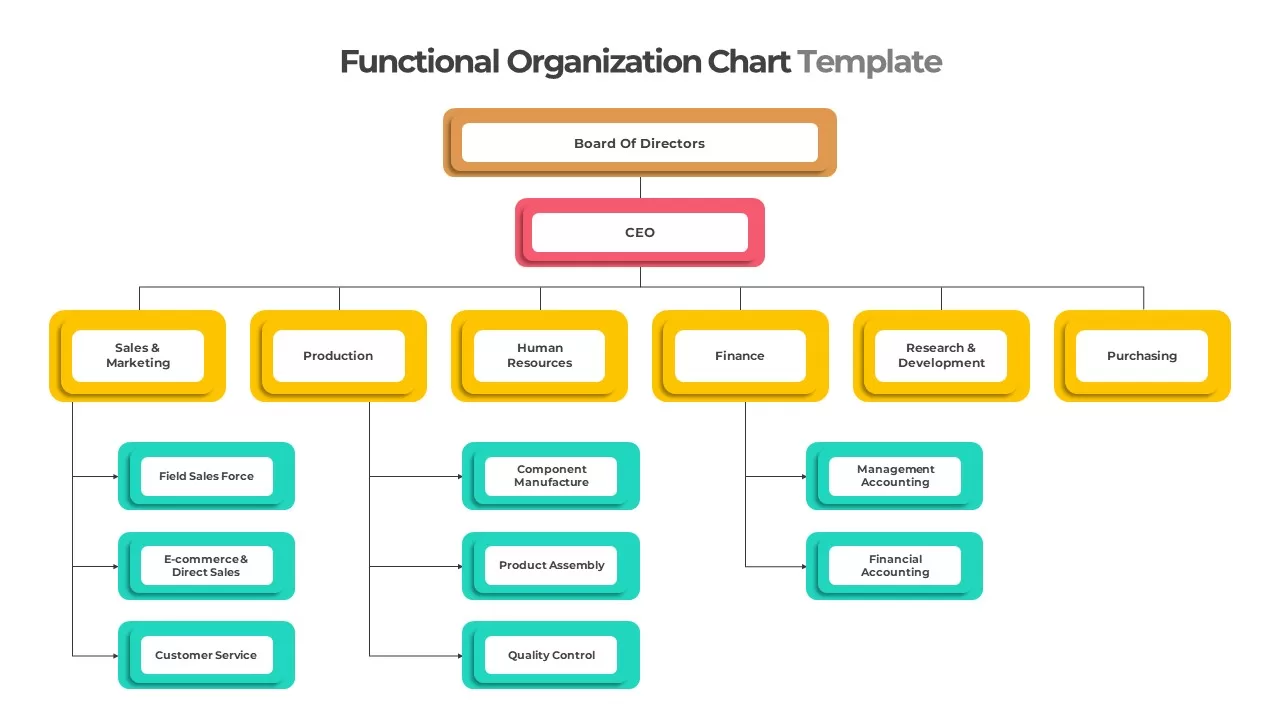
Colorful Functional Organization Chart Template for PowerPoint & Google Slides
Org Chart
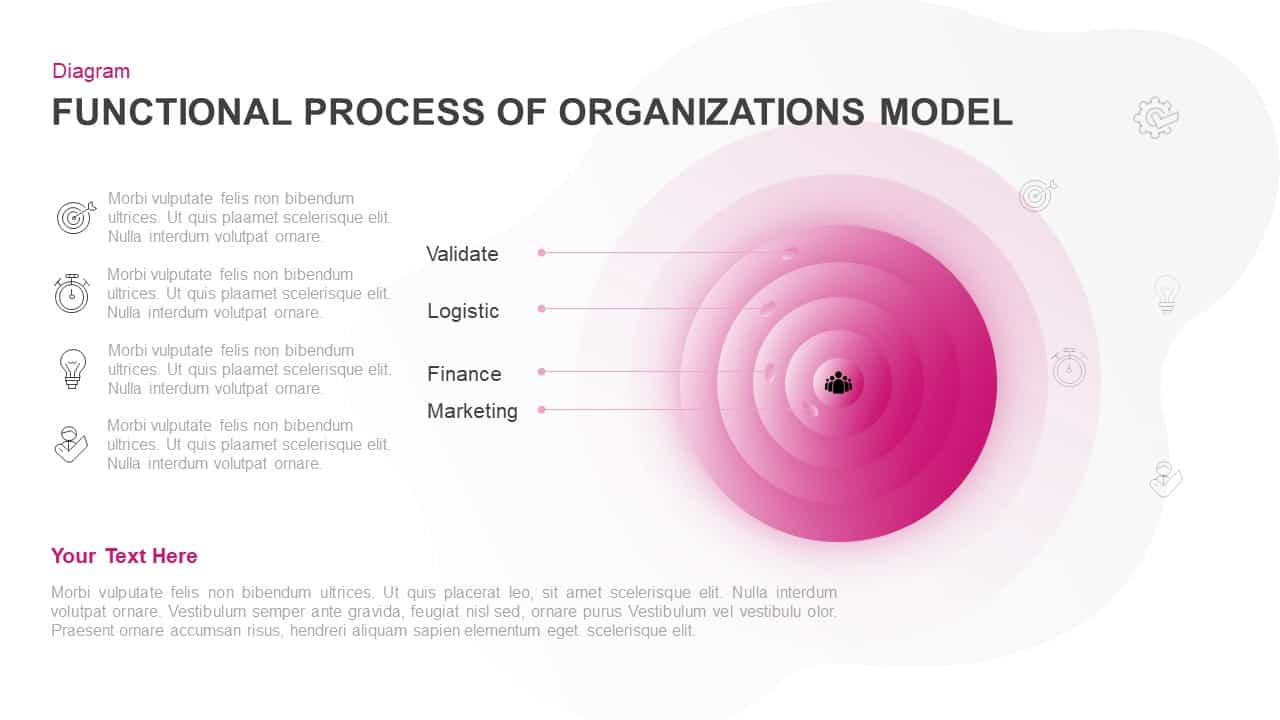
Concentric Functional Process Model Template for PowerPoint & Google Slides
Circular
Multi-Functional Presentation Template for PowerPoint & Google Slides
Pitch Deck
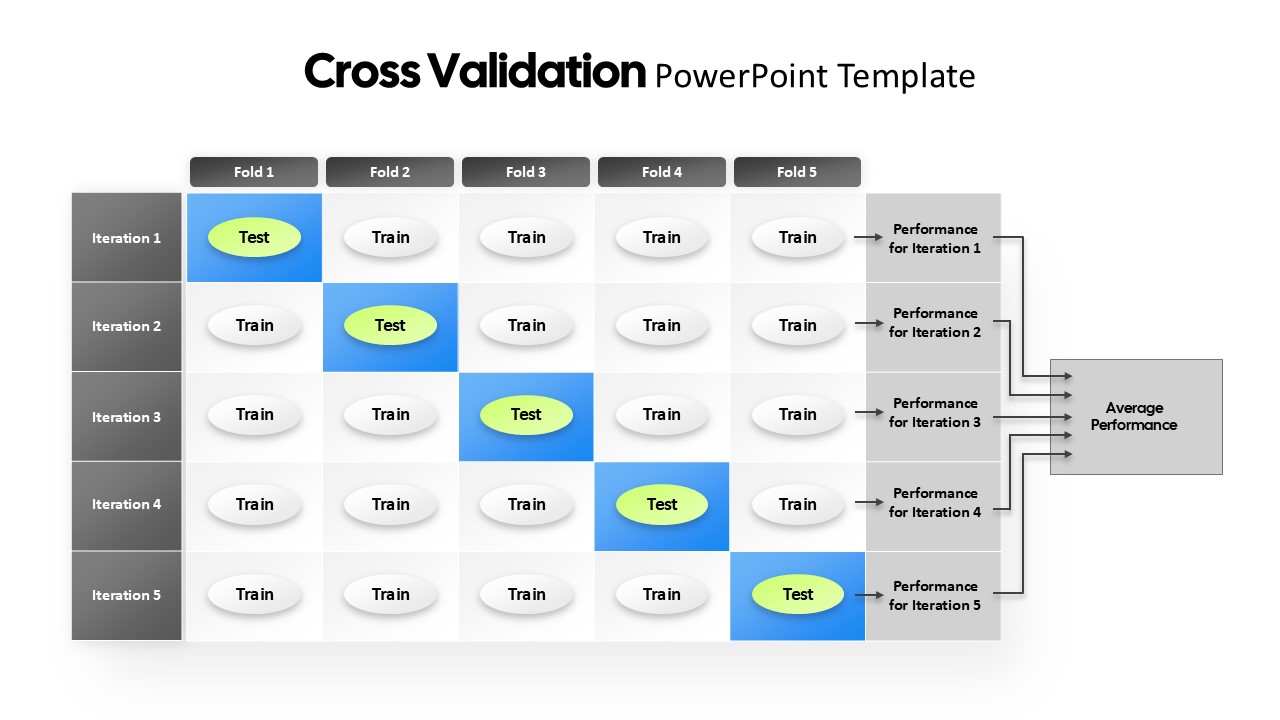
Cross Validation PowerPoint template for PowerPoint & Google Slides
AI
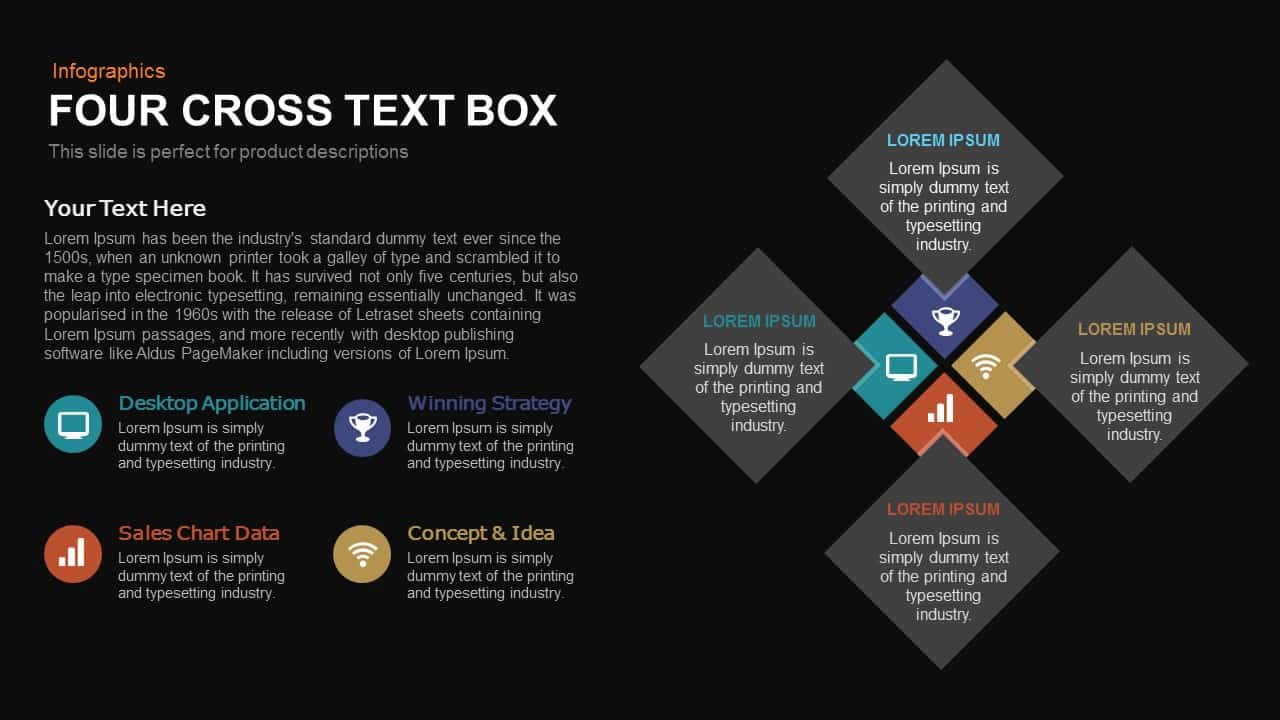
Four-Cross Text Box Diagram Template for PowerPoint & Google Slides
Comparison
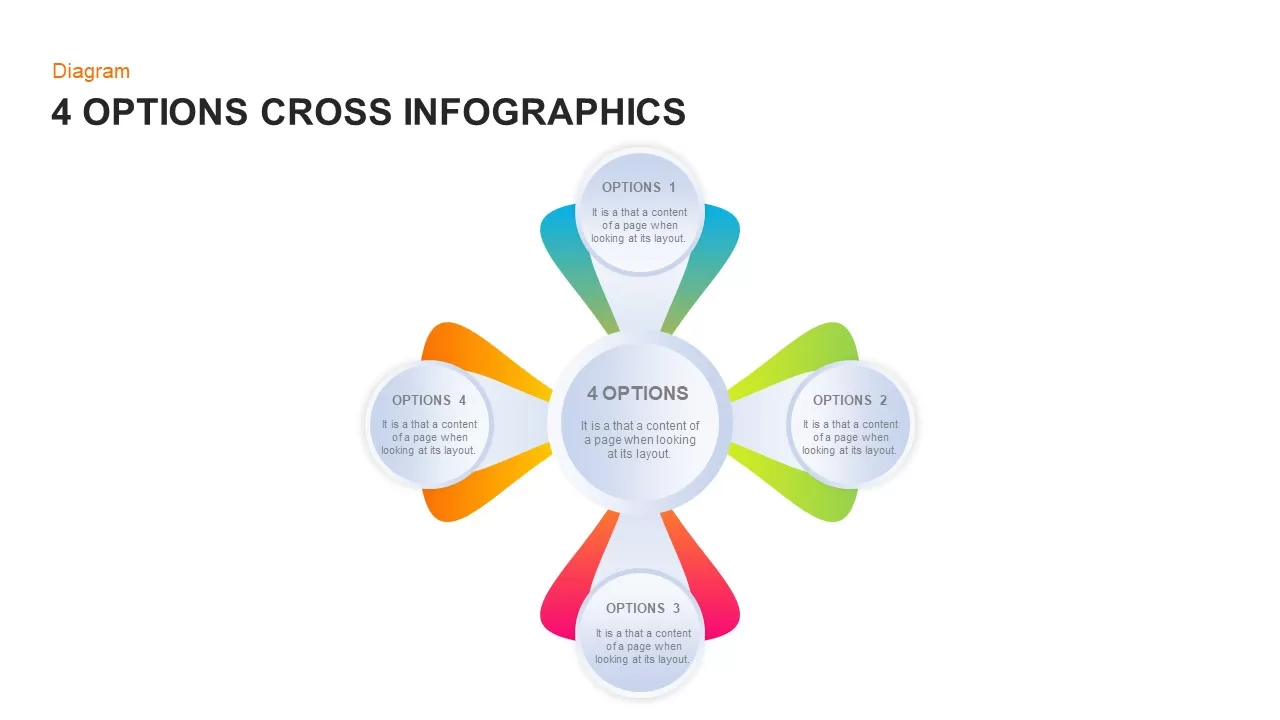
Four-Option Cross Infographic Diagram Template for PowerPoint & Google Slides
Comparison
Cross Sell & Up Sell Strategy Comparison template for PowerPoint & Google Slides
Comparison
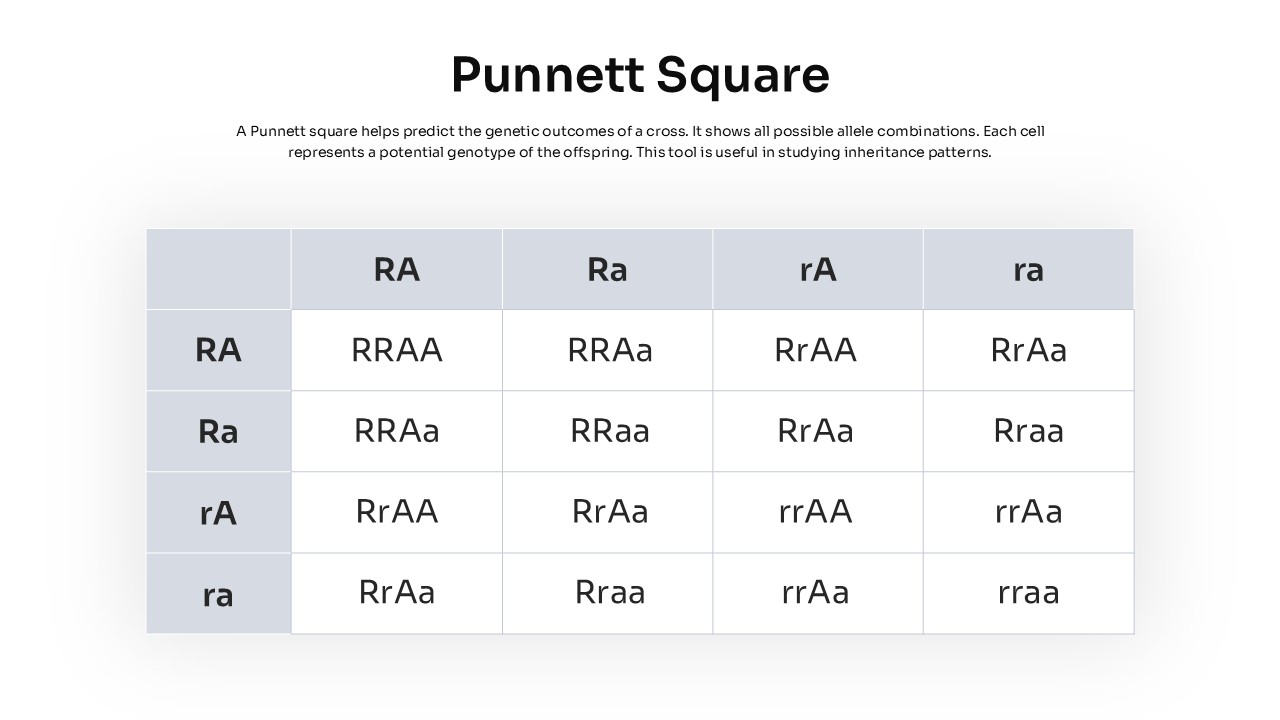
Punnett Square Genetic Cross Diagram Template for PowerPoint & Google Slides
Comparison Chart
Flow Chart template for PowerPoint & Google Slides
Flow Charts
Vertical Split Flow Chart Diagram Template for PowerPoint & Google Slides
Flow Charts
Flow Chart Diagram Template for PowerPoint & Google Slides
Flow Charts
Flow Chart Diagram template for PowerPoint & Google Slides
Flow Charts
Flow Chart Template for PowerPoint & Google Slides
Flow Charts
Flow Chart Template for PowerPoint & Google Slides
Flow Charts
Flow Chart Decision Tree Template for PowerPoint & Google Slides
Flow Charts
Flow Chart Template for PowerPoint & Google Slides
Flow Charts
Flow Chart template for PowerPoint & Google Slides
Flow Charts
Flow Chart template for PowerPoint & Google Slides
Flow Charts
Free Circular Multi-Step Flow Chart Diagram Template for PowerPoint & Google Slides
Flow Charts
Free
Recruitment Process Flowchart PowerPoint and Google Slides
Flow Charts
Wastewater Treatment Process Flow Chart Template for PowerPoint & Google Slides
Flow Charts
Animated Process Flow Chart Template for PowerPoint & Google Slides
Infographics
Attribution Modeling Flow Chart Template for PowerPoint & Google Slides
Flow Charts
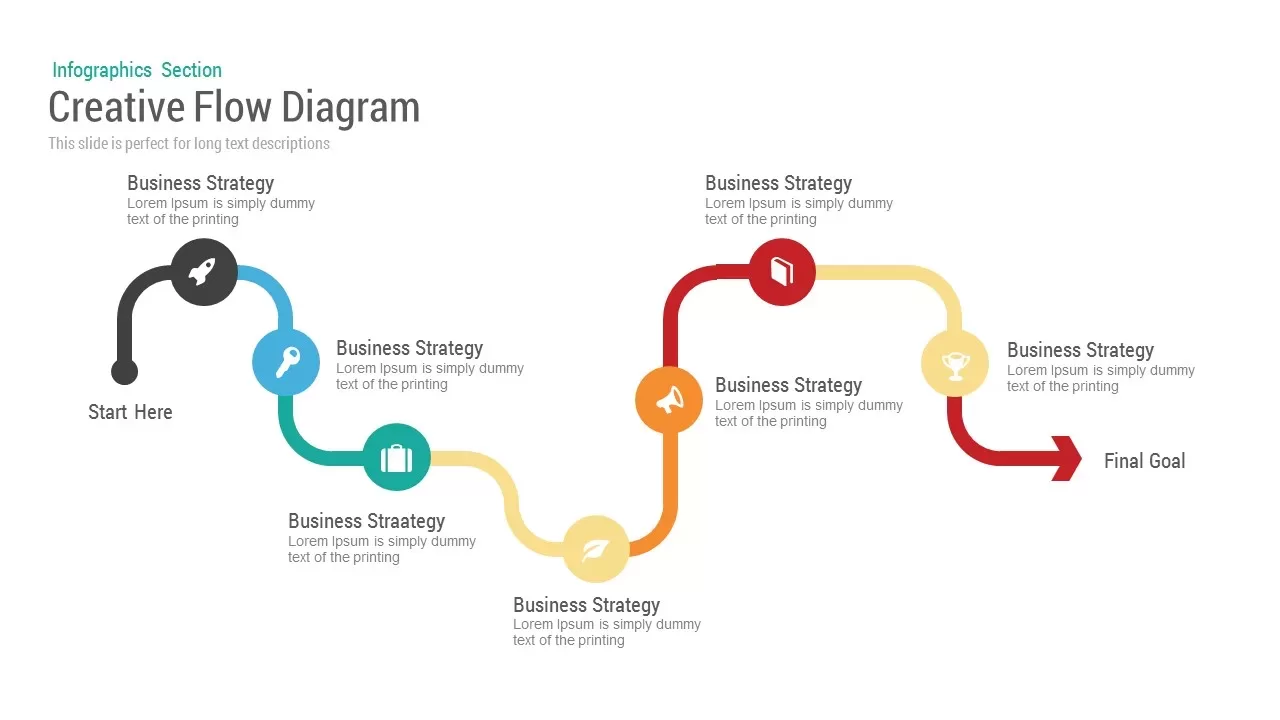
Creative Flow Diagram Presentation Template
Process
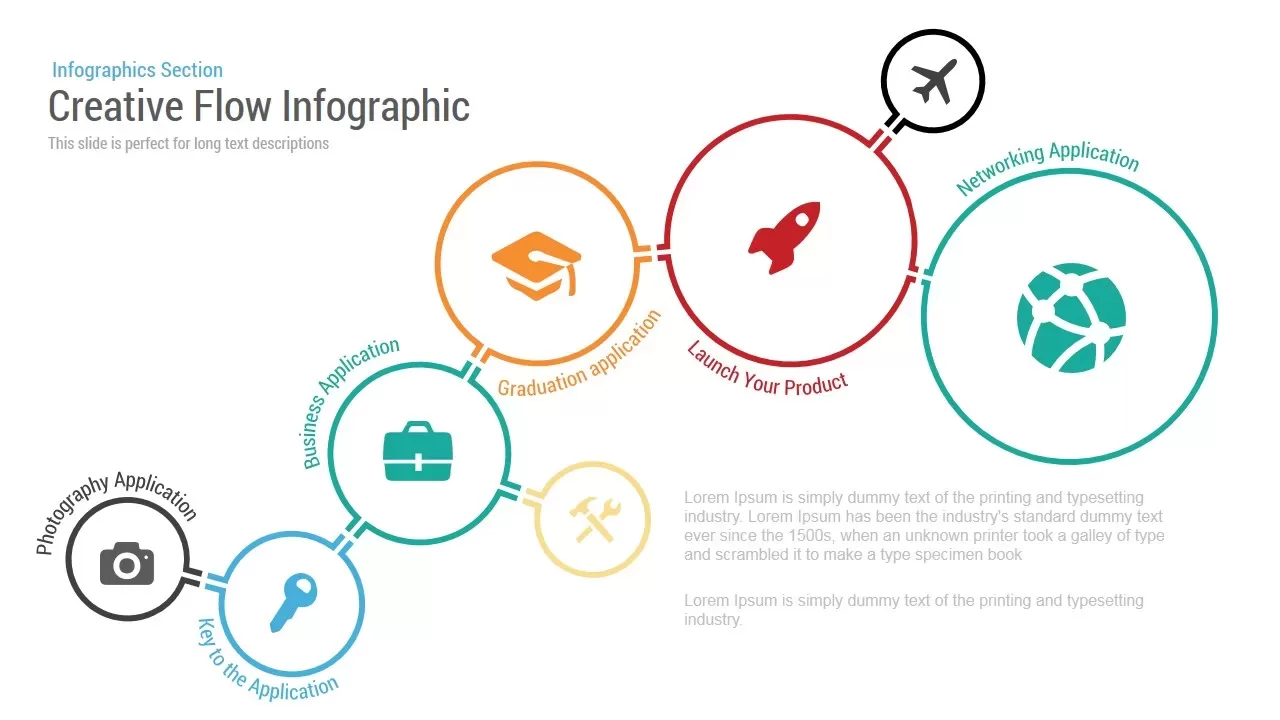
Creative Flow Infographic template for PowerPoint & Google Slides
Process
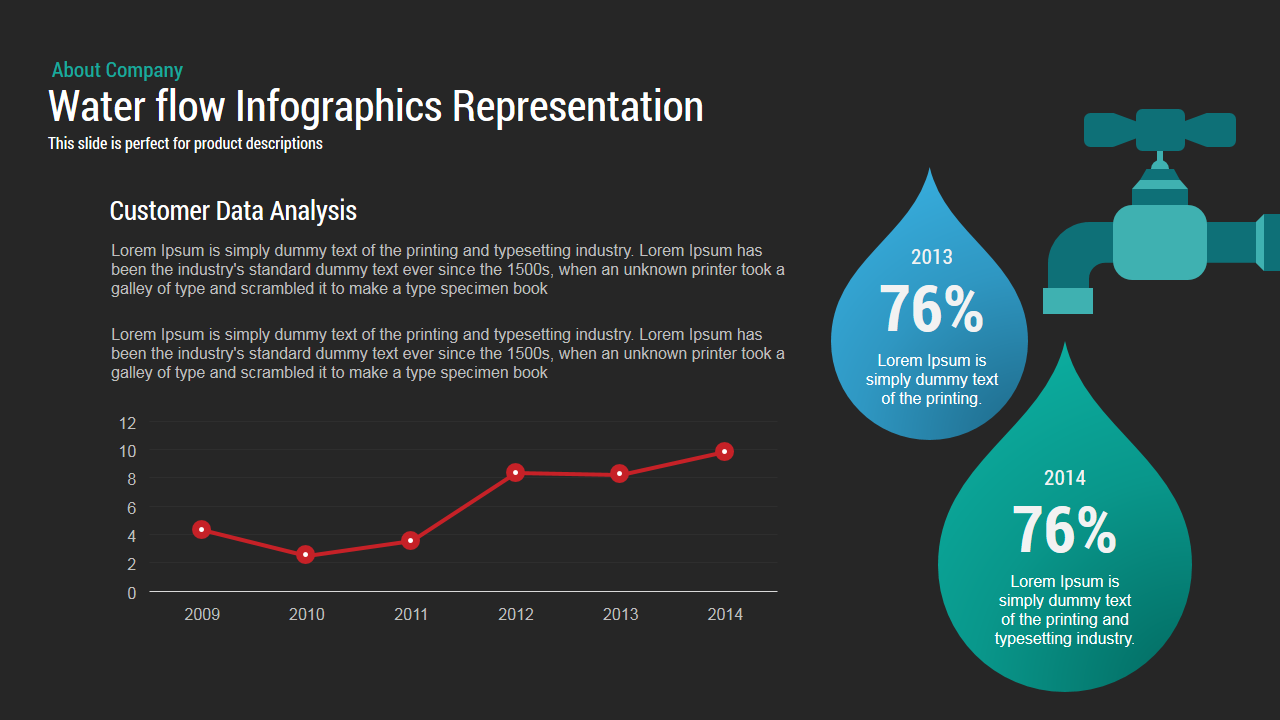
Water Flow template for PowerPoint & Google Slides
Infographics
3D Arrow Infographics Circular Flow Template for PowerPoint & Google Slides
Arrow
Circular Flow Diagram Template for PowerPoint & Google Slides
Infographics
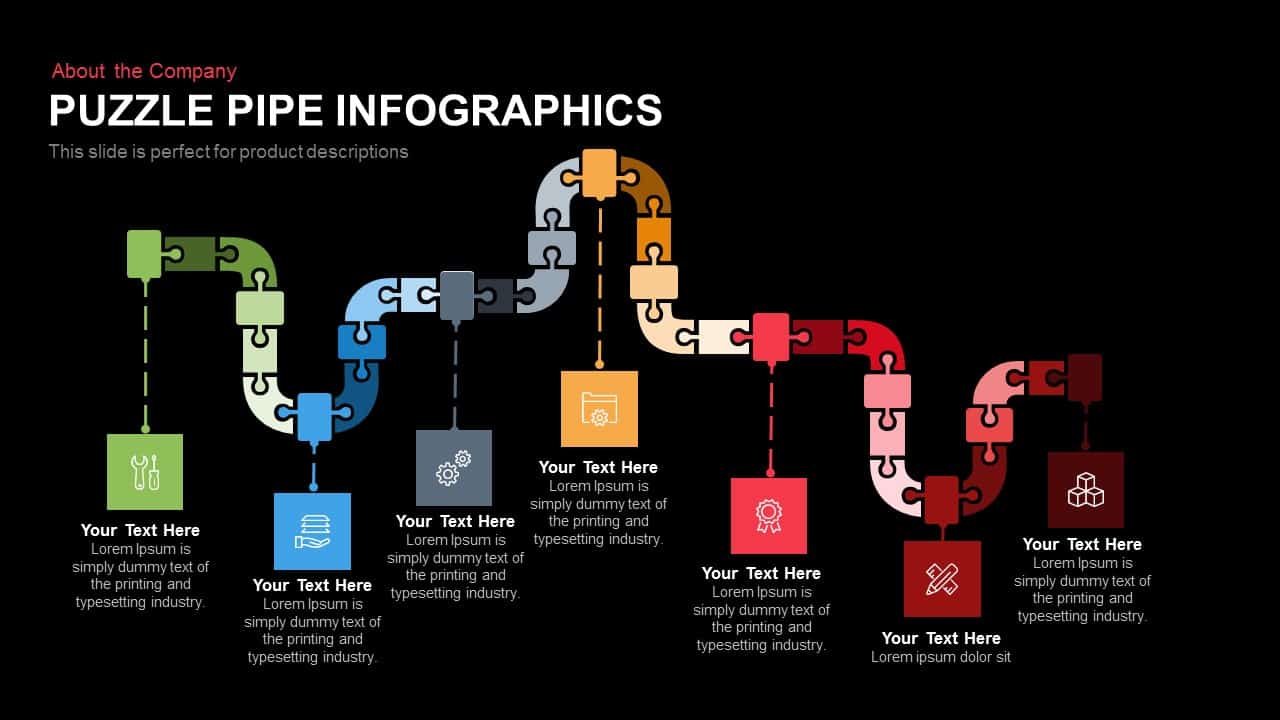
Puzzle Pipe Infographics Process Flow Template for PowerPoint & Google Slides
Process
Six Hexagon Stages Process Flow Diagram Template for PowerPoint & Google Slides
Process
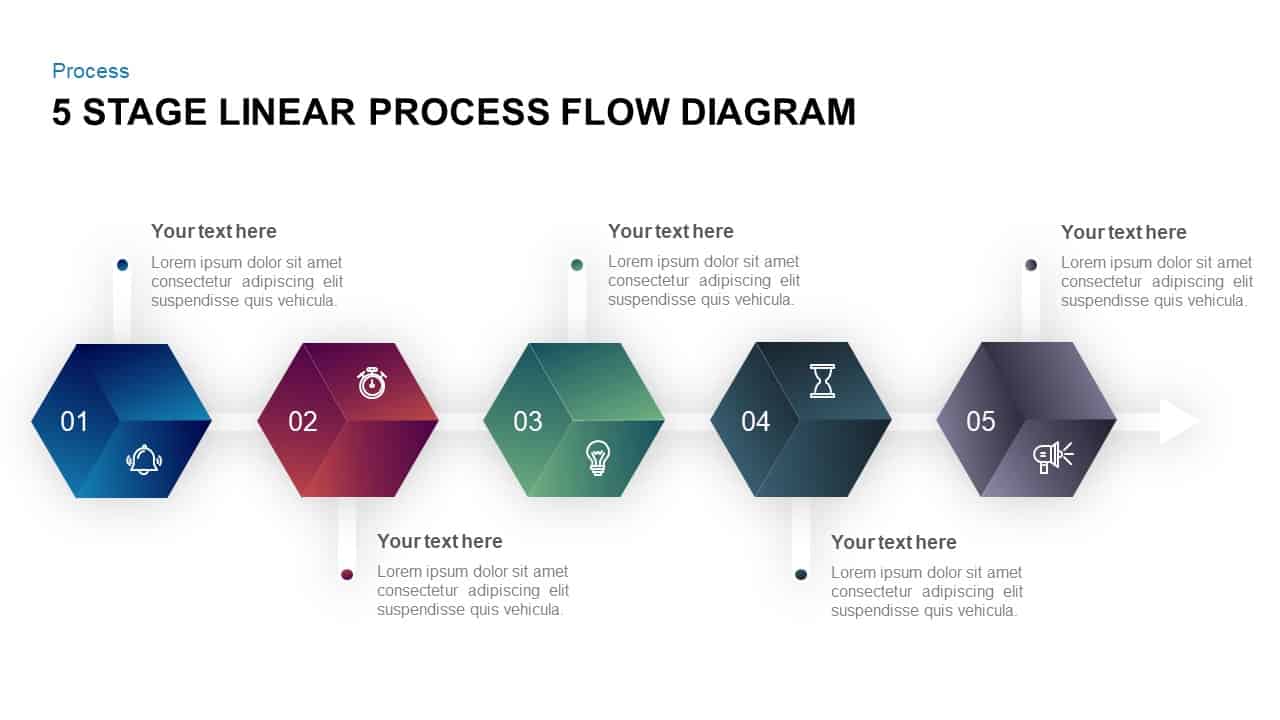
Five Stage Linear Process Flow Template for PowerPoint & Google Slides
Process
5-Stage Arrow Infographics Process Flow Template for PowerPoint & Google Slides
Arrow
3D Shape Linear Process Flow Diagram Template for PowerPoint & Google Slides
Process
Linear Process Flow Circles Diagram Template for PowerPoint & Google Slides
Process
Six-Stage Zig-Zag Process Flow Diagram Template for PowerPoint & Google Slides
Process
Vertical Business Process Flow Diagram Template for PowerPoint & Google Slides
Process
Six-Sided Shutter Diagram Process Flow Template for PowerPoint & Google Slides
Process
Five-Stage 3D Box Flow Diagram Template for PowerPoint & Google Slides
Process

Eight-Stage Radial Process Flow Diagram Template for PowerPoint & Google Slides
Process
Four-Plus Process Flow Diagram Template for PowerPoint & Google Slides
Process
Four-Stage Circular Process Flow Template for PowerPoint & Google Slides
Process
4 Step Revenue Growth Flow Diagram Template for PowerPoint & Google Slides
Process
Pipe Water Infographics Flow Diagram Template for PowerPoint & Google Slides
Process
Five Stage Linear Process Flow Diagram Template for PowerPoint & Google Slides
Process
Five-Step Hexagonal Process Flow Template for PowerPoint & Google Slides
Process
Five-Stage Circular Flow Diagram Template for PowerPoint & Google Slides
Circular
5-Stage Gear Process Flow Diagram Template for PowerPoint & Google Slides
Process
3D Seven-Stage Process Flow Diagram Template for PowerPoint & Google Slides
Process
Four-Stage Linear Process Flow Diagram Template for PowerPoint & Google Slides
Process
Four-Stage Circular Flow Diagram Template for PowerPoint & Google Slides
Circular
5-Stage Linear Process Flow Diagram Template for PowerPoint & Google Slides
Process
5 Stage Process Flow Diagram Template for PowerPoint & Google Slides
Process
7 Stage Linear Process Flow Diagram Template for PowerPoint & Google Slides
Process
4 Stage Linear Process Flow Diagram Template for PowerPoint & Google Slides
Process
6-Step Business Process Flow Diagram Template for PowerPoint & Google Slides
Process
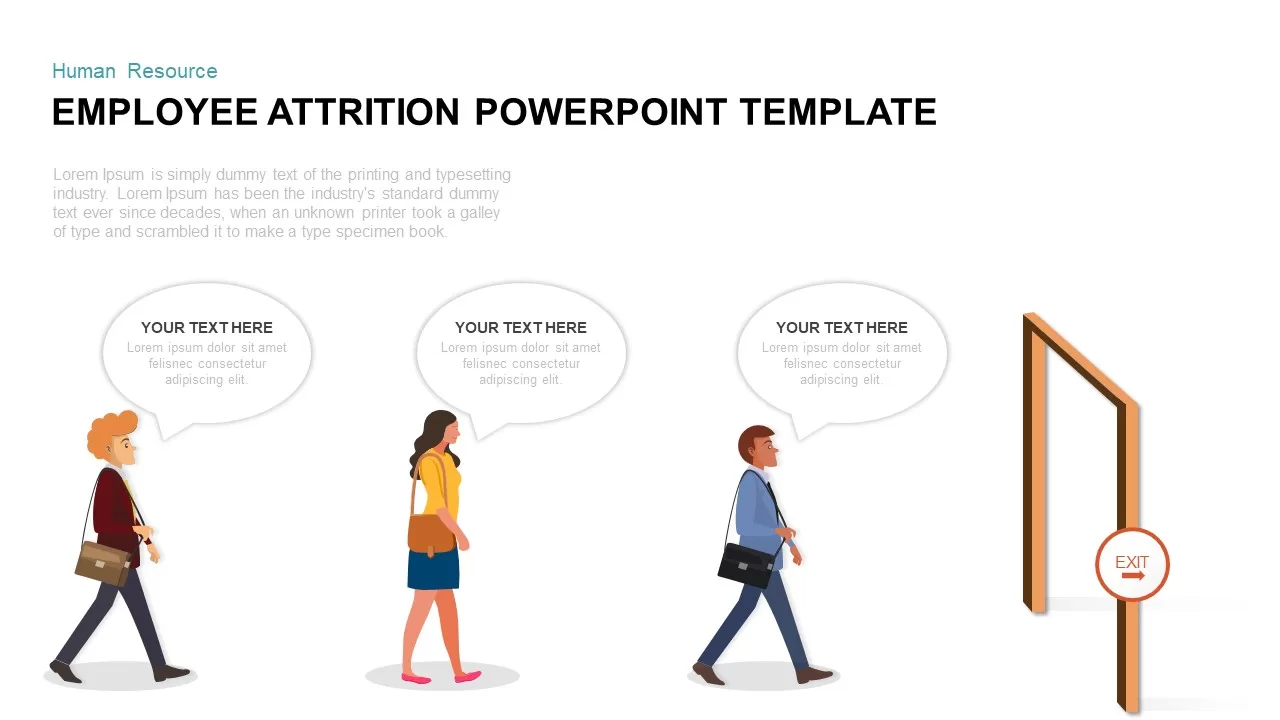
Employee Attrition Flow Template for PowerPoint & Google Slides
Recruitment
Six-Stage Circular Flow Diagram Template for PowerPoint & Google Slides
Circular
Financial Agreement Signing Flow Diagram Template for PowerPoint & Google Slides
Process
4-Step Linear Process Flow Diagram Template for PowerPoint & Google Slides
Process
Colorful 8-Stage Droplet Process Flow Diagram Template for PowerPoint & Google Slides
Process
5-Step Circular Gradient Process Flow Template for PowerPoint & Google Slides
Process

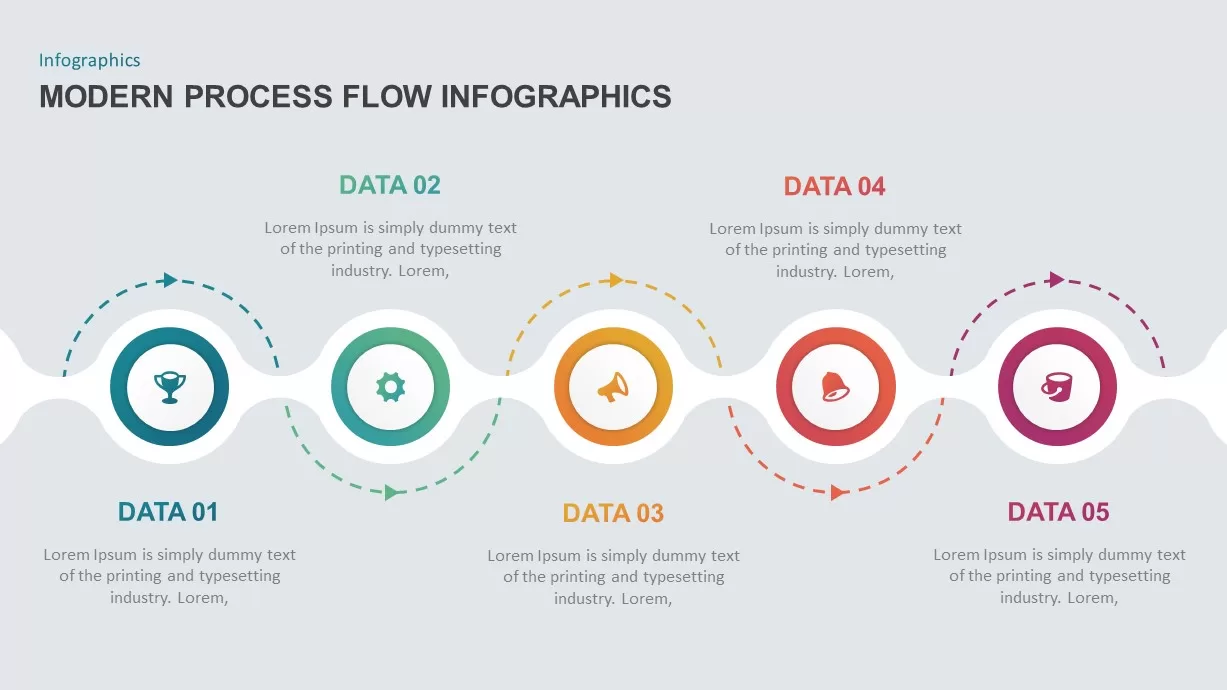
Modern Process Flow Infographic Template
Process
Five-Step Process Flow Infographic Template for PowerPoint & Google Slides
Process
Modern 5-Step Flow Infographics Template for PowerPoint & Google Slides
Process
Recognition-Primed Decision Process Flow Template for PowerPoint & Google Slides
Flow Charts
Minimal Process Flow Diagram Infographic Template for PowerPoint & Google Slides
Process

Free Colorful Process Flow Infographics Template for PowerPoint & Google Slides
Process
Free
Process Flow Steps template for PowerPoint & Google Slides
Business Plan
Process Flow Template for PowerPoint & Google Slides
Process
5 Stage Process Flow Overview template for PowerPoint & Google Slides
Process
Curved Arrow Process Flow Infographic Template for PowerPoint & Google Slides
Process
Curved Arrow Process Flow Diagram Template for PowerPoint & Google Slides
Process
Circle Arrows Process Flow template for PowerPoint & Google Slides
Process
Curved Arrow Flow Diagram template for PowerPoint & Google Slides
Business
Curved Arrow Flow Template for PowerPoint & Google Slides
Process
Curved Arrow Process Flow template for PowerPoint & Google Slides
Process
Circular Arrows Process Flow template for PowerPoint & Google Slides
Process
Animated Accordion Process Flow Template for PowerPoint & Google Slides
Process
Hexagonal Process Flow Template for PowerPoint & Google Slides
Process
Conveyor Belt Infographic Process Flow Template for PowerPoint & Google Slides
Process
Dynamic Conveyor Belt Process Flow Template for PowerPoint & Google Slides
Process
E-Waste Management PowerPoint Template
Process

DevOps PowerPoint Template and Google Slides
Information Technology
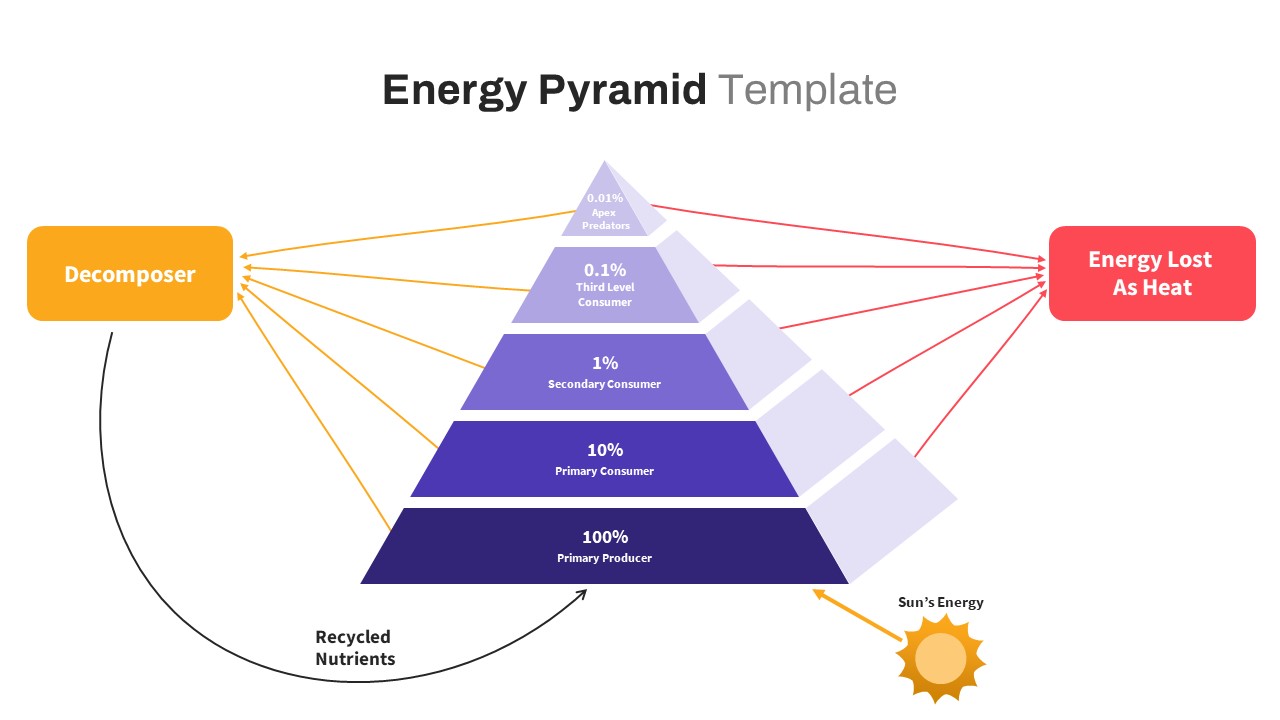
Free Ecological Energy Flow Pyramid Template for PowerPoint & Google Slides
Pyramid
Free
Advanced Data Flow Diagram Pack Template for PowerPoint & Google Slides
Flow Charts
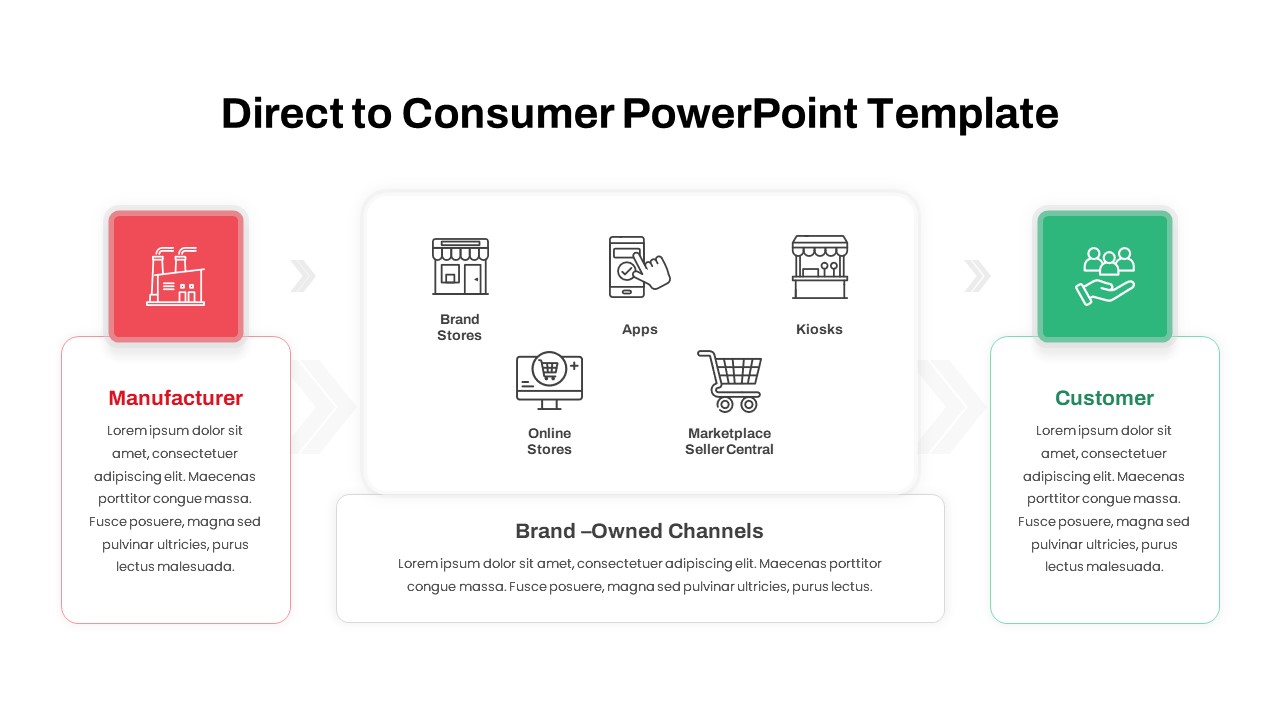
Direct to Consumer Brand Channels Flow Template for PowerPoint & Google Slides
Business Models
Capital Investments Process Flow Diagram Template for PowerPoint & Google Slides
Process
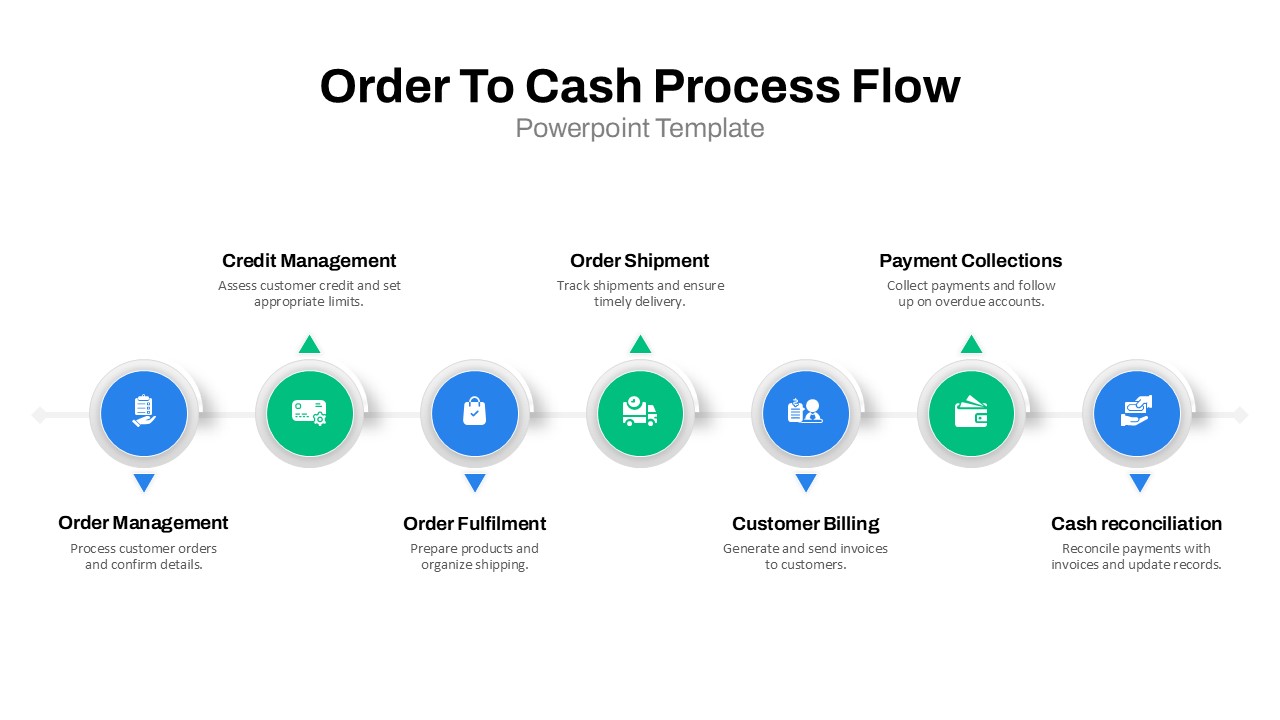
Order to Cash Process Flow Diagram Template for PowerPoint & Google Slides
Process
Chevron Process Flow Sequence Slide Template for PowerPoint & Google Slides
Arrow
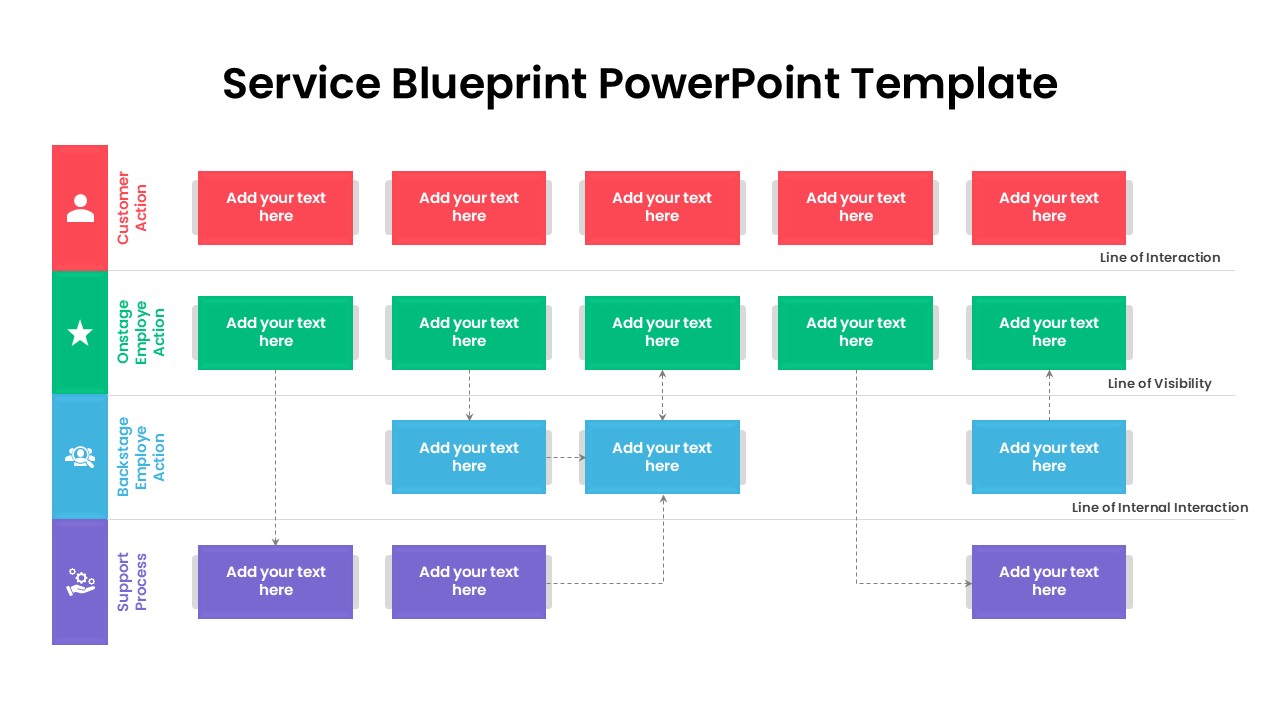
Service Blueprint Process Flow Template for PowerPoint & Google Slides
Process
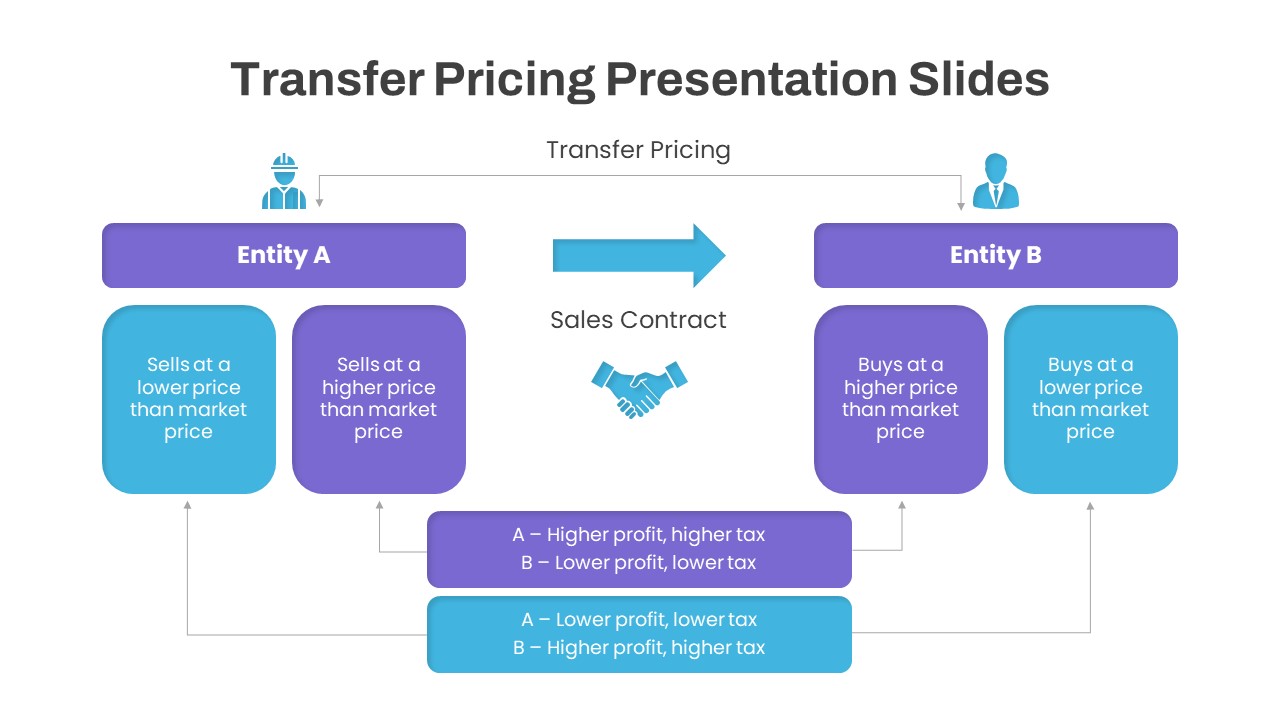
Dynamic Transfer Pricing Flow Diagram Template for PowerPoint & Google Slides
Finance
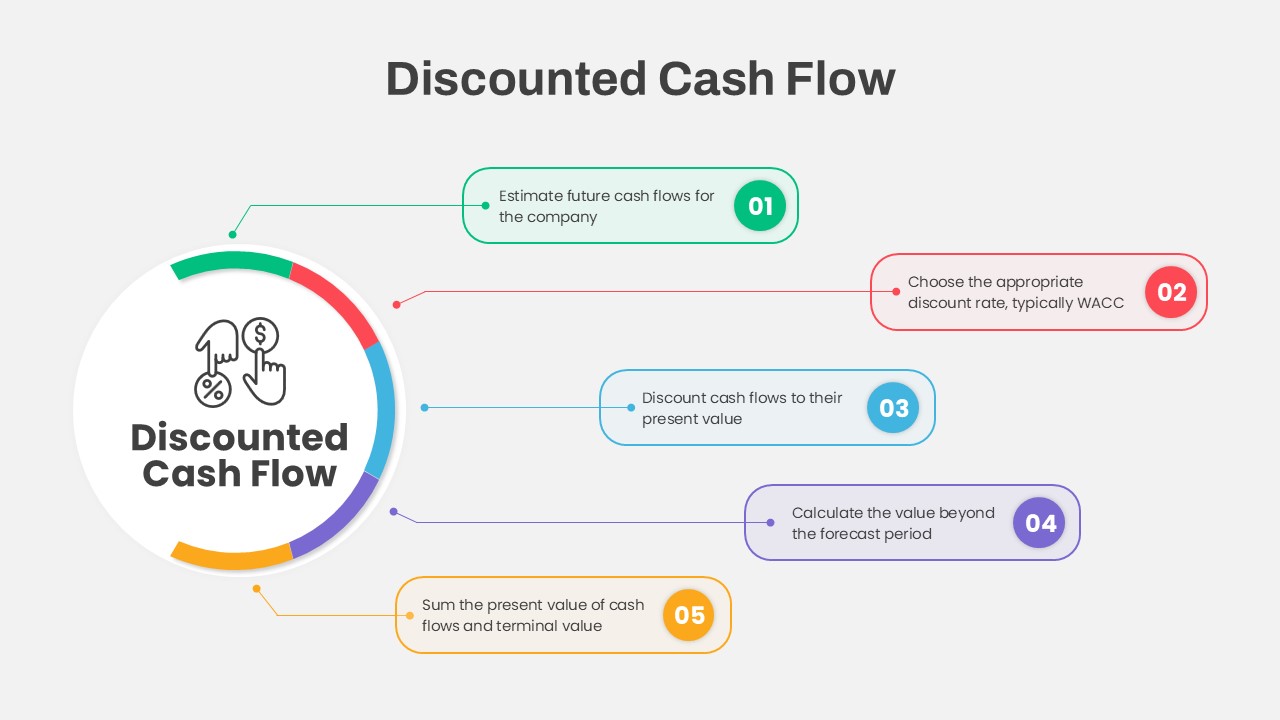
Discounted Cash Flow Five-Step Process Template for PowerPoint & Google Slides
Process
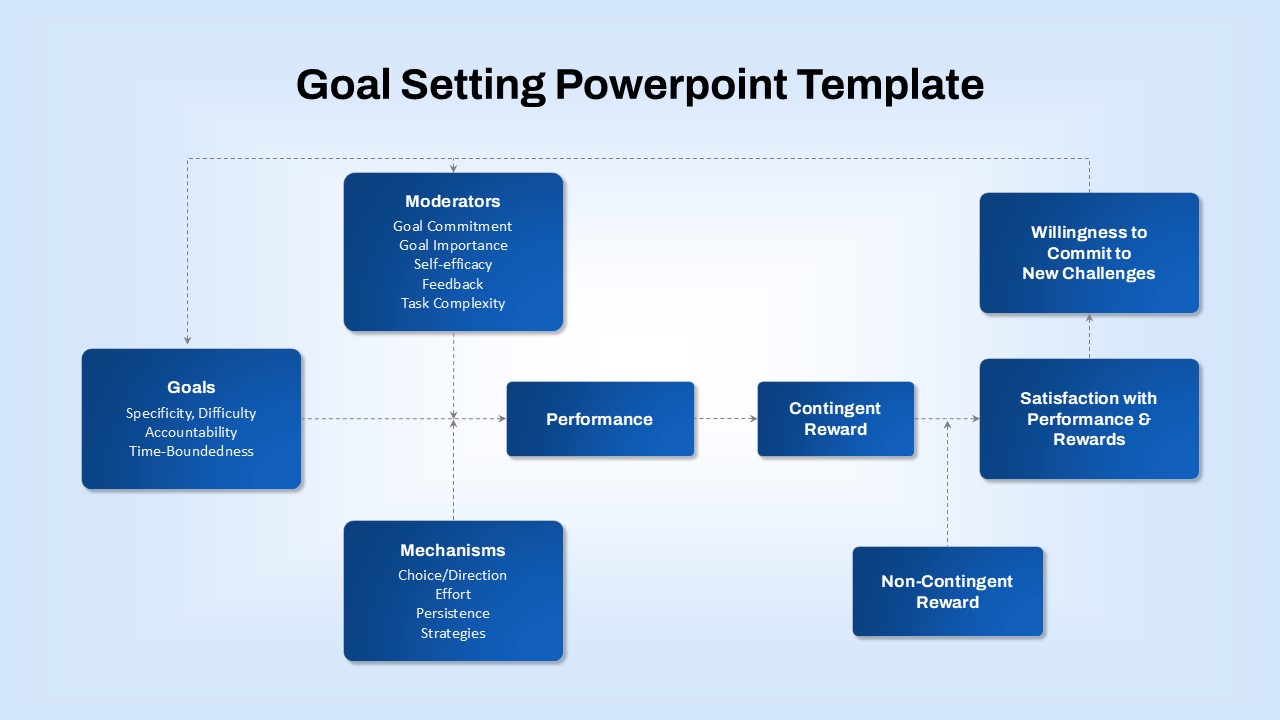
Goal-Setting Process Flow Diagram Template for PowerPoint & Google Slides
Goals
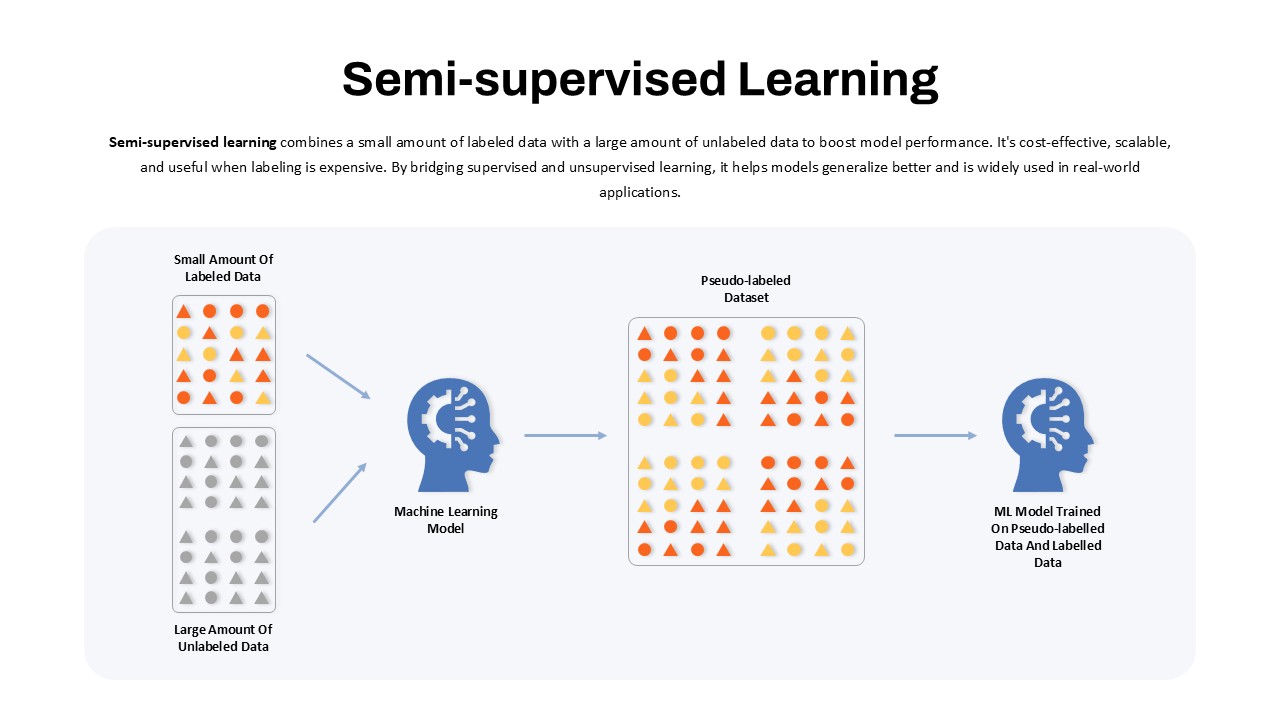
Semi-Supervised Learning Flow Diagram Template for PowerPoint & Google Slides
Machine Learning
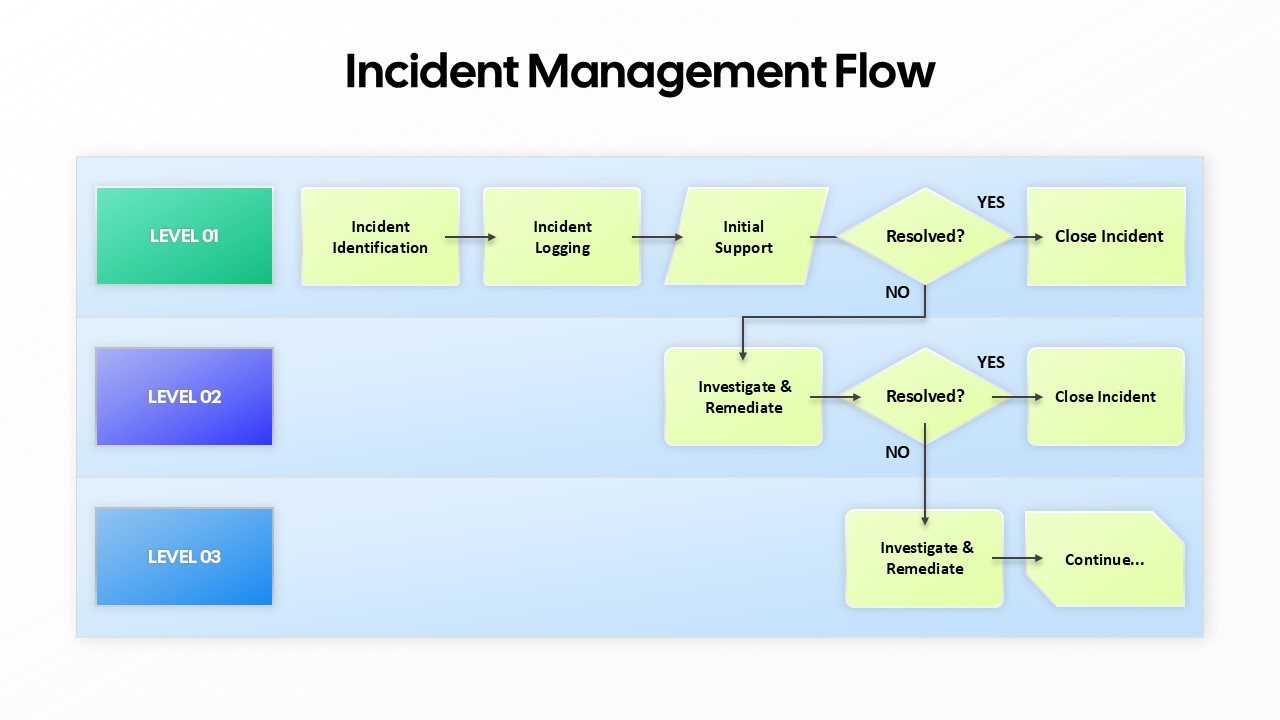
Incident Management Flow Process template for PowerPoint & Google Slides
Flow Charts
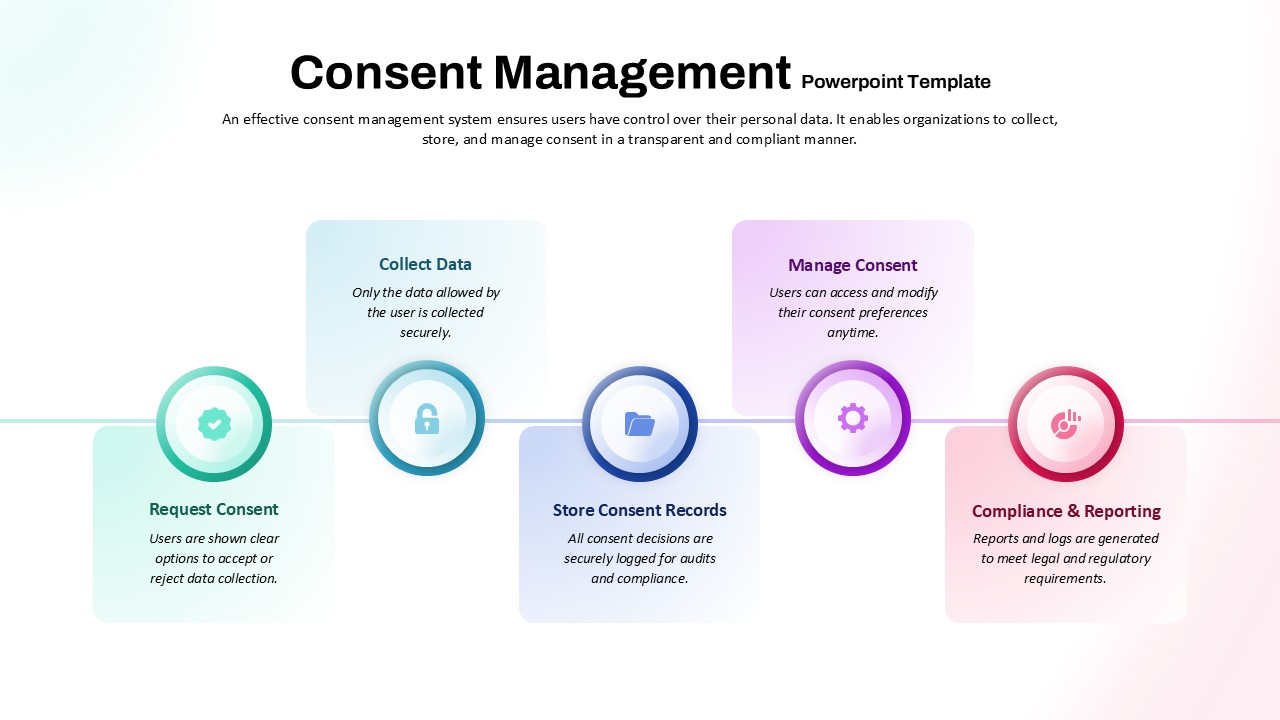
Consent Management System Process Flow Template for PowerPoint & Google Slides
Process
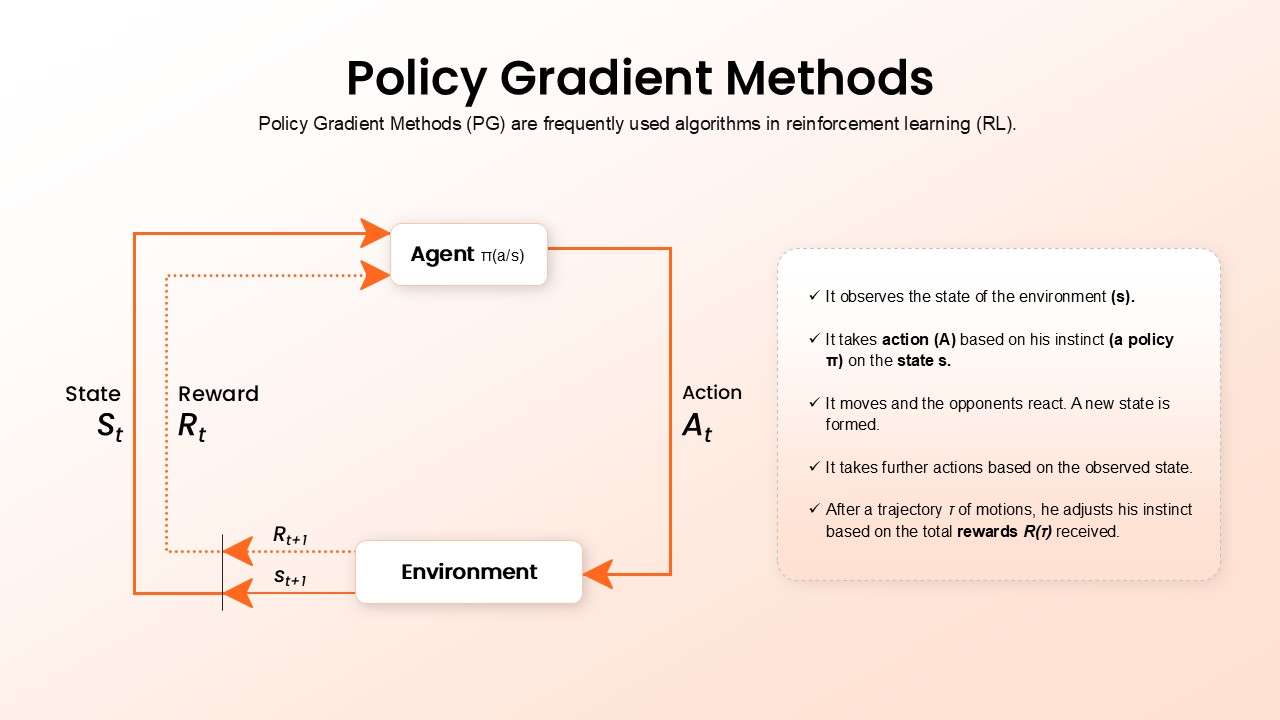
Policy Gradient Methods Flow Diagram Template for PowerPoint & Google Slides
AI
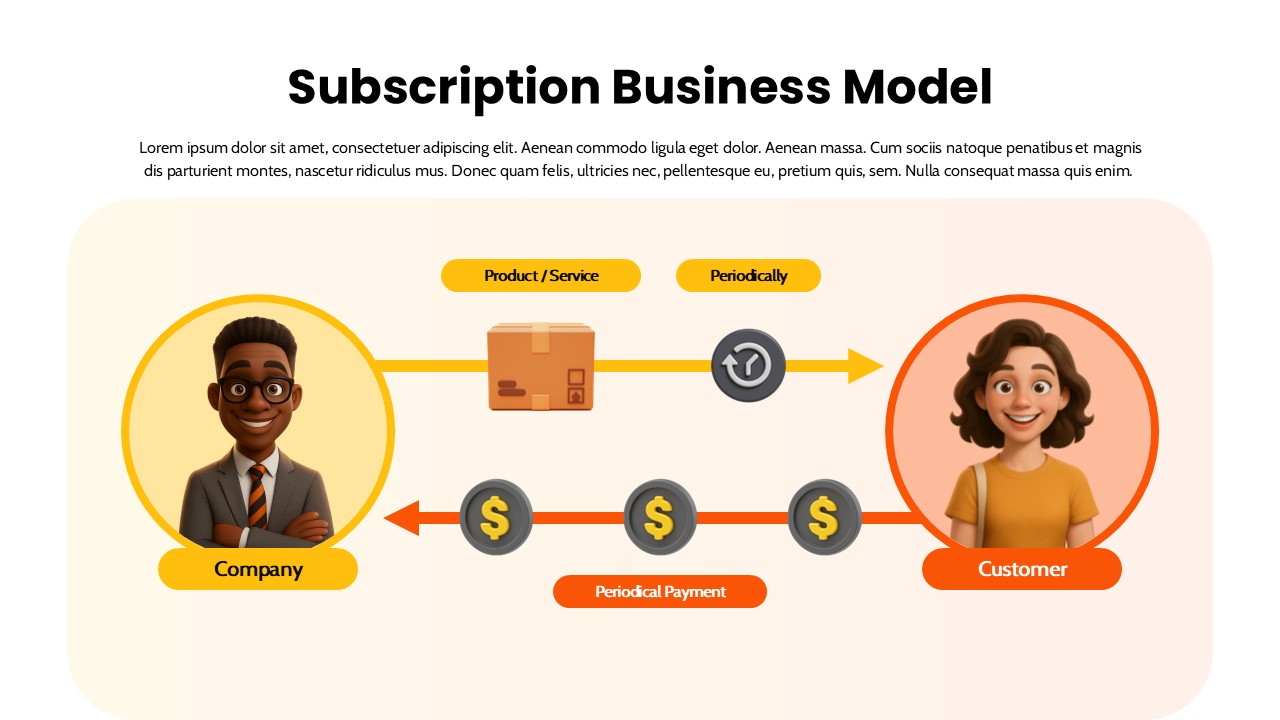
Subscription Business Model Flow Diagram Template for PowerPoint & Google Slides
Business Models
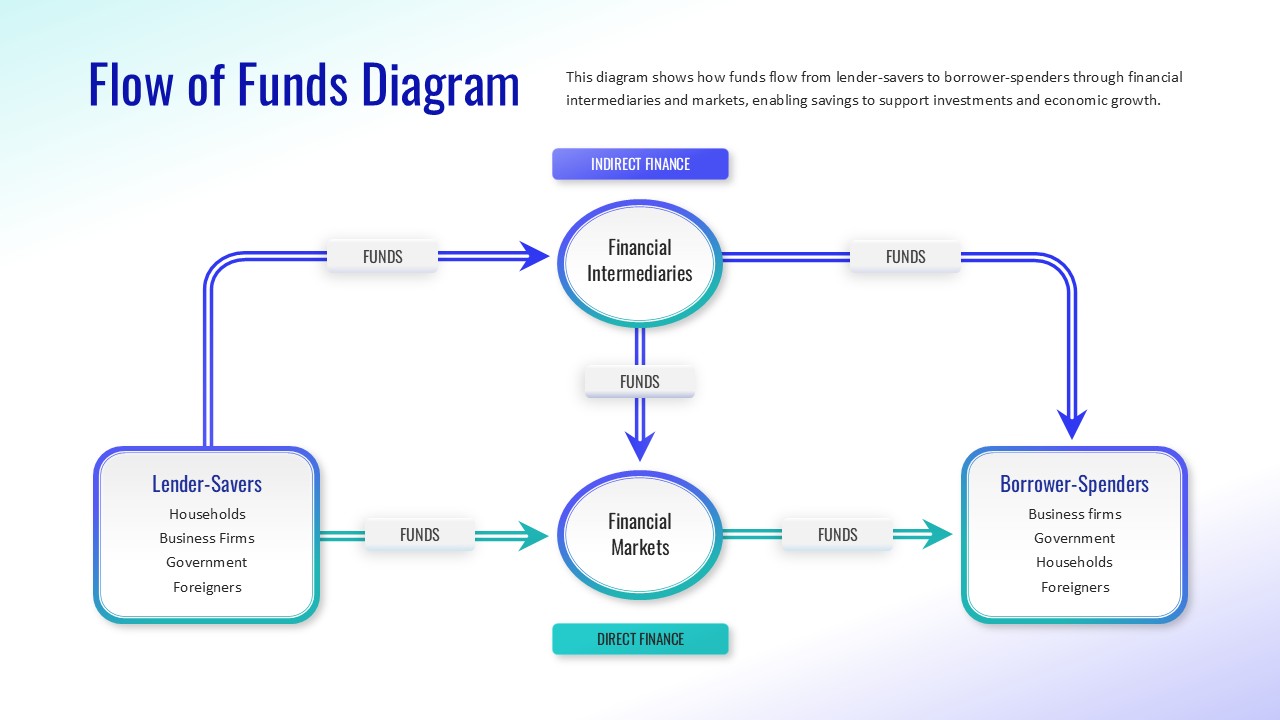
Flow of Funds Financial System Diagram Template for PowerPoint & Google Slides
Finance