Free Process Flow PowerPoint Slides Template
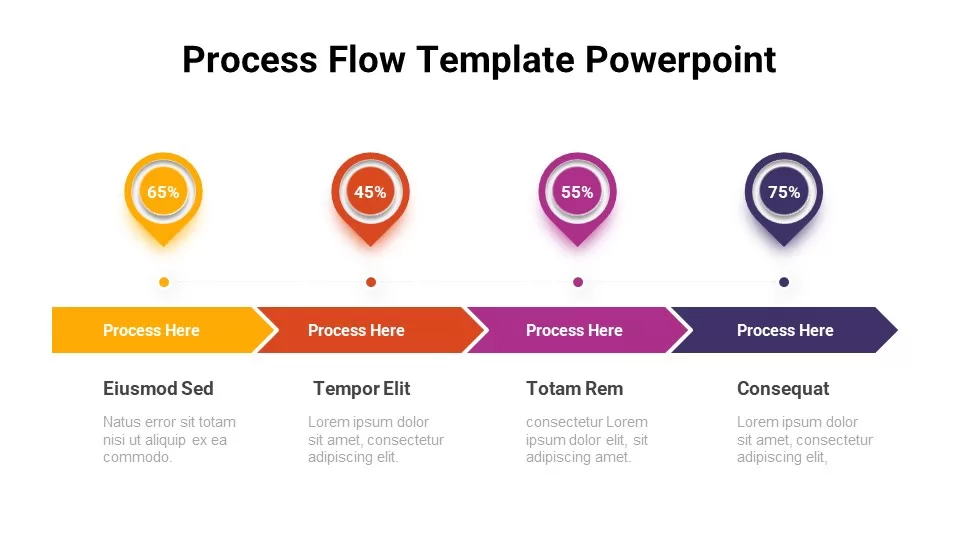

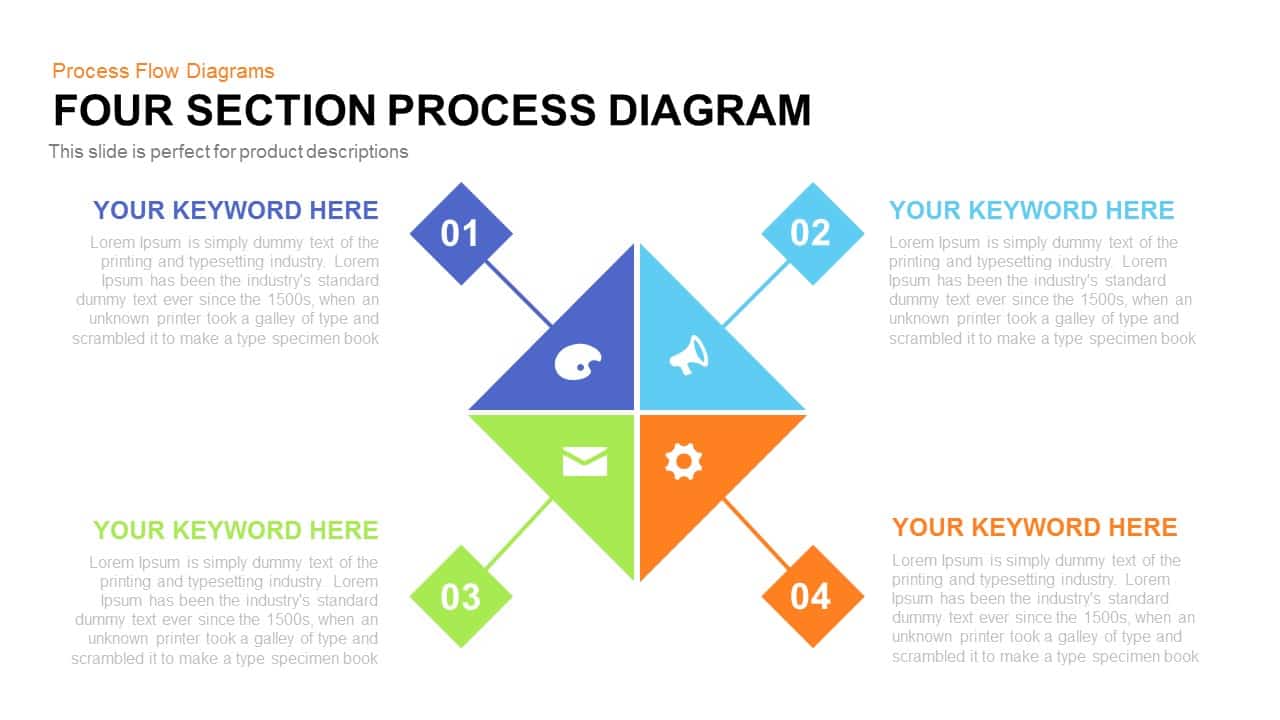
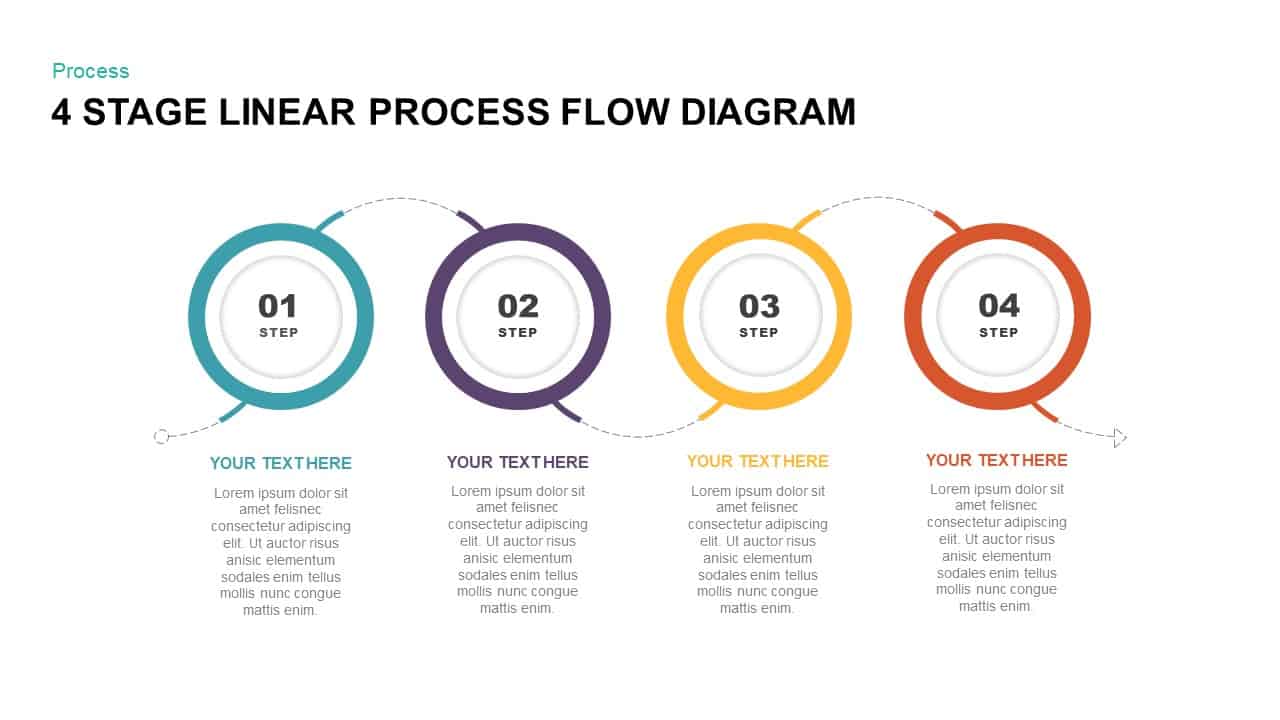
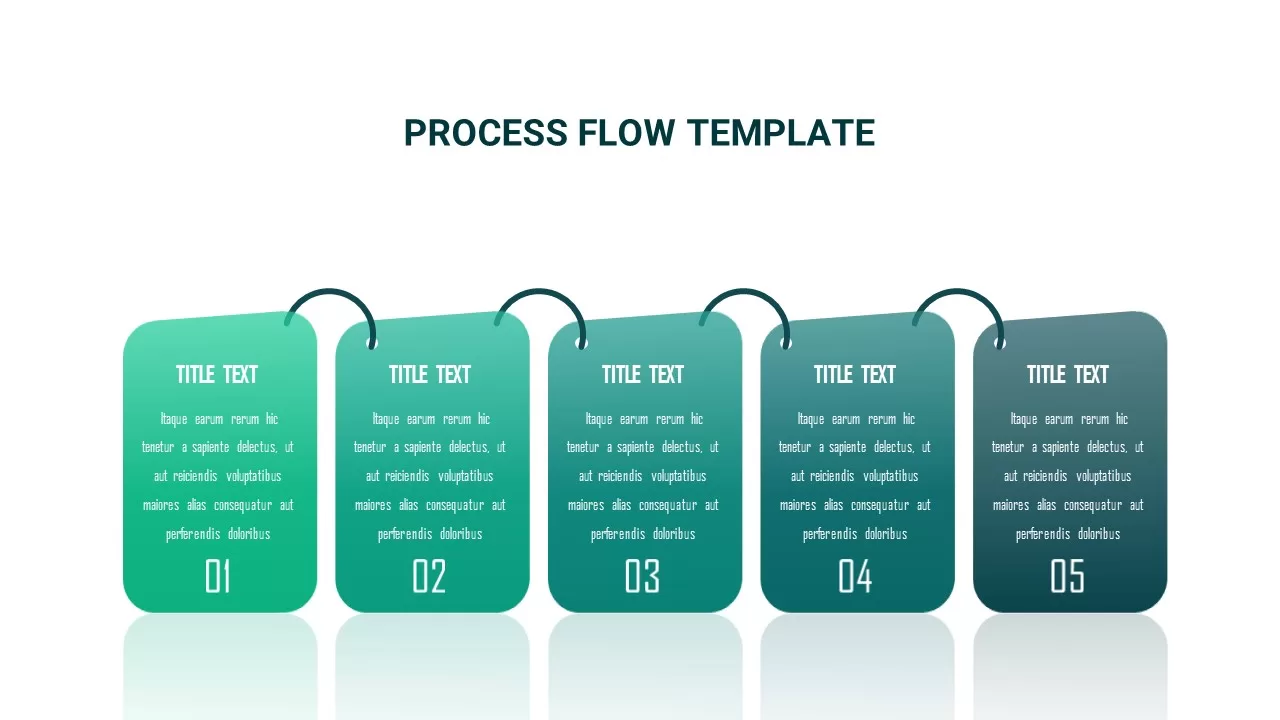
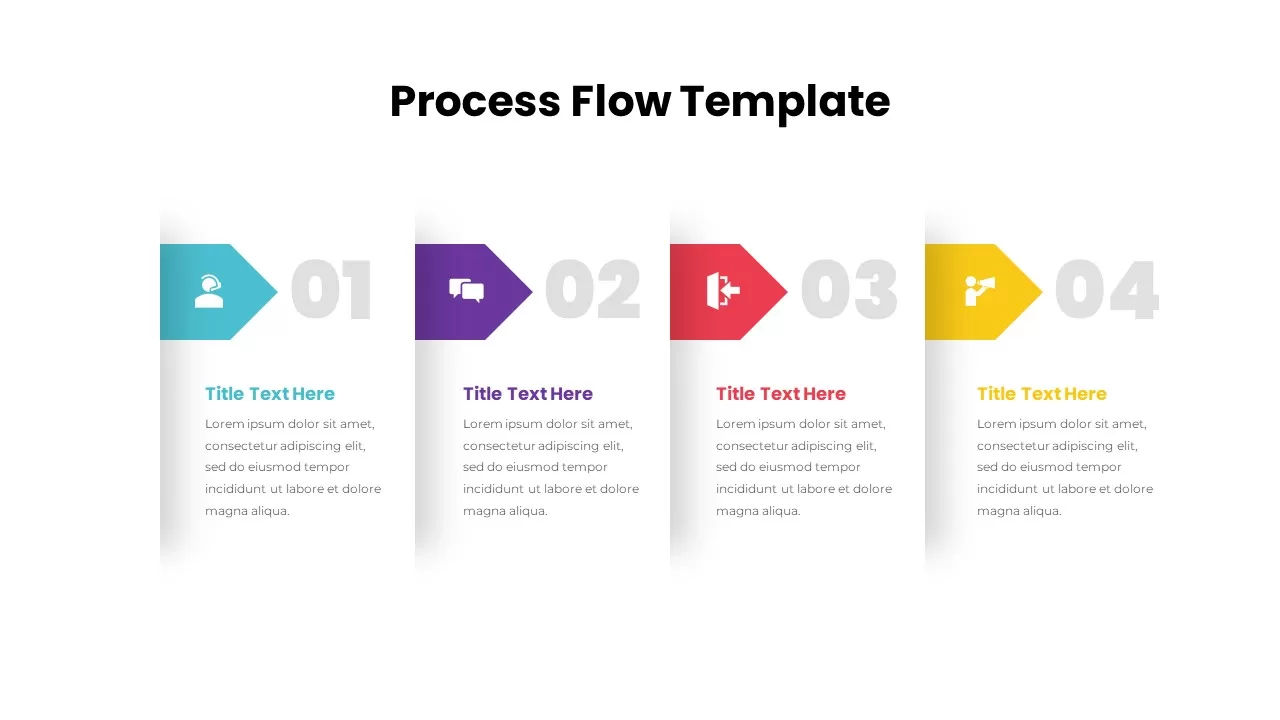
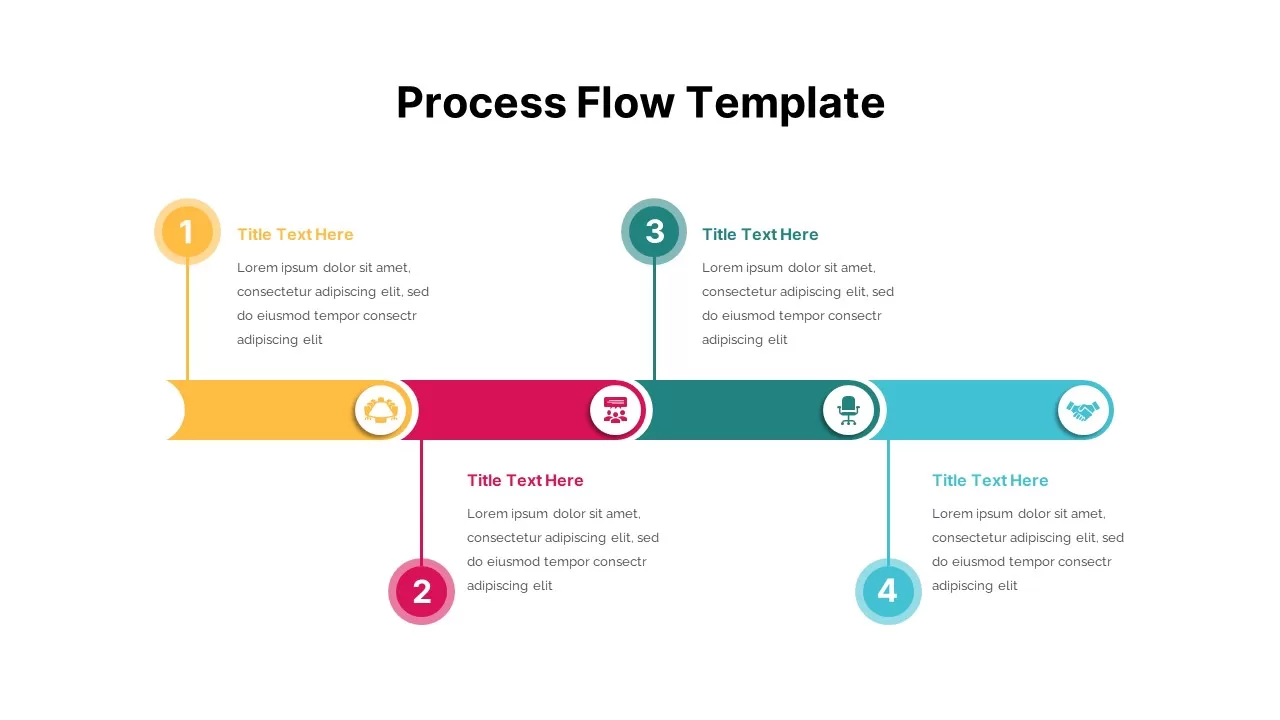
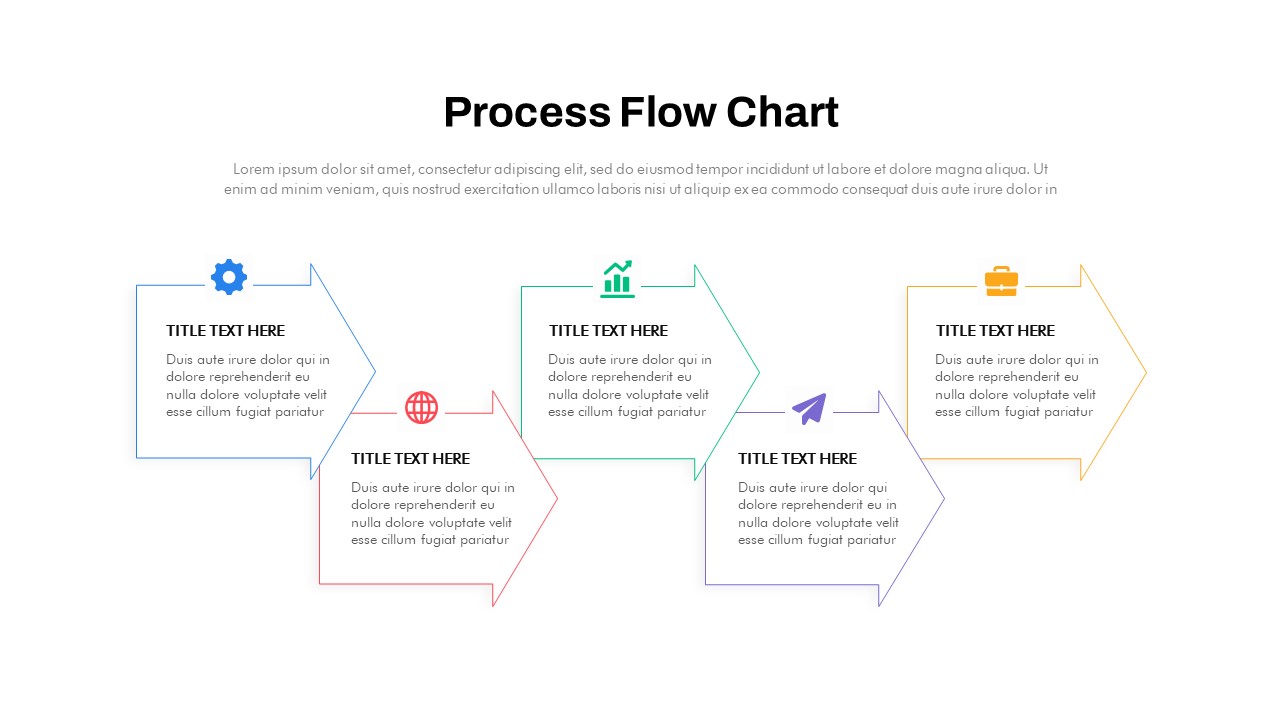
Free process flow PowerPoint template is a flat timeline showing four stages in a linear flow. This is the most common arrow timeline template for business process presentations. Apart from business process presentation, the colored template is ideal for presenting educational themes, and any presentation has four steps. This multipurpose PowerPoint diagram divides the process into four easy-to-follow steps. The charts contain arrow PowerPoint shapes in a connected sequence. However, the template comprises GPS shapes to indicate the company’s growth if you are in a business growth presentation. Linear timeline templates are best for process flow presentation, including the business process and development sequence.
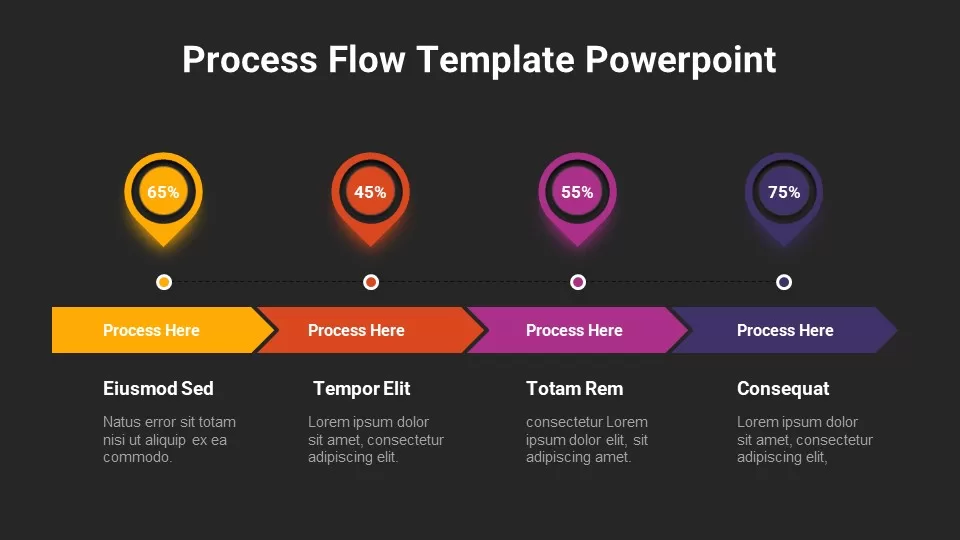
The arrow segments in the free process flow template for PowerPoint presentations allow the audience to differentiate the topics with color codes. For example, using the process flow ppt diagrams, you can present the developmental phases of theory, the company’s evolution, and the workflow process. Like other free PowerPoint templates, the process flow designs enable customization of all features, including size, shape, color, and the place of text holders. The template comes with two slides, each with a black and white background, allowing you to choose which one best suit your presentation. The simplicity of the design ensures that your content remains the focus, while the arrows and color coding help to guide your audience through your presentation.
The free process flow template is an excellent option if you are looking for a versatile and customizable template for PowerPoint & Google Slides that can help you effectively communicate your ideas and concepts. With its clear design and user-friendly features, this template will help you make an impressive PowerPoint presentation. You can alternatively download a simple timeline template for business presentations.
Login to download this file

Item ID
SB02598
Related Templates

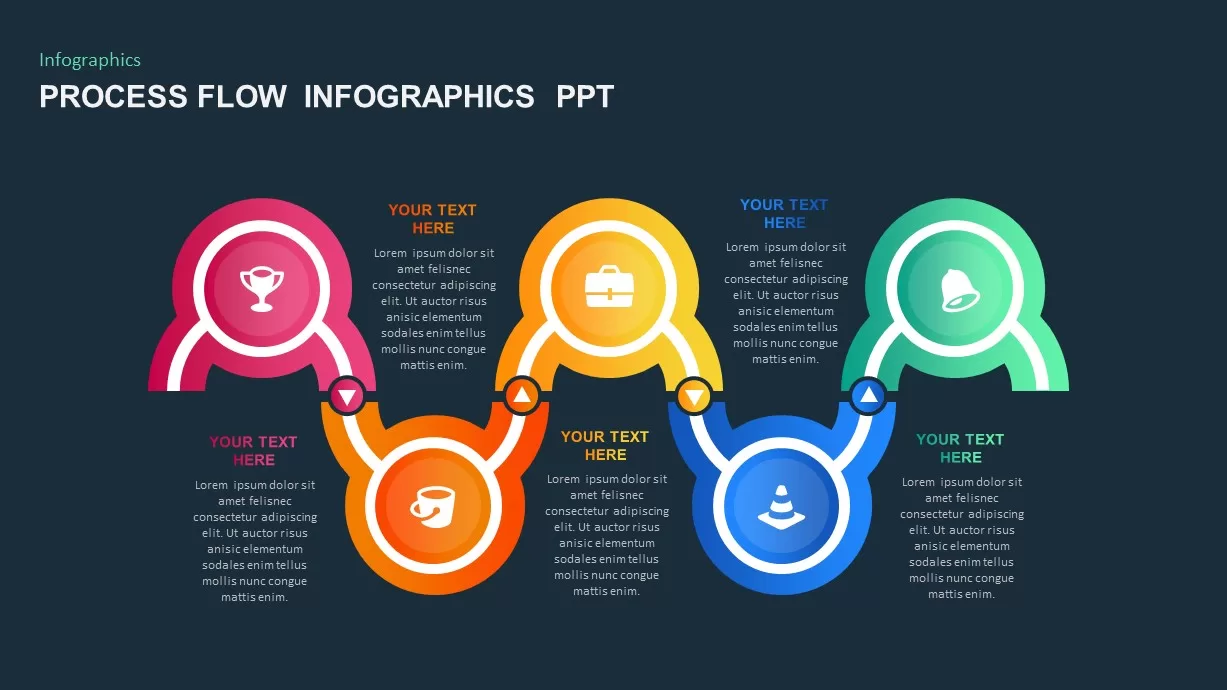
Free Colorful Process Flow Infographics Template for PowerPoint & Google Slides
Process
Free

Octagon Process Flow template for PowerPoint & Google Slides
Process
8-Stage Process Flow Flower Diagram Template for PowerPoint & Google Slides
Infographics
4 Section Pipe Diagram Process Flow Template for PowerPoint & Google Slides
Process
Puzzle Pipe Infographics Process Flow Template for PowerPoint & Google Slides
Process
Dynamic Shield Process Flow Diagram template for PowerPoint & Google Slides
Process
Six Hexagon Stages Process Flow Diagram Template for PowerPoint & Google Slides
Process
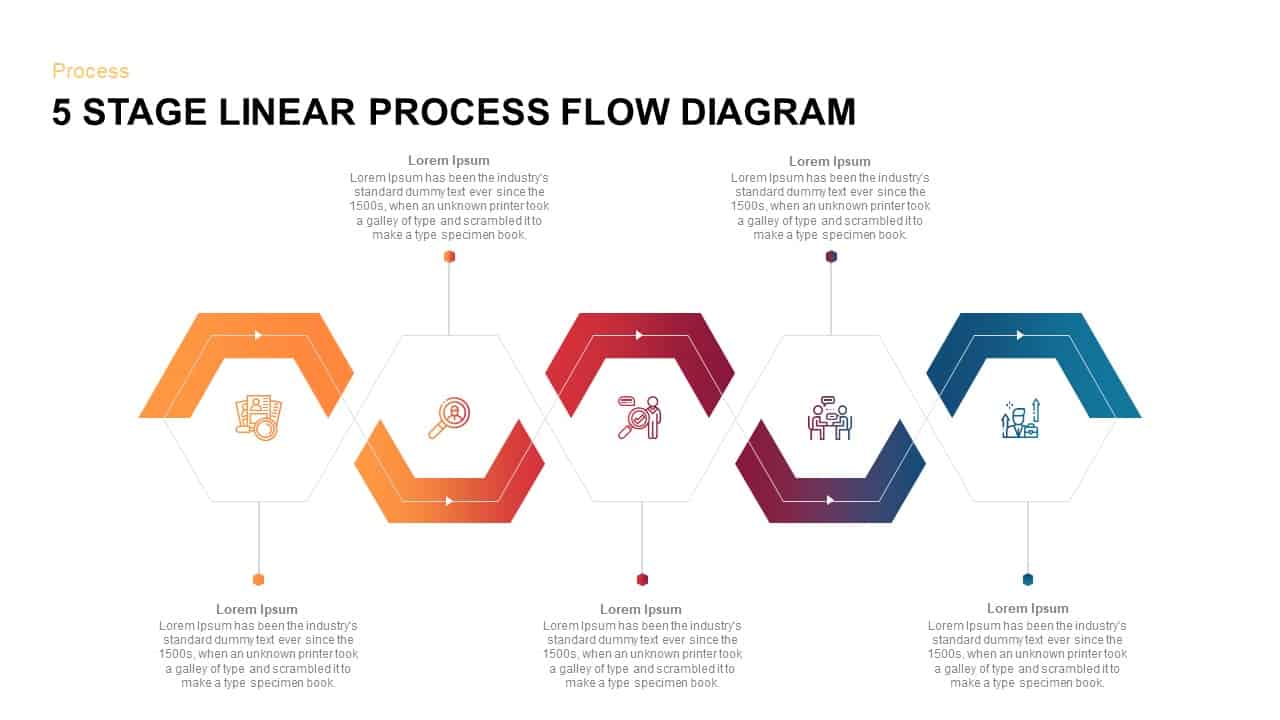
Five Stage Linear Process Flow Template for PowerPoint & Google Slides
Process
5-Stage Arrow Infographics Process Flow Template for PowerPoint & Google Slides
Arrow
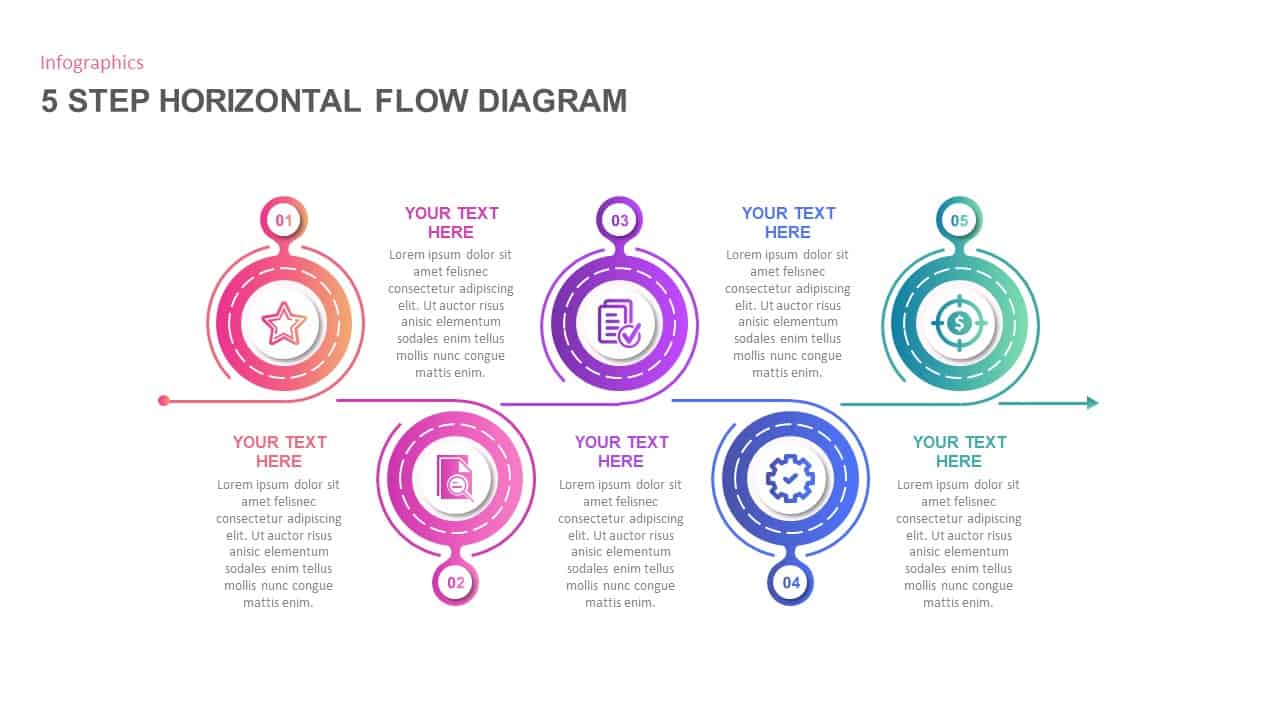
Process Flow Diagram template for PowerPoint & Google Slides
Infographics

15-Step Process Flow Diagram Template for PowerPoint & Google Slides
Process
3D Shape Linear Process Flow Diagram Template for PowerPoint & Google Slides
Process
Linear Process Flow Circles Diagram Template for PowerPoint & Google Slides
Process
Six-Stage Zig-Zag Process Flow Diagram Template for PowerPoint & Google Slides
Process
Vertical Business Process Flow Diagram Template for PowerPoint & Google Slides
Process
Five-Stage Direct Flow Arrow Process Template for PowerPoint & Google Slides
Arrow
Six-Sided Shutter Diagram Process Flow Template for PowerPoint & Google Slides
Process
10 Stages Business Flow Process Diagram template for PowerPoint & Google Slides
Business

Eight-Stage Radial Process Flow Diagram Template for PowerPoint & Google Slides
Process
Four-Plus Process Flow Diagram Template for PowerPoint & Google Slides
Process
Four-Stage Circular Process Flow Template for PowerPoint & Google Slides
Process
Five Stage Linear Process Flow Diagram Template for PowerPoint & Google Slides
Process
Isometric Five-Stage Process Flow Template for PowerPoint & Google Slides
Process
Five-Stage Linear Process Flow Diagram Template for PowerPoint & Google Slides
Process
Five-Step Hexagonal Process Flow Template for PowerPoint & Google Slides
Process
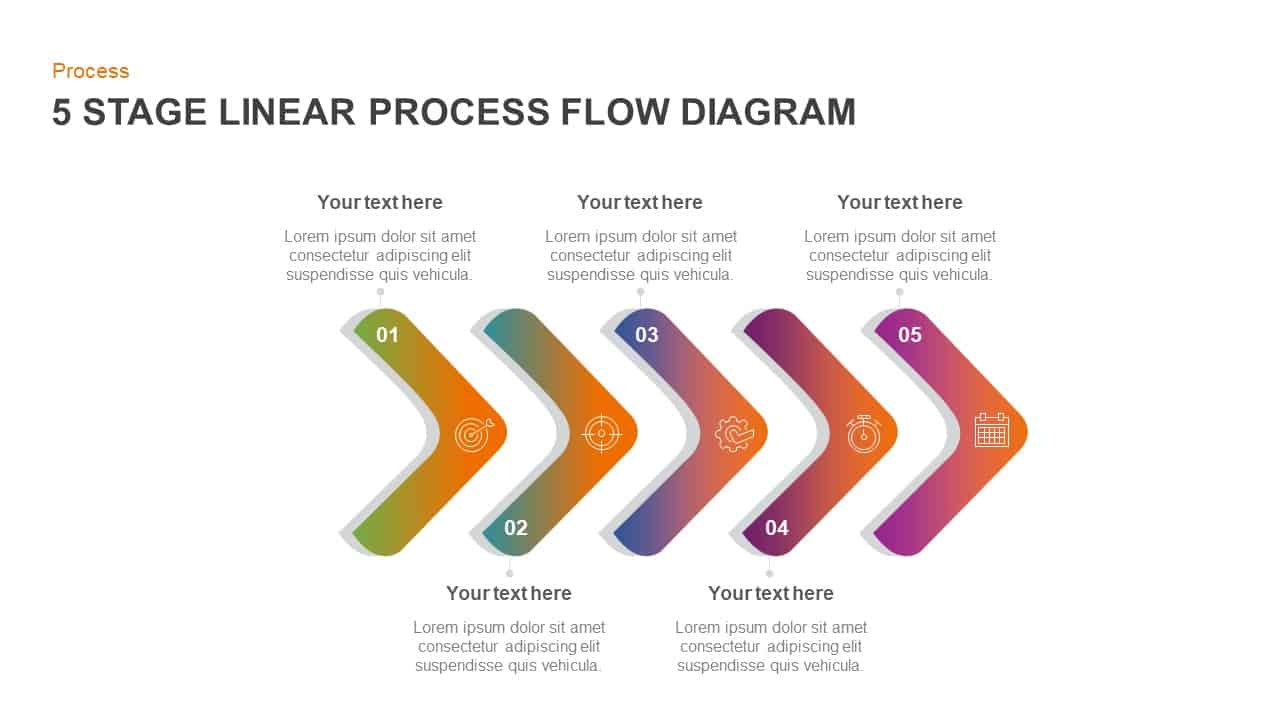
Gradient Chevron Five-Stage Process Flow Template for PowerPoint & Google Slides
Arrow
Six-Step Hexagon Process Flow Diagram Template for PowerPoint & Google Slides
Process
Five-Stage Circular Process Flow Diagram Template for PowerPoint & Google Slides
Circular
5-Stage Gear Process Flow Diagram Template for PowerPoint & Google Slides
Process
3D Seven-Stage Process Flow Diagram Template for PowerPoint & Google Slides
Process
Four-Stage Linear Process Flow Diagram Template for PowerPoint & Google Slides
Process
5-Stage Linear Process Flow Diagram Template for PowerPoint & Google Slides
Process
5 Stage Linear Process Flow Diagram Template for PowerPoint & Google Slides
Process
5 Stage Process Flow Diagram Template for PowerPoint & Google Slides
Process
4 Stage Linear Process Flow Diagram Template for PowerPoint & Google Slides
Process
7 Stage Linear Process Flow Diagram Template for PowerPoint & Google Slides
Process
8 Step Circular Process Flow Diagram Template for PowerPoint & Google Slides
Process
4 Stage Linear Process Flow Diagram Template for PowerPoint & Google Slides
Process
6-Step Business Process Flow Diagram Template for PowerPoint & Google Slides
Process
6-Step Circular Process Flow Diagram Template for PowerPoint & Google Slides
Process
4-Stage Linear Process Flow Diagram Template for PowerPoint & Google Slides
Process
4-Step Linear Process Flow Diagram Template for PowerPoint & Google Slides
Process
Business Process Management Flow Diagram Template for PowerPoint & Google Slides
Process
Colorful 8-Stage Droplet Process Flow Diagram Template for PowerPoint & Google Slides
Process
5-Step Circular Gradient Process Flow Template for PowerPoint & Google Slides
Process

Five-Step Process Flow Infographic Template for PowerPoint & Google Slides
Process
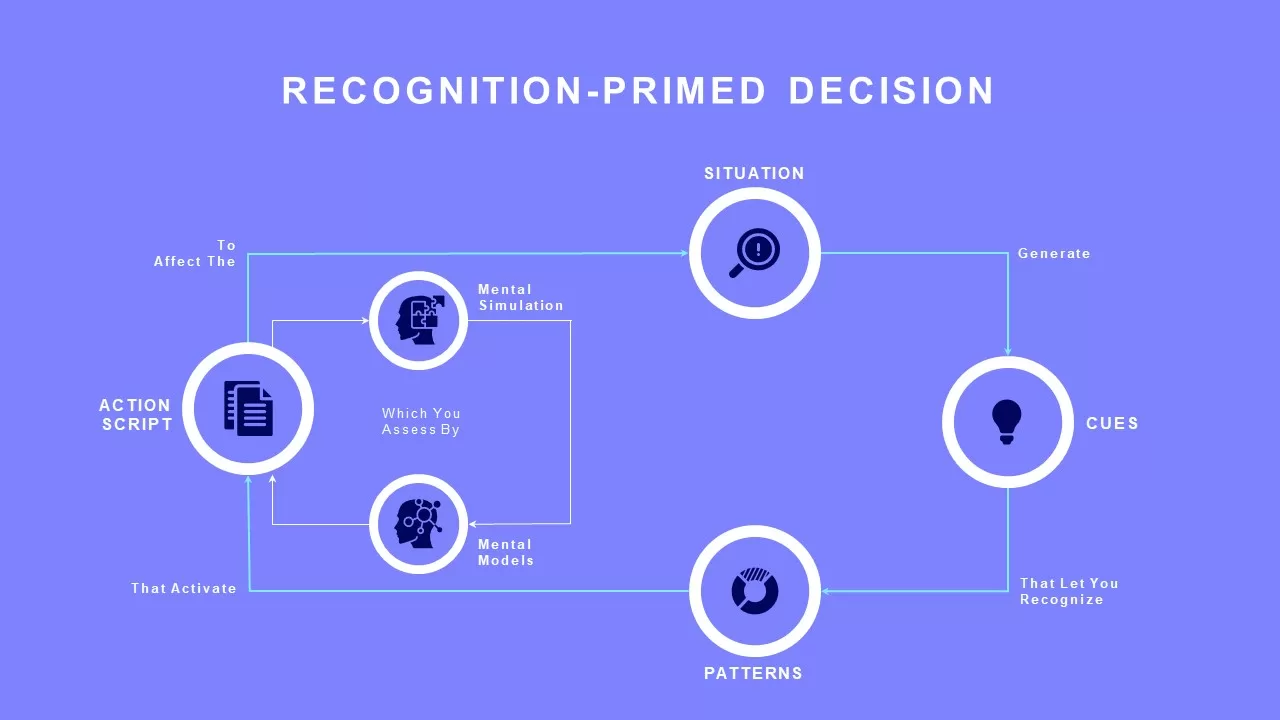
Recognition-Primed Decision Process Flow Template for PowerPoint & Google Slides
Flow Charts
Minimal Process Flow Diagram Infographic Template for PowerPoint & Google Slides
Process
Process Flow Overview template for PowerPoint & Google Slides
Business
Process Flow Steps template for PowerPoint & Google Slides
Business Plan
Process Flow Diagram template for PowerPoint & Google Slides
Process
Process Flow Template for PowerPoint & Google Slides
Process
Colorful Process Flow Template for PowerPoint & Google Slides
Process
Colorful Process Flow Infographics Template for PowerPoint & Google Slides
Process
Process Flow Template for PowerPoint & Google Slides
Process
Free
4 stage Process Flow template for PowerPoint & Google Slides
Process
5 Stage Process Flow Overview template for PowerPoint & Google Slides
Process
Curved Arrow Process Flow Infographic Template for PowerPoint & Google Slides
Process
Curved Arrow Process Flow Diagram Template for PowerPoint & Google Slides
Process
Curved Arrow Process Flow Diagram Template for PowerPoint & Google Slides
Arrow
Circle Arrows Process Flow template for PowerPoint & Google Slides
Process
Curved Arrow Process Flow template for PowerPoint & Google Slides
Process
Circular Arrows Process Flow template for PowerPoint & Google Slides
Process
Curved Arrow Process Flow template for PowerPoint & Google Slides
Process
Circular Arrows Process Flow template for PowerPoint & Google Slides
Process
Circular Arrows Process Flow template for PowerPoint & Google Slides
Process
Circle Arrow Process Flow template for PowerPoint & Google Slides
Process
Circle Arrow Process Flow template for PowerPoint & Google Slides
Process
Animated Accordion Process Flow Template for PowerPoint & Google Slides
Process
Hexagonal Process Flow Template for PowerPoint & Google Slides
Process
Conveyor Belt Infographic Process Flow Template for PowerPoint & Google Slides
Process
Conveyor Belt Sequential Process Flow Template for PowerPoint & Google Slides
Process
Dynamic Conveyor Belt Process Flow Template for PowerPoint & Google Slides
Process
3D Conveyor Belt Process Flow Diagram Template for PowerPoint & Google Slides
Process
Talent Acquisition Process Flow Template for PowerPoint & Google Slides
Recruitment
Neurology Neuron Structure Process Flow Template for PowerPoint & Google Slides
Health
Process Flow Diagram Template PowerPoint & Google Slides
Process
Wastewater Treatment Process Flow Chart Template for PowerPoint & Google Slides
Flow Charts
Animated Process Flow Chart Template for PowerPoint & Google Slides
Infographics
Capital Investments Process Flow Diagram Template for PowerPoint & Google Slides
Process
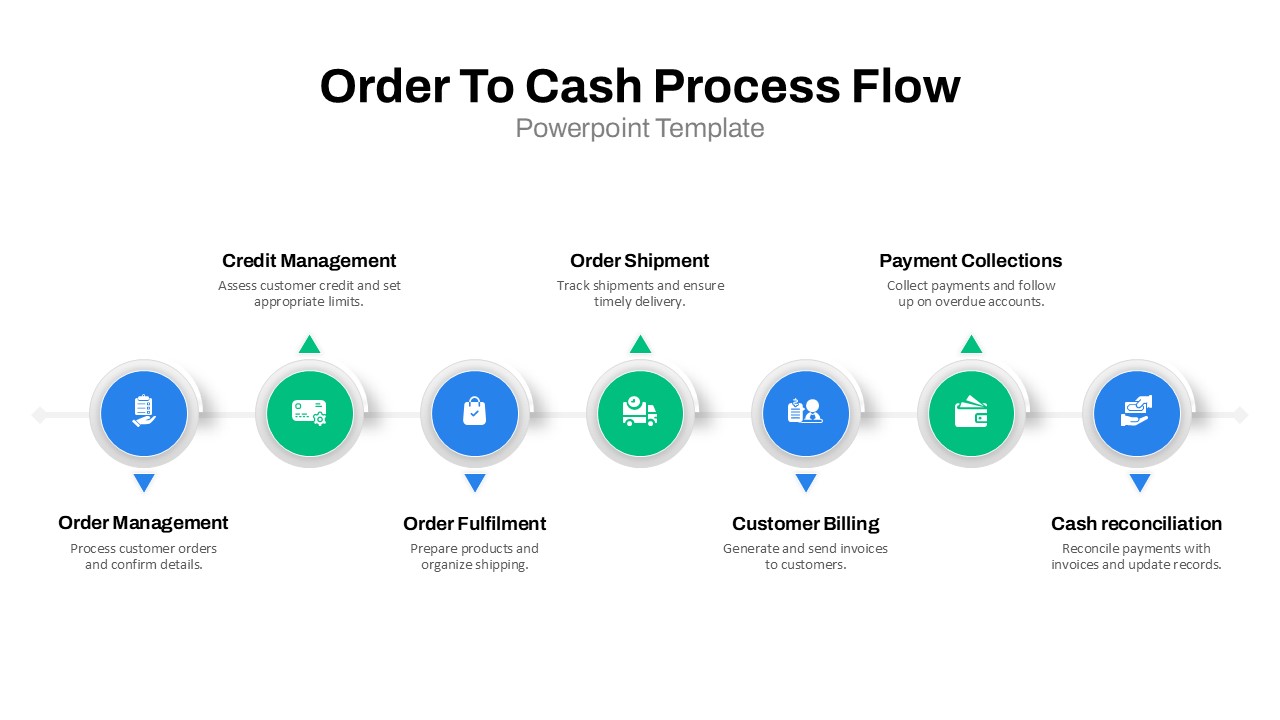
Order to Cash Process Flow Diagram Template for PowerPoint & Google Slides
Process
Chevron Process Flow Sequence Slide Template for PowerPoint & Google Slides
Arrow
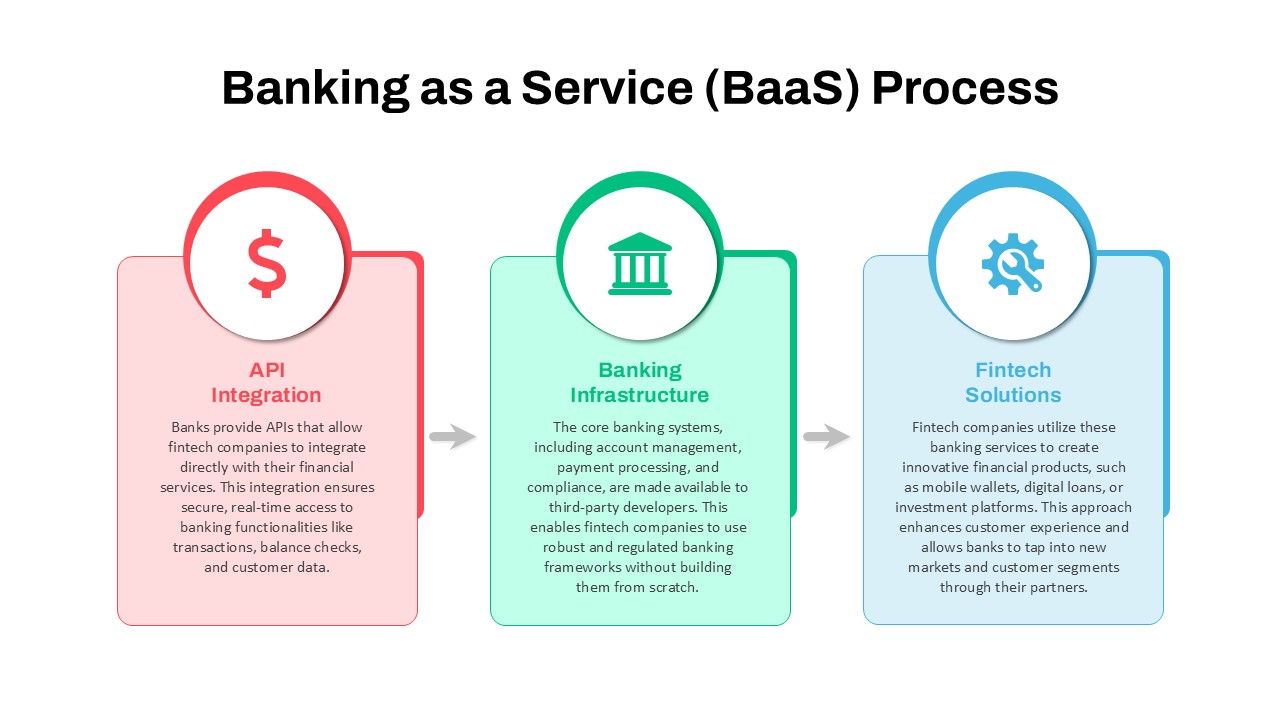
Banking as a Service (BaaS) Process Flow Template for PowerPoint & Google Slides
Process
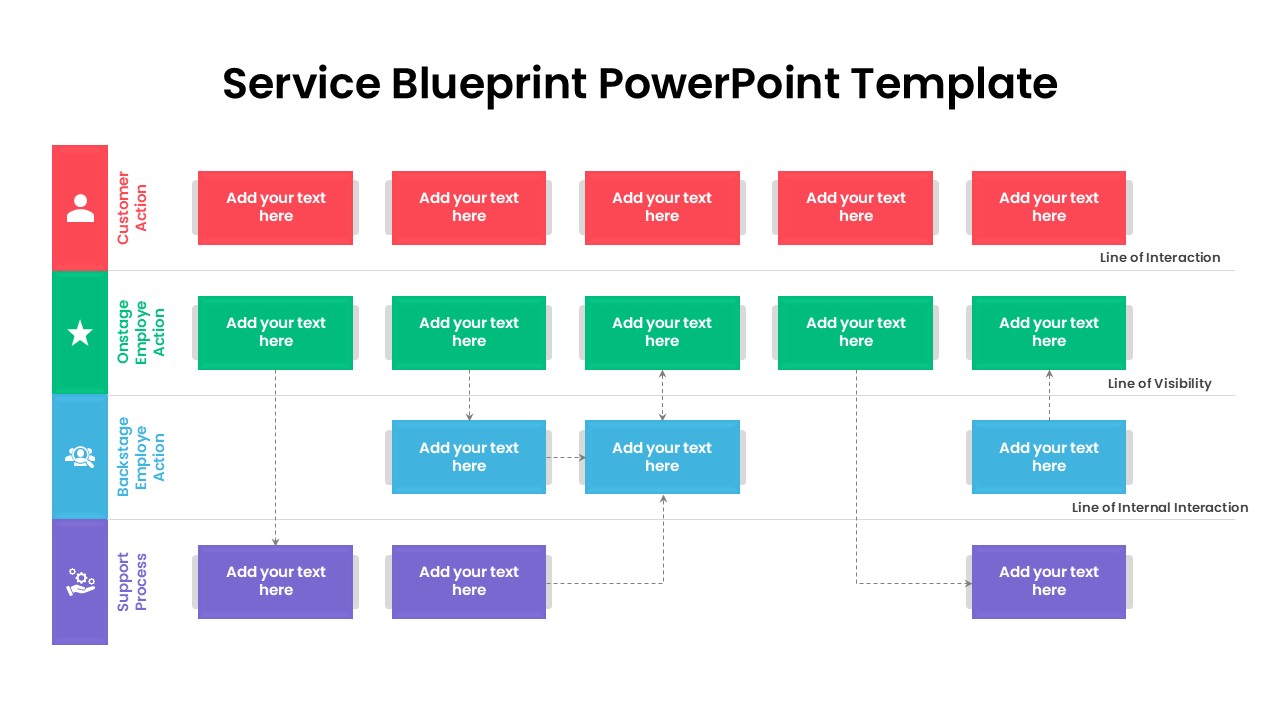
Service Blueprint Process Flow Template for PowerPoint & Google Slides
Process
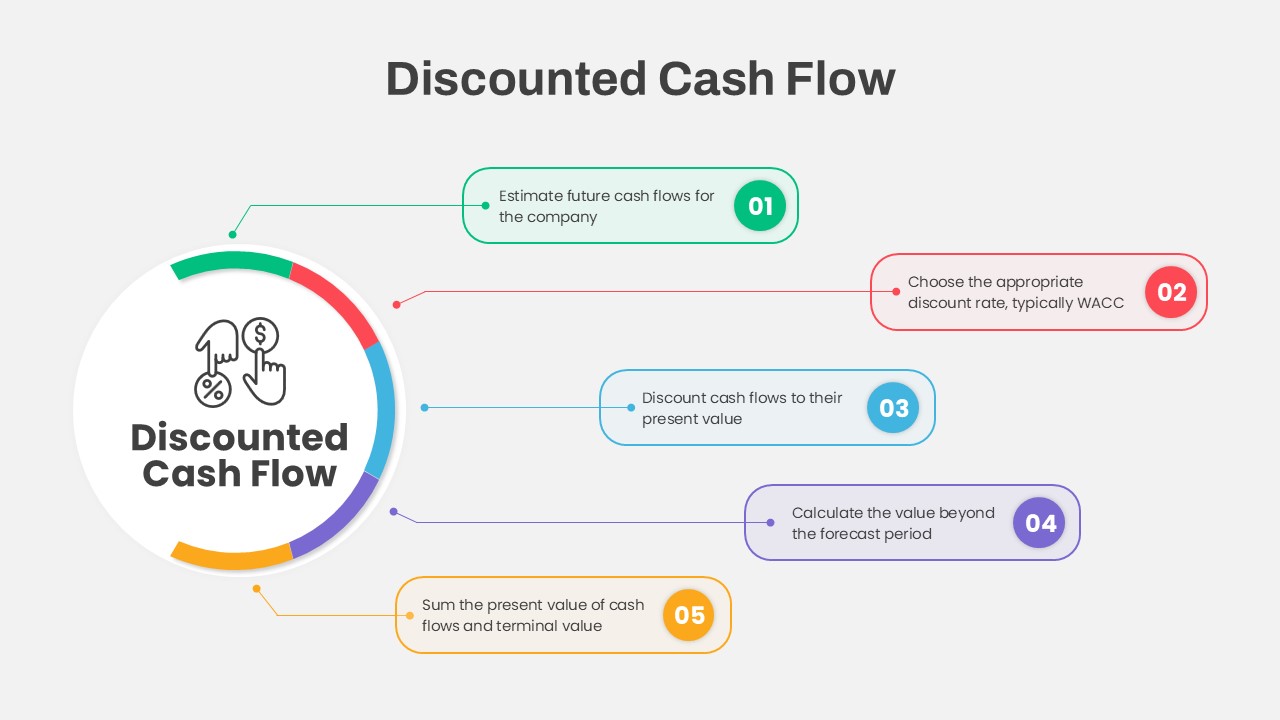
Discounted Cash Flow Five-Step Process Template for PowerPoint & Google Slides
Process
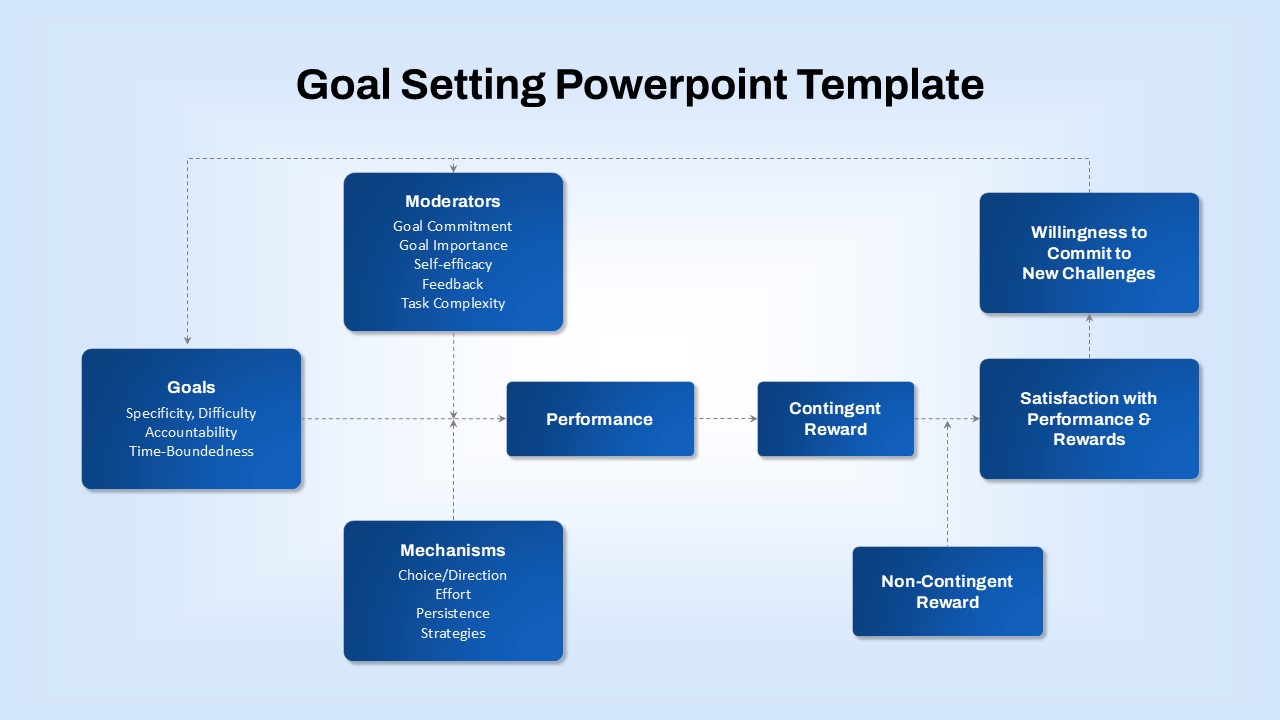
Goal-Setting Process Flow Diagram Template for PowerPoint & Google Slides
Goals
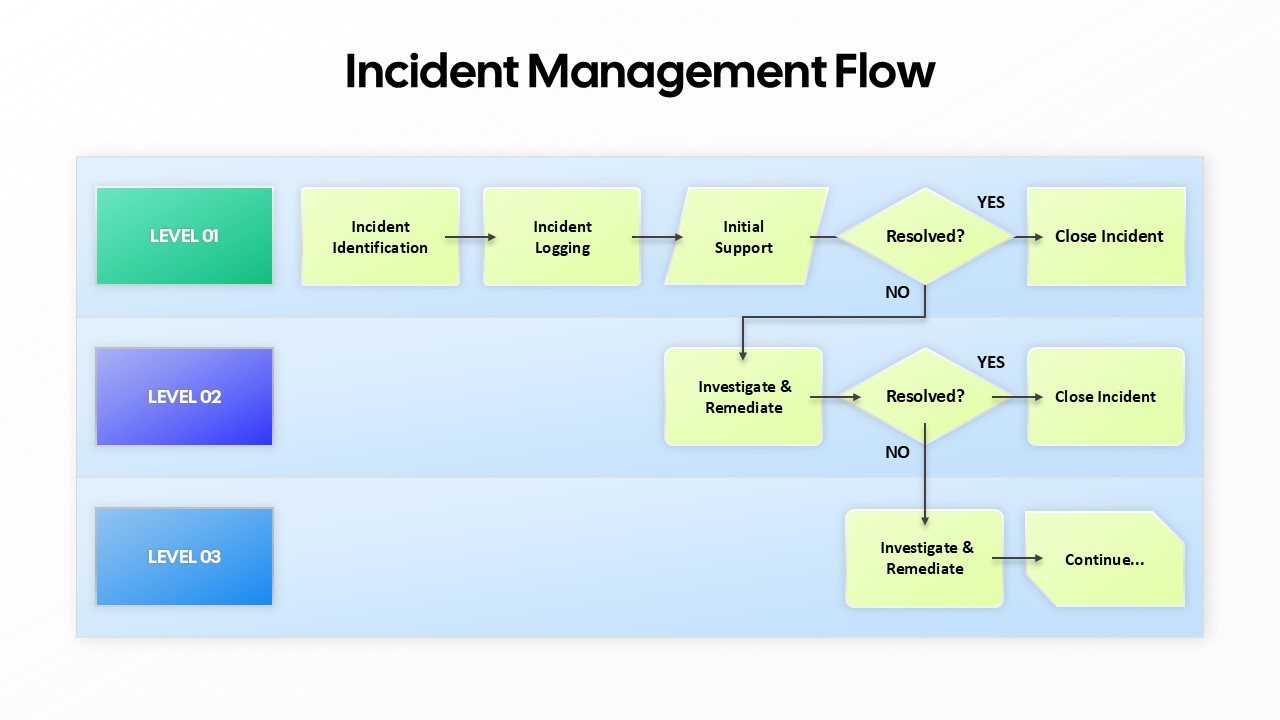
Incident Management Flow Process template for PowerPoint & Google Slides
Flow Charts
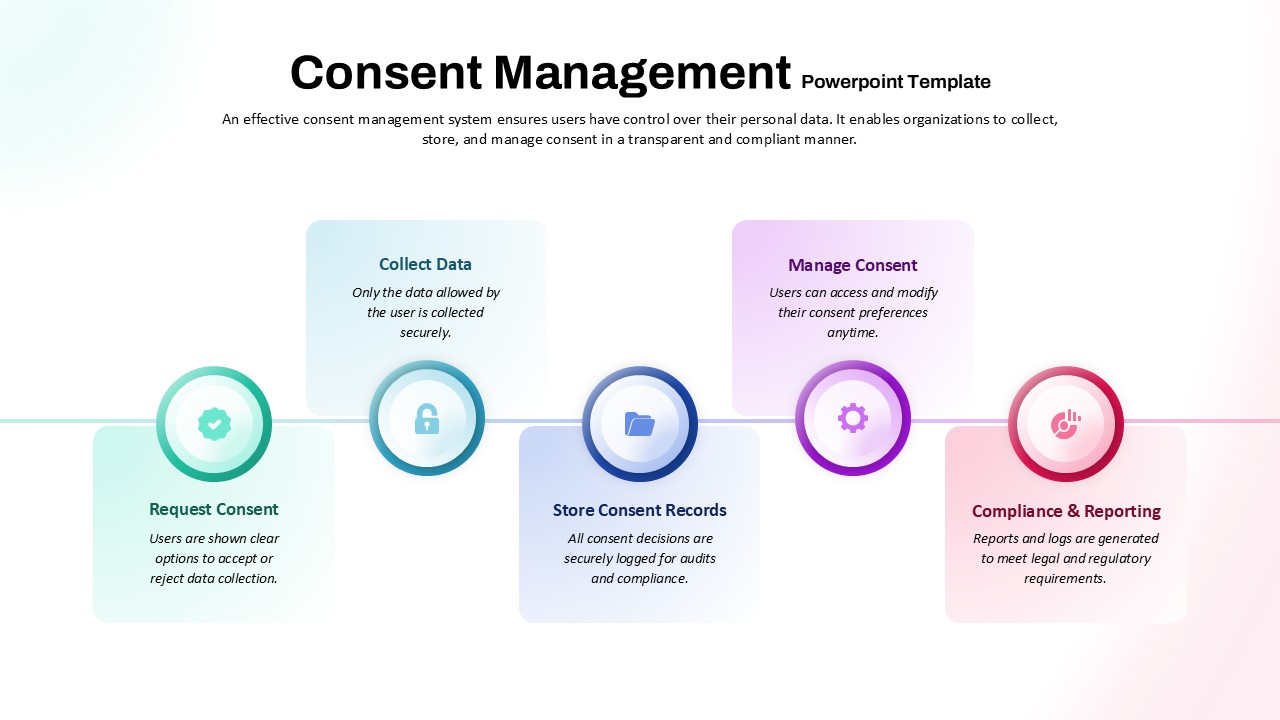
Consent Management System Process Flow Template for PowerPoint & Google Slides
Process
Resume Screening Process Flow Diagram Template for PowerPoint & Google Slides
Process
Q-Learning Process Flow Diagram Template for PowerPoint & Google Slides
Process
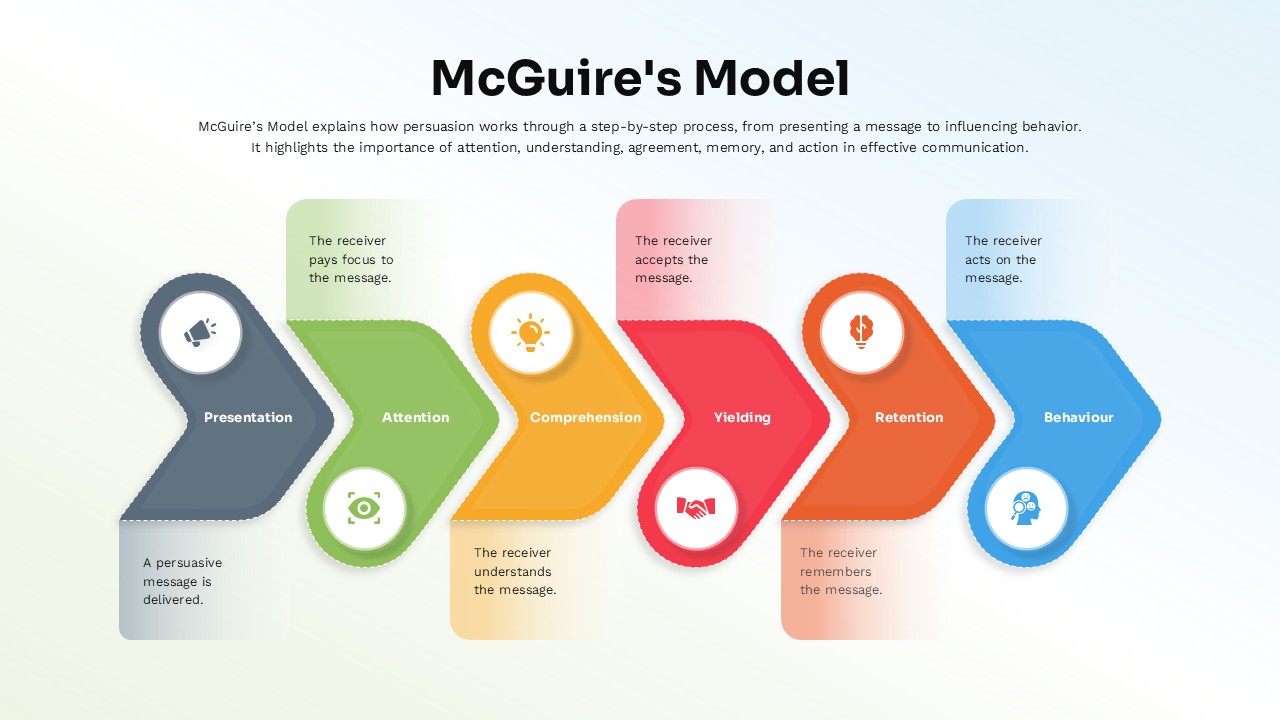
McGuire’s Persuasion Process Flow Diagram Template for PowerPoint & Google Slides
Marketing
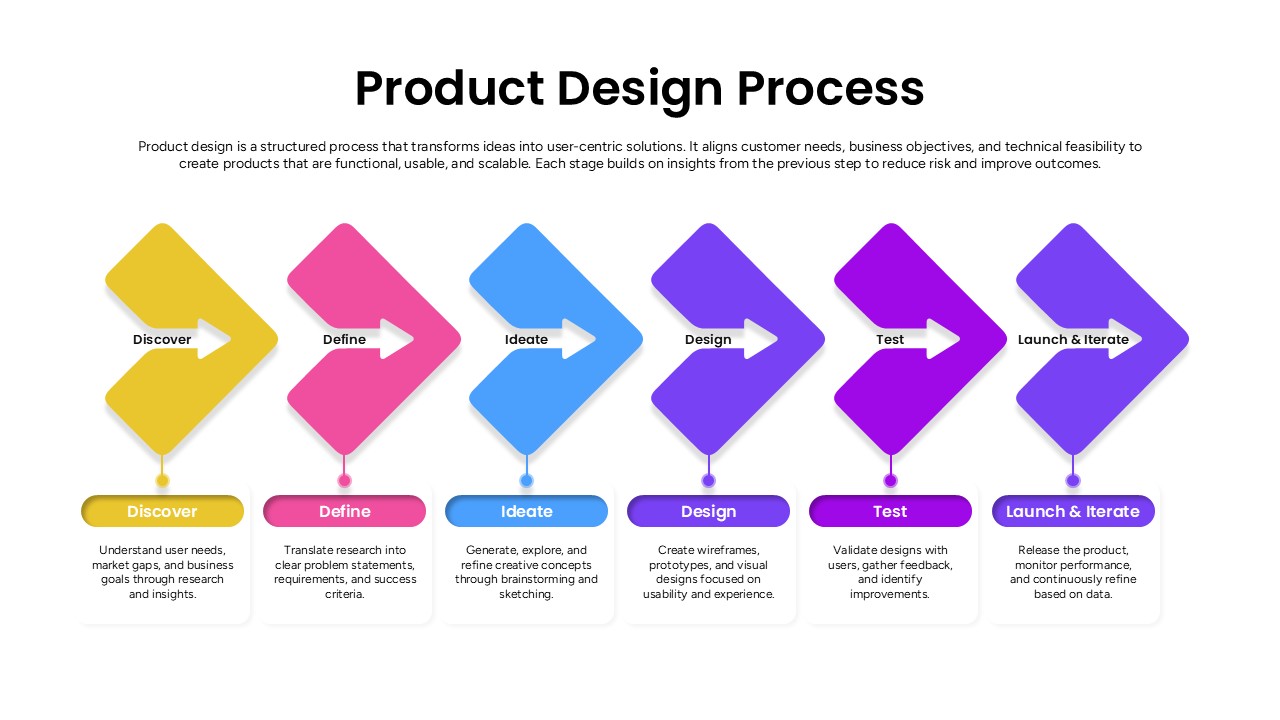
Product Design Process Flow Diagram Template for PowerPoint & Google Slides
Process
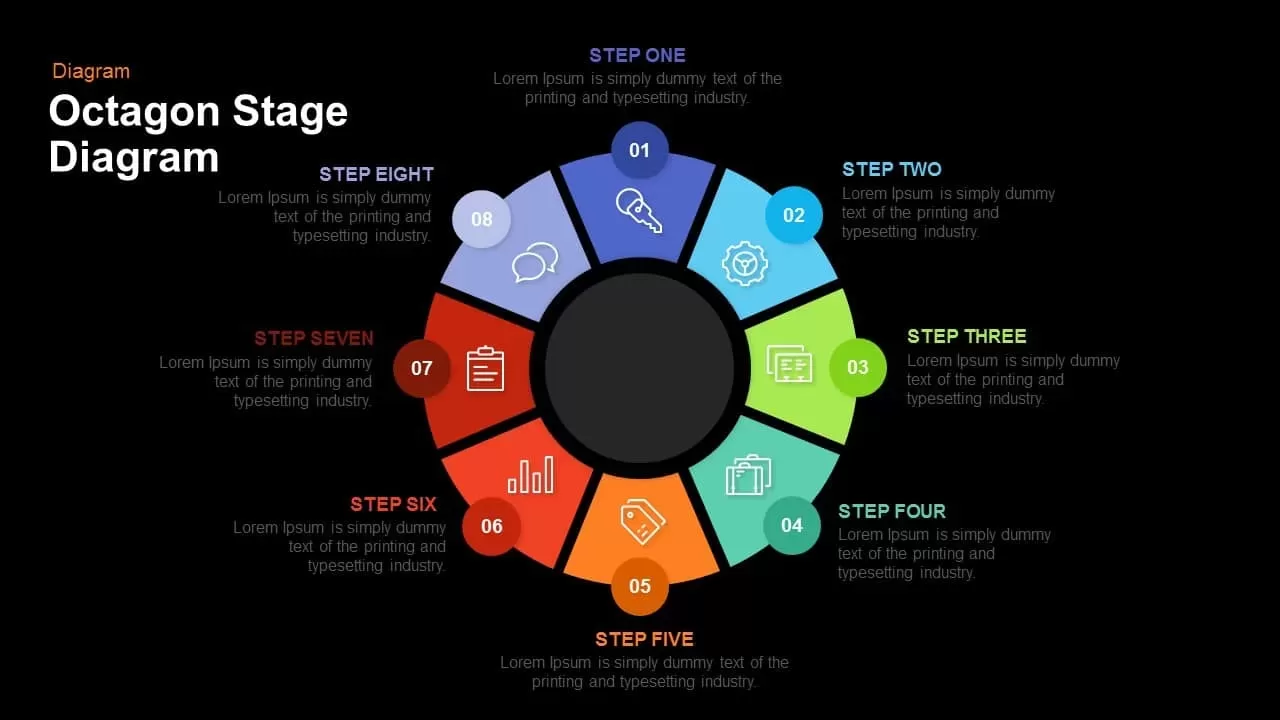
Octagon Stage Process Flow Diagram for PowerPoint & Google Slides
Process
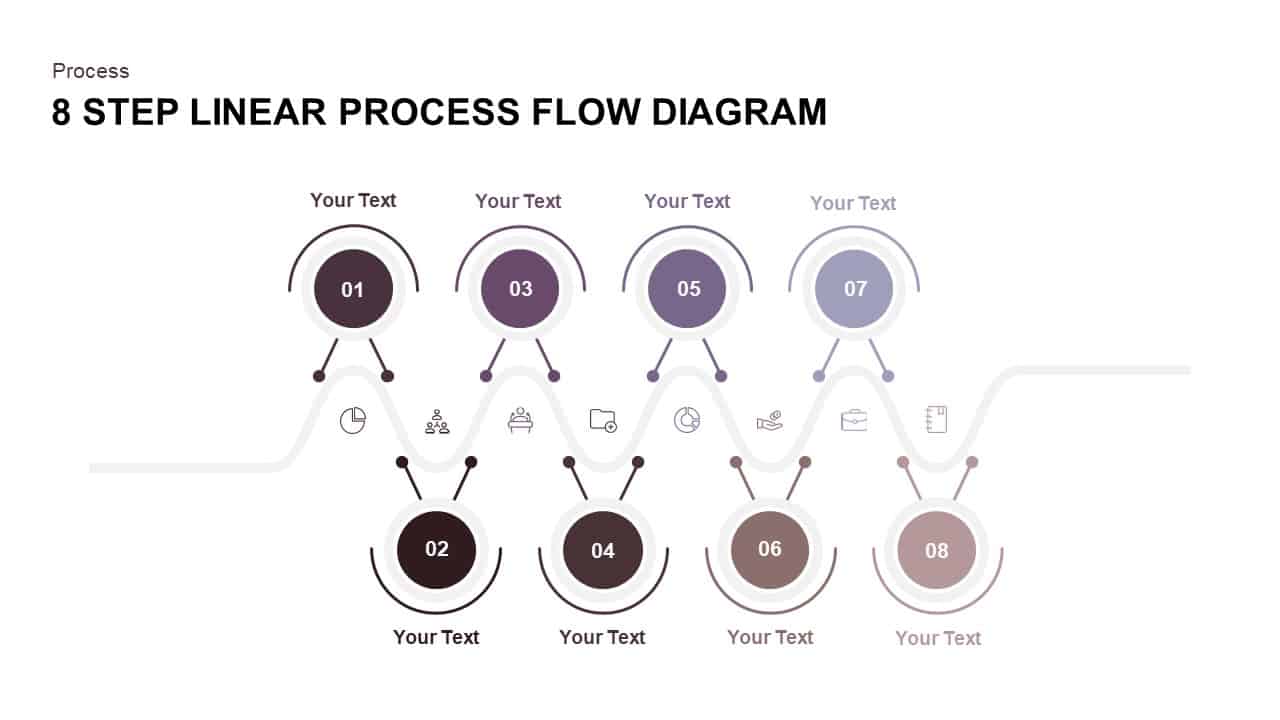
8 Step Linear Process Flow Diagram for PowerPoint & Google Slides
Process
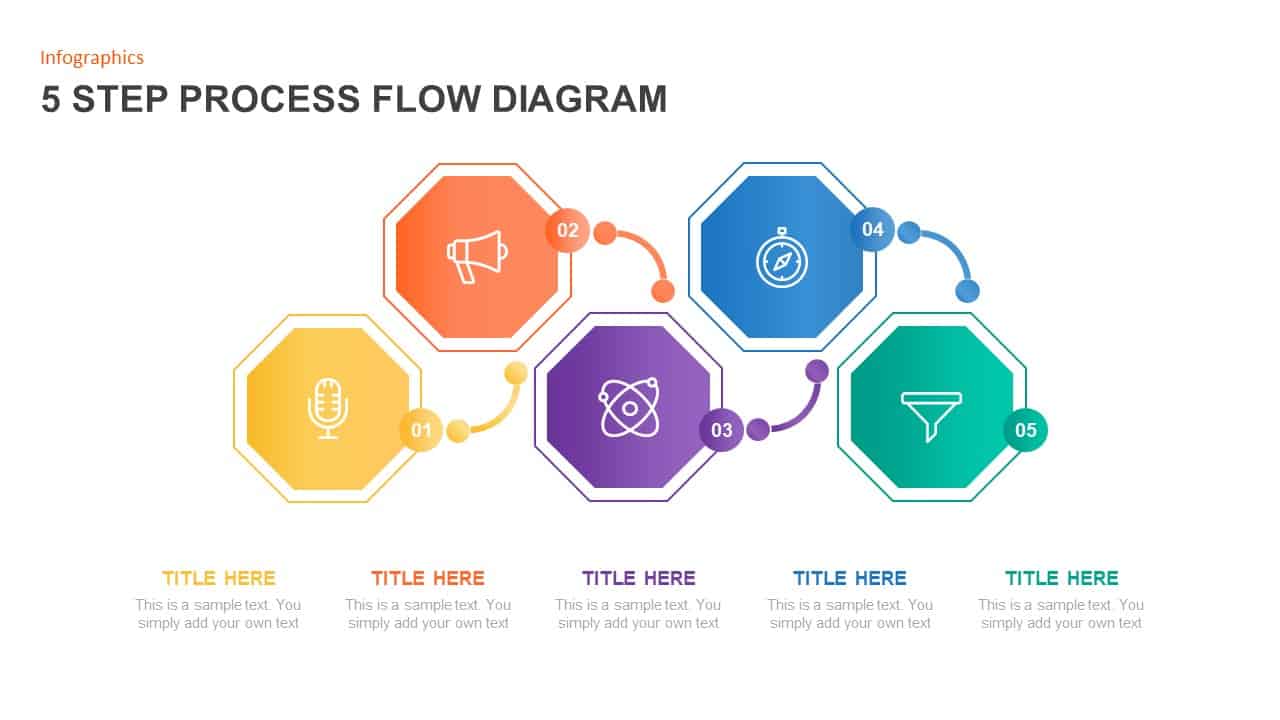
5 Step Process Flow Diagram for PowerPoint & Google Slides
Process
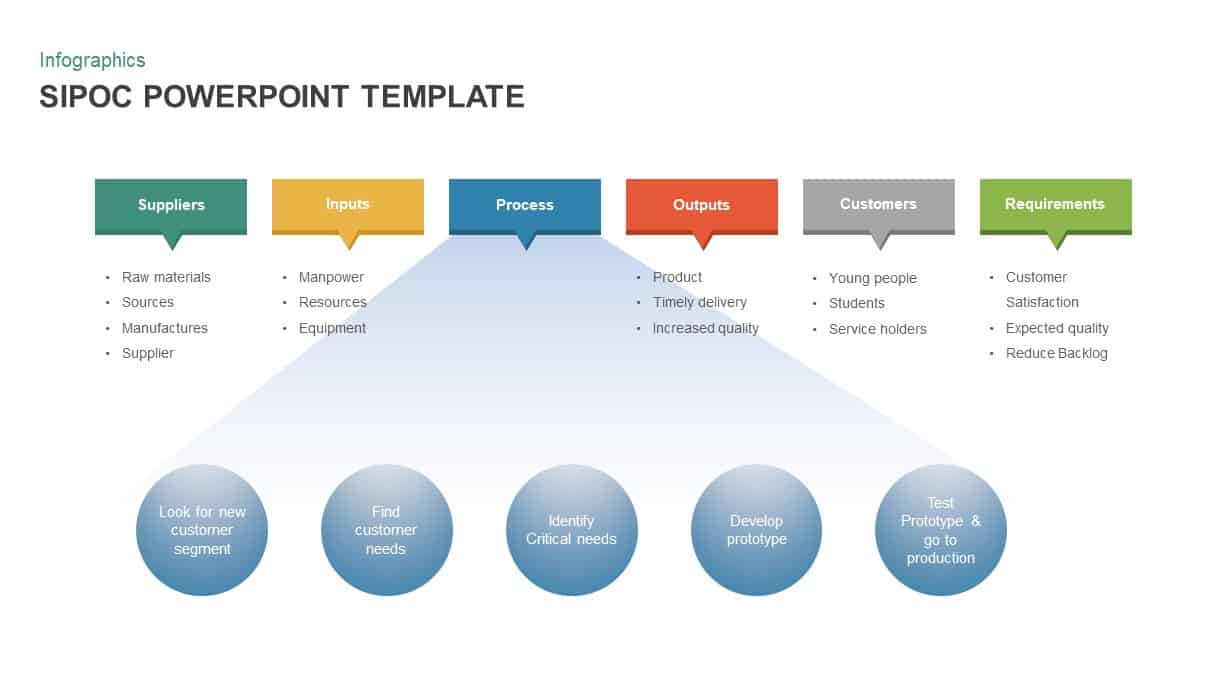
Color-Coded SIPOC Diagram with Process Flow for PowerPoint & Google Slides
Process
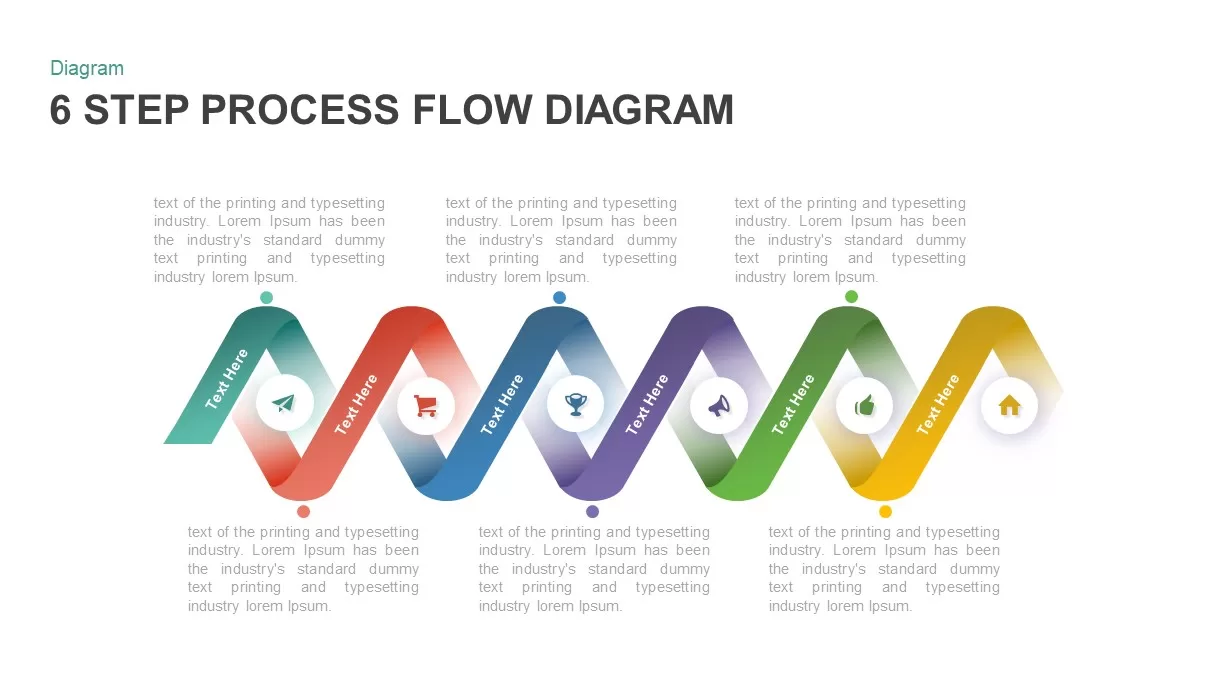
6 Step Process Flow Diagram for PowerPoint & Google Slides
Charts
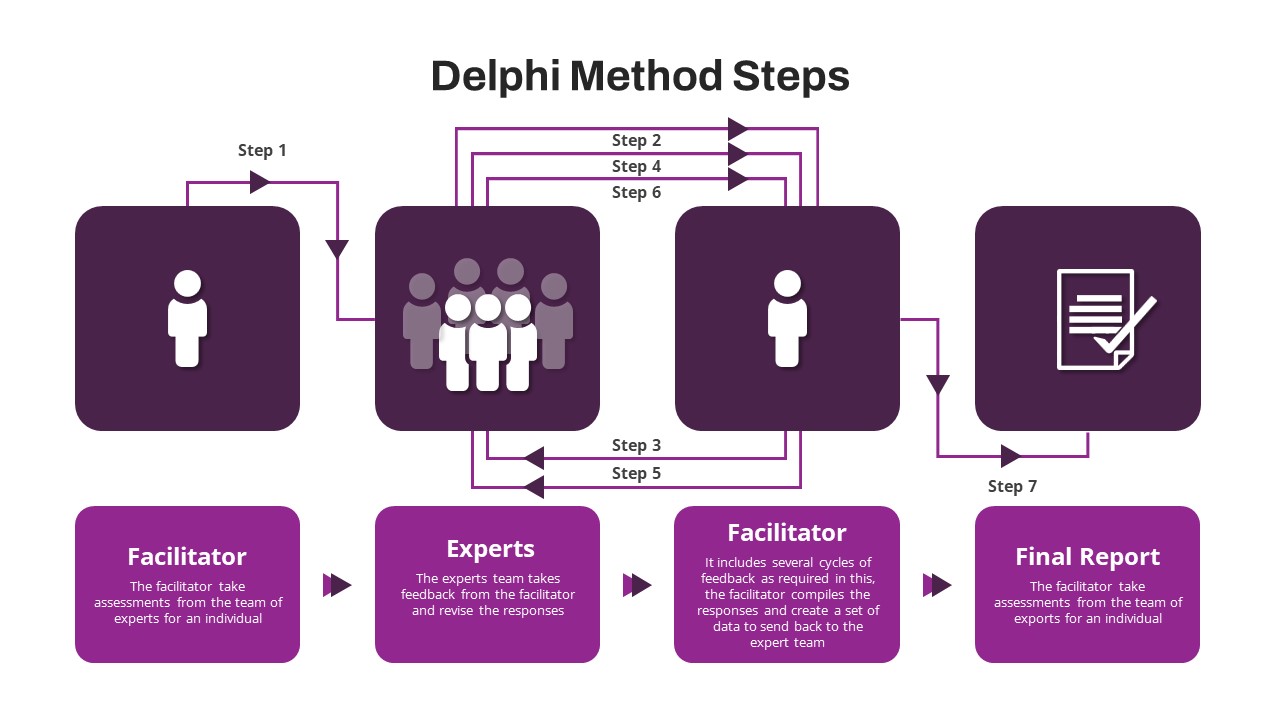
Delphi Method Process Flow Slide for PowerPoint & Google Slides
Process
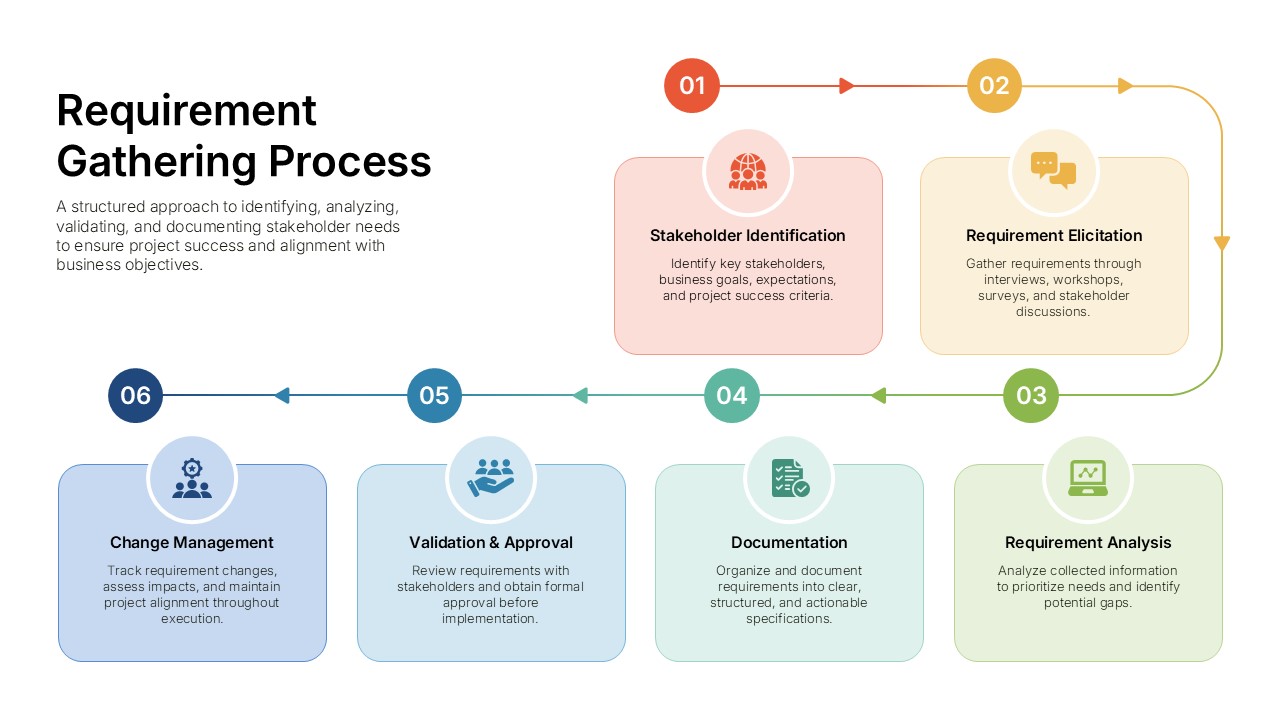
Business Requirement Gathering Process Flow PowerPoint Template
Business Requirements
5 Steps Linear Process Flow Diagram template
Process