Advanced Data Flow Diagram Pack Template for PowerPoint & Google Slides


Description
Leverage this six-slide Data Flow Diagram (DFD) pack to visualize system processes and data movements with professional clarity. The pack includes:
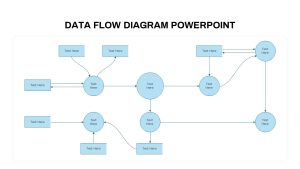
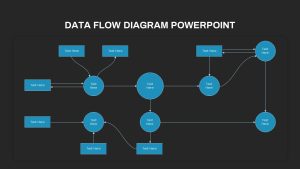
A comprehensive overview slide for mapping end-to-end data flow between external entities and core processes.
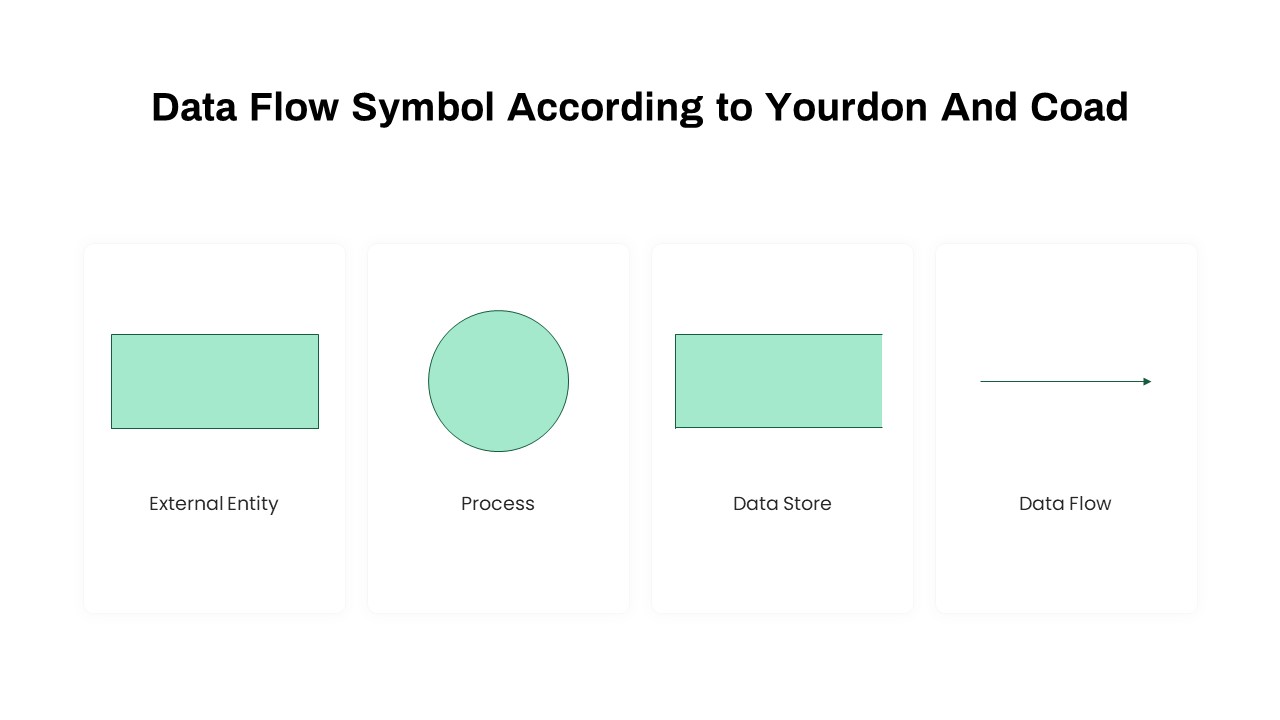
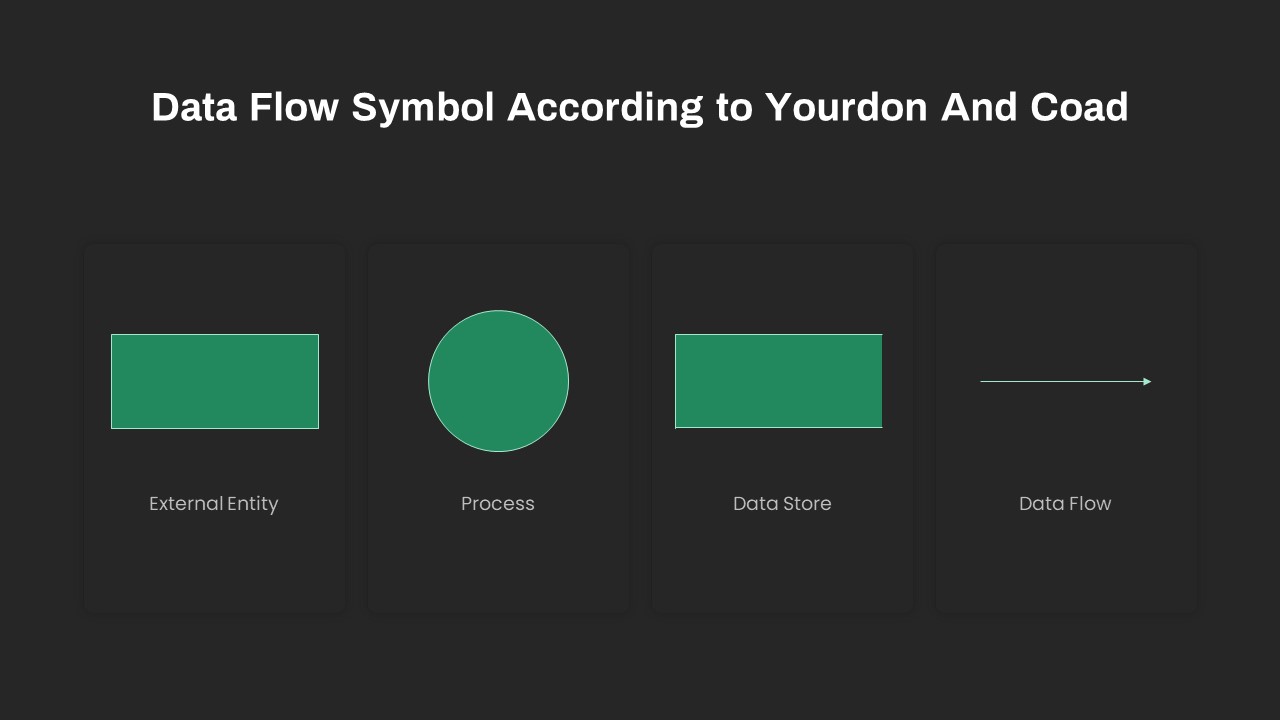
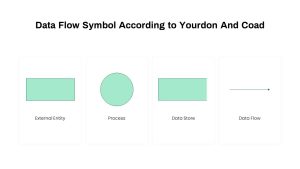
A detailed Yourdon & Coad symbol reference slide showcasing External Entity, Process, Data Store, and Data Flow icons.
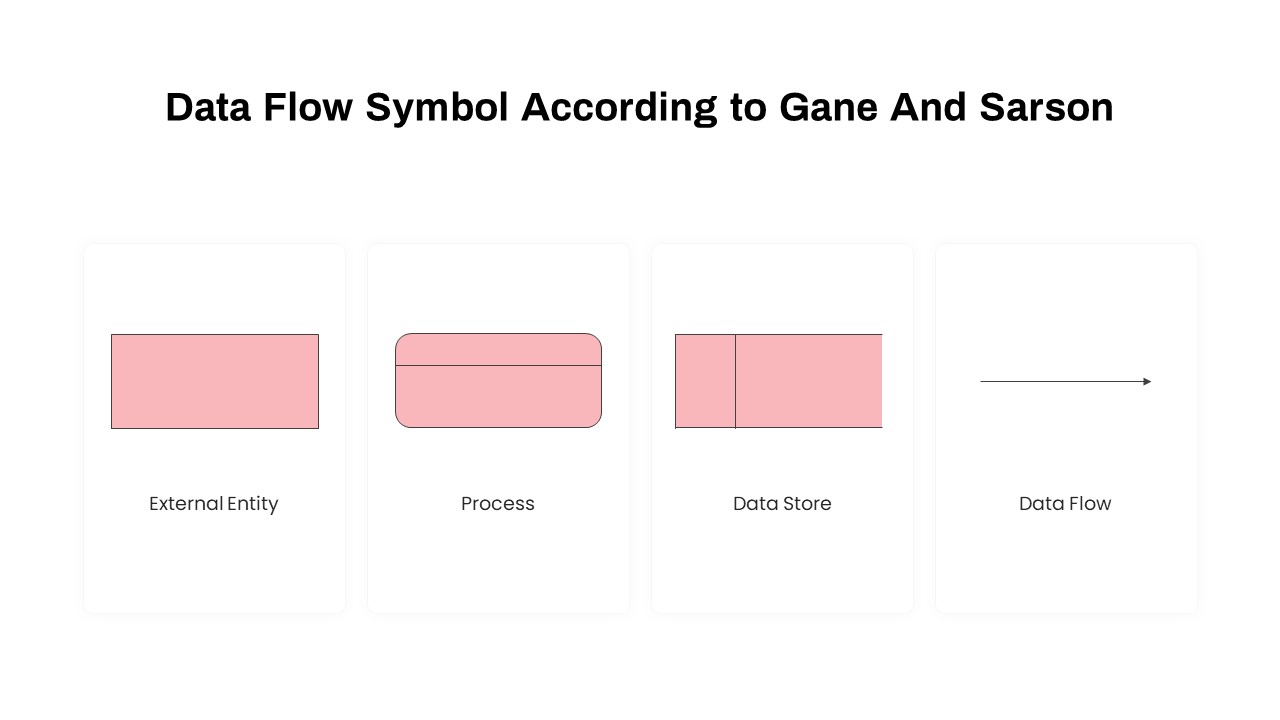
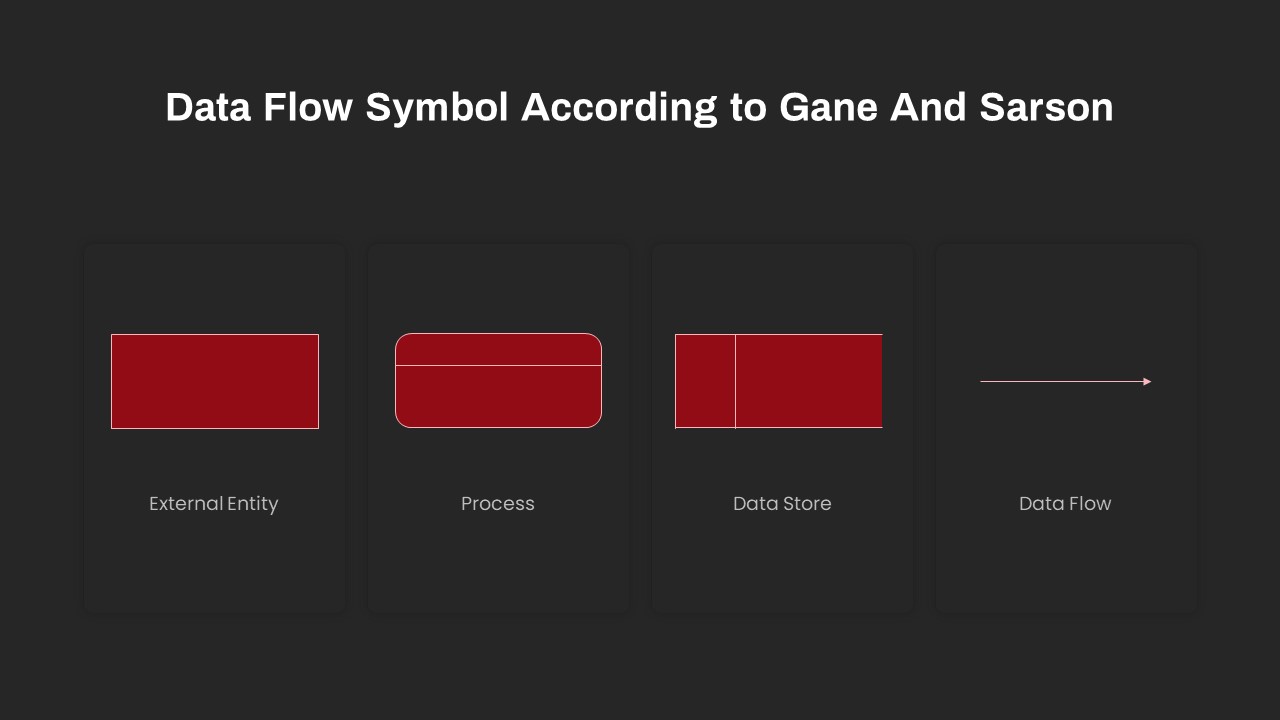
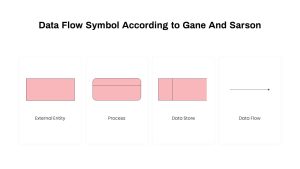
A Gane & Sarson symbol reference slide with rounded-corner processes and dual-pane data stores.
Two editable DFD layouts—one high-level context diagram and one detailed level-1 breakdown—complete with numbered data stores, process bubbles, and connector arrows.
A summary slide for annotations or legend definitions.
Built on master slides, each layout supports drag-and-drop shape editing, color-palette swaps, and snap-to-grid alignment. Vector shapes and arrows automatically realign when you add or remove elements, ensuring clean, consistent maps. Slide notes guide you through replacing placeholders, customizing symbols, and fine-tuning connector styles. Fully compatible with both PowerPoint and Google Slides, this pack preserves vector scalability, animations, and formatting across platforms, enabling seamless collaboration and version control.
Who is it for
Systems analysts, software architects, and business analysts will benefit from this pack when documenting application architectures or specifying technical requirements. IT managers, project leads, and process engineers can also leverage these diagrams to communicate data dependencies and workflow optimizations.
Other Uses
Beyond system design, repurpose these slides for process improvement workshops, compliance audits, data lineage visualizations, training materials, or stakeholder reviews. The modular layouts adapt easily to any technical or operational mapping needs.
Login to download this file

Item ID
SB03824
Related Templates

Advanced Cyber Security Presentation Template for PowerPoint & Google Slides
Information Technology

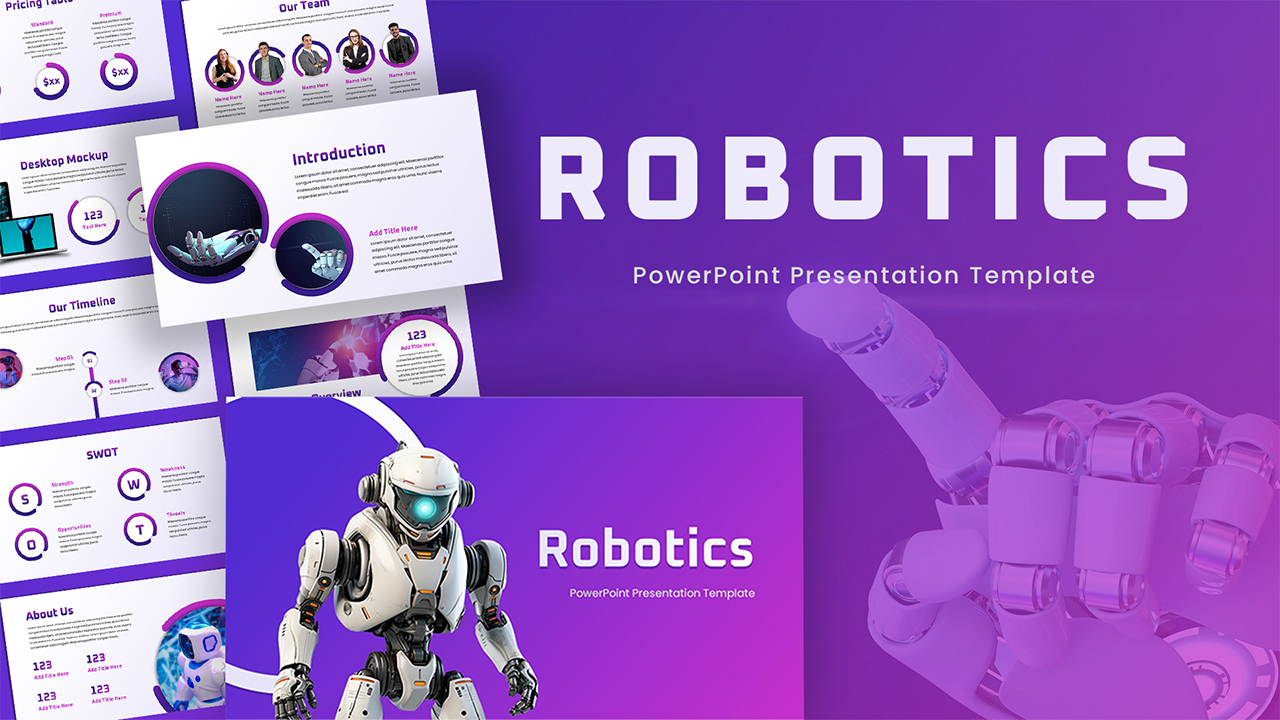
Robotics PowerPoint Template Free
Company Profile
Free
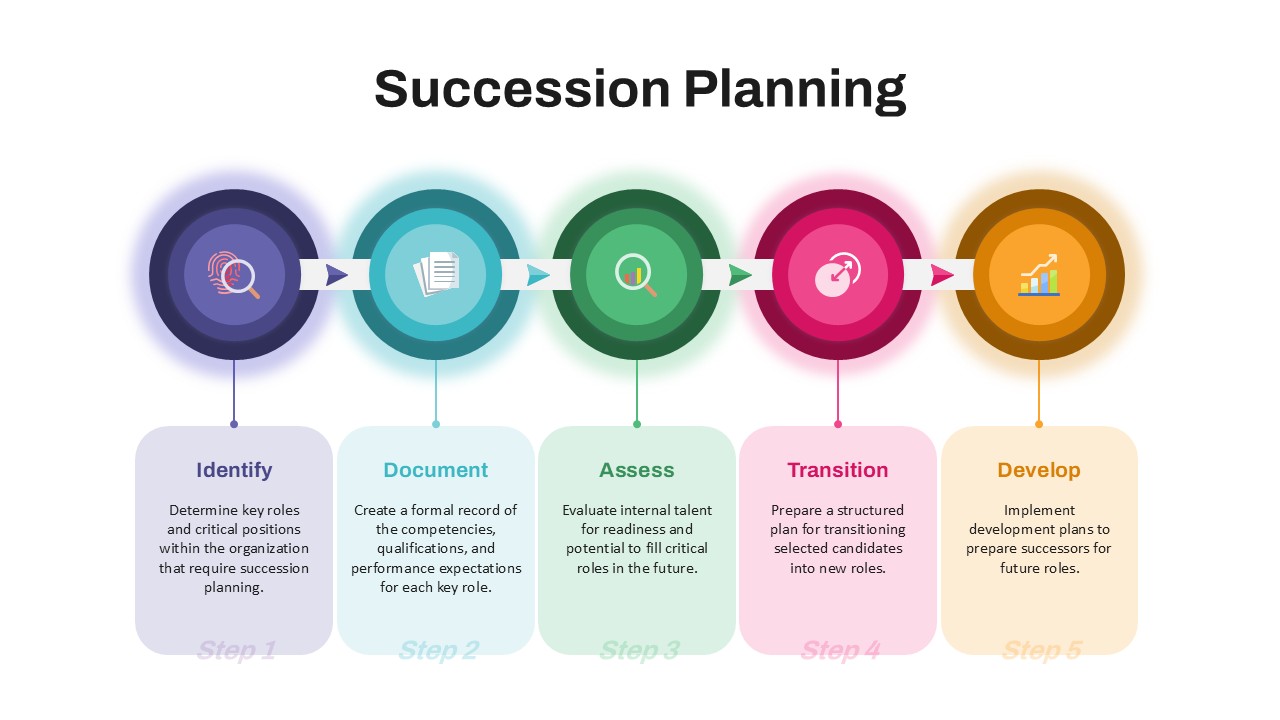
Advanced Succession Planning Workflow Template for PowerPoint & Google Slides
Employee Performance
Data-driven GDP Growth Infographic Pack Template for PowerPoint & Google Slides
Infographics
Snake Diagram Pack of 8 Slides template for PowerPoint & Google Slides
Process
Venn Diagram Infographics Pack Template for PowerPoint & Google Slides
Circular

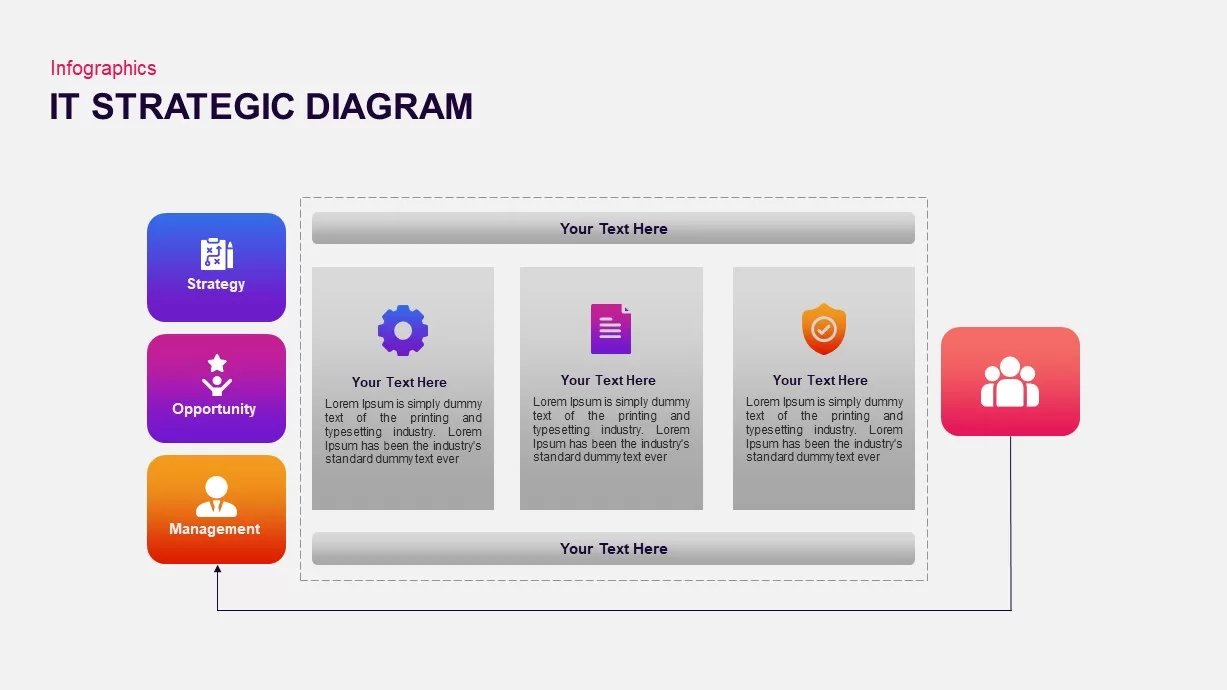
IT Strategic Diagram Infographic Pack Template for PowerPoint & Google Slides
Business Strategy
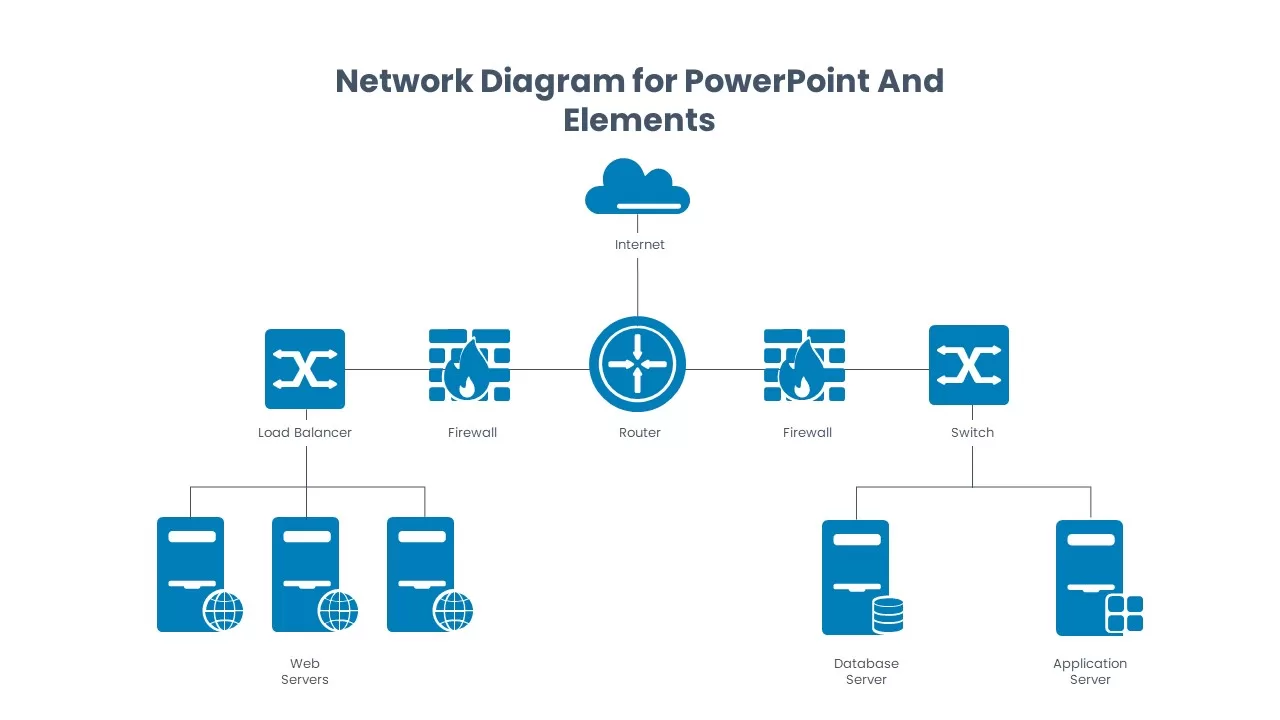
Network Diagram Elements and Icons Pack Template for PowerPoint & Google Slides
Information Technology
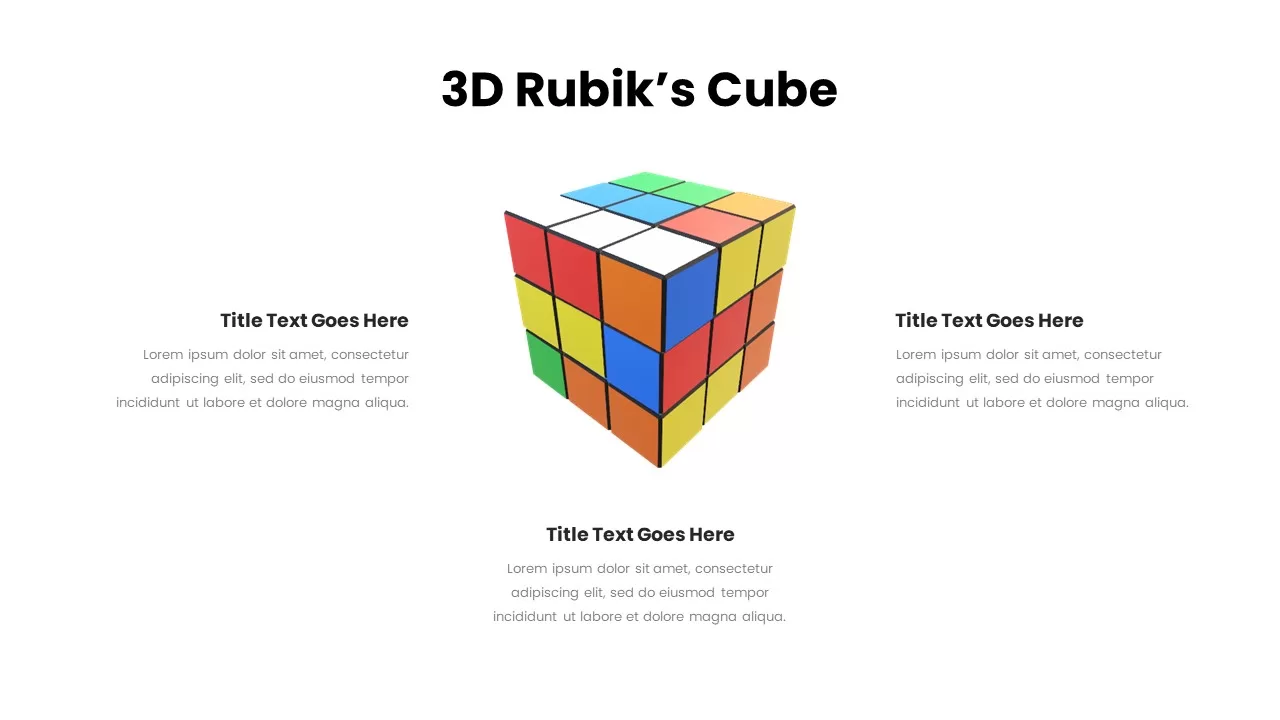
Dynamic 3D Rubik’s Cube Diagram Pack Template for PowerPoint & Google Slides
Infographics
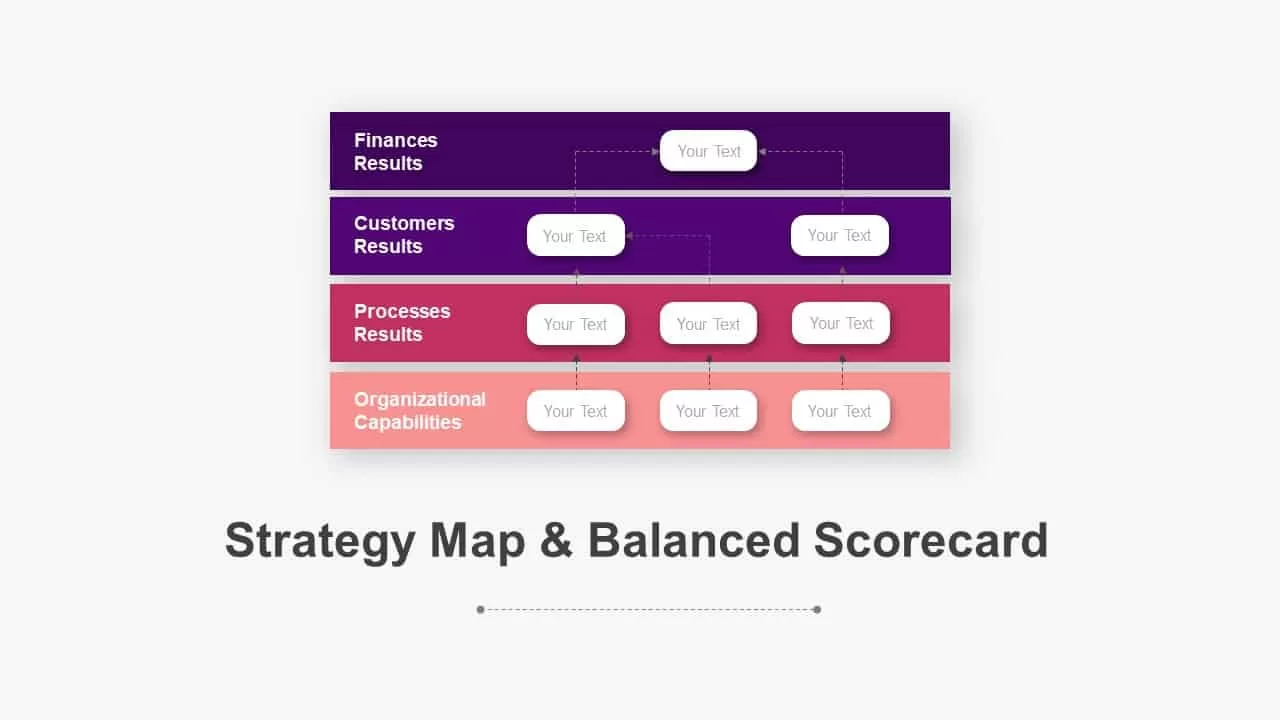
Balanced Scorecard Strategy Map Diagram Pack for PowerPoint & Google Slides
Business Strategy
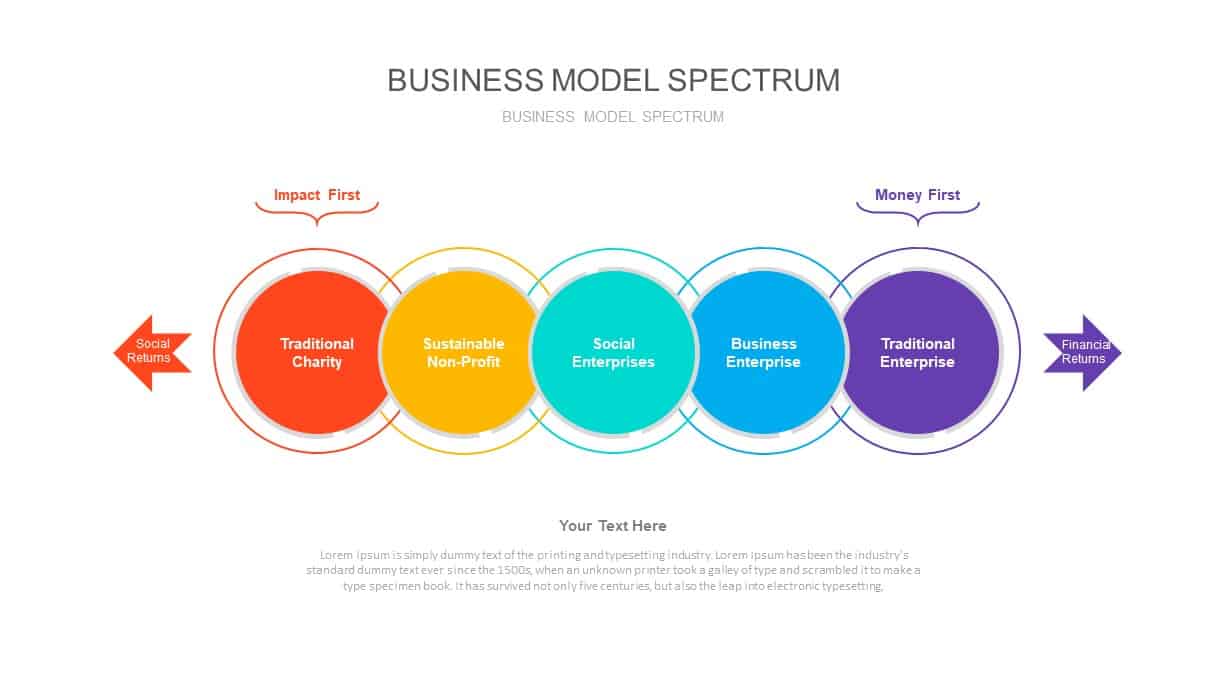
Business Model Spectrum Diagram Pack for PowerPoint & Google Slides
Business Models
Sales Process Infographic Slides Pack Template for PowerPoint & Google Slides
Process
Acknowledgement Slide in PPT & Google Slides
Our Team
Agenda Infographic Pack of 2 Slides Template for PowerPoint & Google Slides
Agenda
Quad Chart Infographic Pack of 8 Slides Template for PowerPoint & Google Slides
Comparison Chart
Free Professional Gantt Chart Pack – 4 Slides Template for PowerPoint & Google Slides
Gantt Chart
Free
Game Plan Infographic Slides Pack Template for PowerPoint & Google Slides
Infographics
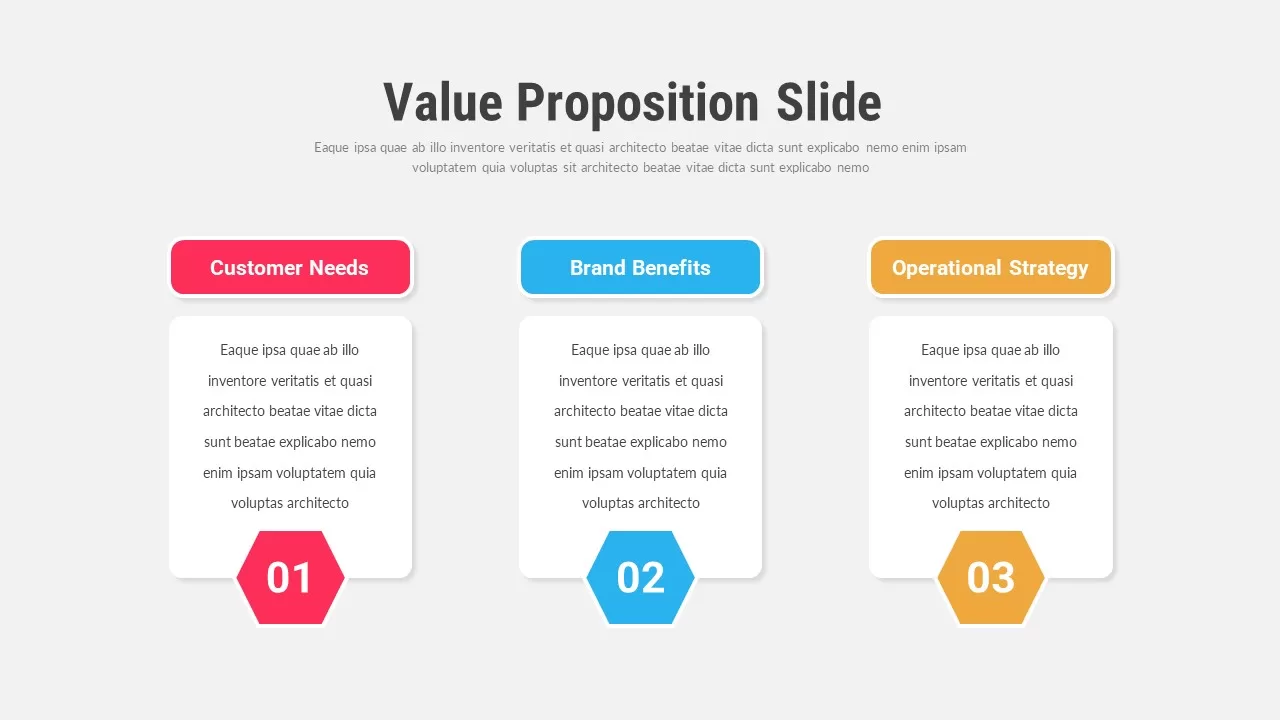
Value Proposition Slides Pack PowerPoint Template
Infographics
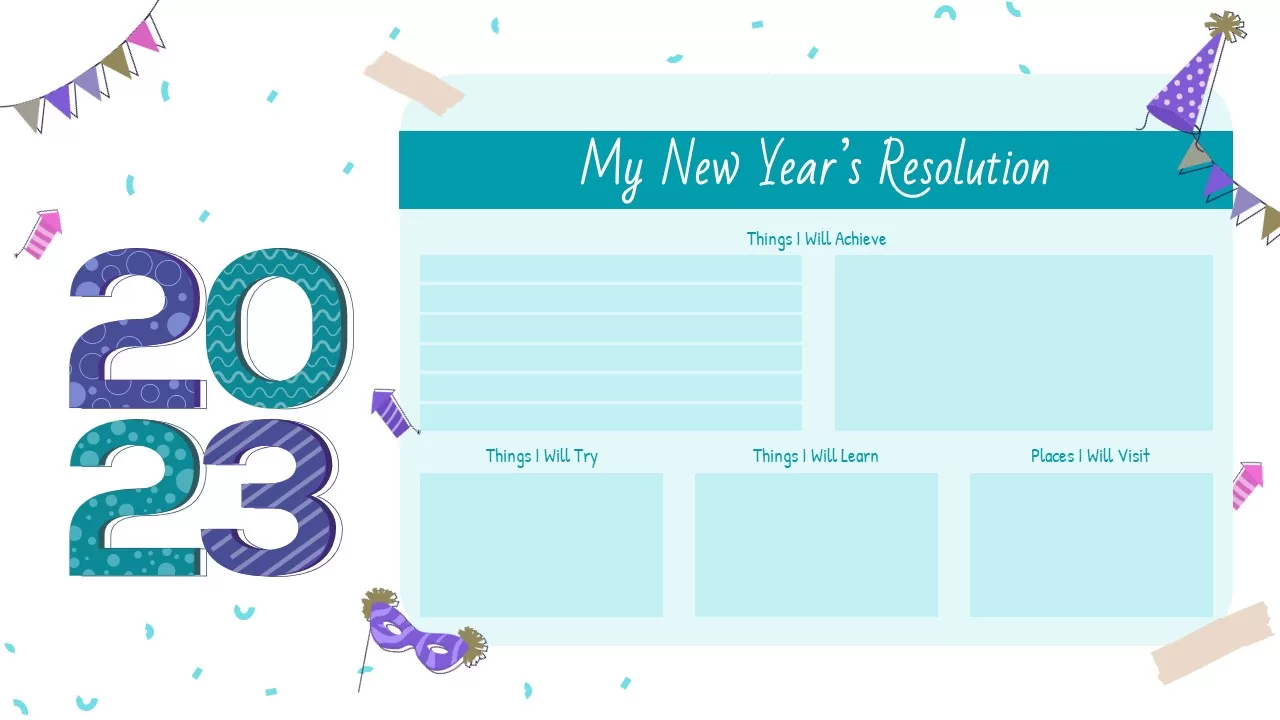
Free New Year’s Resolution Slides Pack for PowerPoint & Google Slides 2023
Graphics
Free
Free Infographic Deck PowerPoint Pack for PowerPoint & Google Slides
Infographics
Free

North Korea Map with Provinces Infographic Pack Template for PowerPoint & Google Slides
Maps
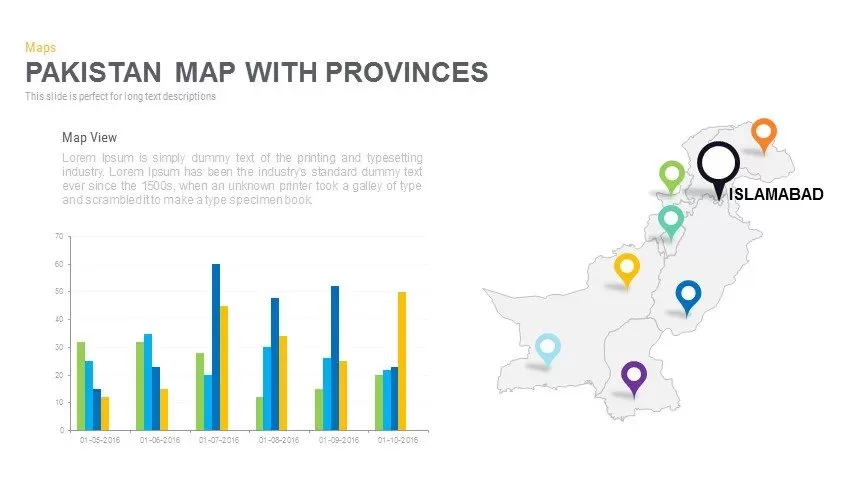
Pakistan Provinces Map Infographic Pack Template for PowerPoint & Google Slides
Maps
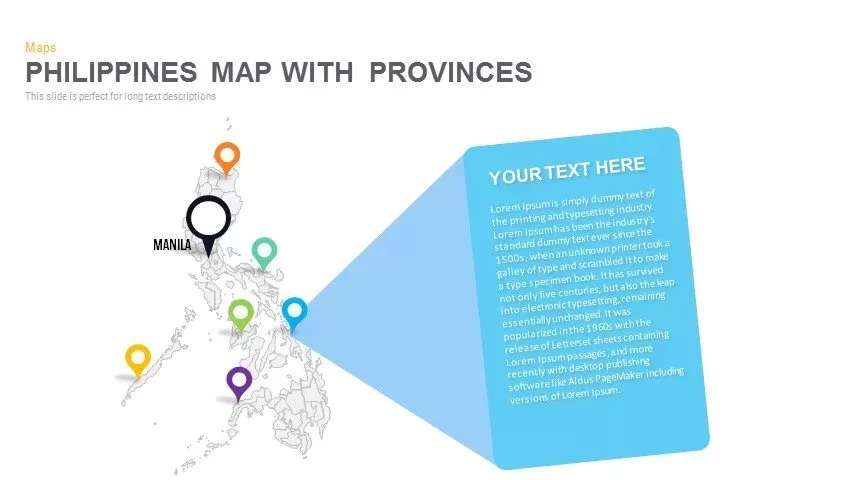
Philippines Map with Provinces Pack Template for PowerPoint & Google Slides
Maps
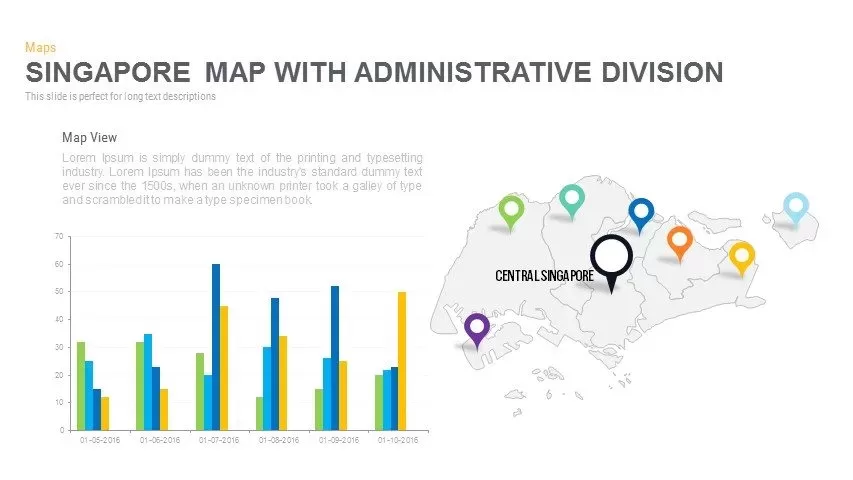
Singapore Map Pack Template for PowerPoint & Google Slides
Maps
Sri Lanka Map Infographic Pack Template for PowerPoint & Google Slides
Maps
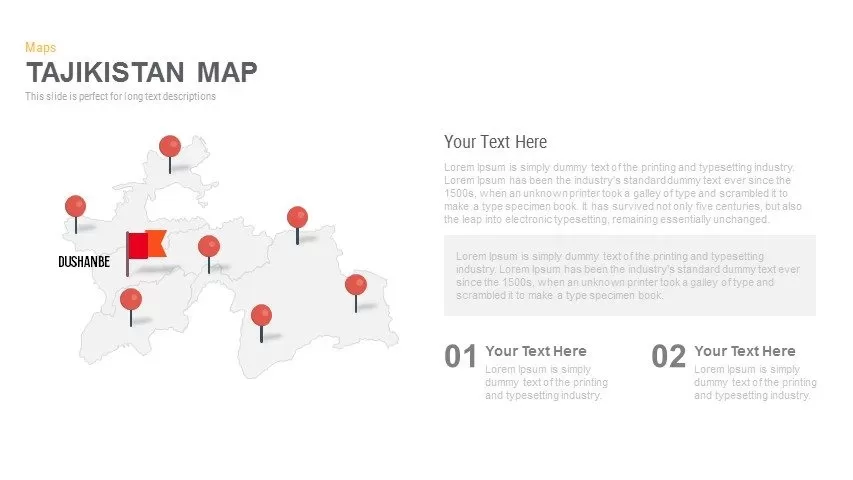
Editable Tajikistan Provinces Map Pack Template for PowerPoint & Google Slides
Maps
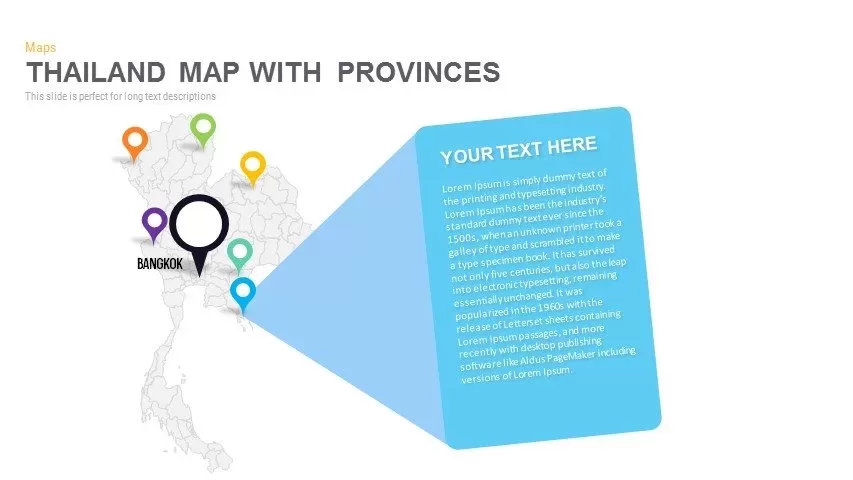
Thailand Provinces Map Infographic Pack Template for PowerPoint & Google Slides
Maps
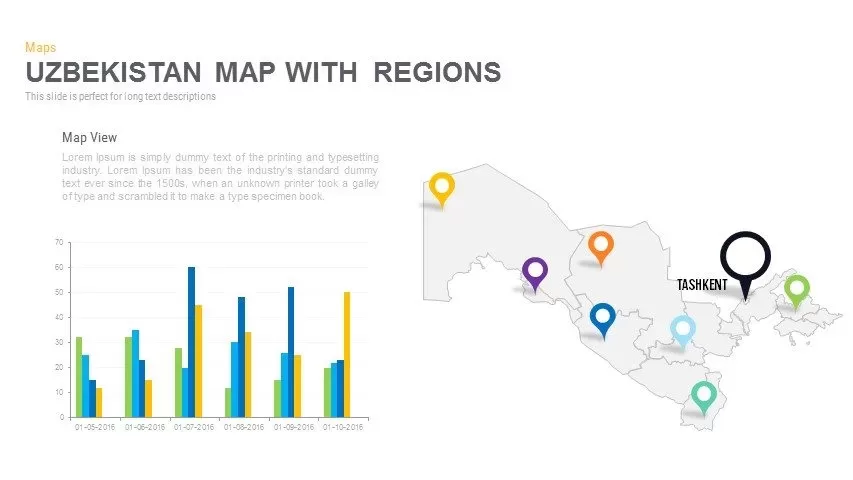
Uzbekistan Map with Regions Pack Template for PowerPoint & Google Slides
Maps
Vietnam Provinces Map Infographic Pack Template for PowerPoint & Google Slides
Maps
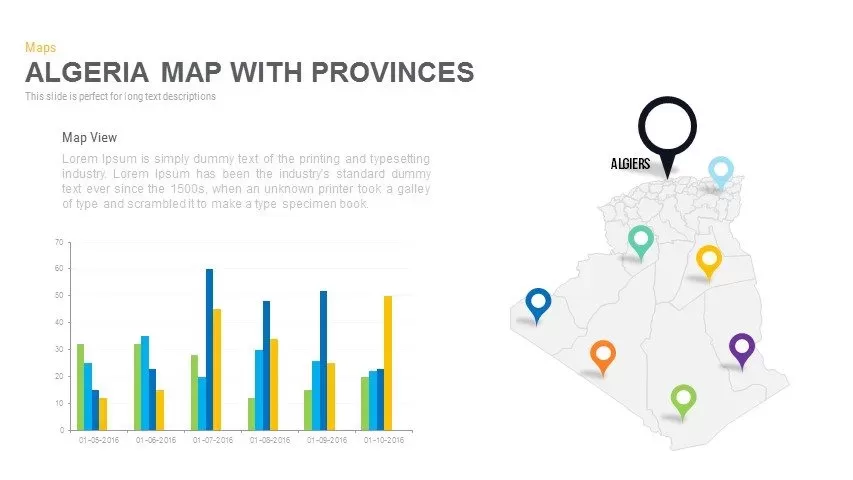
Algeria Map with Provinces Pack Template for PowerPoint & Google Slides
Maps
Angola Provinces Map Slide Pack Template for PowerPoint & Google Slides
World Maps
Angola Map with Provinces Slide Pack Template for PowerPoint & Google Slides
World Maps
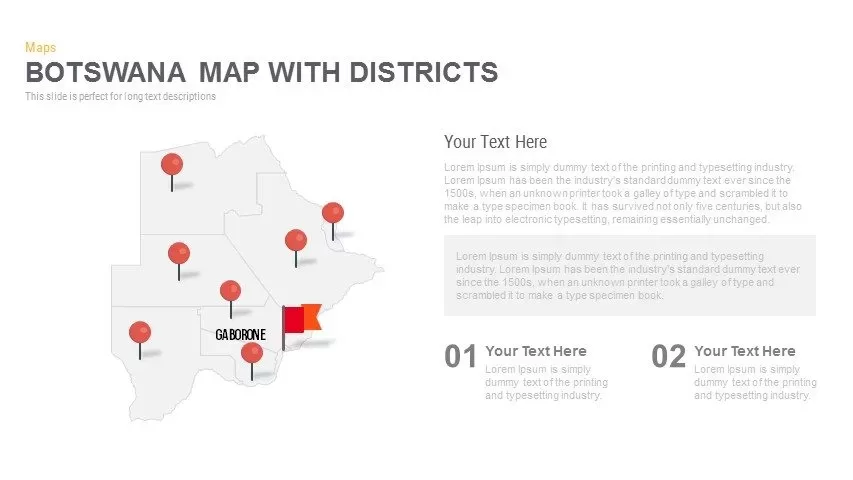
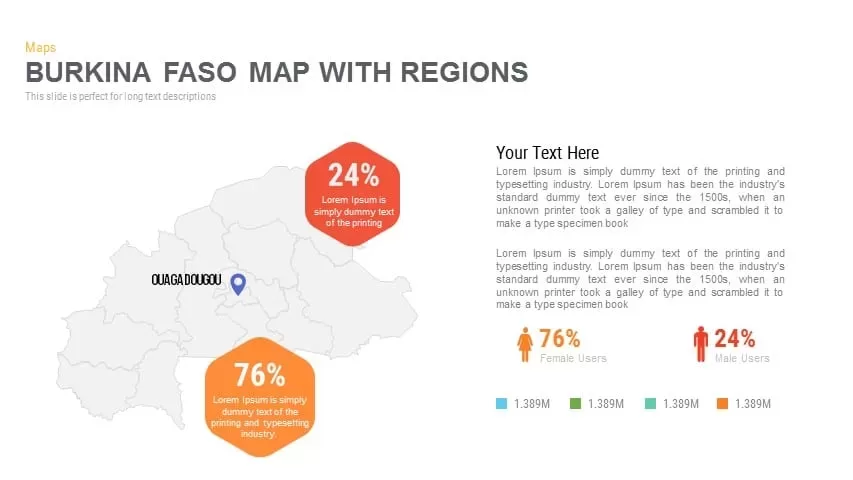
Burkina Faso Map with Regions Slide Pack Template for PowerPoint & Google Slides
World Maps
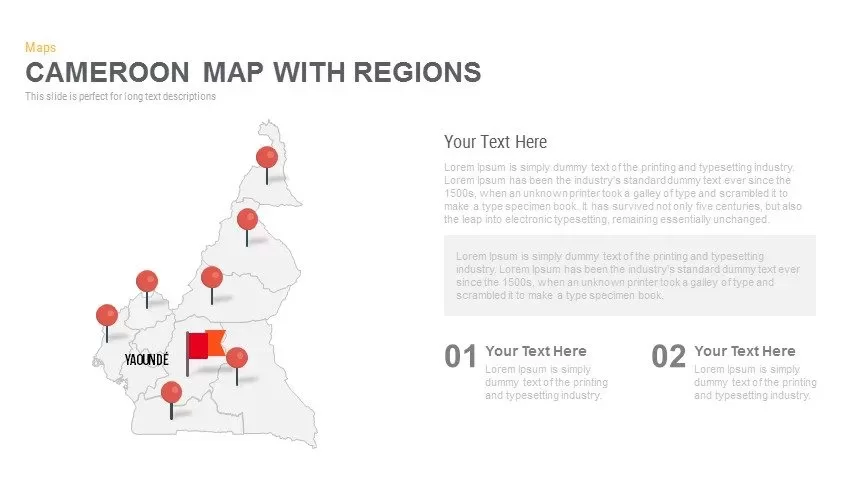
Cameroon Map with Regions Slide Pack Template for PowerPoint & Google Slides
World Maps
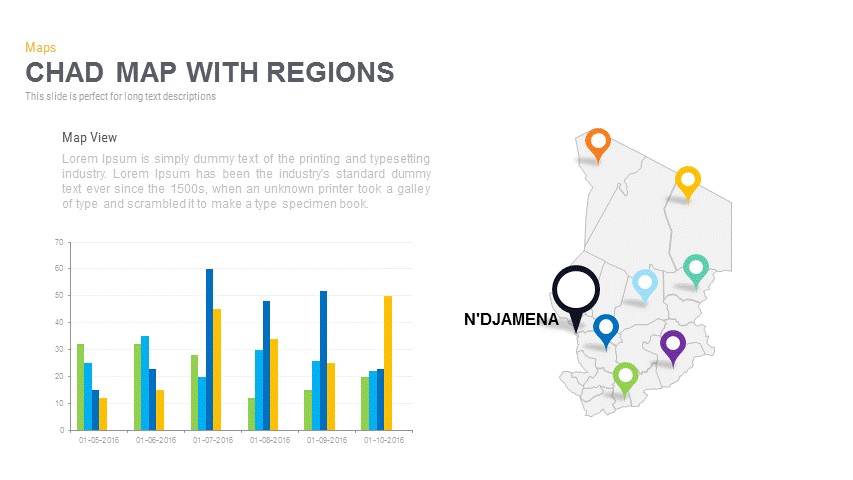
Chad Map with Regions Slide Pack Template for PowerPoint & Google Slides
World Maps
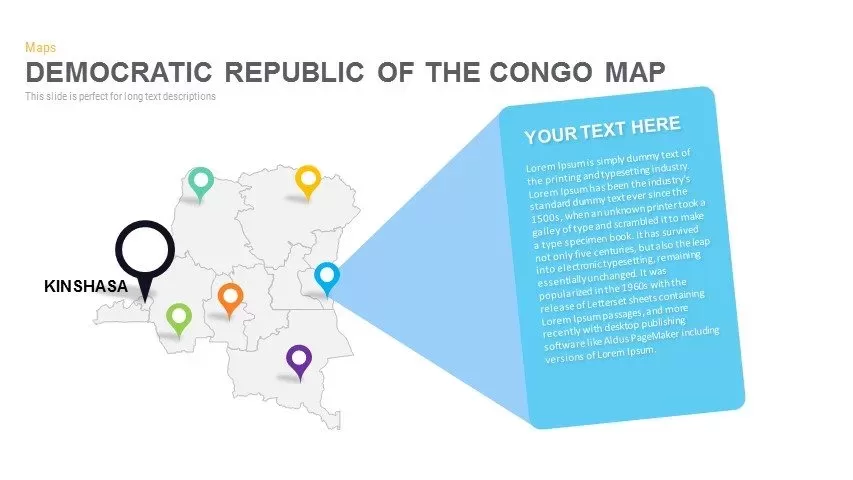
DR Congo Prefecture Map Slide Pack Template for PowerPoint & Google Slides
World Maps
Egypt Regional Map Slide Pack Template for PowerPoint & Google Slides
World Maps
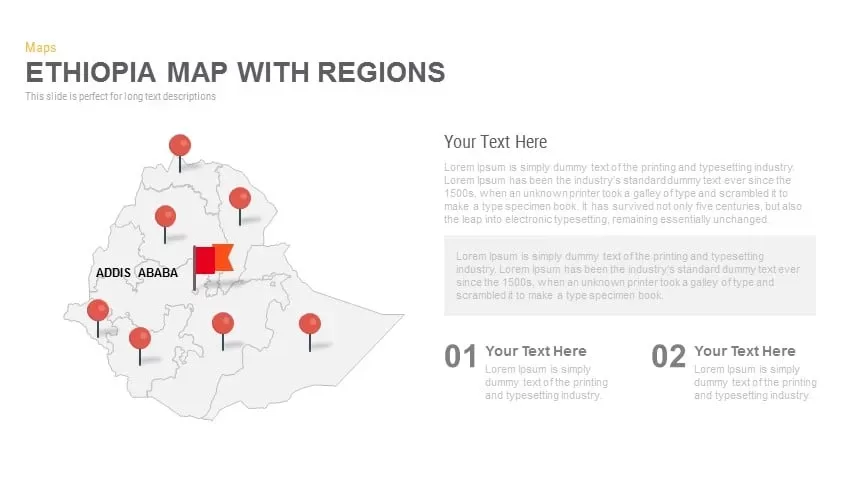
Ethiopia Map with Regions Slide Pack Template for PowerPoint & Google Slides
World Maps
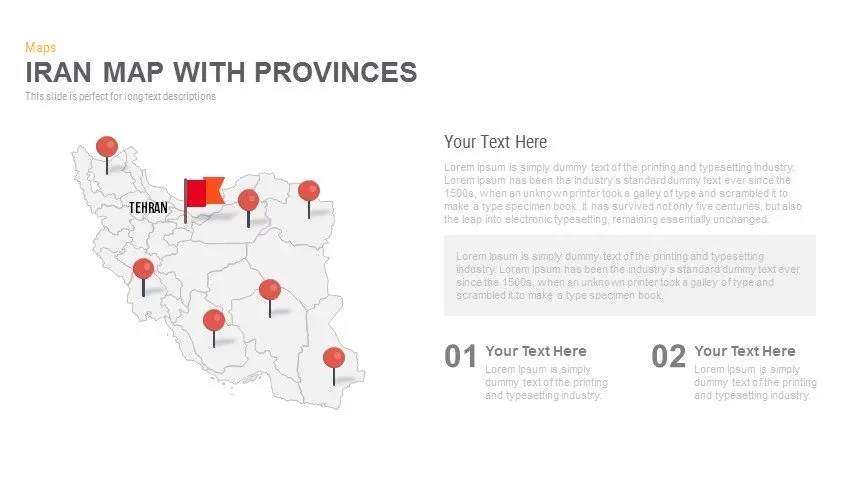
Iran Map with Provinces Slide Pack Template for PowerPoint & Google Slides
World Maps
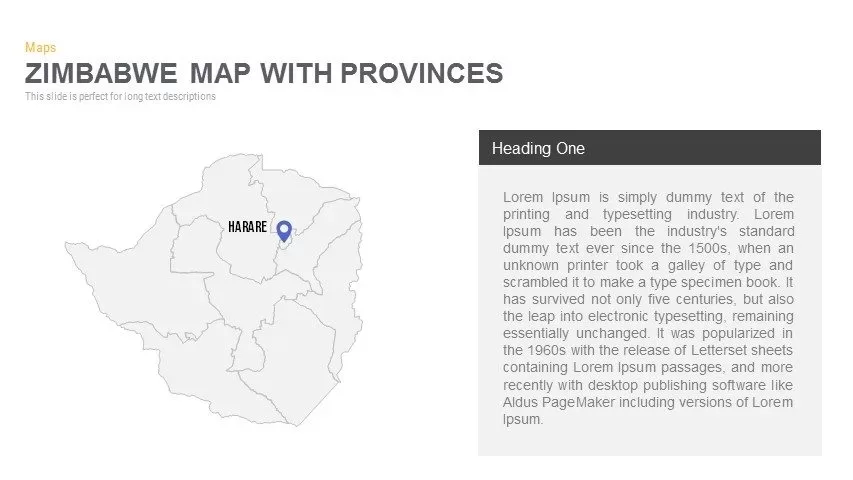
Zimbabwe Map with Provinces Slide Pack Template for PowerPoint & Google Slides
World Maps
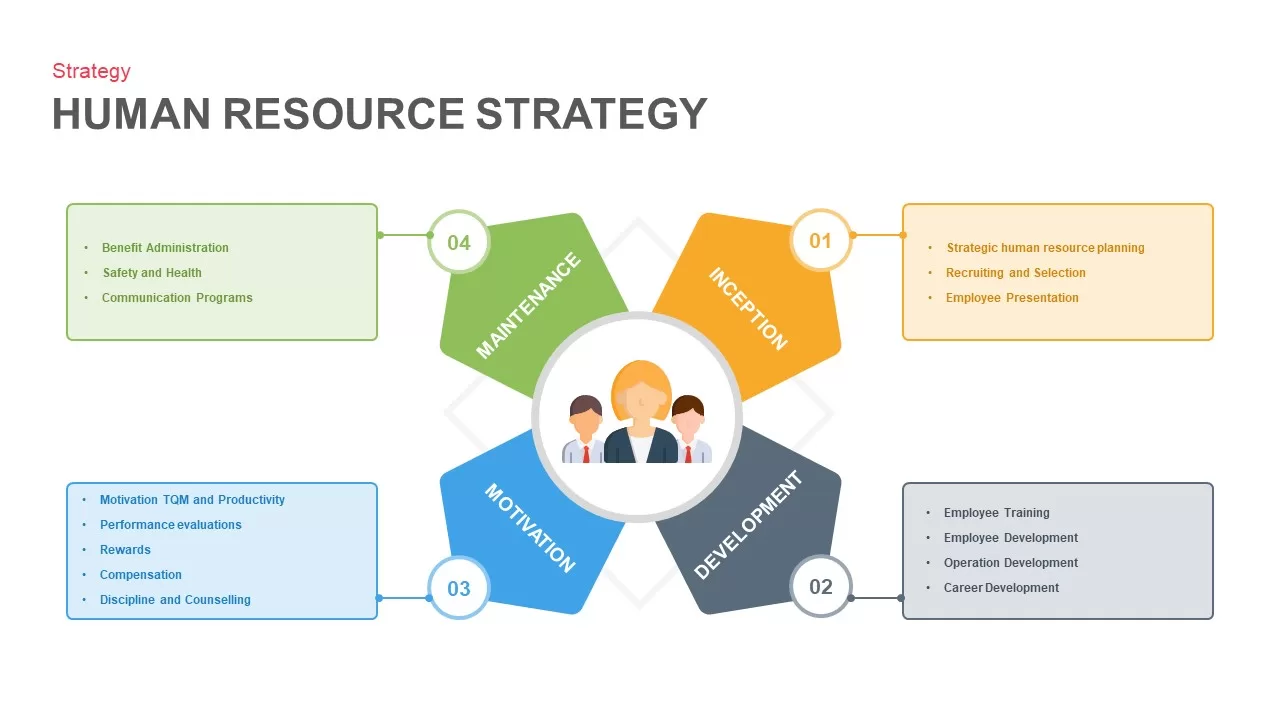
Human Resource Strategy Model Pack Template for PowerPoint & Google Slides
HR
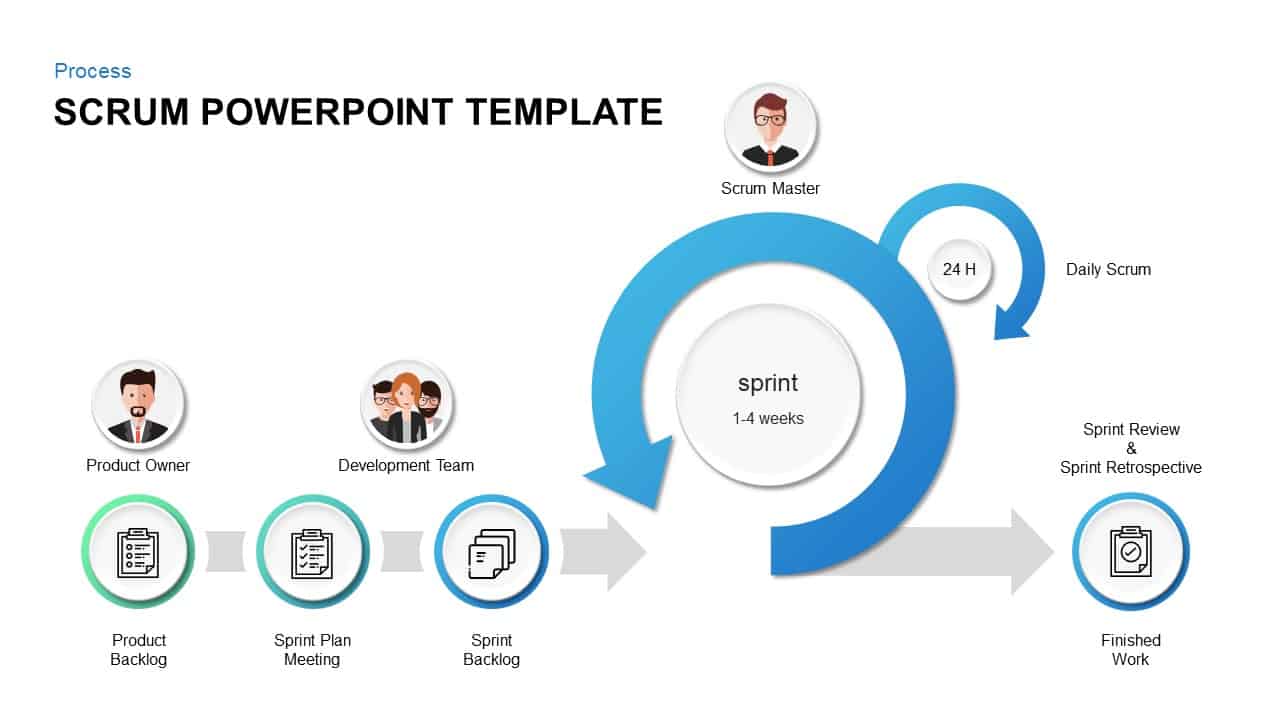
SCRUM PowerPoint Template and Google Slide Diagram
Scrum
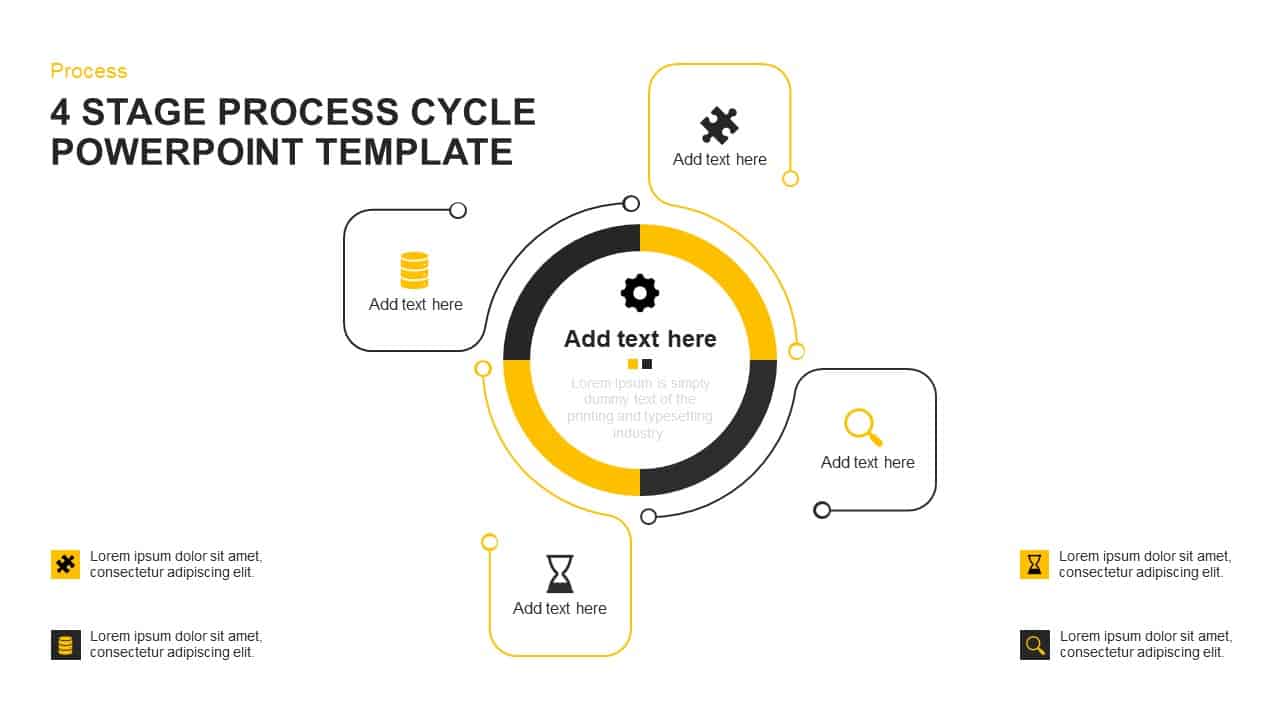
Four-Stage Process Cycle Variations Pack Template for PowerPoint & Google Slides
Process
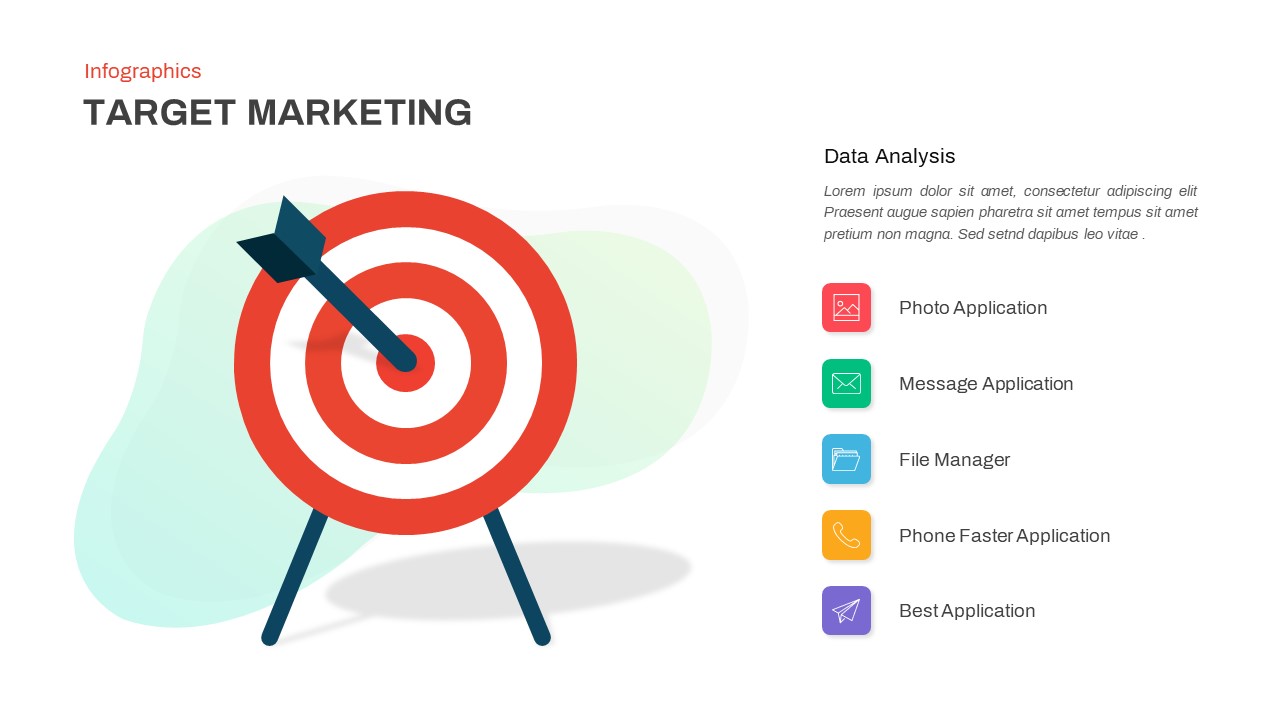
Target Marketing Infographic Slide Pack Template for PowerPoint & Google Slides
Infographics
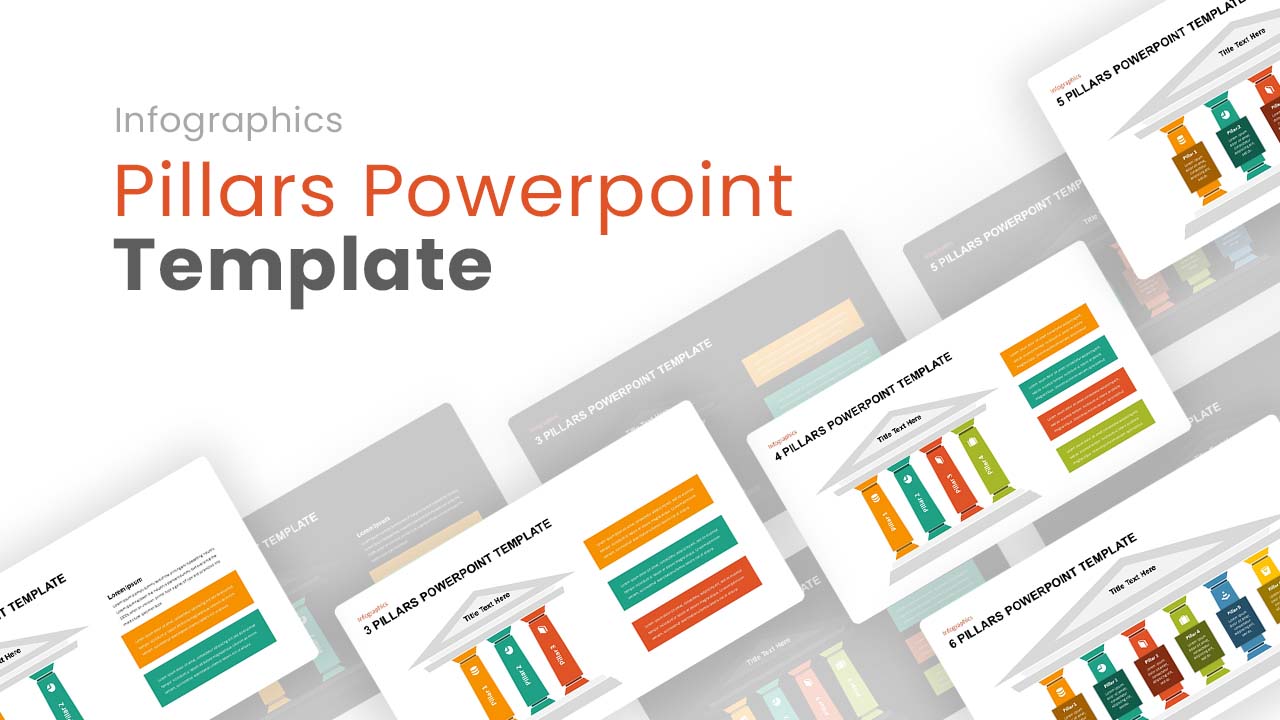
Editable Pillars Infographics Pack Template for PowerPoint & Google Slides
Infographics
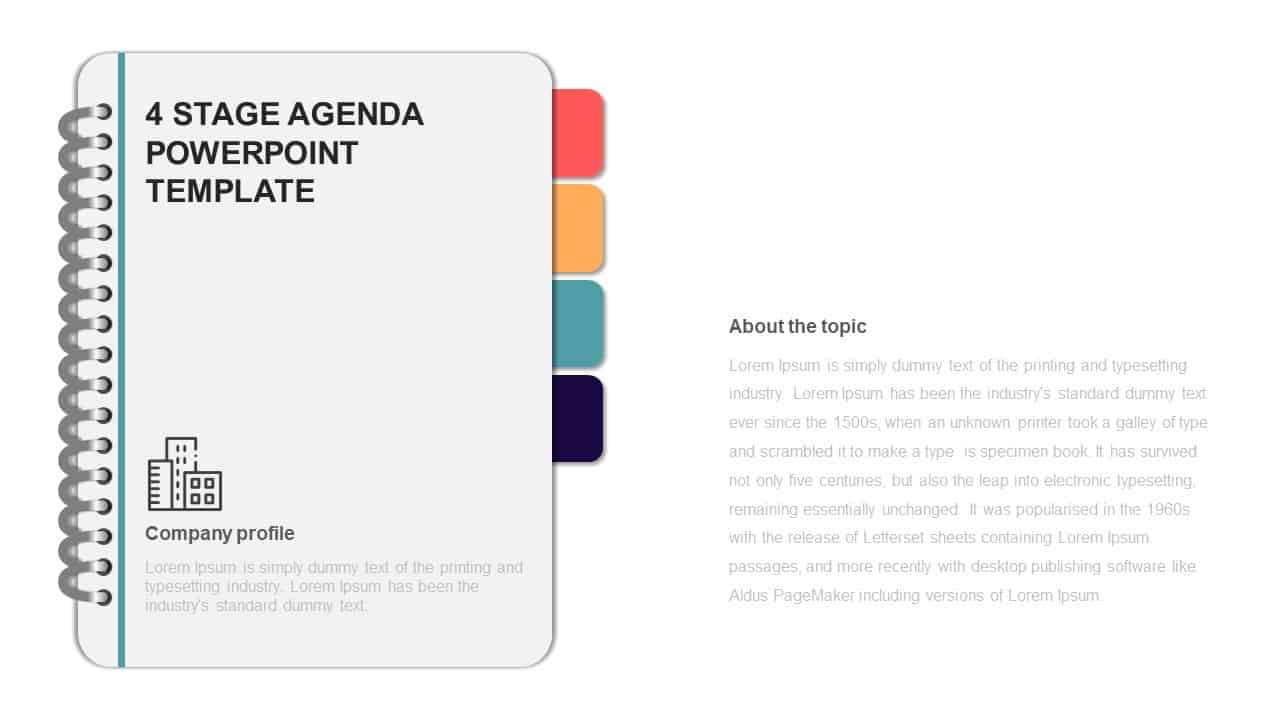
4-Stage Agenda Slide Pack Template for PowerPoint & Google Slides
Agenda
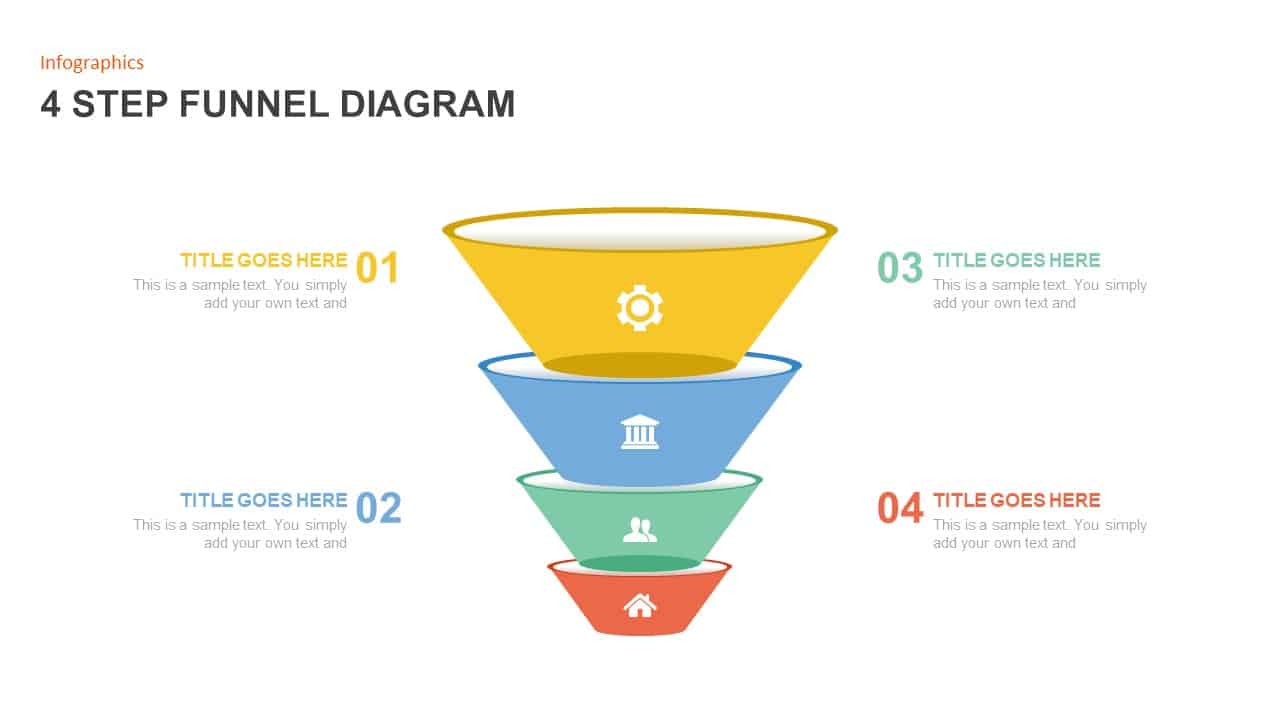
Four-Step Funnel Infographic Pack Template for PowerPoint & Google Slides
Funnel
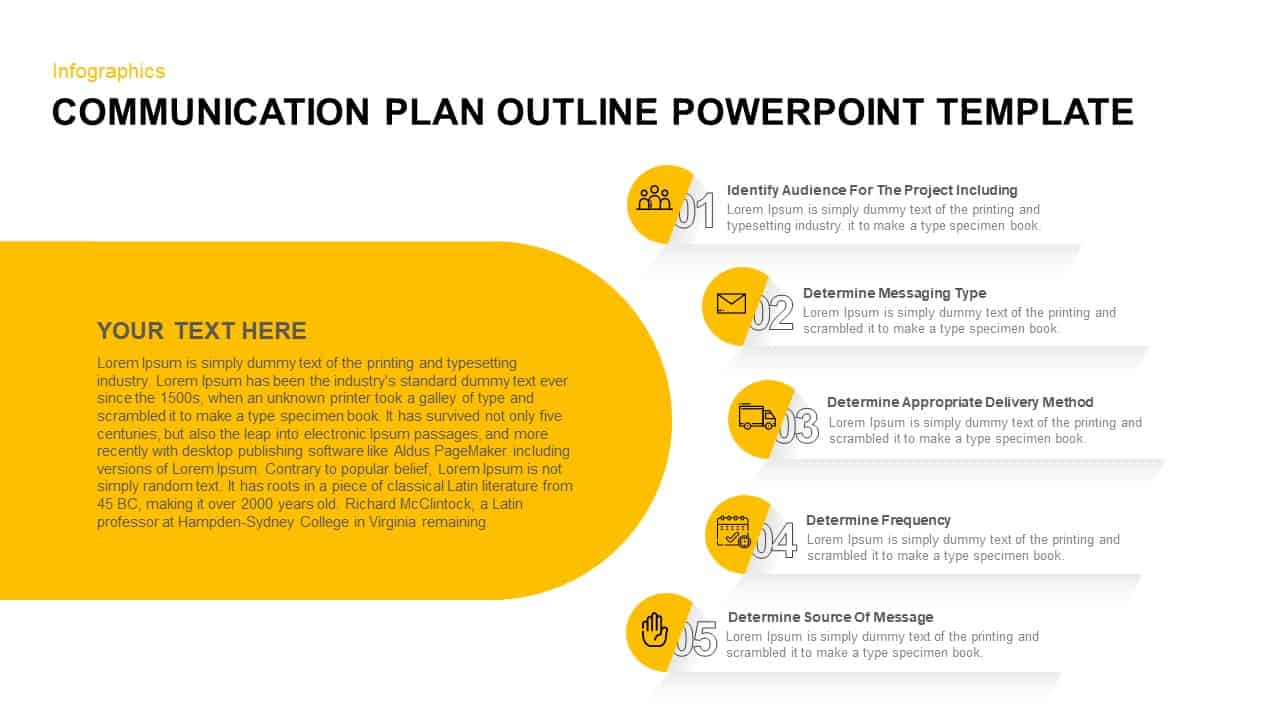
Communication Plan Outline Template Pack for PowerPoint & Google Slides
Infographics
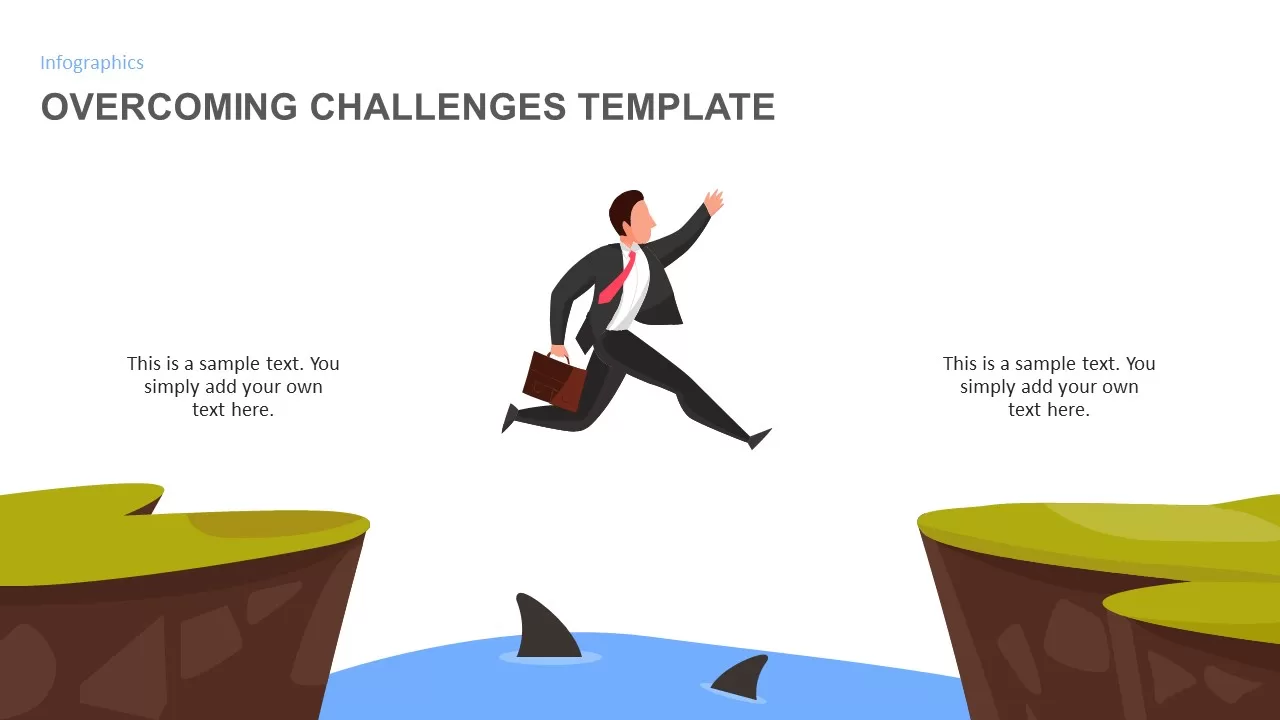
Overcoming Challenges Infographic Pack Template for PowerPoint & Google Slides
Opportunities Challenges
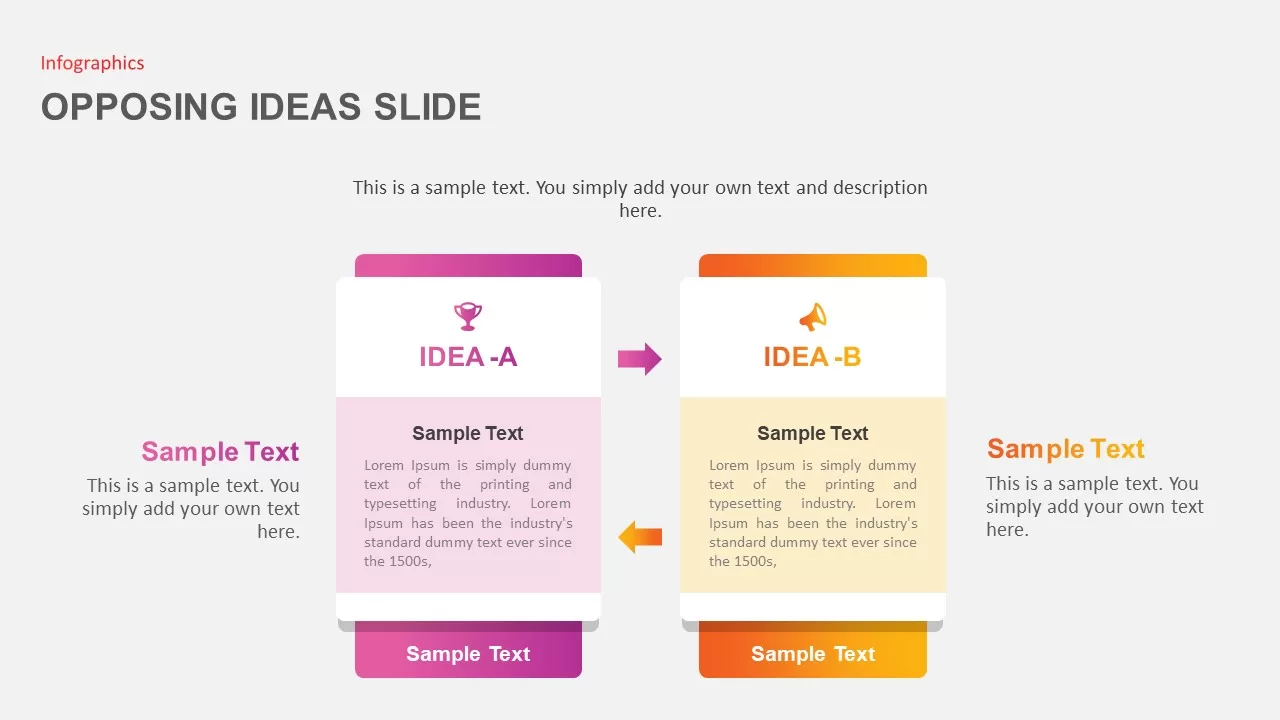
Opposing Ideas Infographics Pack Template for PowerPoint & Google Slides
Comparison
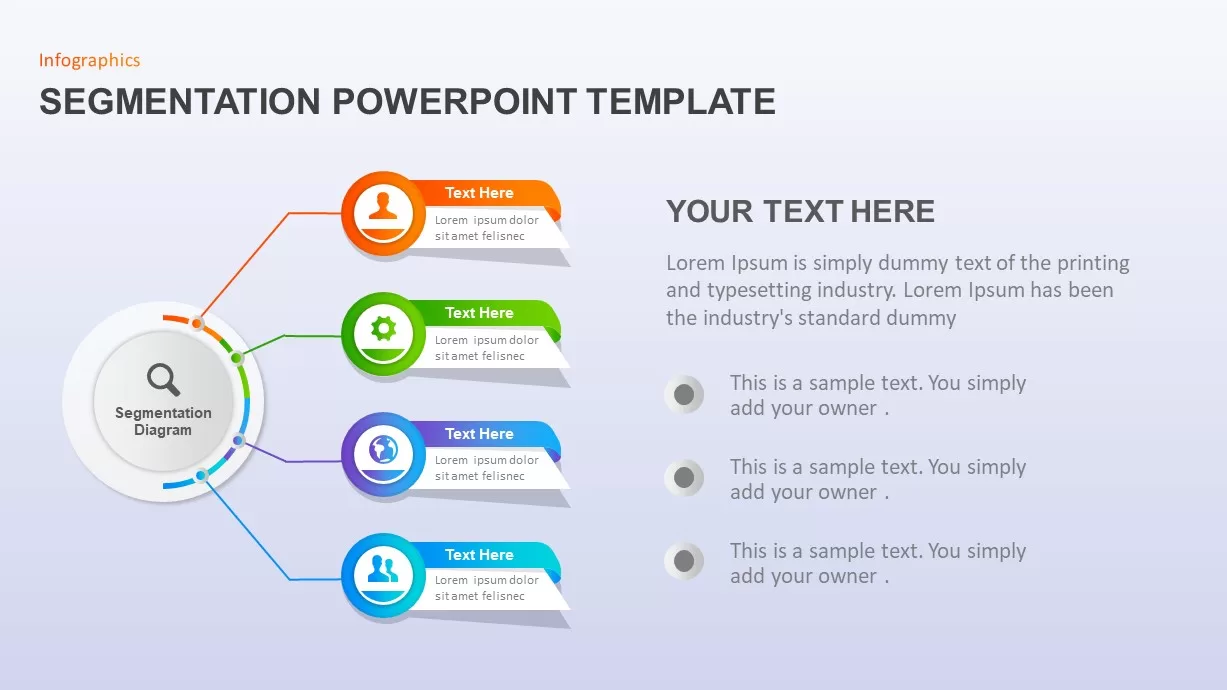
Market Segmentation & STP Infographics Pack Template for PowerPoint & Google Slides
Marketing
Business Growth Plant Infographics Pack Template for PowerPoint & Google Slides
Process
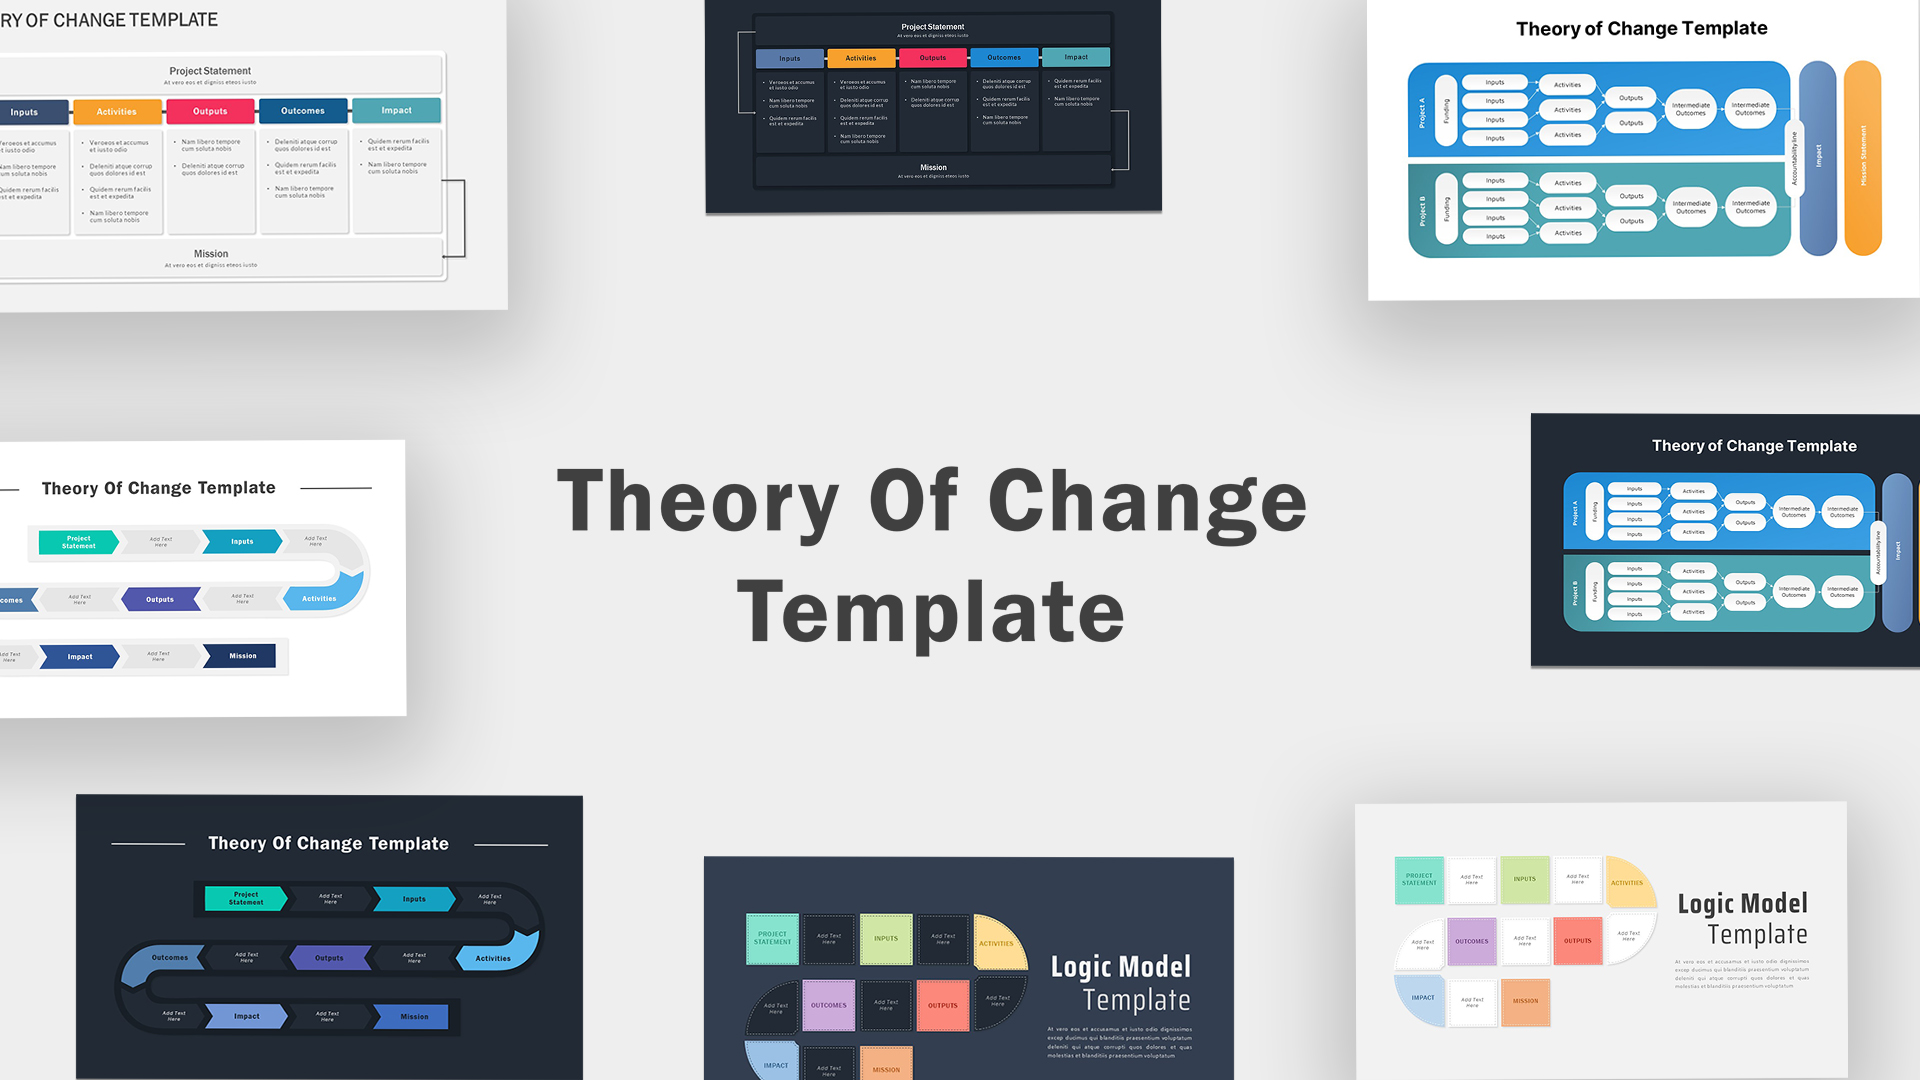
Theory Of Change Template PPT Slide
Process
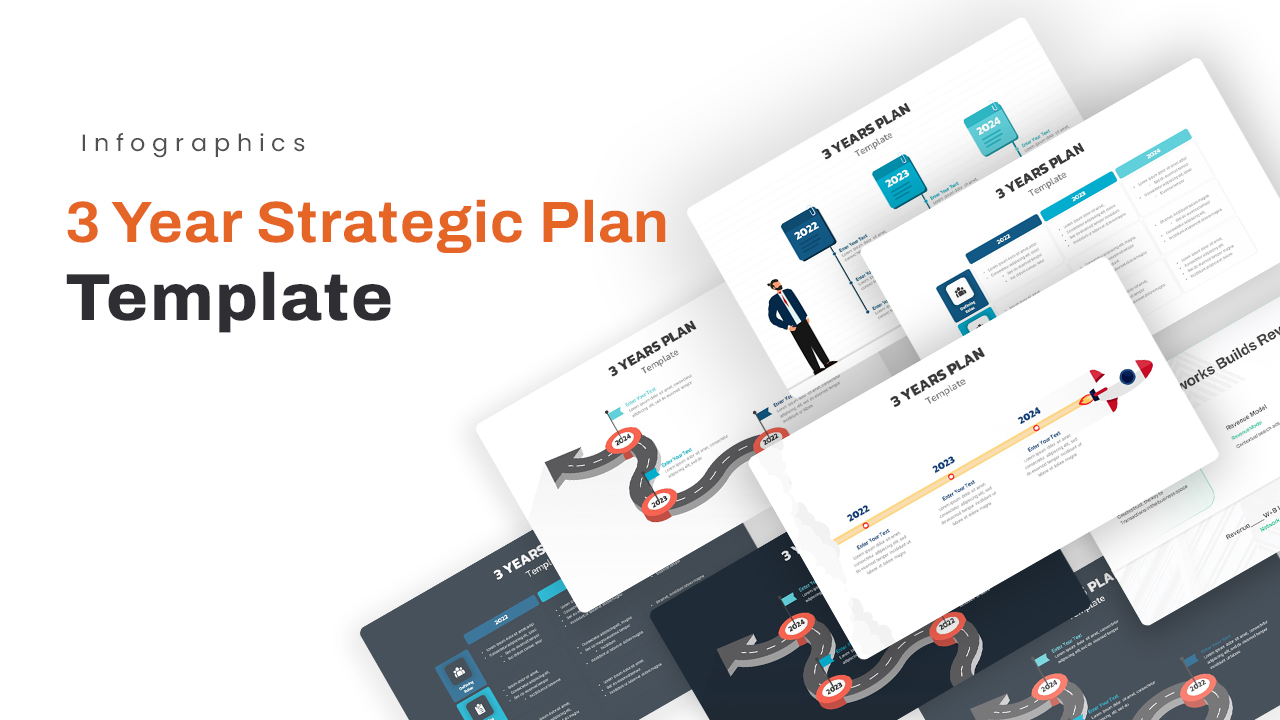
3 Year Strategic Plan PowerPoint template And Slides
Timeline
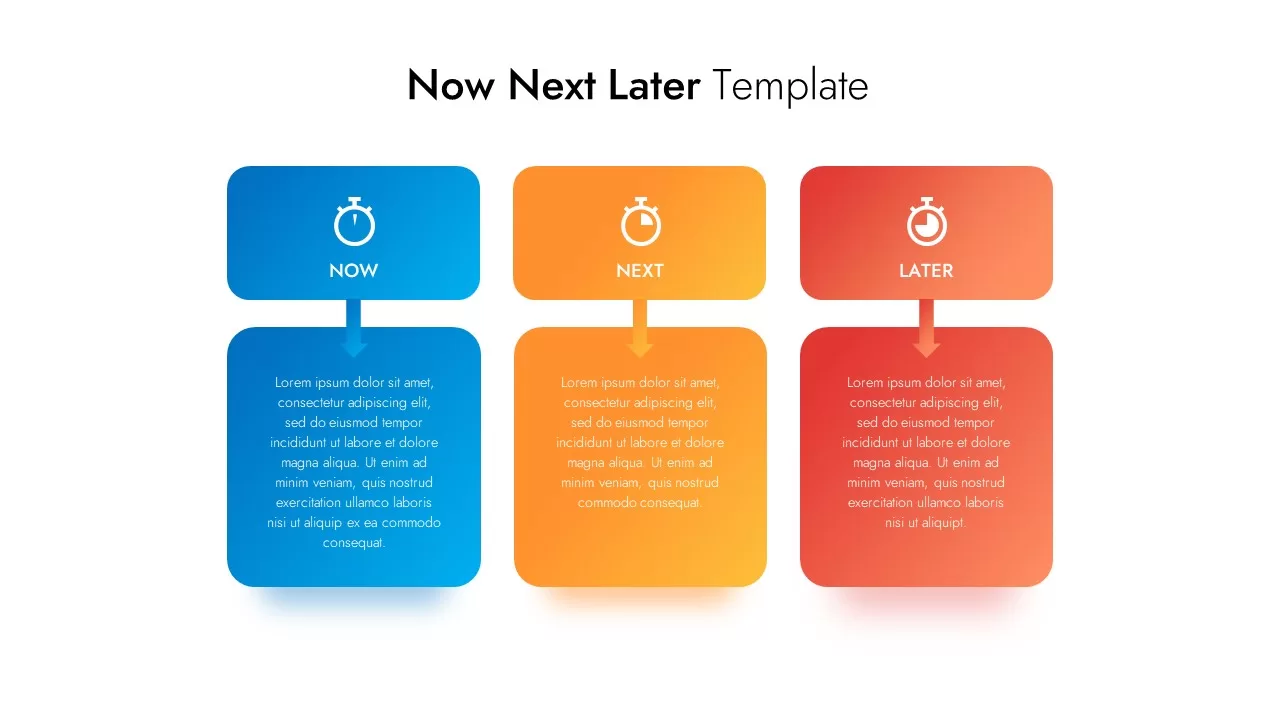
Now Next Later Infographic Pack Template for PowerPoint & Google Slides
Process
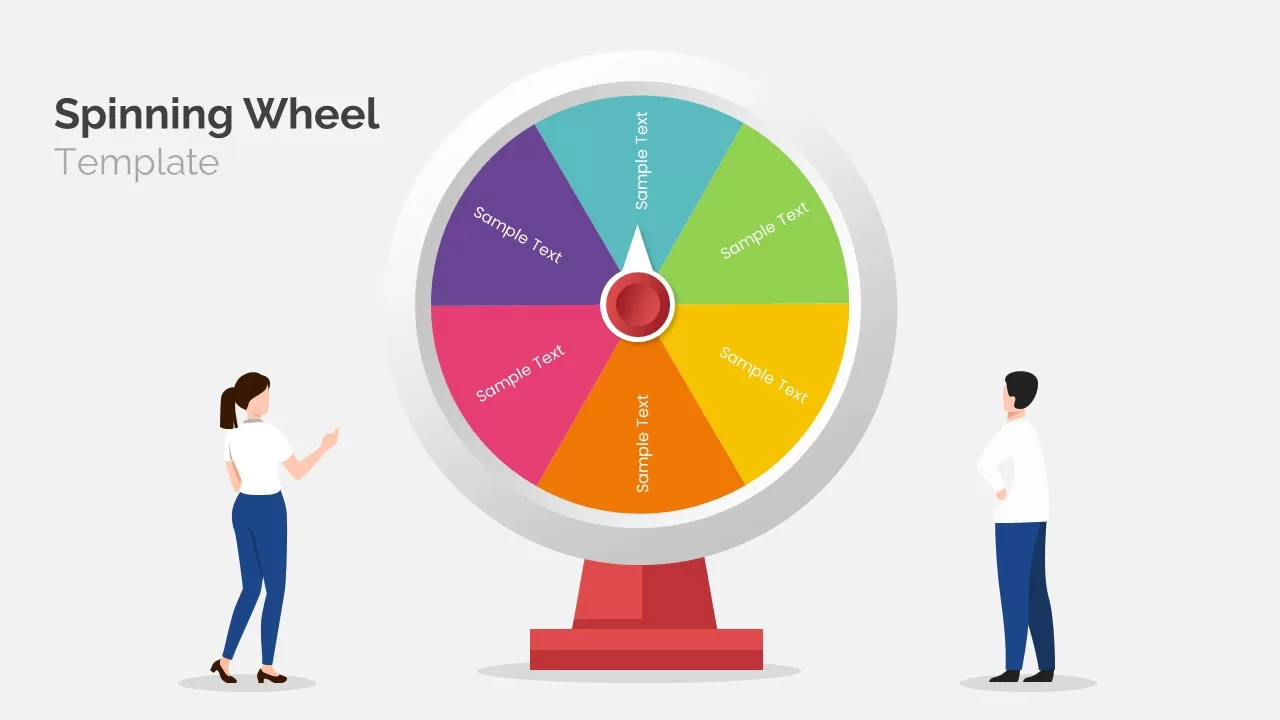
Animated Spinning Wheel Infographic Pack Template for PowerPoint & Google Slides
Circular
Competitive Landscape Slide
Comparison
Root Cause Analysis Infographic Pack Template for PowerPoint & Google Slides
Process
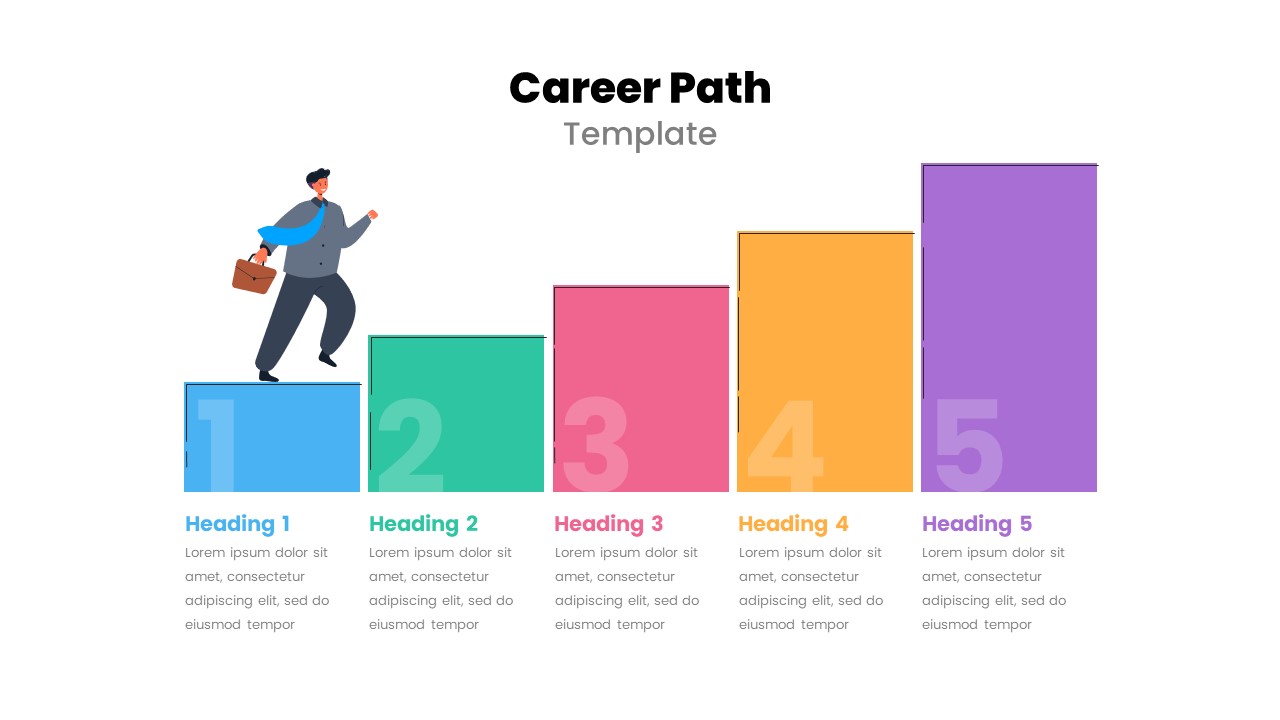
Free Career Path Template for PowerPoint
Roadmap
Free
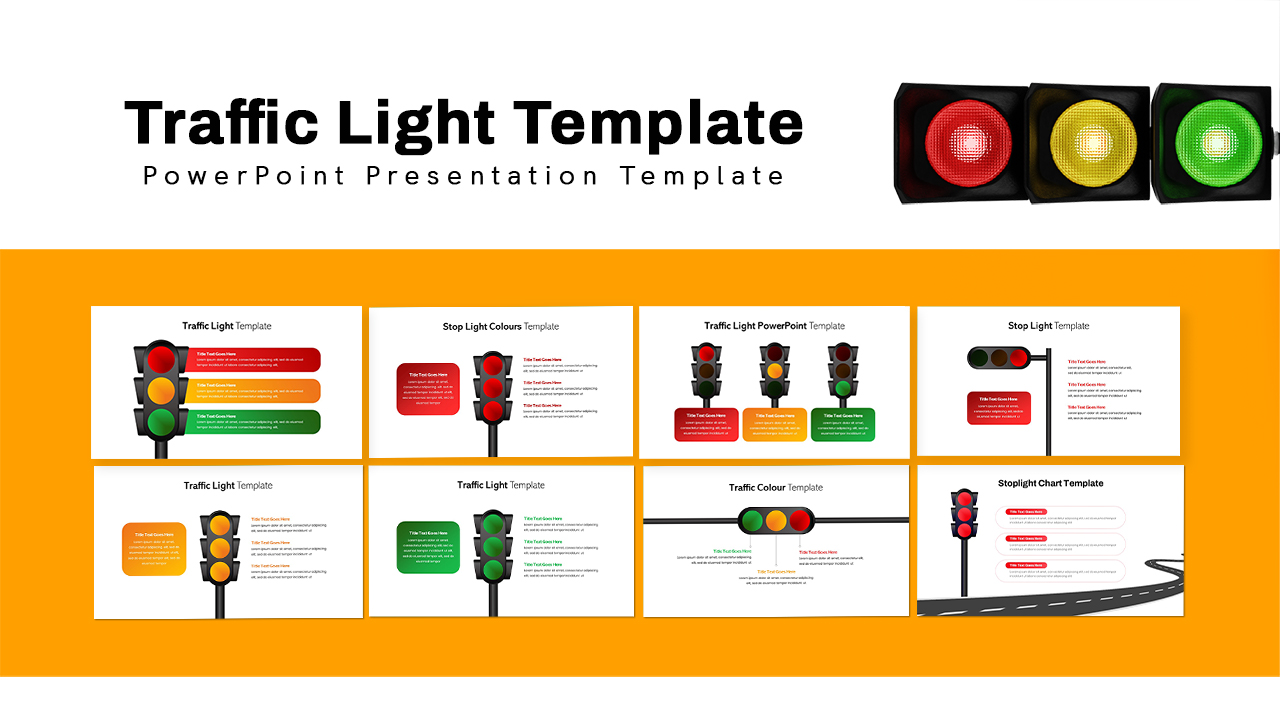
Traffic Light Infographic Pack Template for PowerPoint & Google Slides
Pitch Deck
Newspaper PowerPoint Template
Business Proposal
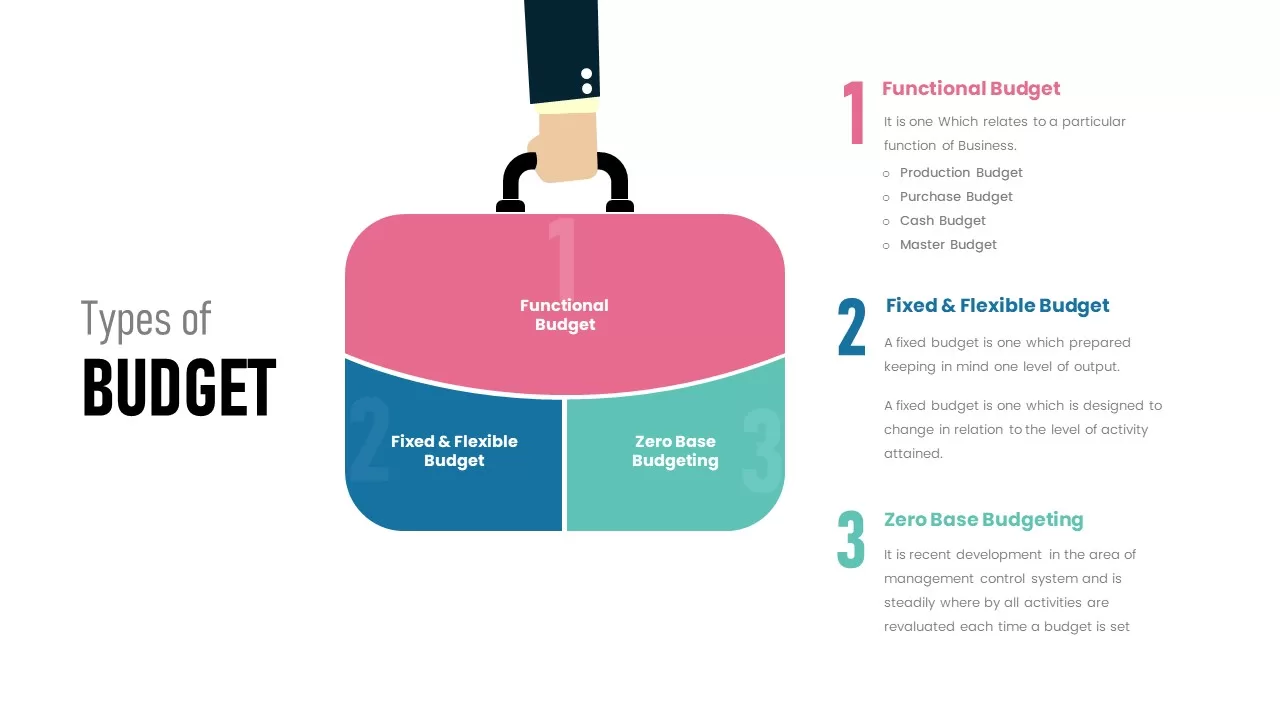
Types of Budget Infographic Pack Template for PowerPoint & Google Slides
Comparison

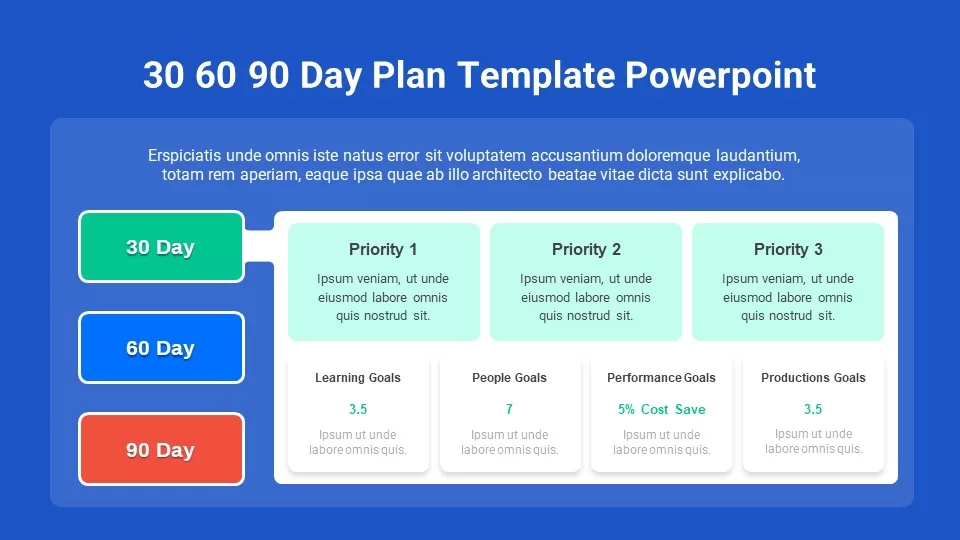
Free 30-60-90 Day Plan Slide Pack Template for PowerPoint & Google Slides
Project Status
Free
Free Veterans Day Patriotic Slide Pack Template for PowerPoint & Google Slides
Graphics
Free
Transformation Roadmap Infographic Pack Template for PowerPoint & Google Slides
Timeline
Six-Slide Animated Accordion Pack Template for PowerPoint & Google Slides
Business
Business Icons for PowerPoint & Google Slides Presentations
Graphics
Sprint Review Template
Infographics
Competitive Battle Card Template
Competitor Analysis
Flywheel Diagram Template
Circular
Free Stick Figure Icon Pack Slide Template for PowerPoint & Google Slides
Graphics
Free
Free Roadmap Infographics Pack Template for PowerPoint & Google Slides
Pitch Deck
Free
Multi-Color Technology Roadmap Template Pack for PowerPoint & Google Slides
Roadmap
Free Colorful Animal 2024 Calendar Slide Pack Template for PowerPoint & Google Slides
Infographics
Free
Agile Project Roadmap Timeline Template Pack for PowerPoint & Google Slides
Scrum
Agile Transformation Roadmap Slide Pack Template for PowerPoint & Google Slides
Roadmap

Free Colorful Infographic Slide Pack Template for PowerPoint & Google Slides
Roadmap
Free
Free Law PowerPoint Google Slides Template
Infographics
Free
Free Multi-Step Funnel Infographic Slide Pack Template for PowerPoint & Google Slides
Funnel
Free
Training Roadmap Infographic Pack Template for PowerPoint & Google Slides
Roadmap
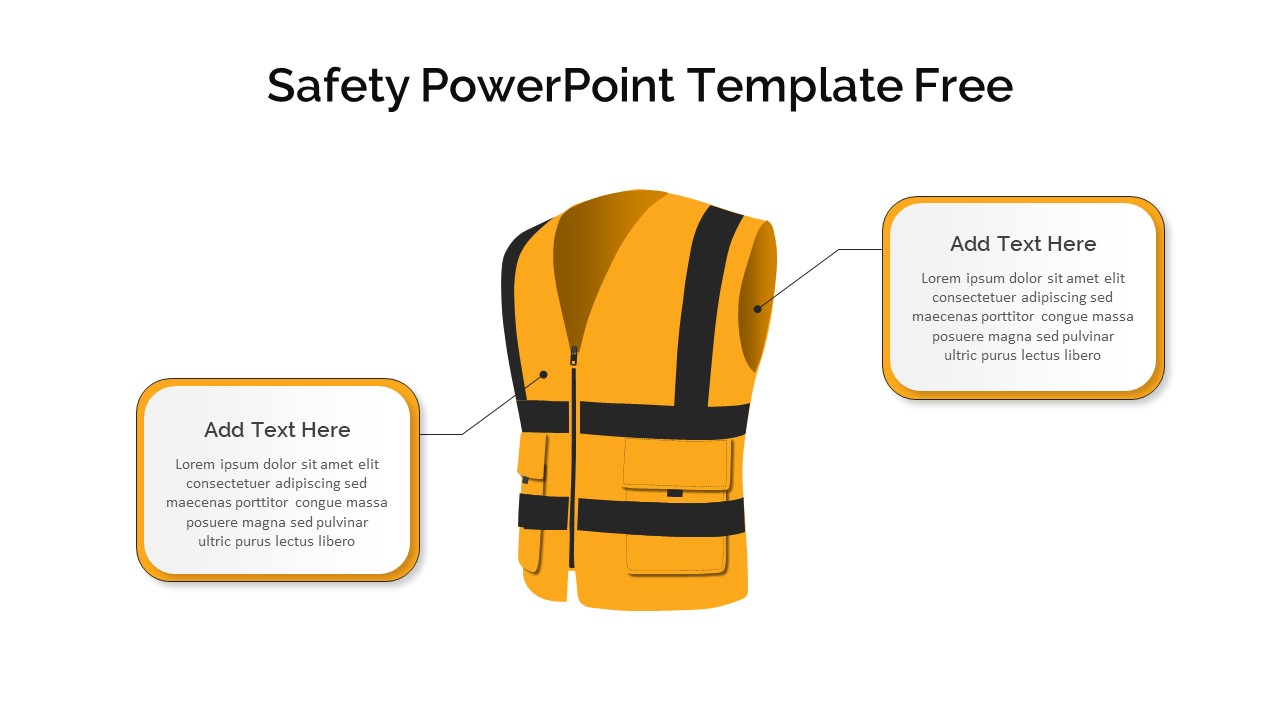
Free 4 Safety Equipment Infographic Pack Template for PowerPoint & Google Slides
Pitch Deck
Free
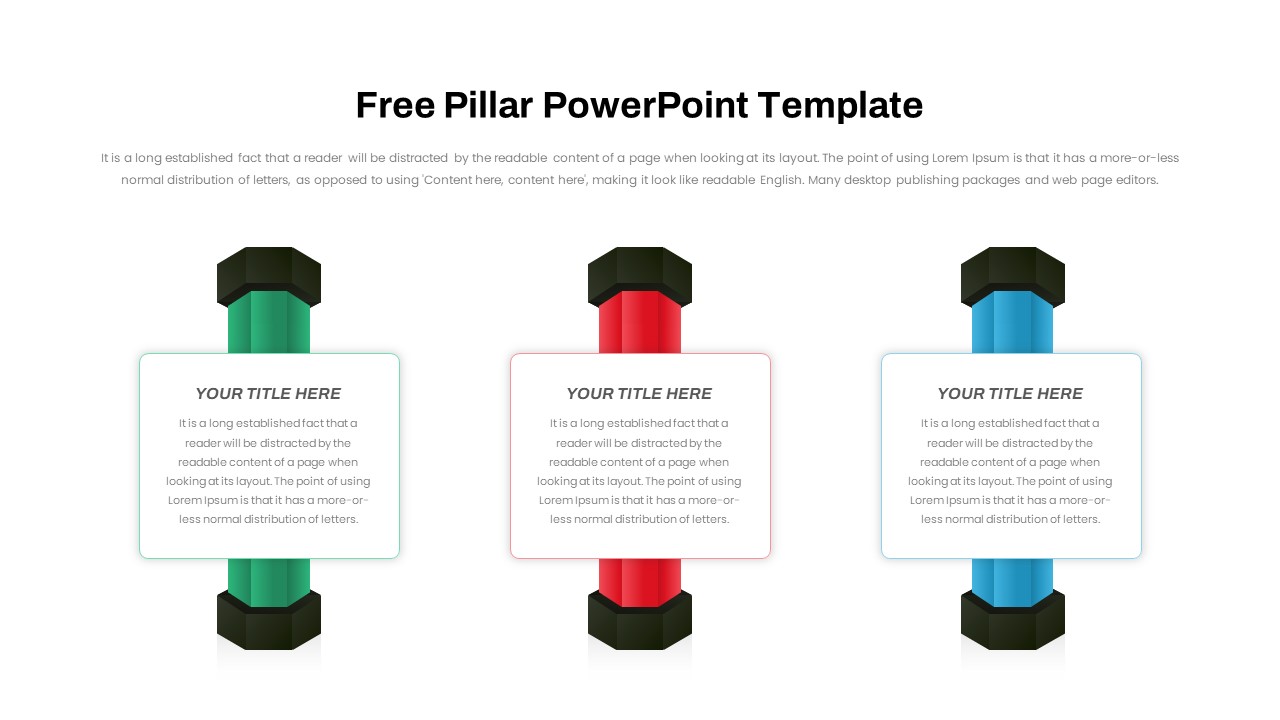
Free Three and Four Pillar Infographic Pack Template for PowerPoint & Google Slides
Process
Free
Versatile Startup Roadmap Slide Pack Template for PowerPoint & Google Slides
Timeline
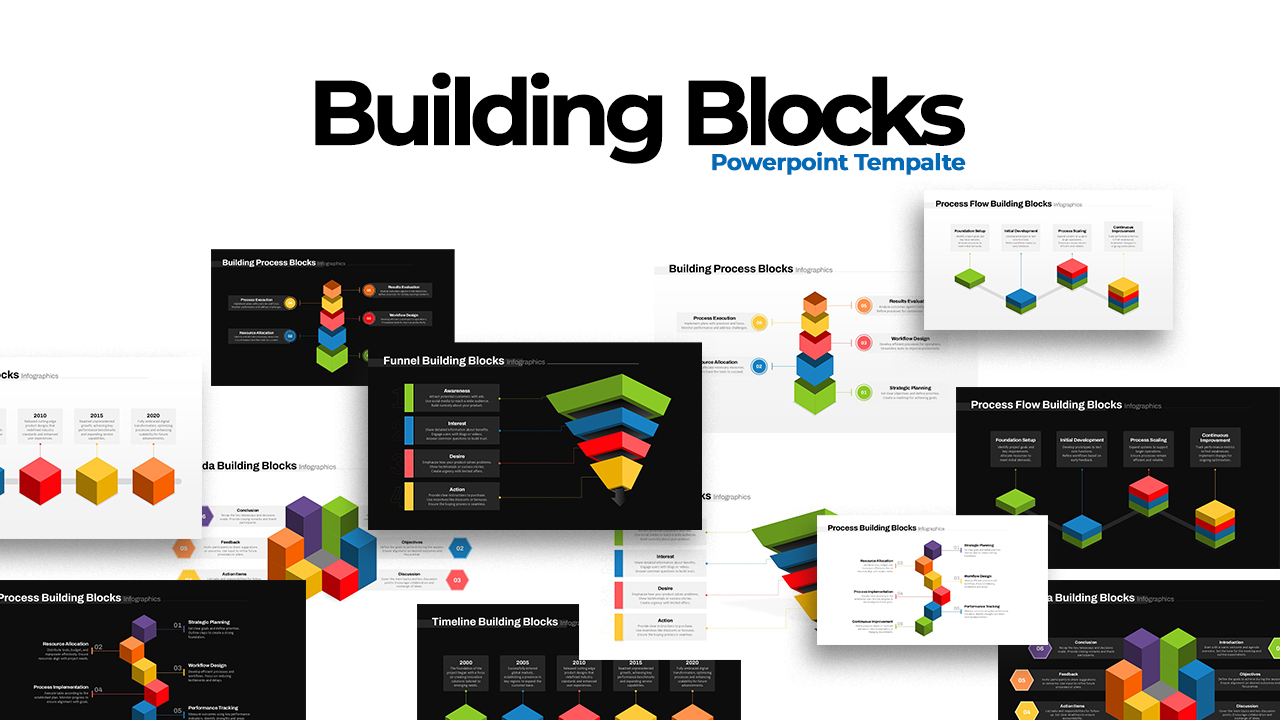
3D Building Blocks Infographic Pack Template for PowerPoint & Google Slides
Infographics
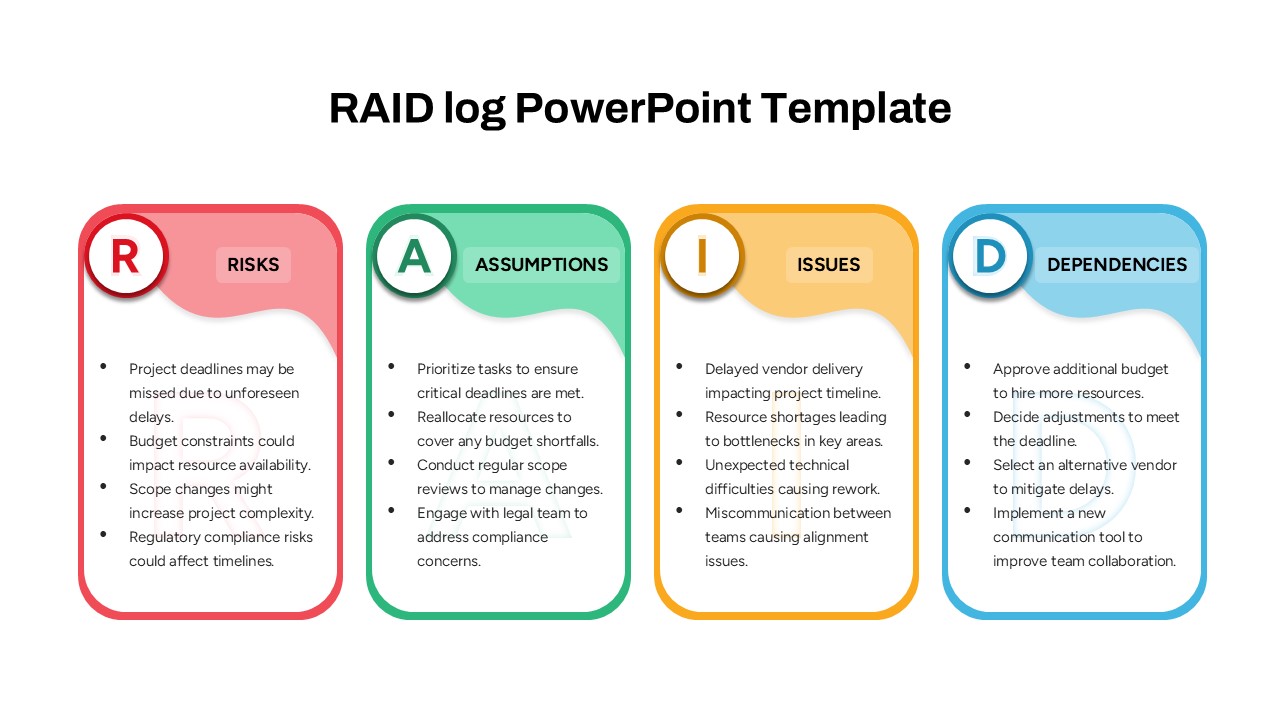
Comprehensive RAID Log Slide Pack Template for PowerPoint & Google Slides
Project
Vision & Strategy Infographic Pack Template for PowerPoint & Google Slides
Vision and Mission
Three Options Infographic Pack Template for PowerPoint & Google Slides
Process
Career Journey Infographic Pack Template for PowerPoint & Google Slides
Timeline
5 Styles Key Outcomes Infographics Pack Template for PowerPoint & Google Slides
Infographics
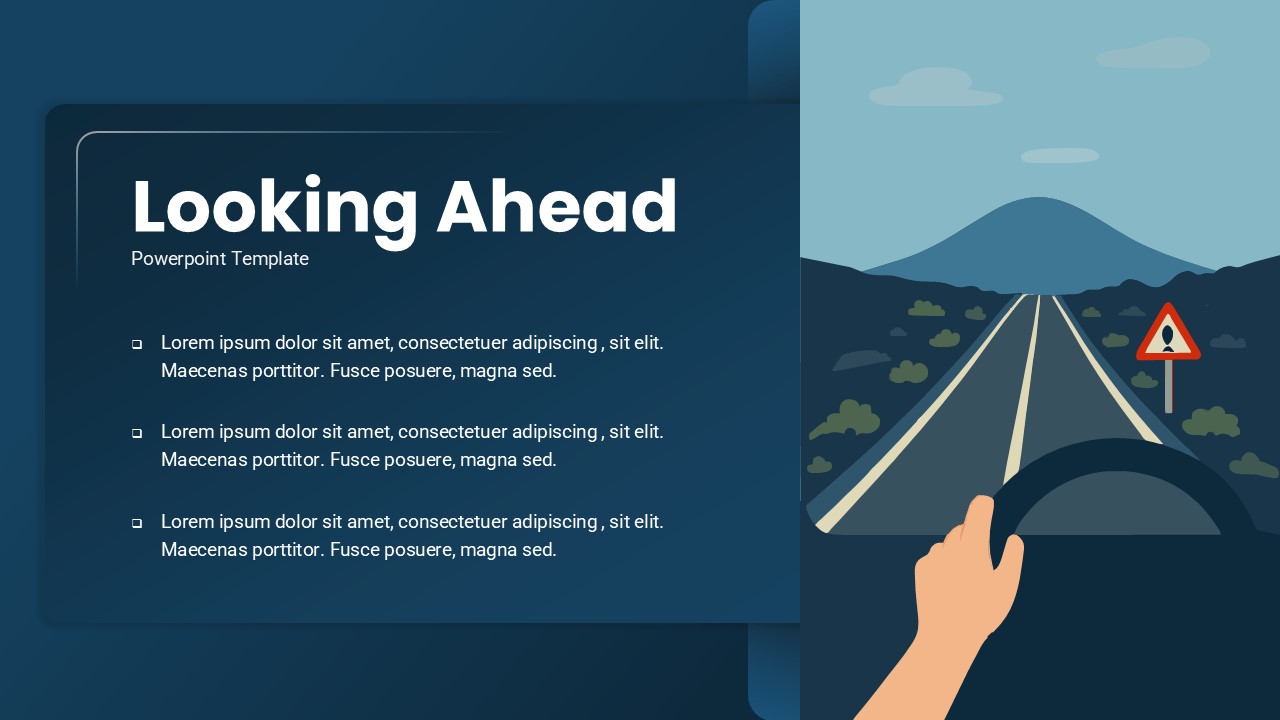
Looking Ahead 3-Slide Infographics Pack Template for PowerPoint & Google Slides
Business
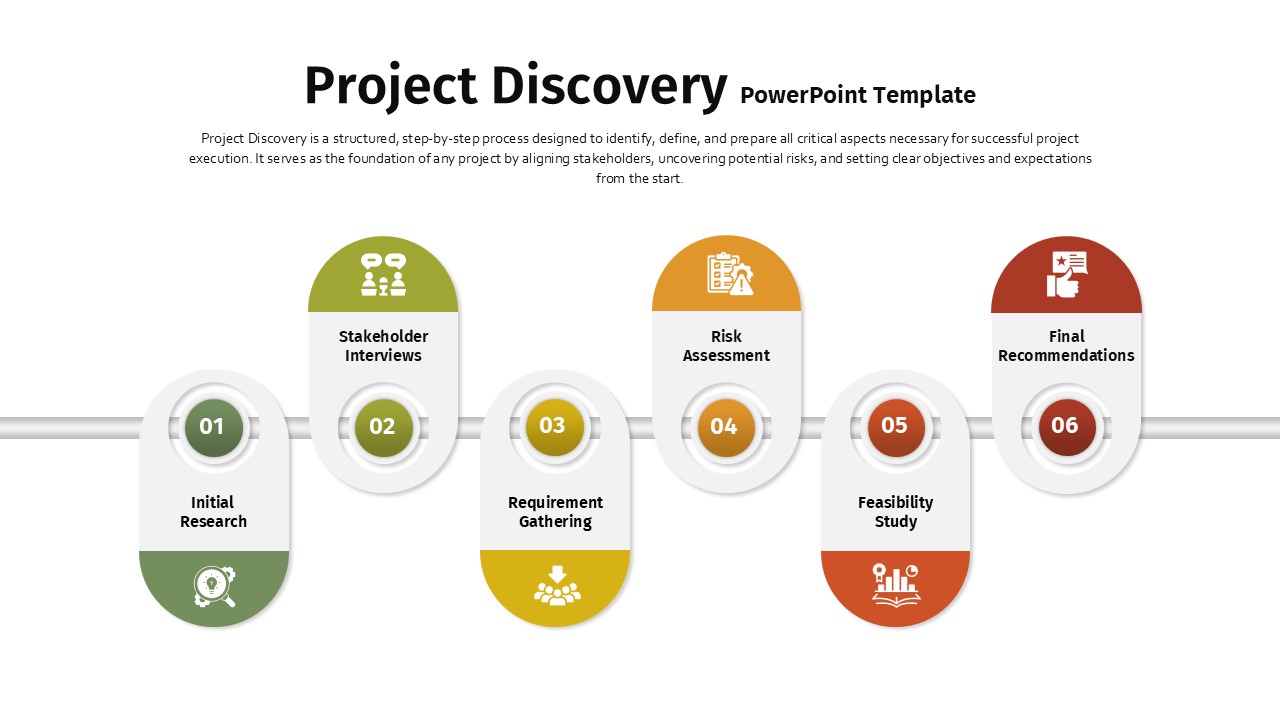
Project Discovery Infographic Pack Template for PowerPoint & Google Slides
Timeline
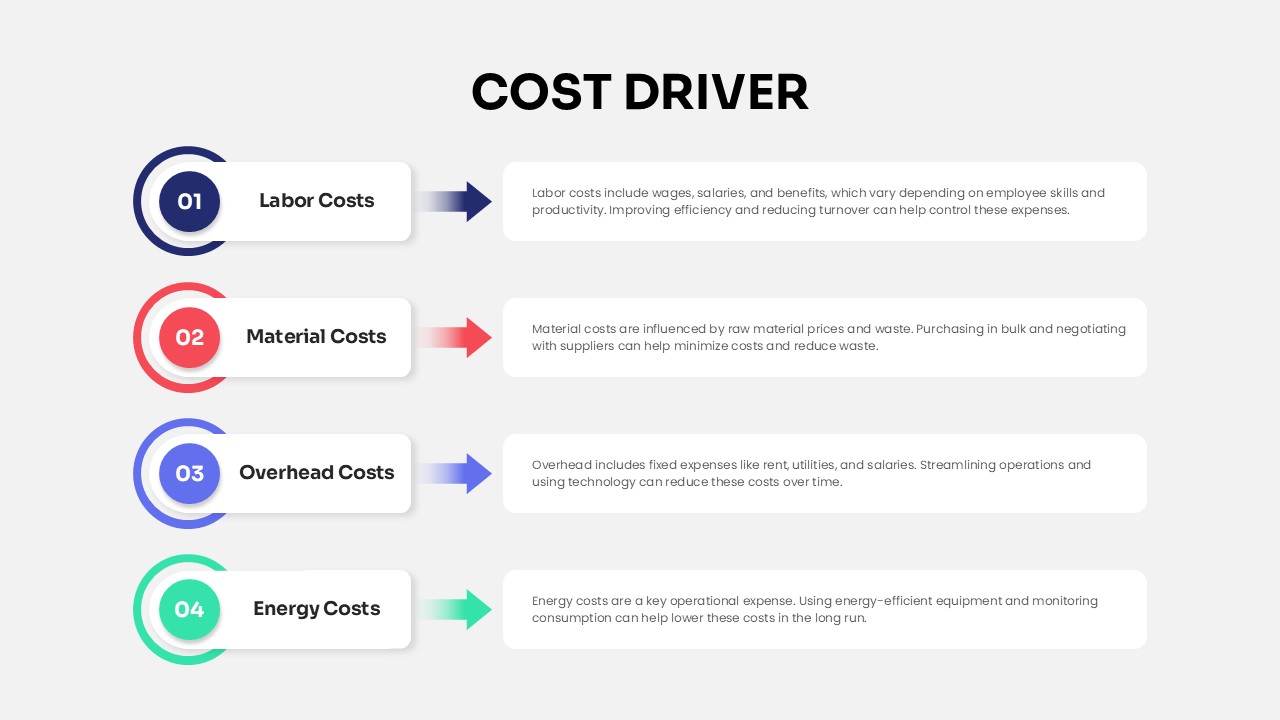
Cost Driver Infographic Slide Pack Template for PowerPoint & Google Slides
Process
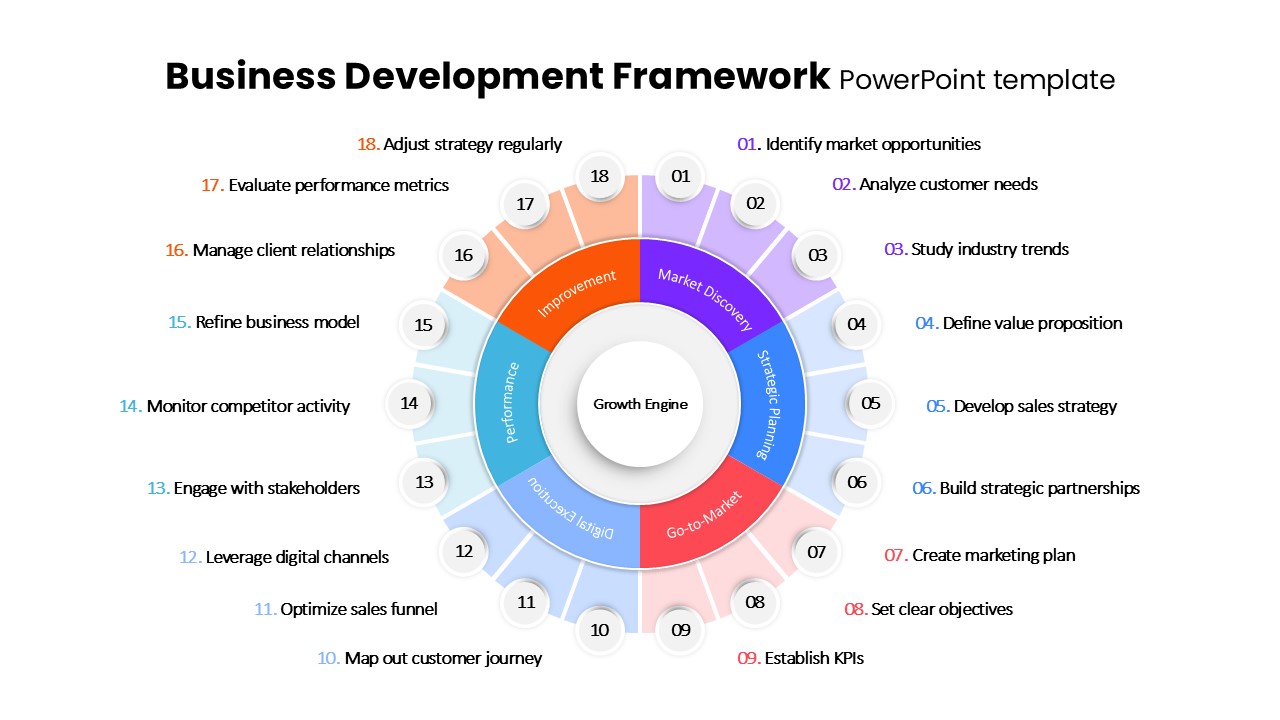
Business Development Framework Pack Template for PowerPoint & Google Slides
Business Strategy
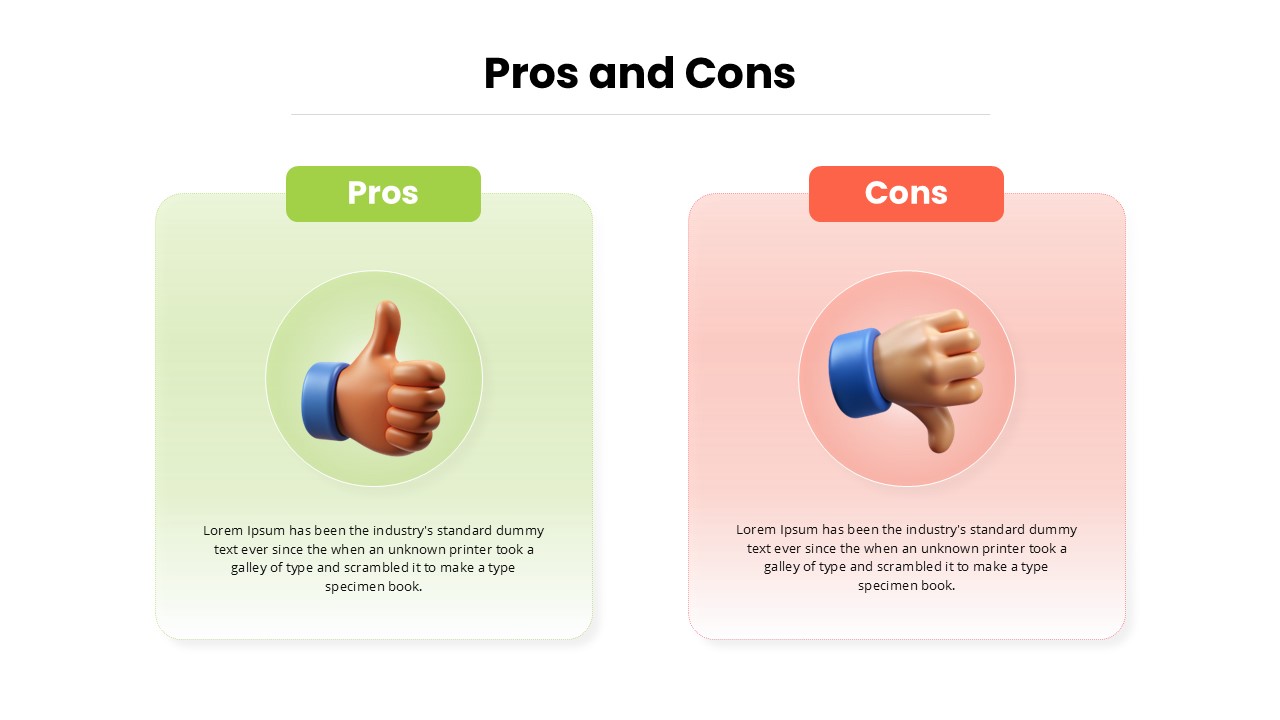
Pros and Cons Infographic Slide Pack Template for PowerPoint & Google Slides
Comparison
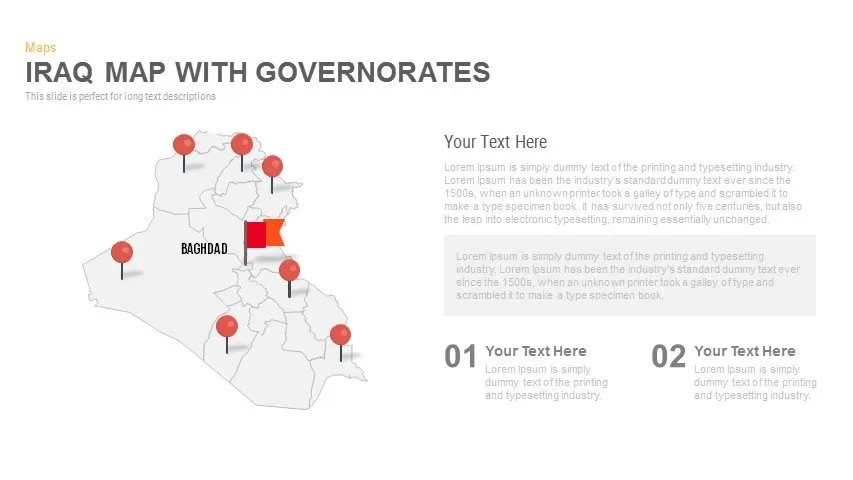
Interactive Iraq Map with Governorates Slide Pack for PowerPoint & Google Slides
World Maps
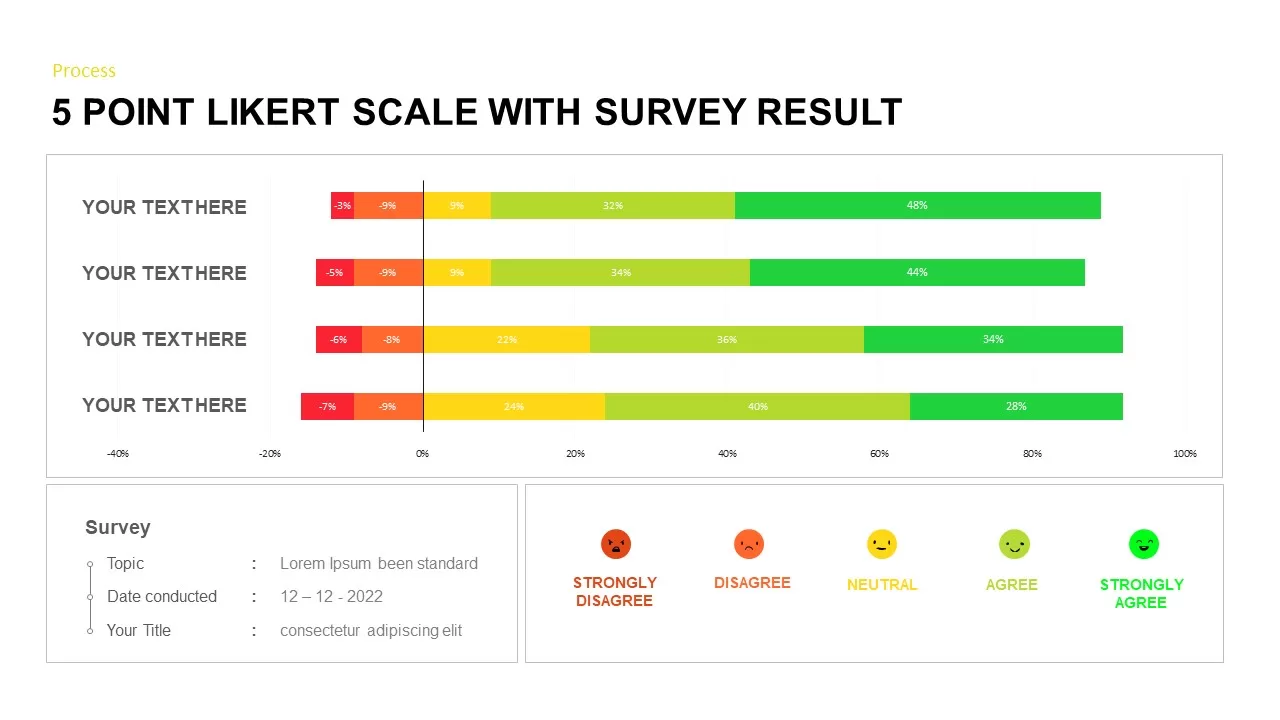
Likert Scale Survey Results infographic pack for PowerPoint & Google Slides
Business
1 to 5 Column infographic pack for PowerPoint & Google Slides
Business
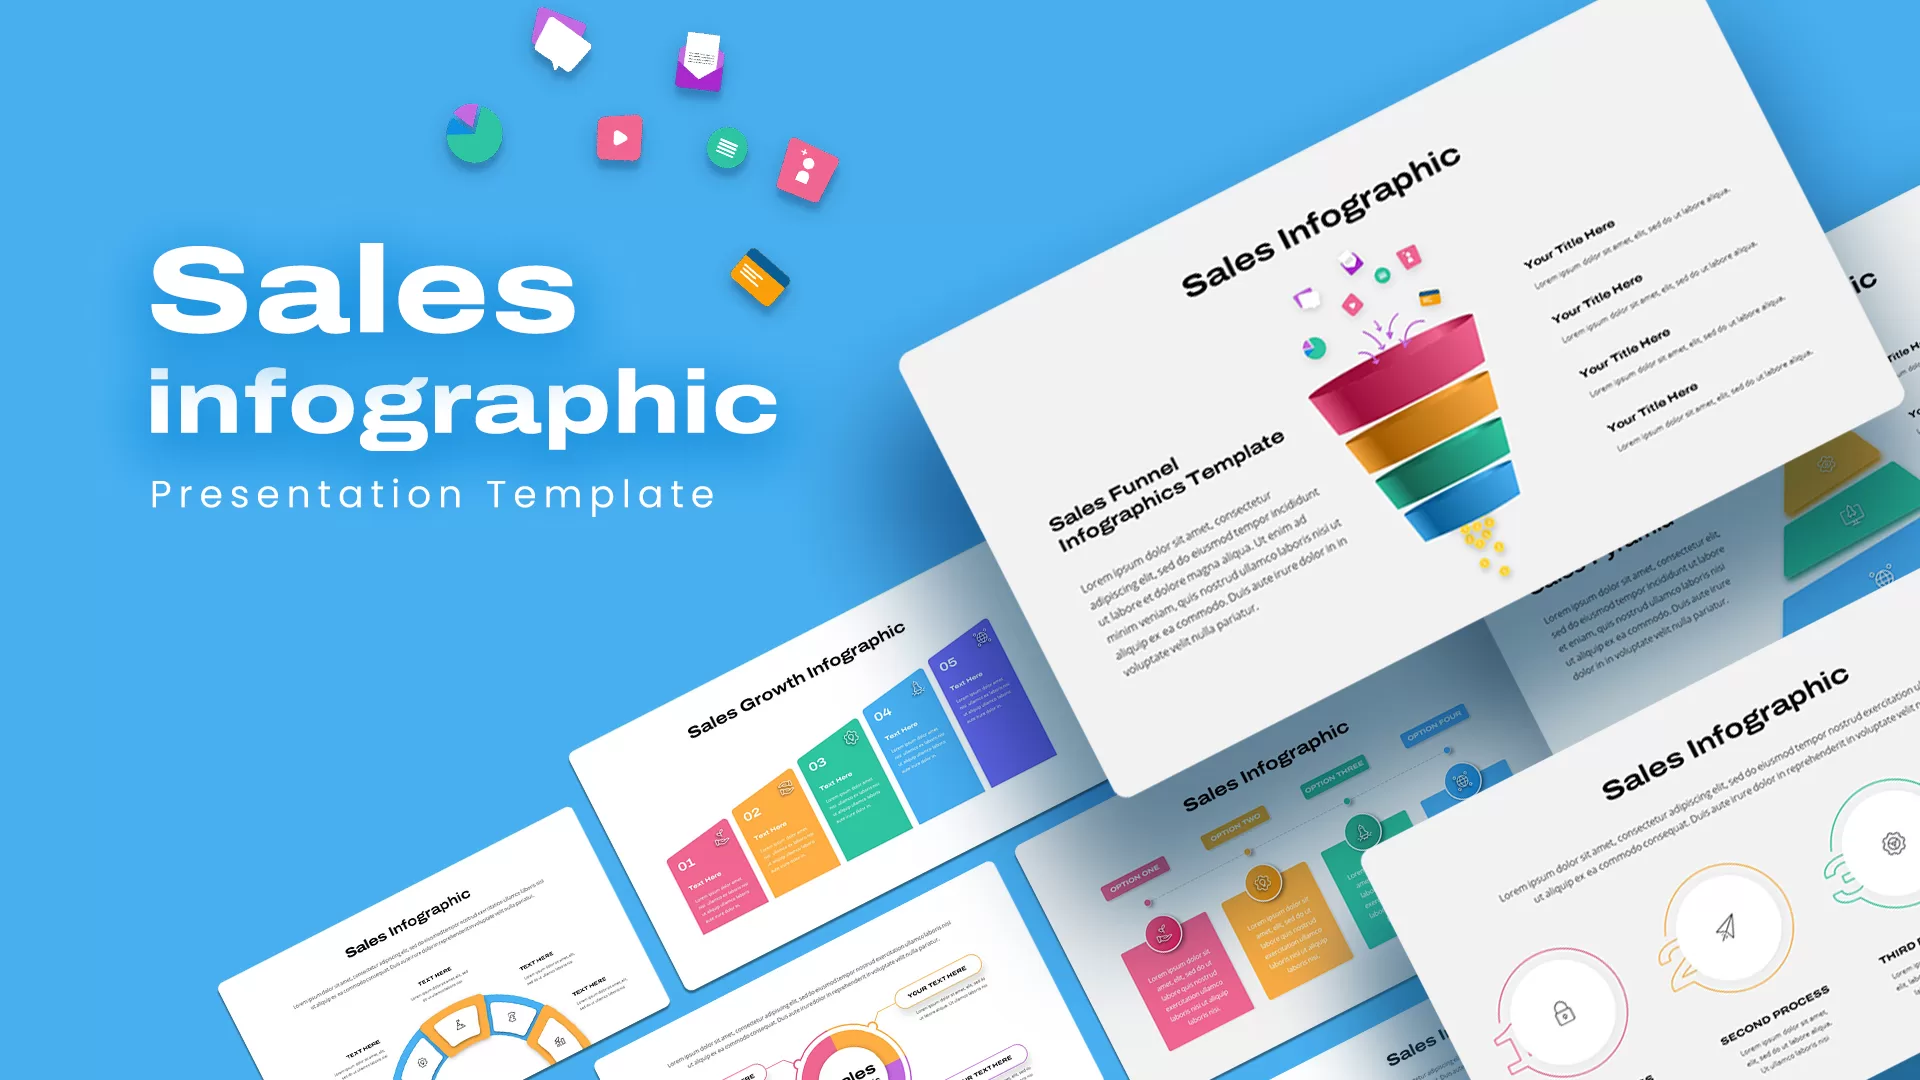
Sales Infographic pack for PowerPoint & Google Slides
Business
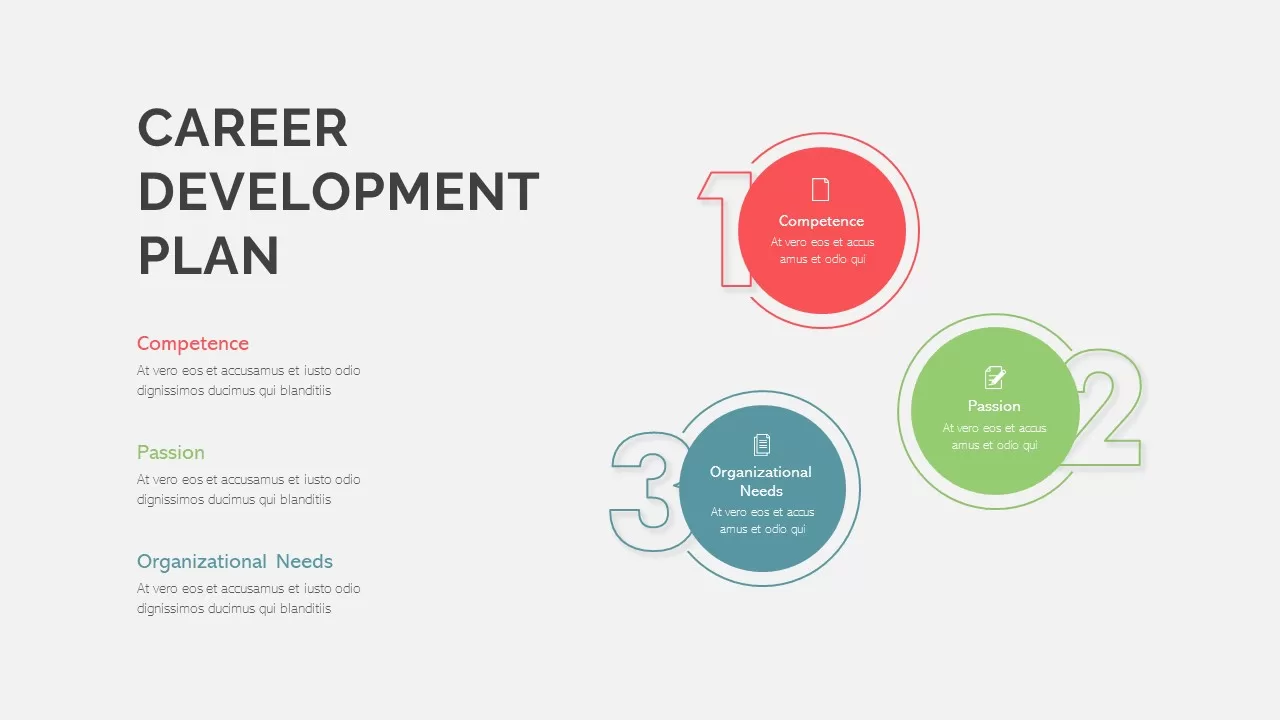
Career Development Plan Template
Infographics
Quiet Quitting Infographics Pack for PowerPoint & Google Slides
Employee Performance
Free