


Data Bar Chart Template for PowerPoint and Keynote

Data Bar Chart PowerPoint Template
Are you bored of usual bars and charts? Then you are on the right page. Our data bar chart PowerPoint template and google slides will spark up your presentation, and your statistical representation will never be a boring one. As to get the data you might have researched hardly. So, the data should be emphasized using stunning graphics. Save your time and effort with our custom-tailored bar chart template. Designed in a modern layout, the template features innovative and colorful diagrams which can be accessed to deliver multiple presentation contexts. Bar charts are said as the most common way of summarising categorical data. Each bar in a template represents a particular category. The sizes of the bars may vary based on the value of the statistical data.
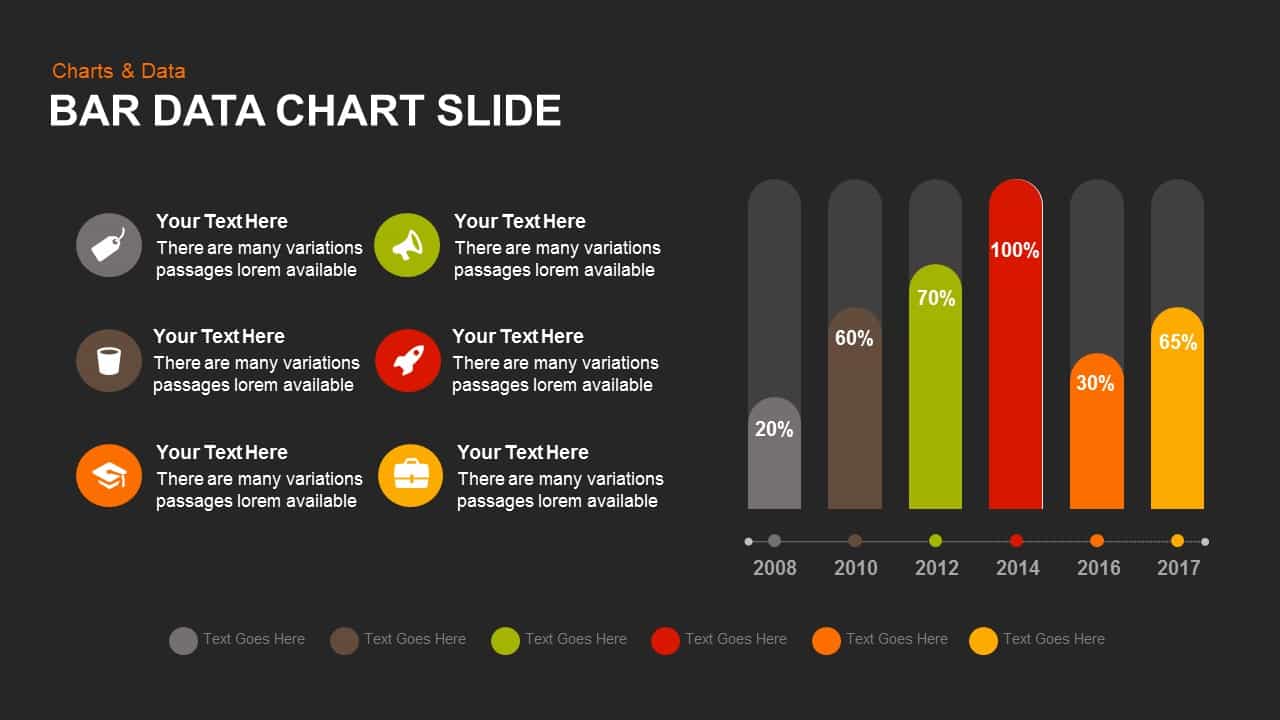
Our data chart PowerPoint presentation template is an ideal analytical tool to present your business data. The template features six bars chart; each bar is backed with a gradient bar, which makes it easy to depict the difference between the highest and the lowest value of the data. At the bottom of the template is six circle shapes, colored in the same color as of the bars. The presenter can represent or name each graph. Adjacent to the graph is the infographic icons. The presenter can illustrate information on each bar. The colorful template will quickly stimulate the audience focus over the topic. The bright color palette makes the template more pleasing.
Our powerpont chart template is a convenient medium for showcasing the complex statistical data graphically. Through which, the audience can instantly grab the idea of the topic. The bar graph template is designed using PowerPoint objects, which makes the template fully customizable. It enables the presenter to change color, resize, edit the elements of the template which makes elements easily distinguishable. Download our data bar chart and analyze the statistical data at a glance.
Login to download this file

Item ID
SB00727
Related Templates

Creative Data Analysis Bar Chart template for PowerPoint & Google Slides
Bar/Column
3D Bar Chart Data Infographics Template for PowerPoint & Google Slides
Bar/Column
Pencil Bar Chart Data Analysis Template for PowerPoint & Google Slides
Bar/Column
Simple Bar Chart Data Visualization Template for PowerPoint & Google Slides
Bar/Column
Data Analysis Bar Chart with Insights Template for PowerPoint & Google Slides
Bar/Column
Free
Comparison Bar Chart template for PowerPoint & Google Slides
Comparison Chart
Three Bar Chart PowerPoint Template
Charts
3D Cylinder Bar Chart Template for PowerPoint & Google Slides
Bar/Column

Monthly Reports Bar Chart template for PowerPoint & Google Slides
Bar/Column
Interactive Product Comparison Bar Chart Template for PowerPoint & Google Slides
Bar/Column
For and Against Vote Count Bar Chart Template for PowerPoint & Google Slides
Bar/Column
Entertainment Industry Revenue Bar Chart Template for PowerPoint & Google Slides
Bar/Column
Statistics Infographic & KPI Bar Chart Template for PowerPoint & Google Slides
Bar/Column
Multi-Series Stacked Bar Chart Template for PowerPoint & Google Slides
Bar/Column
Dynamic Bar-of-Pie Chart Comparison Template for PowerPoint & Google Slides
Pie/Donut
Expanding Margins Analysis Bar Chart Template for PowerPoint & Google Slides
Charts
Quarterly Sales Review Bar Chart Template for PowerPoint & Google Slides
Bar/Column
Horizontal Bar Chart Slide with Icons Template for PowerPoint & Google Slides
Bar/Column
Two-Option Bar Chart Comparison Table Template for PowerPoint & Google Slides
Comparison
Bar Gantt Chart Template for PowerPoint & Google Slides
Gantt Chart


