Set of Chart PowerPoint Template and Keynote Diagram


Set of Chart PowerPoint Template
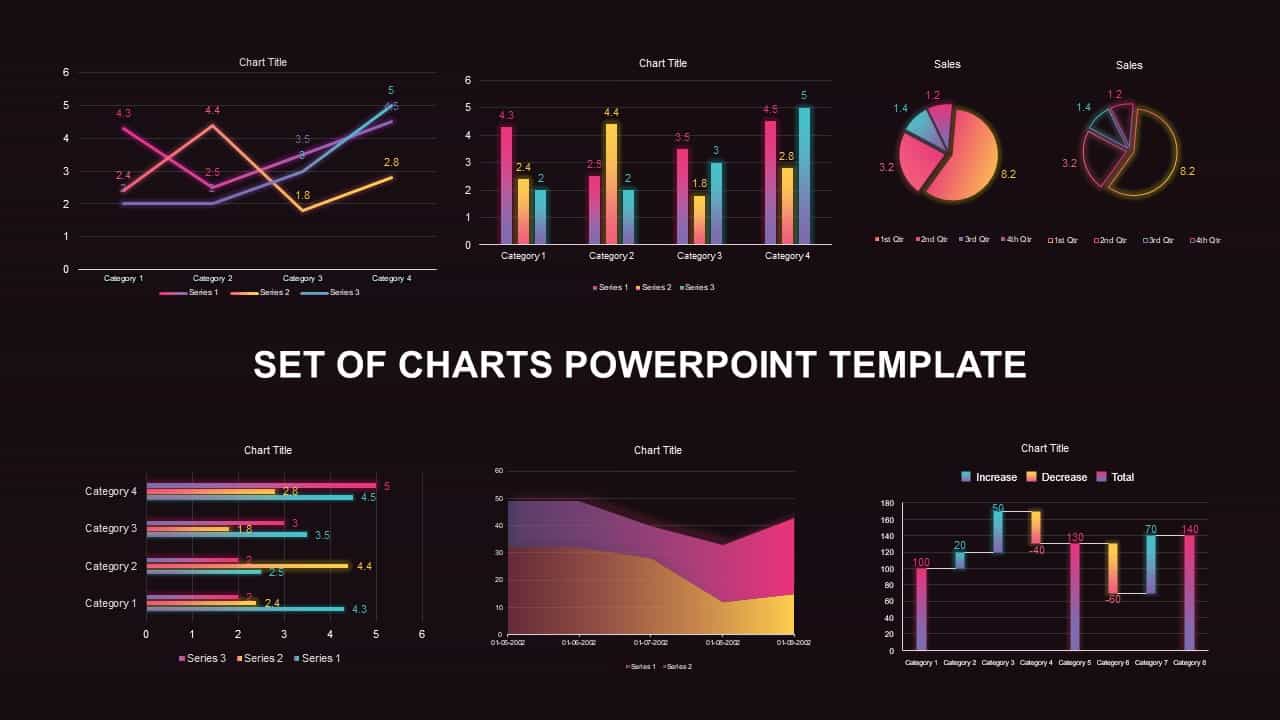
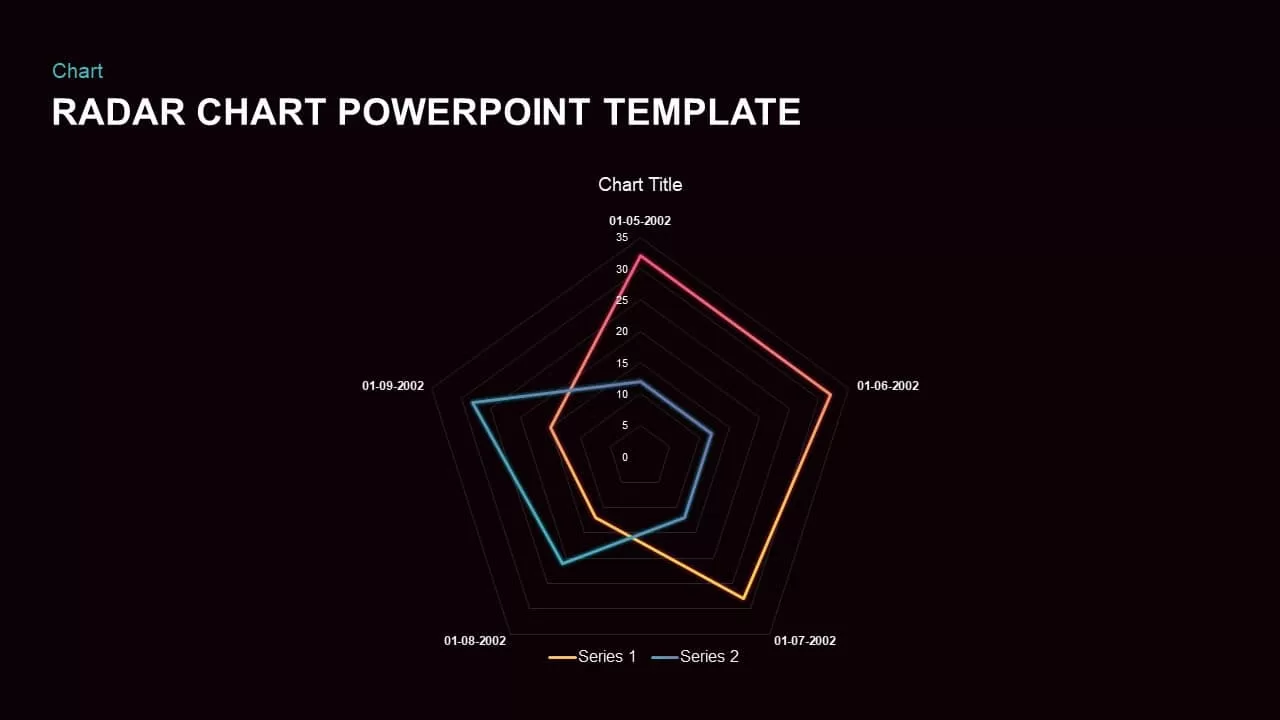
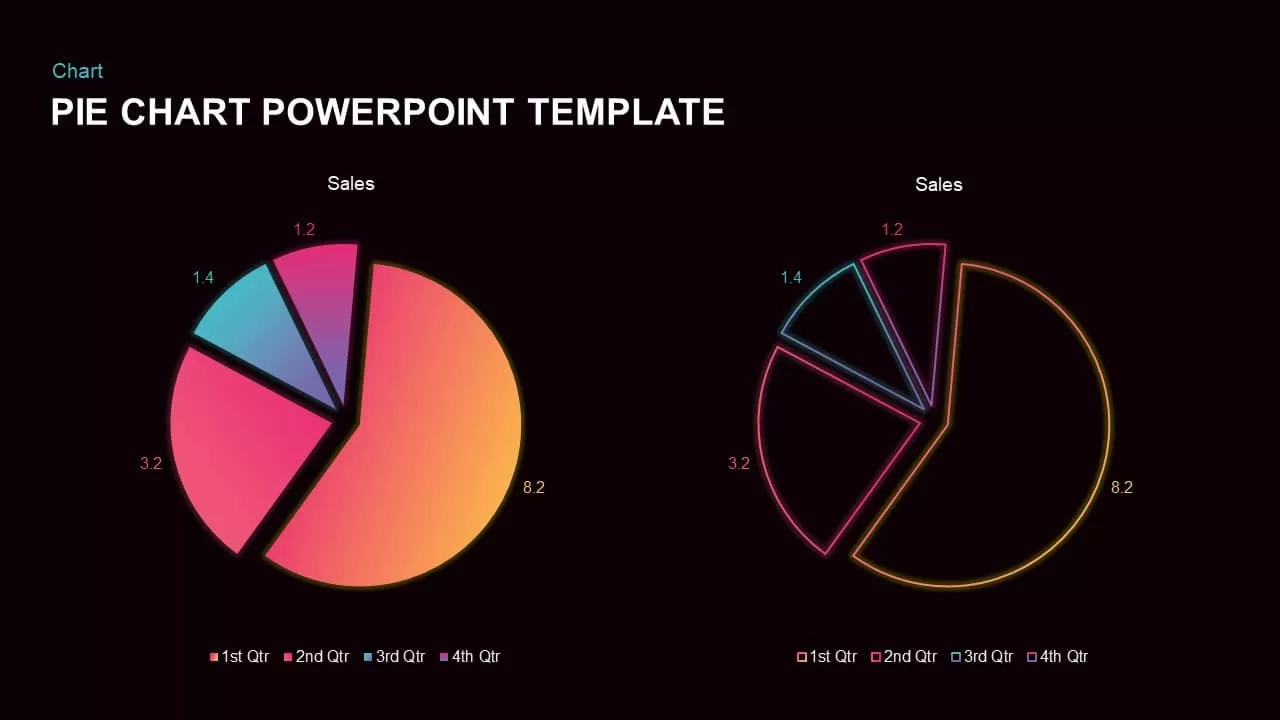
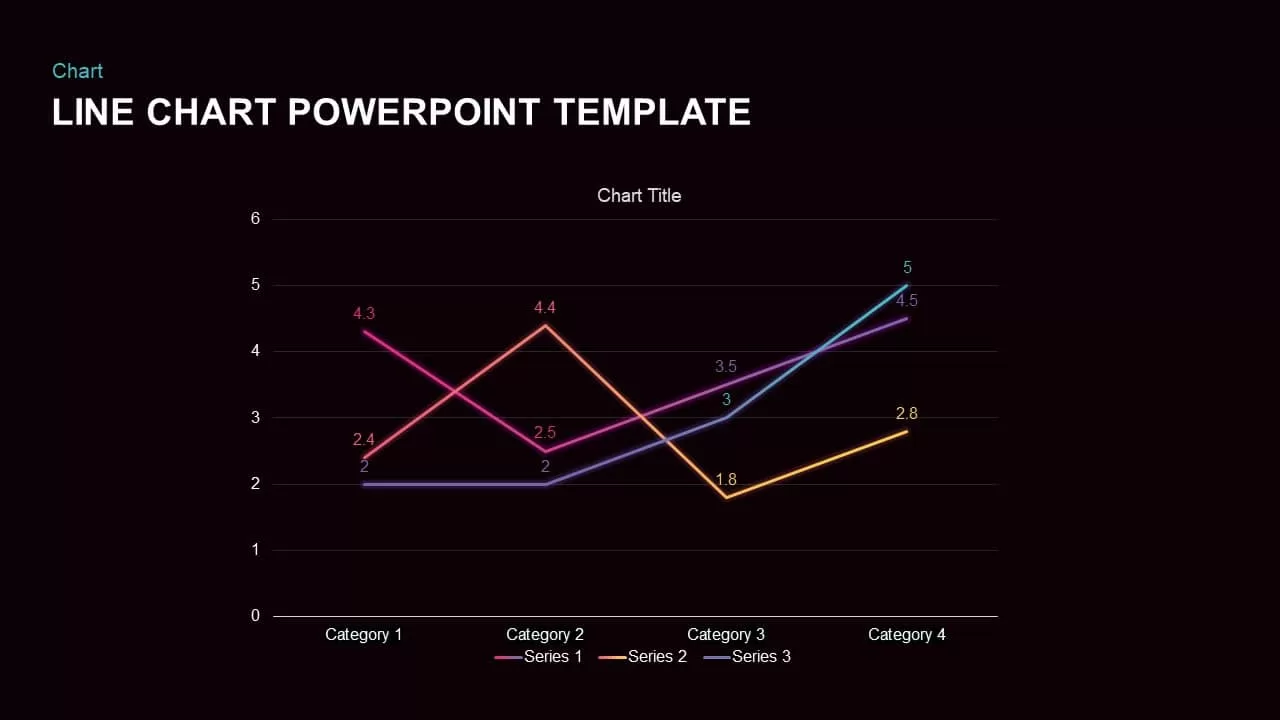
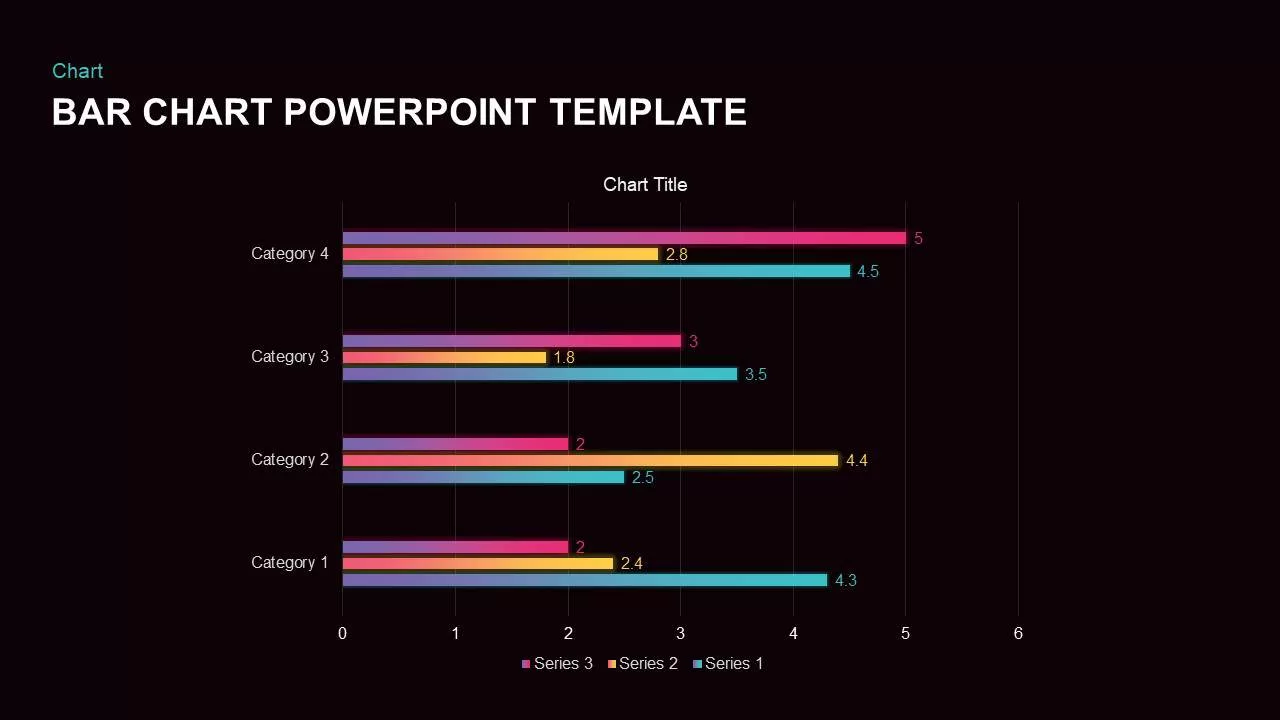
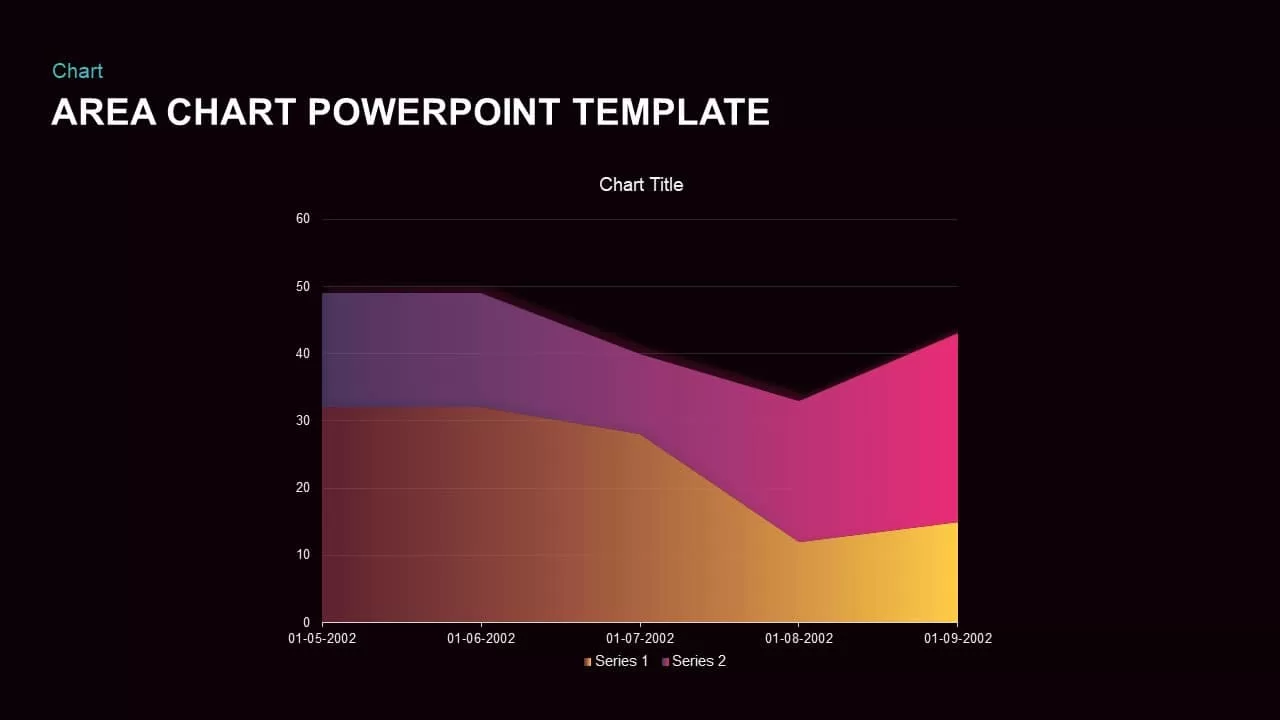
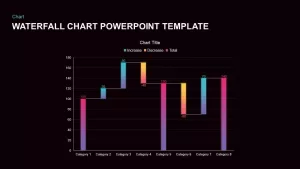
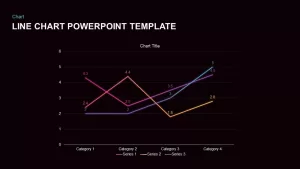
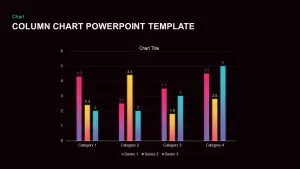
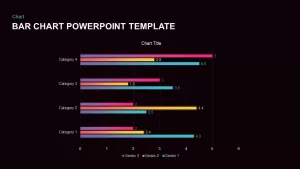
Set of chart PowerPoint template is a data driven PowerPoint slide that contains eight different statistical visual charts with a master dashboard. The dashboard presentation is perfect for sales and financial reviews using graphs and charts. The dashboard ppt presentation helps a glance views of key performance indicators in connection with a particular business objectives or goals. The users can project separate data individually using the other individual templates. The set of charts ppt diagram is a collection of waterfall chart PowerPoint, radar chart PowerPoint, area chart PowerPoint, bar chart PowerPoint, pie chart PowerPoint, column chart PowerPoint, line chart PowerPoint and the master dashboard. Data presenters, research professionals, marketing and sales managers, finance managers, administrators and planner can use these statistical tools to present reliable data before their audience.
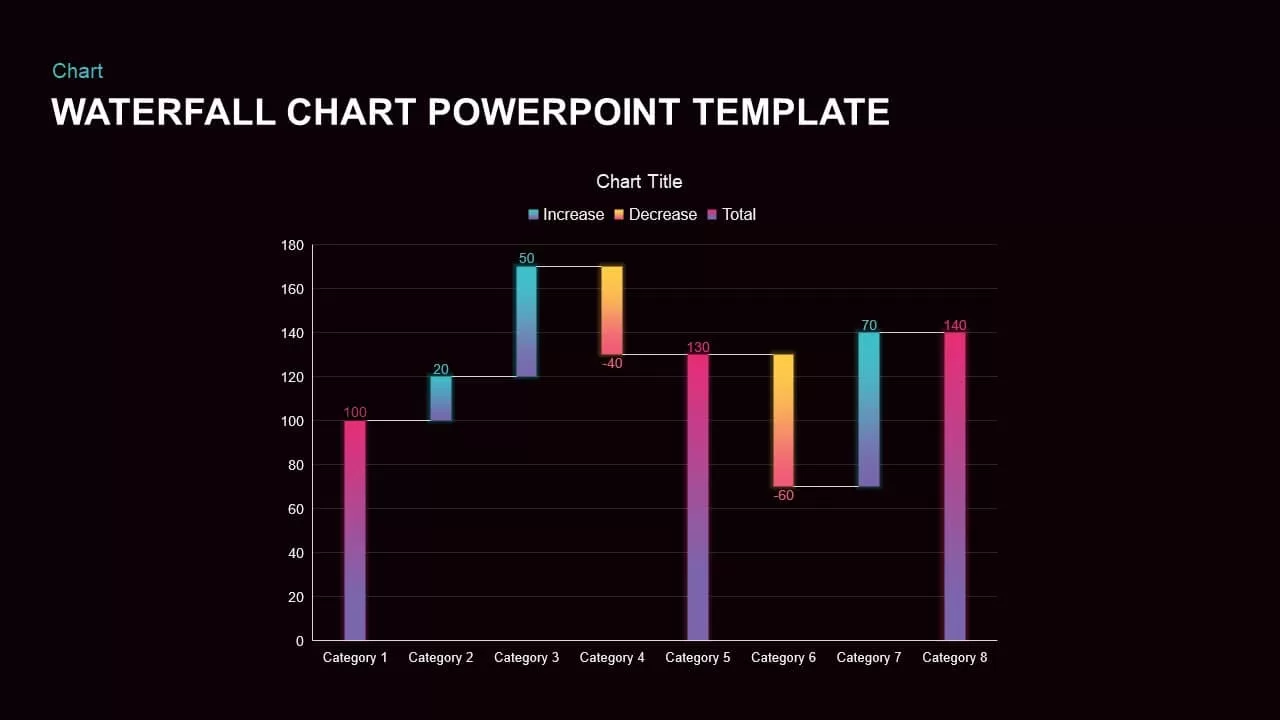
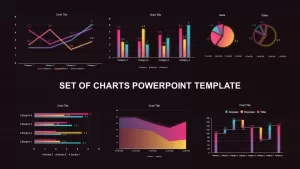
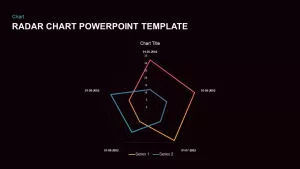
The set of chart template for PowerPoint presentation is statistical ppt presentation template. the attractive dark background and colour mixing ensure the audience attention and engagement. The master dashboard designed professionally, which involves all other diagrams and charts in the single platform. The sales presentation deck gives real time visibility to prognosticate where quick planning and decision making is involved. The collection of charts PowerPoint template is perfect for business and sales reviews. The business managers can adopt the statistical tool for effective and efficient reporting. Line graph and waterfall charts are perfect for sales growth presentation. The area chart PowerPoint slide can be used to present the change in one or ore quantities over time. Pie chart is attractive and useful to present the distribution of an item.
The set of chart PowerPoint template is designed for professional presenters. The PowerPoint diagram represents scientific mode of discussion with enchanting visual graphics. The dashboard ppt presentation allows separate projection of data through different statistical tools. The multi-functional business presentation PowerPoint also assist the researchers to depict their data with a stunning PowerPoint presentation. The editable data presentation PowerPoint diagram allows customization on its features. Download charts ppt diagram for an impressive data presentation.
You can access more Chart Templates here Grab the free ppt now!
Login to download this file

Item ID
SB01221
Related Templates

Comparison Donut Chart PowerPoint Template and Keynote
Pie/Donut

Organization Hierarchy Template PowerPoint & Google Slides
Org Chart

Creative Isometric Organization Chart PowerPoint Template
Org Chart
Success Key Diagram with Donut Chart Template for PowerPoint & Google Slides
Pie/Donut
Creative Organization Chart Diagram Template for PowerPoint & Google Slides
Org Chart
Four Section Comparison Chart Diagram Template for PowerPoint & Google Slides
Infographics
Data-Driven Line Chart Diagram Template for PowerPoint
Comparison Chart
Vertical Split Flow Chart Diagram Template for PowerPoint & Google Slides
Flow Charts
Flow Chart Diagram Template for PowerPoint & Google Slides
Flow Charts
Professional Organizational Chart Diagram Template for PowerPoint & Google Slides
Org Chart
Flow Chart Diagram template for PowerPoint & Google Slides
Flow Charts
Free Circular Multi-Step Flow Chart Diagram Template for PowerPoint & Google Slides
Flow Charts
Free
Divisional Organizational Chart Template
Org Chart
Flat Organization Chart Diagram Template for PowerPoint & Google Slides
Org Chart
Flat Organizational Structure Template
Org Chart
Overlapping Timeline Gantt Chart Diagram Template for PowerPoint & Google Slides
Timeline
C-Suite Org Chart Template for PowerPoint & Google Slides
Org Chart
Animated Hexagon Org Chart Diagram Template for PowerPoint & Google Slides
Org Chart
Upside-Down Organizational Chart Diagram Template for PowerPoint & Google Slides
Org Chart
Multi-Style Clock Chart Diagram Template for PowerPoint & Google Slides
Circular
Multi-Variation Circular Chart Diagram Template for PowerPoint & Google Slides
Circular
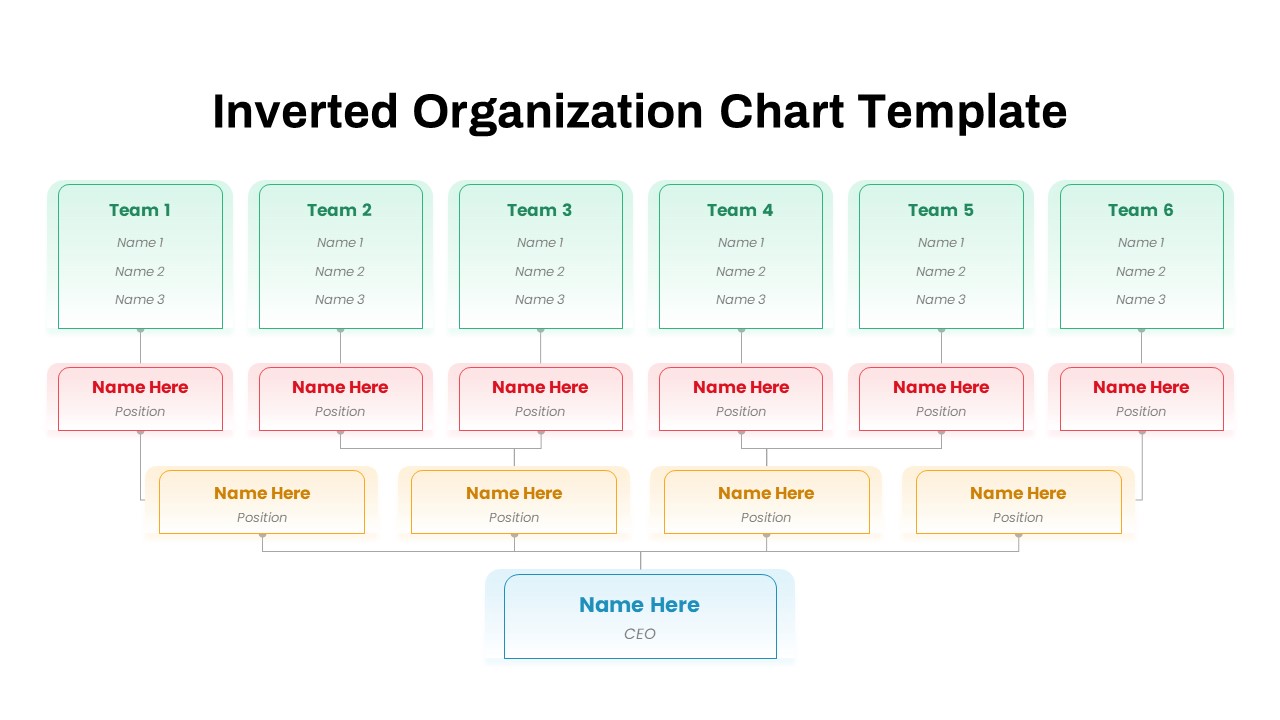
Inverted Organization Chart Diagram Template for PowerPoint & Google Slides
Org Chart
Modern Multi-Color Polar Chart Diagram Template for PowerPoint & Google Slides
Charts
Wheel Chart PowerPoint Templates
Pie/Donut
Bubble Chart Scatter, Diagram & Matrix Template for PowerPoint & Google Slides
Comparison Chart

Radial Bar Chart Diagram for PowerPoint & Google Slides
Bar/Column
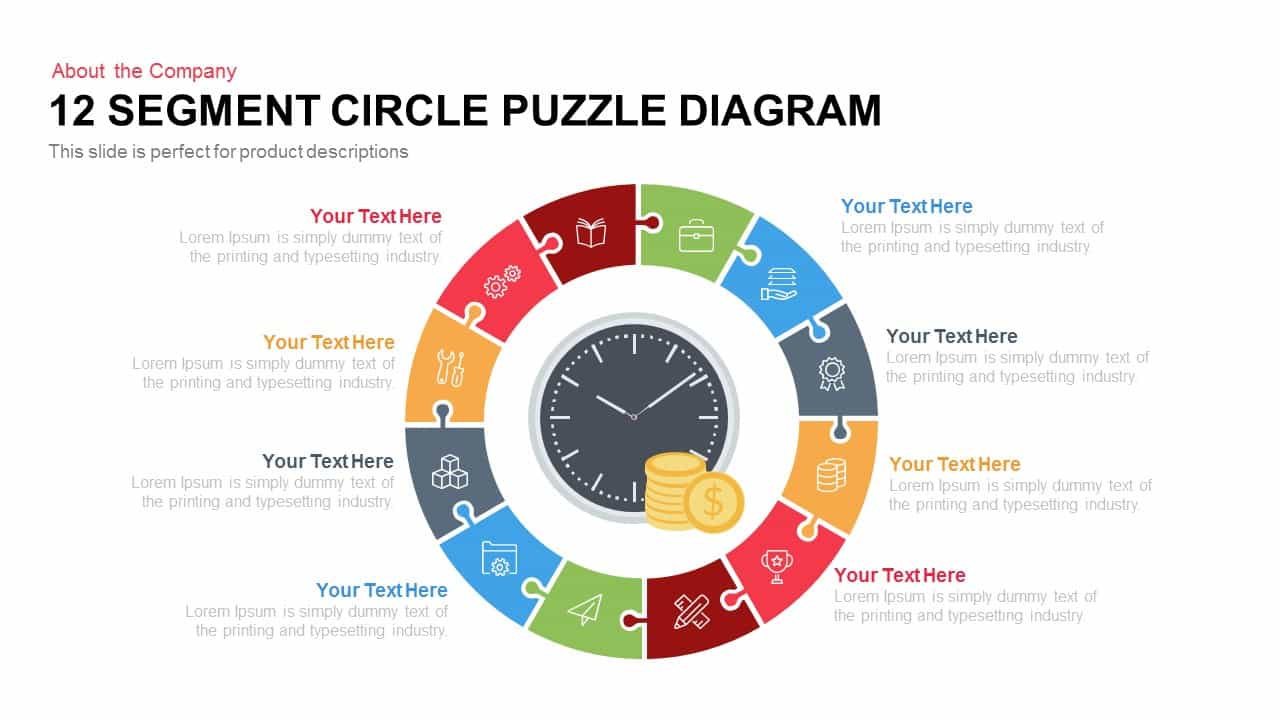
12 Segment Circle Puzzle Diagram Template for PowerPoint and Keynote
Circular
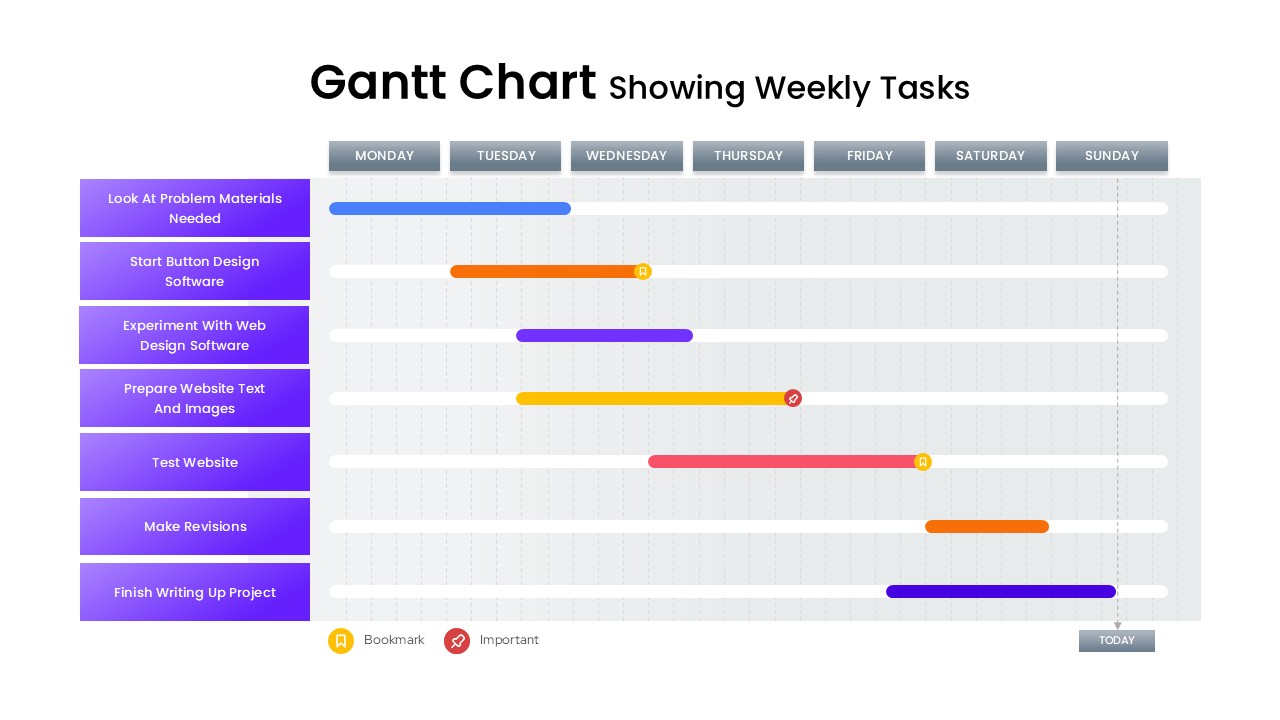
Gantt Chart Template Showing Weekly Tasks Template for PowerPoint & Google Slides
Gantt Chart
Creative Data Analysis Bar Chart template for PowerPoint & Google Slides
Bar/Column
Multi level Donut Chart Template
Pie/Donut

Corporate Organization Chart template for PowerPoint & Google Slides
Org Chart
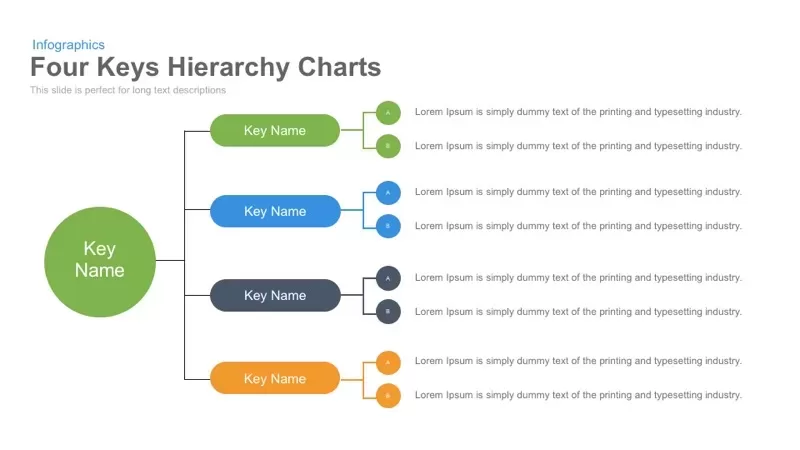
Four Keys Hierarchy Chart template for PowerPoint & Google Slides
Process
Organization Chart template for PowerPoint & Google Slides
Org Chart
Profit Performance Trend Chart Template for PowerPoint & Google Slides
Finance
Pencil Bar Chart Data Analysis Template for PowerPoint & Google Slides
Bar/Column

Fully Editable Gantt Chart Timeline template for PowerPoint & Google Slides
Gantt Chart
Five-Stage People Infographic Chart template for PowerPoint & Google Slides
Process

Line Chart Analysis template for PowerPoint & Google Slides
Charts
Application Revenue Line Chart KPI Template for PowerPoint & Google Slides
Revenue
Organizational Chart PowerPoint Template
Org Chart
3D Cylinder Bar Chart Visualization Template for PowerPoint
Bar/Column
Circular Org Chart in PowerPoint & Google Slides
Org Chart
RASCI Responsibility Matrix Chart Template for PowerPoint & Google Slides
Business
Distracting Factors at Work Bar Chart Template for PowerPoint & Google Slides
Bar/Column
Organizational Structure Hierarchy Chart Template for PowerPoint & Google Slides
Org Chart
Employee Personality Distribution Chart Template for PowerPoint & Google Slides
Bar/Column
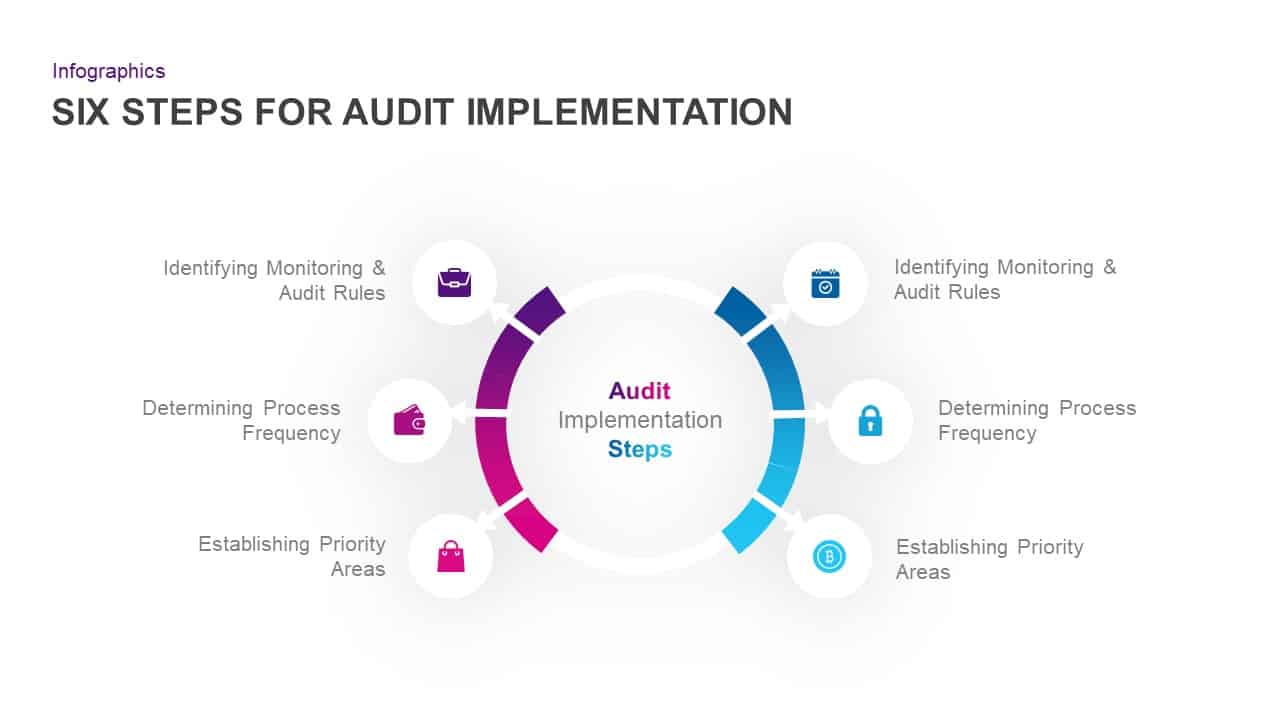
Six-Step Audit Implementation Chart Template for PowerPoint & Google Slides
Circular
Business Growth Metaphor Chart Template for PowerPoint & Google Slides
Business
30-60-90 Day Donut Chart Plan Infographic Template for PowerPoint & Google Slides
Timeline
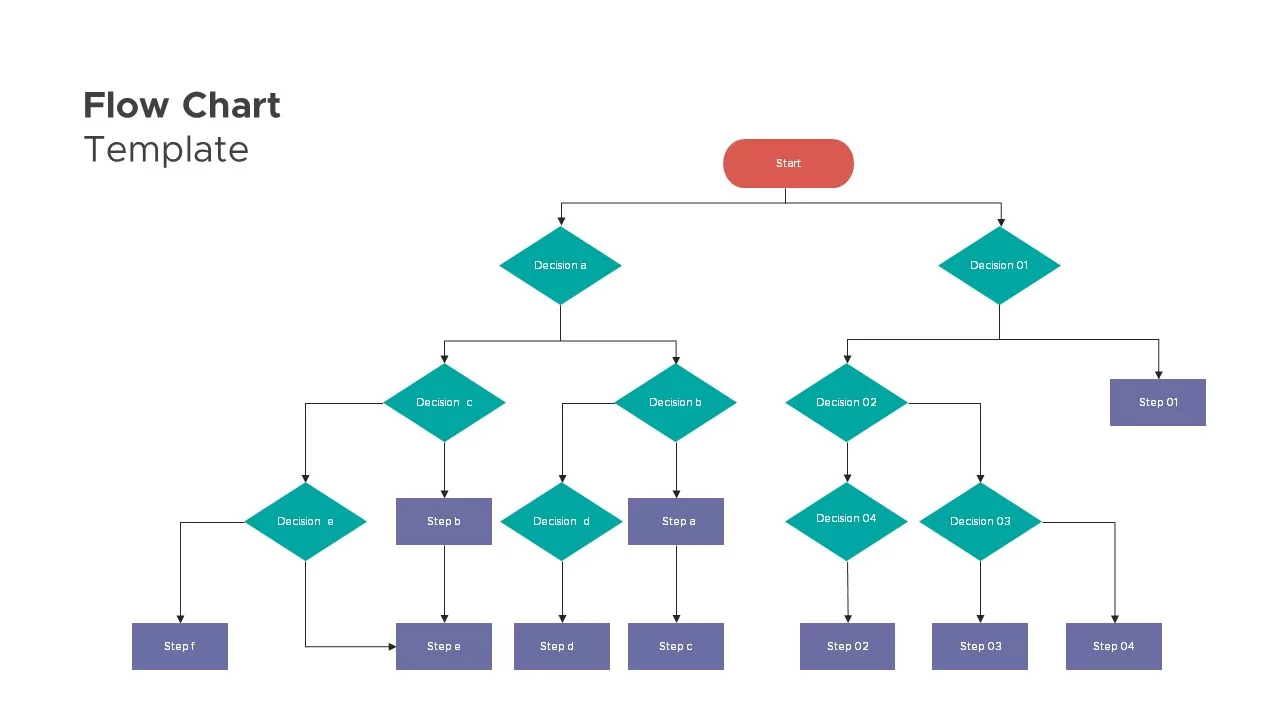
Flow Chart Decision Tree Template for PowerPoint & Google Slides
Flow Charts
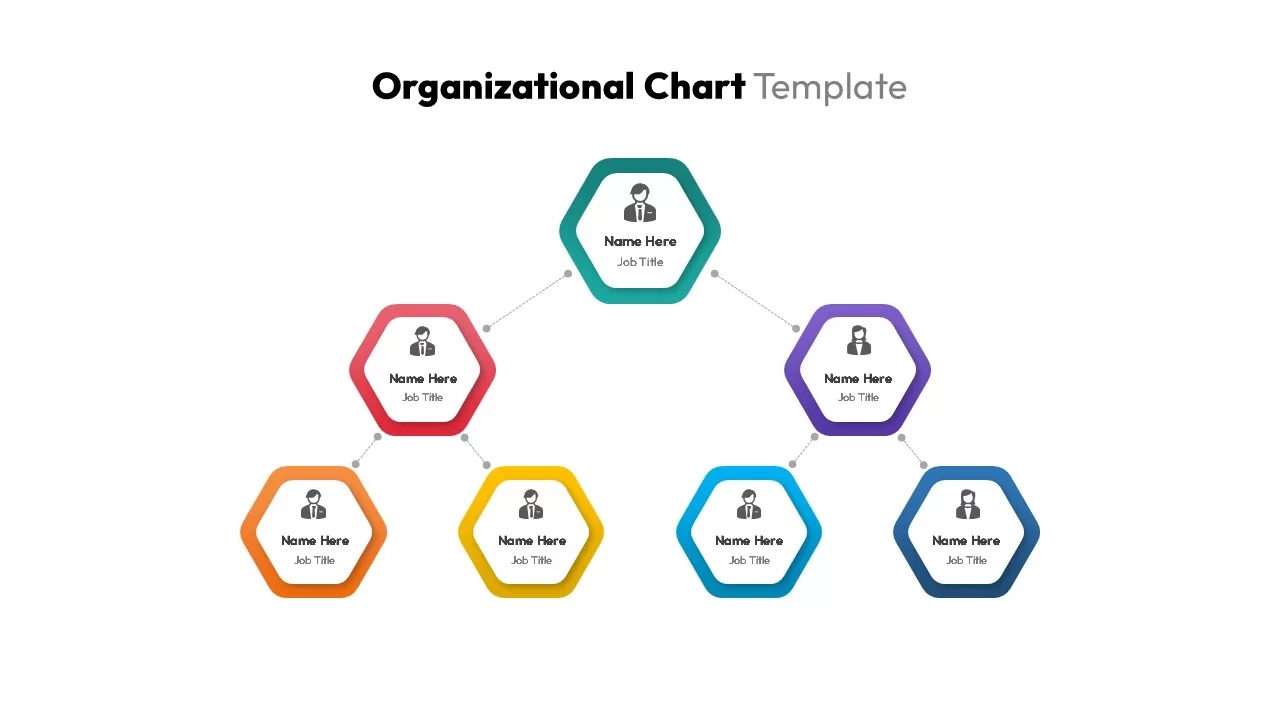
Organizational Chart Template for PowerPoint & Google Slides
Our Team
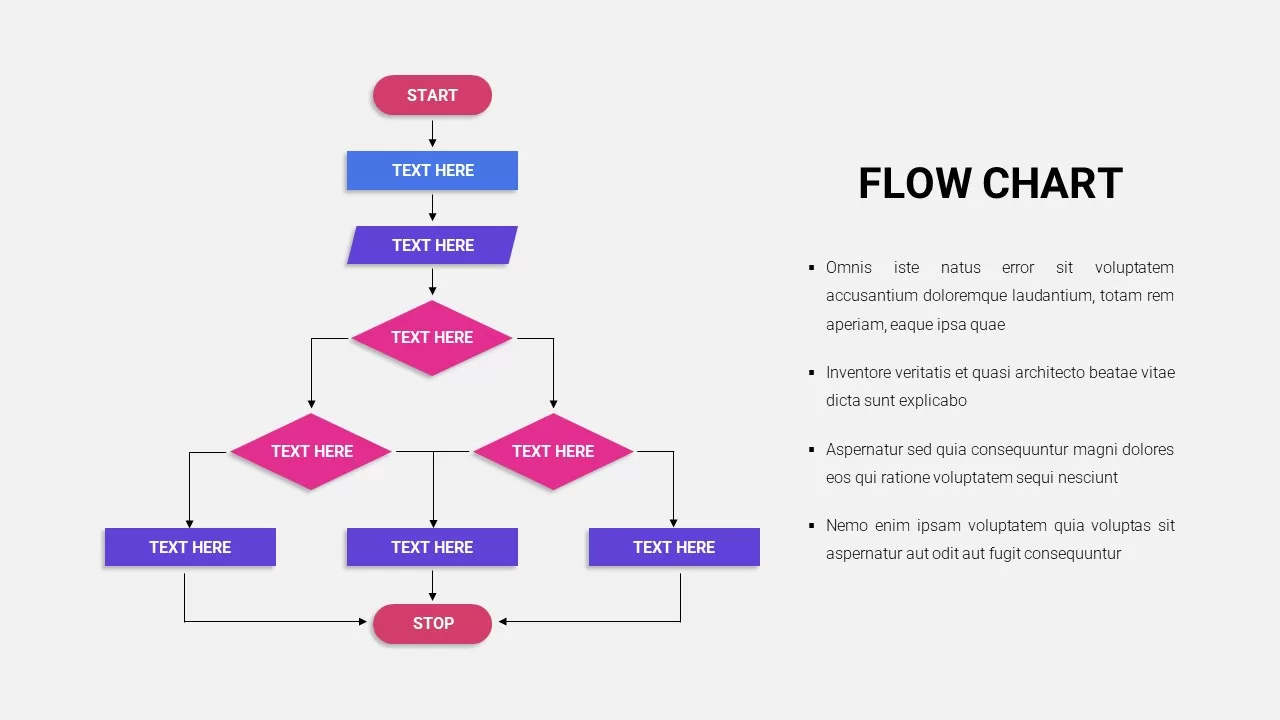
Flow Chart Template for PowerPoint & Google Slides
Flow Charts
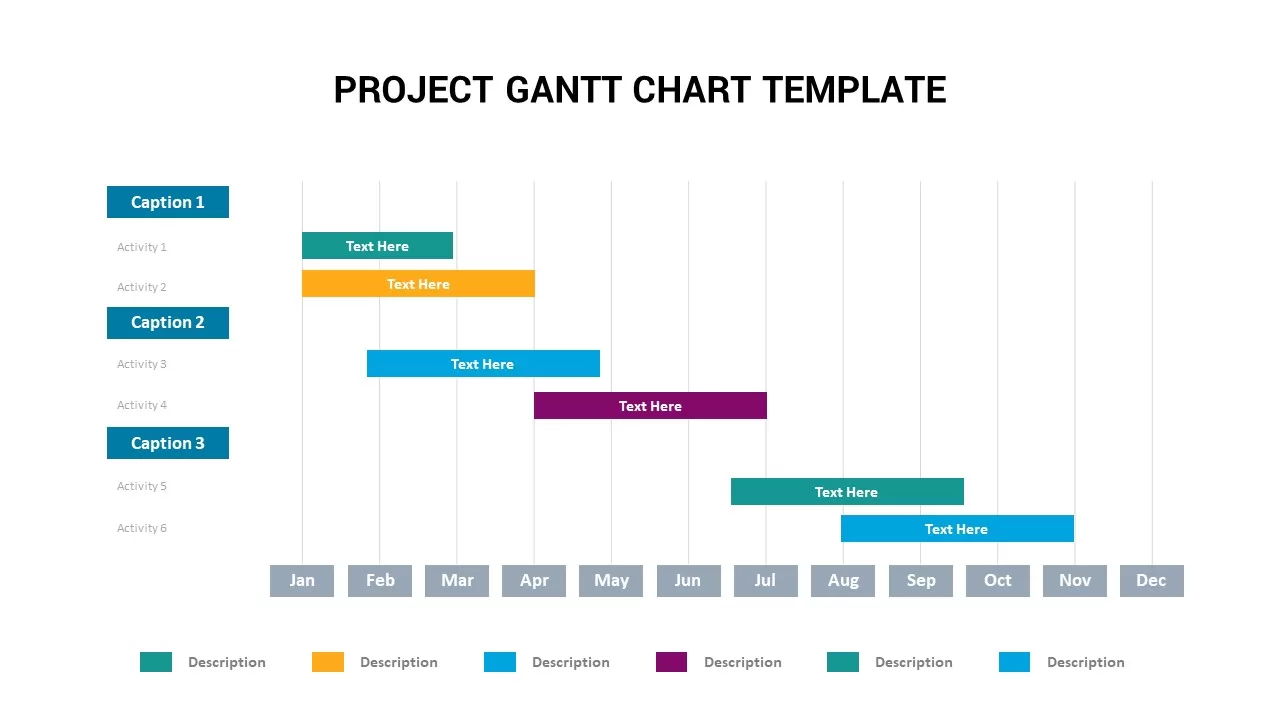
Annual Project Gantt Chart Template PPT
Gantt Chart
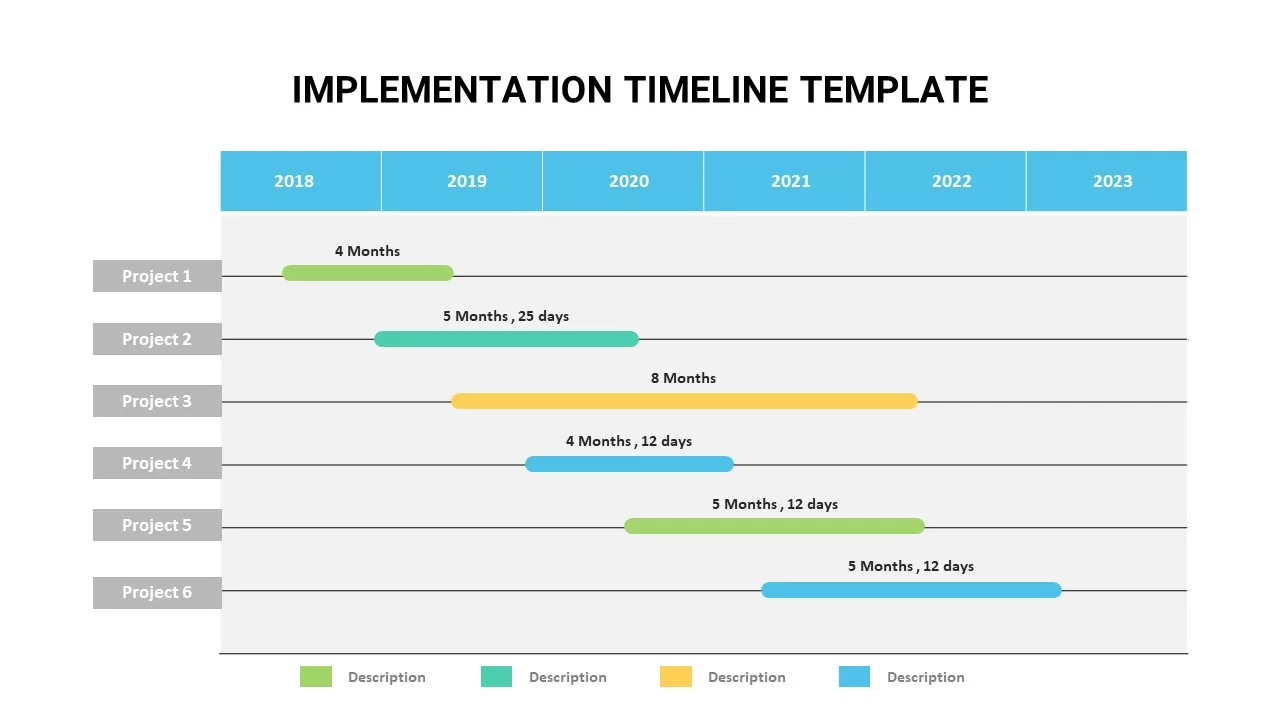
Animated Implementation Timeline Chart Template for PowerPoint & Google Slides
Timeline
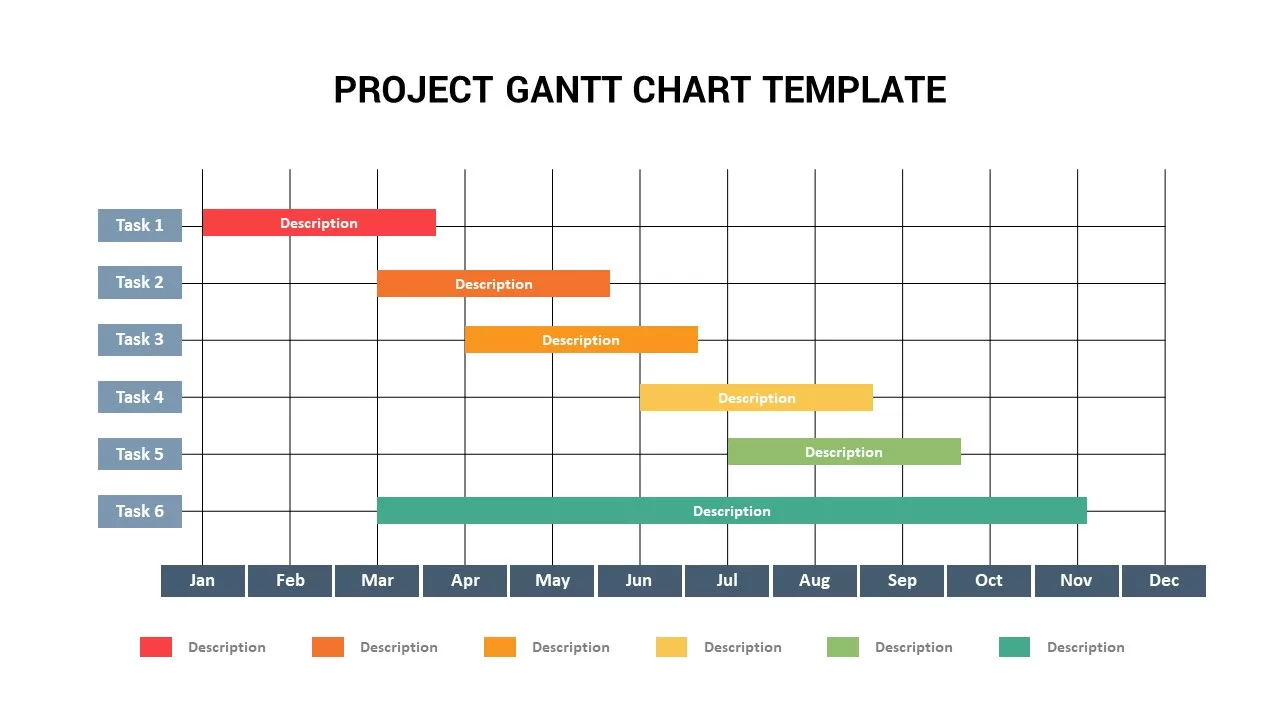
Project Gantt Chart Template for PowerPoint & Google Slides
Gantt Chart
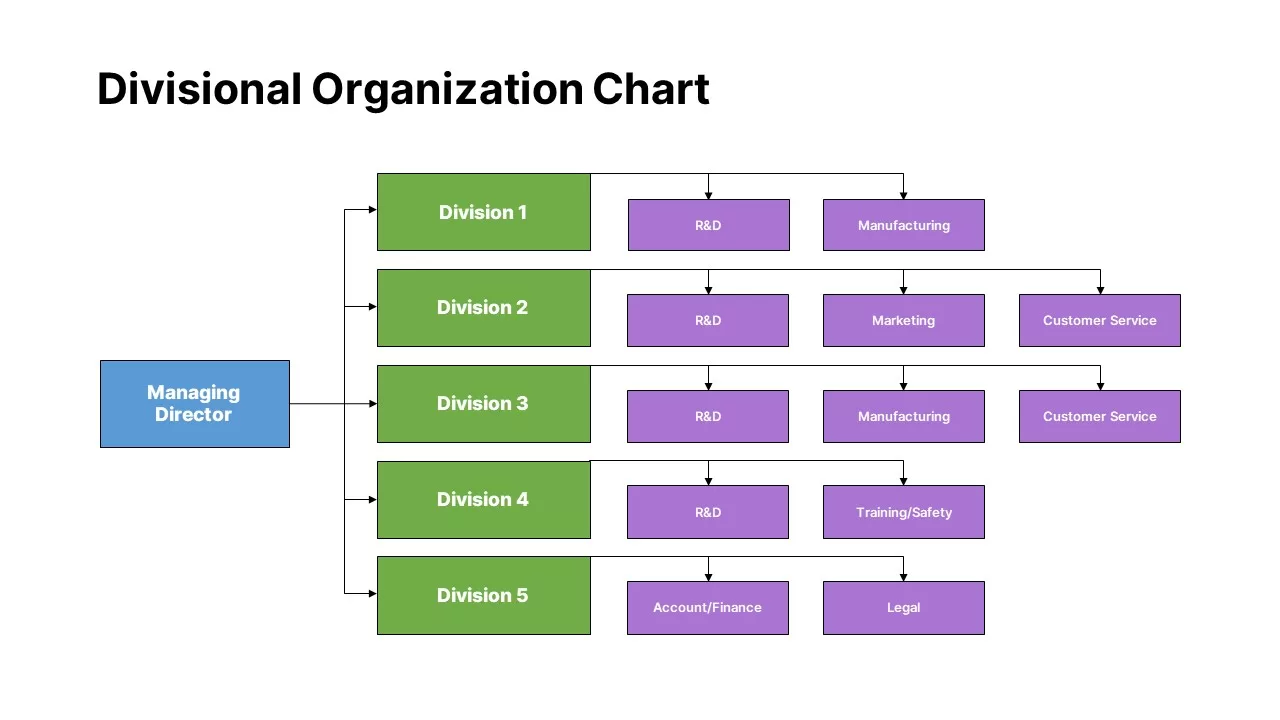
Divisional Organization Chart Template for PowerPoint & Google Slides
Org Chart
3D pie chart infographic template for PowerPoint & Google Slides
Pie/Donut
XY Bubble Chart Data Visualization Template for PowerPoint & Google Slides
Comparison Chart
Simple Area Chart Data Trends Analysis Template for PowerPoint & Google Slides
Comparison Chart
Timeline Comparison Slide PowerPoint Template
Comparison Chart
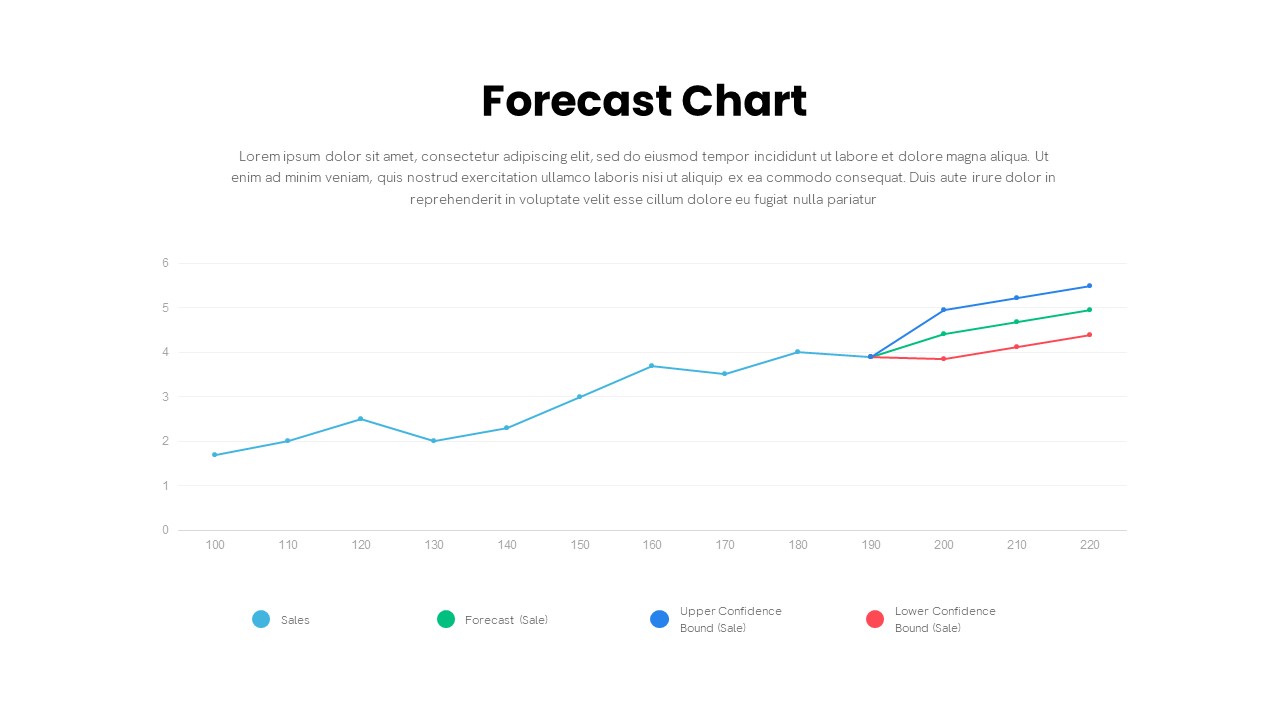
Forecast Chart with Confidence Bounds Template for PowerPoint & Google Slides
Comparison Chart
Growth Curve Line Chart Visualization Template for PowerPoint & Google Slides
Charts
Grouped Column Chart Comparison Template for PowerPoint & Google Slides
Bar/Column
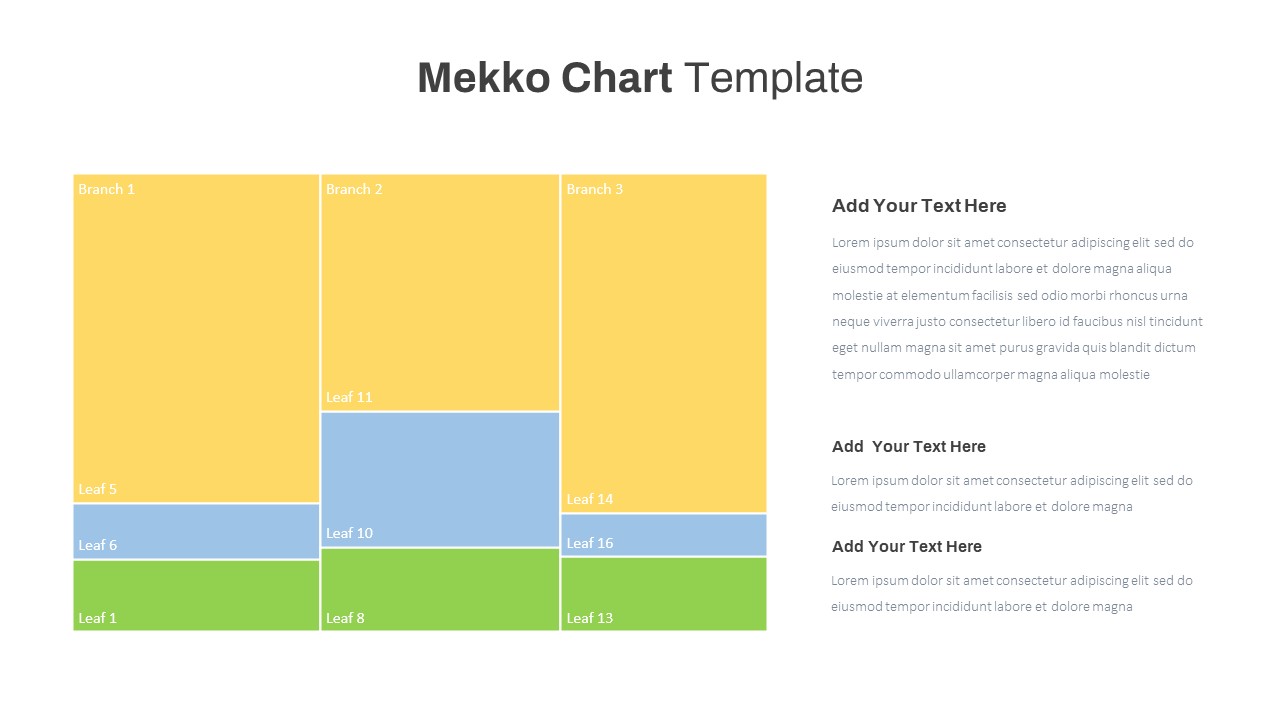
Mekko Chart with Segmented Branches & Leaves Template for PowerPoint & Google Slides
Bar/Column
Rectangle Area Chart with Gradient Fill Template for PowerPoint & Google Slides
Comparison Chart
Multi-Series Line Chart with Icons Template for PowerPoint & Google Slides
Comparison Chart
Multi-Series Vertical Dot Chart Template for PowerPoint & Google Slides
Comparison Chart
Free Learning Retention Pyramid Chart Template for PowerPoint & Google Slides
Pyramid
Free
Milestone Chart PowerPoint
Timeline
Multipurpose Spline Chart Data Trend Template for PowerPoint & Google Slides
Bar/Column
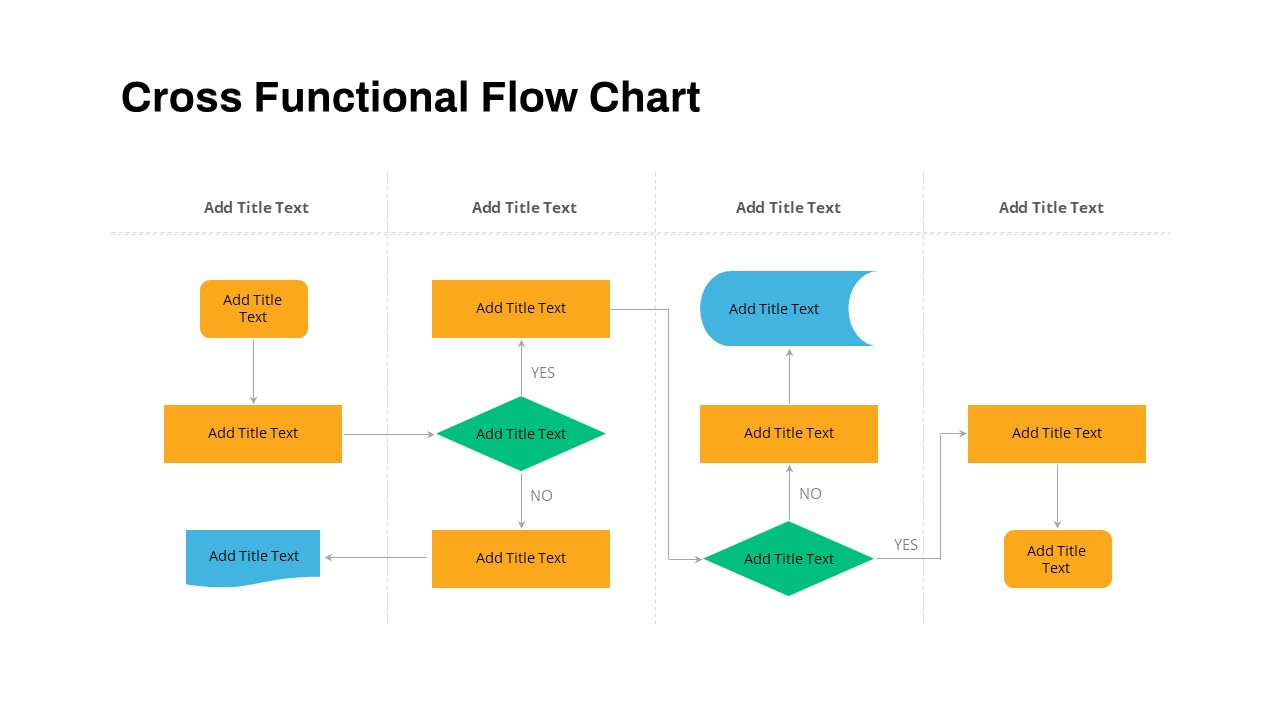
Cross Functional Swimlane Flow Chart Template for PowerPoint & Google Slides
Flow Charts
HR Org Chart PowerPoint Template
Org Chart
Wastewater Treatment Process Flow Chart Template for PowerPoint & Google Slides
Flow Charts
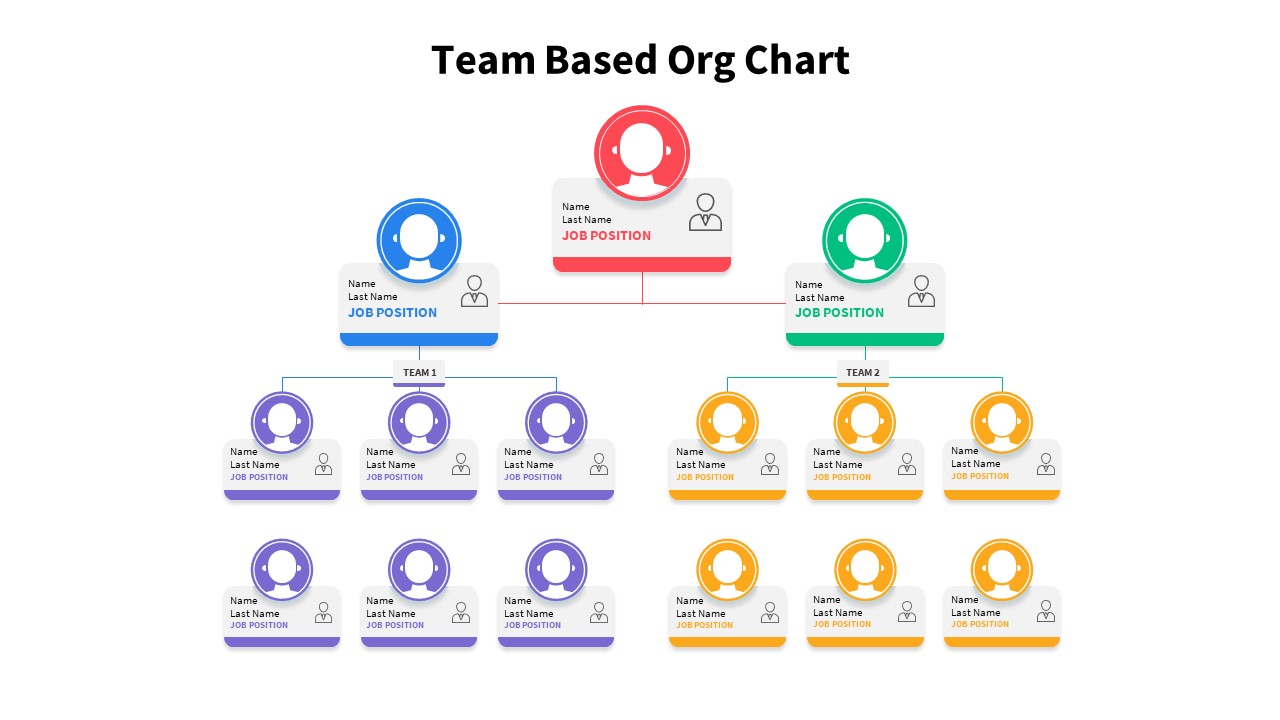
Team-Based Organizational Chart Template for PowerPoint & Google Slides
Org Chart
Dynamic Sunburst Chart Visualization Template for PowerPoint & Google Slides
Charts
Multi-Level Colorful Pyramid Chart Template for PowerPoint & Google Slides
Pyramid
Free Corporate Hierarchy Organizational Chart Template for PowerPoint & Google Slides
Org Chart
Free
ESG Initiatives Comparison Chart Template for PowerPoint & Google Slides
Business
Annual Growth Trend Analysis Chart template for PowerPoint & Google Slides
Business Report
Quarterly Sales Review Bar Chart Template for PowerPoint & Google Slides
Bar/Column
Data Analysis Bar Chart with Insights Template for PowerPoint & Google Slides
Bar/Column
Free
Horizontal Bar Chart Slide with Icons Template for PowerPoint & Google Slides
Bar/Column
Project Tracker Timeline Gantt Chart Template for PowerPoint & Google Slides
Project Status
Competitor Comparison Chart Design Template for PowerPoint & Google Slides
Comparison
Profile Comparison Chart template for PowerPoint & Google Slides
Comparison Chart
Technical Skills Donut Chart Overview Template for PowerPoint & Google Slides
HR
Feasibility Matrix Comparison Chart Template for PowerPoint & Google Slides
Comparison Chart
Team Gantt Chart Overview template for PowerPoint & Google Slides
Project Status
Stacked Gantt Chart Timeline Slide Template for PowerPoint & Google Slides
Gantt Chart
Attribution Modeling Flow Chart Template for PowerPoint & Google Slides
Flow Charts
Static Gantt Chart Overview template for PowerPoint & Google Slides
Project Status
Disaster Response Role Matrix RACI Chart Template for PowerPoint & Google Slides
Project Status
Hierarchical Org Chart Infographic Template for PowerPoint & Google Slides
Org Chart
USA Map with Bar Chart Template for PowerPoint & Google Slides
World Maps
Colorful Annual Gantt Chart Project Planner Template for PowerPoint & Google Slides
Gantt Chart
Weekly Gantt Chart with Milestones Template for PowerPoint & Google Slides
Gantt Chart
Colorful Annual Gantt Chart Timeline Template for PowerPoint & Google Slides
Gantt Chart

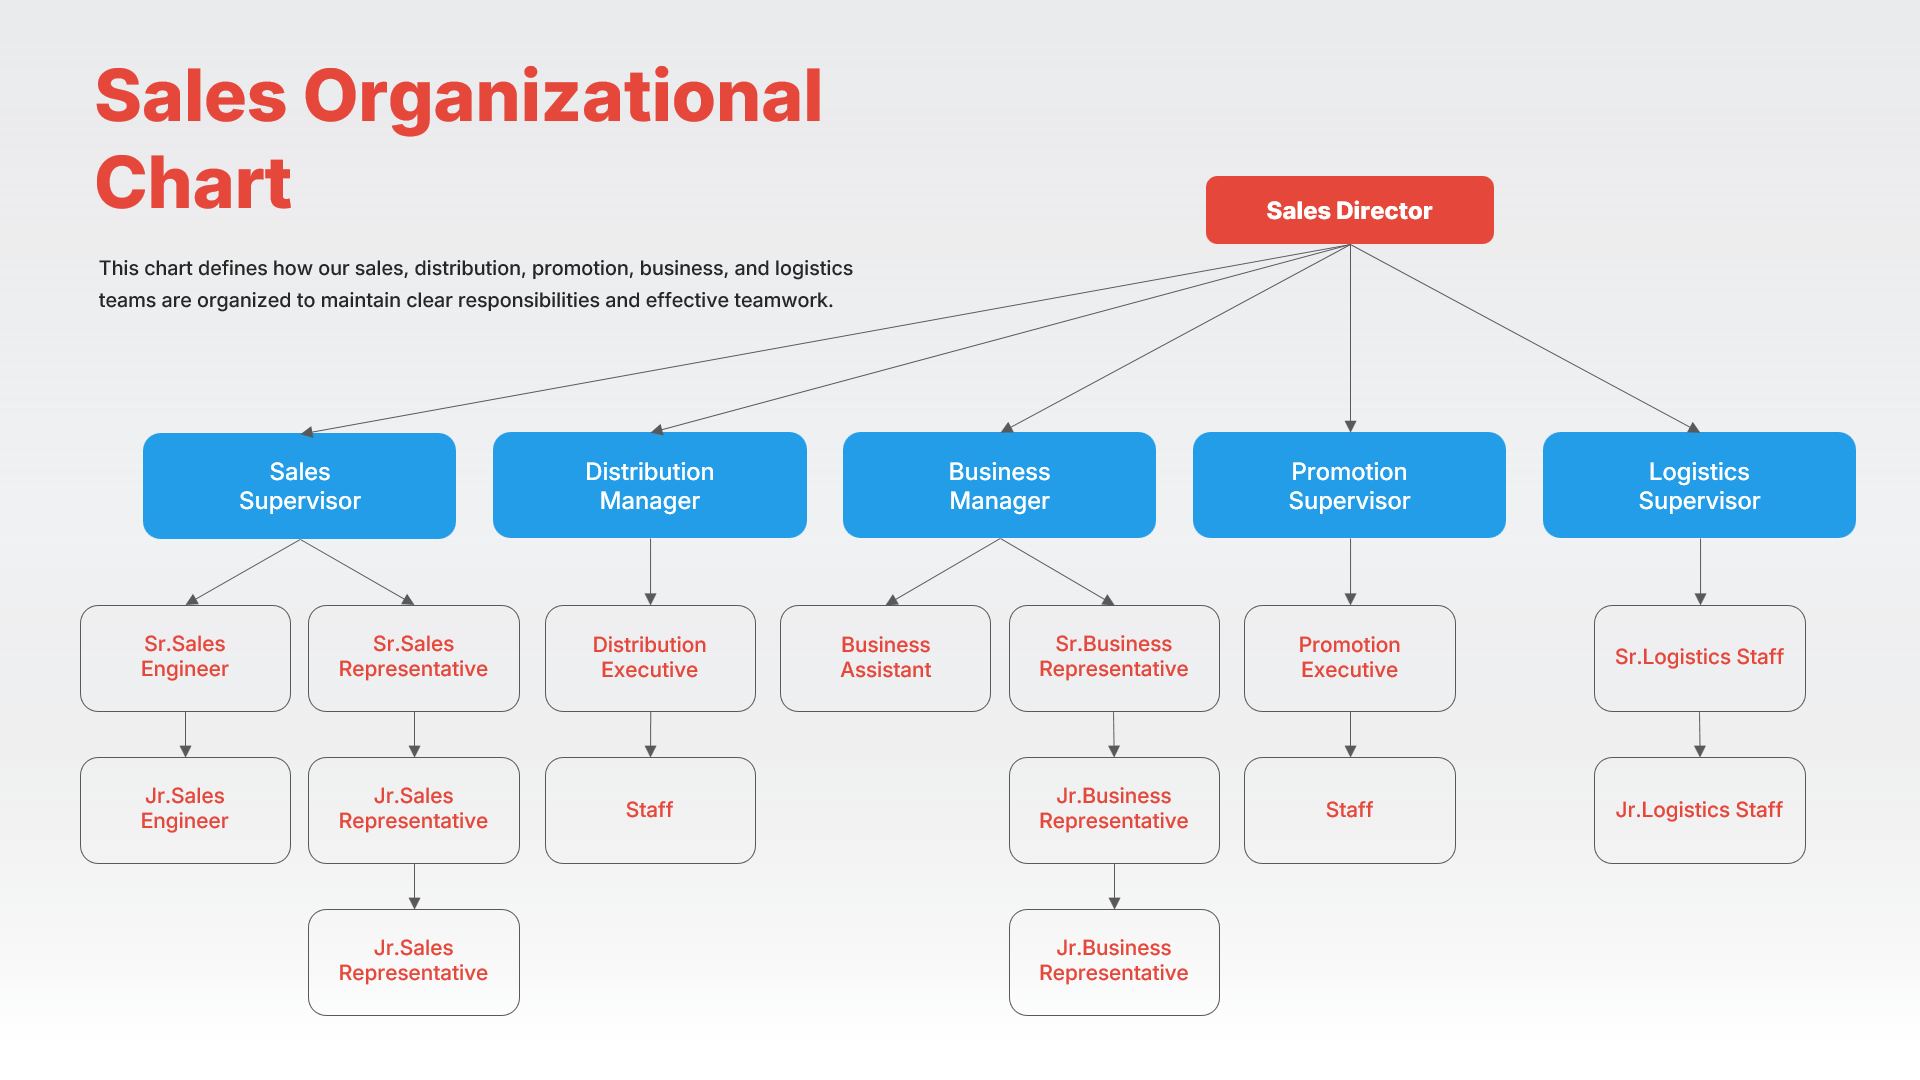
Sales Organizational Chart Hierarchy Template for PowerPoint & Google Slides
Org Chart
Blank Comparison Chart Template for PowerPoint & Google Slides
Comparison Chart
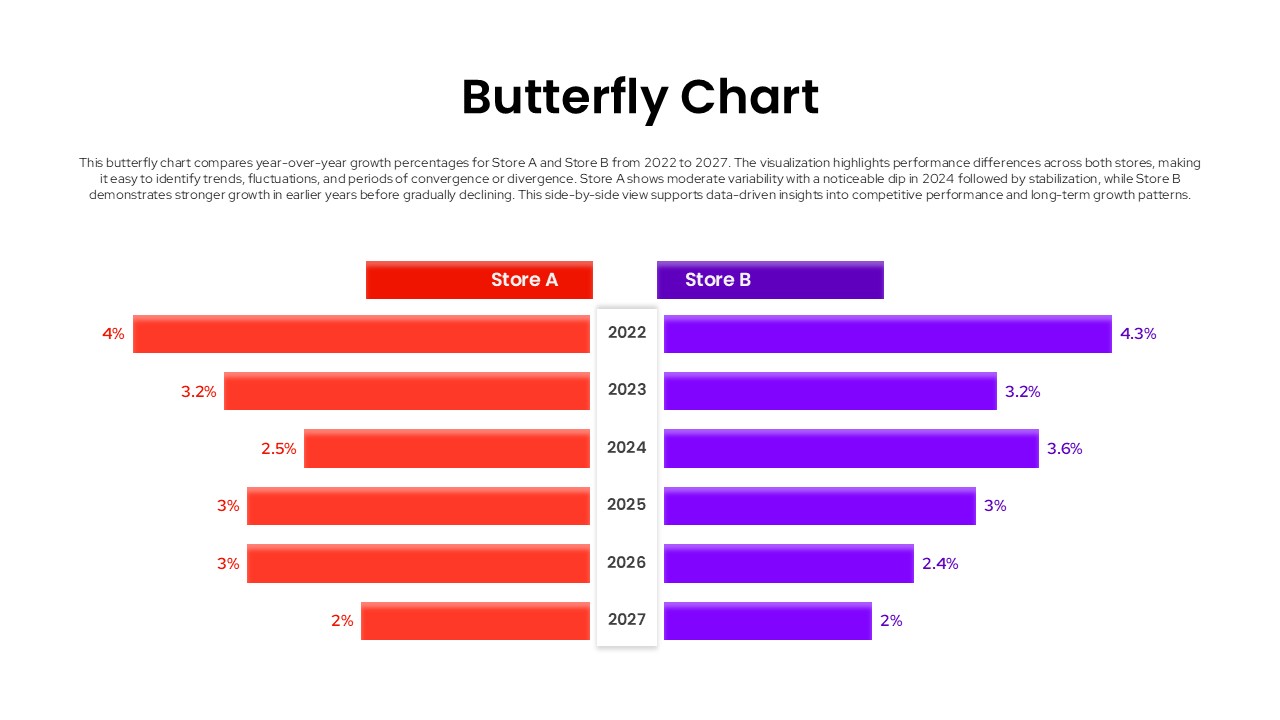
Butterfly Chart Template for PowerPoint & Google Slides Presentations
Comparison Chart