Project Management Dashboard Template for PowerPoint & Google Slides

Description
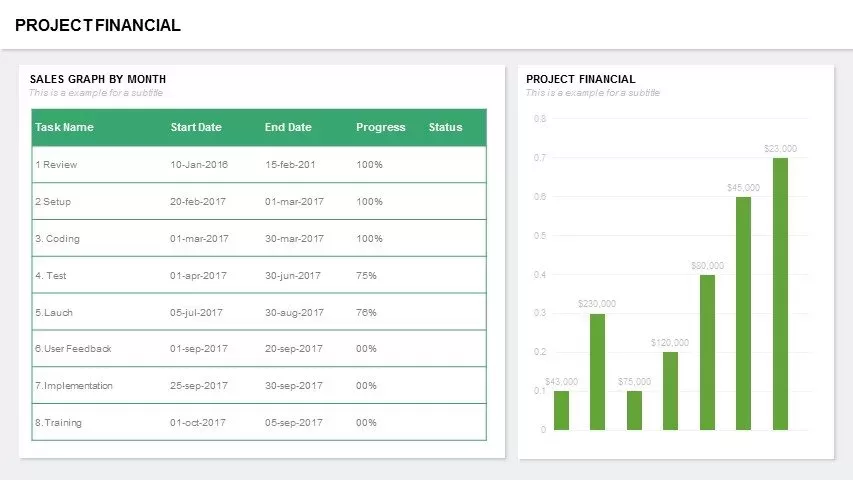
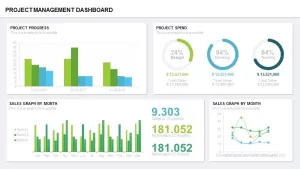
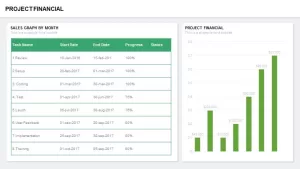
This fully editable project management dashboard slide presents key KPIs and performance metrics in a single, cohesive view. The top left quadrant features a clustered bar chart to track project progress over time, while the top right displays three radial gauges for design, development, and testing spend percentages. Below, a detailed monthly sales bar graph and summary metrics highlight revenue and referral trends, and a line chart in the bottom right visualizes sales performance across intervals. Each chart is built with editable data placeholders and master-slide vector shapes, allowing you to update numbers, adjust colors, or swap chart types in seconds.
With a neutral background and clean sans-serif typography, this dashboard ensures maximum readability and professional polish. Preconfigured animations sequentially reveal each widget to guide audience focus, and seamless compatibility with PowerPoint and Google Slides preserves pixel-perfect clarity across devices. Whether for executive briefings, stakeholder updates, or team performance reviews, this slide streamlines reporting and empowers data-driven decision-making.
Who is it for
Project managers, PMOs, and senior leaders will benefit from this dashboard when monitoring project health, budget allocation, and sales outcomes. Finance teams, product owners, and consultants can also leverage it to present consolidated metrics in client pitches and board meetings.
Other Uses
Repurpose this template for marketing performance dashboards, operational scorecards, quarterly business reviews, or portfolio summaries. Simply update chart data, relabel metrics, and recolor elements to create tailored, high-impact reports.
Login to download this file

Item ID
SB00666
Related Templates

Project Status Dashboard Table Template for PowerPoint & Google Slides
Project Status
Project Status Dashboard with Metrics Template for PowerPoint & Google Slides
Project Status
Colorful Project Status Dashboard Template for PowerPoint & Google Slides
Project Status
Project Status Dashboard Template for PowerPoint & Google Slides
Project Status
One Pager Project Status Dashboard Template for PowerPoint & Google Slides
Project Status
Project Progress Dashboard Pie Charts Template for PowerPoint & Google Slides
Project
Project Tracking Dashboard Table Template for PowerPoint & Google Slides
Project Status
Project Status Dashboard Report Template for PowerPoint & Google Slides
Project Status
Project Status Update Dashboard Table Template for PowerPoint & Google Slides
Project Status
Project Status Dashboard Template for PowerPoint & Google Slides
Project Status
Dashboard Project Status Template for PowerPoint & Google Slides
Project Status
Project Status Template Dashboard with Gauge for PowerPoint & Google Slides
Project Status
Project Status Dashboard with RAG Legend Template for PowerPoint & Google Slides
Project Status
Construction Project Dashboard Template for PowerPoint & Google Slides
Project
Inventory Management Dashboard Template for PowerPoint & Google Slides
Process
Action Items Management Dashboard Table Template for PowerPoint & Google Slides
Project Status

Free Project Dashboard PowerPoint Template
Charts
Free

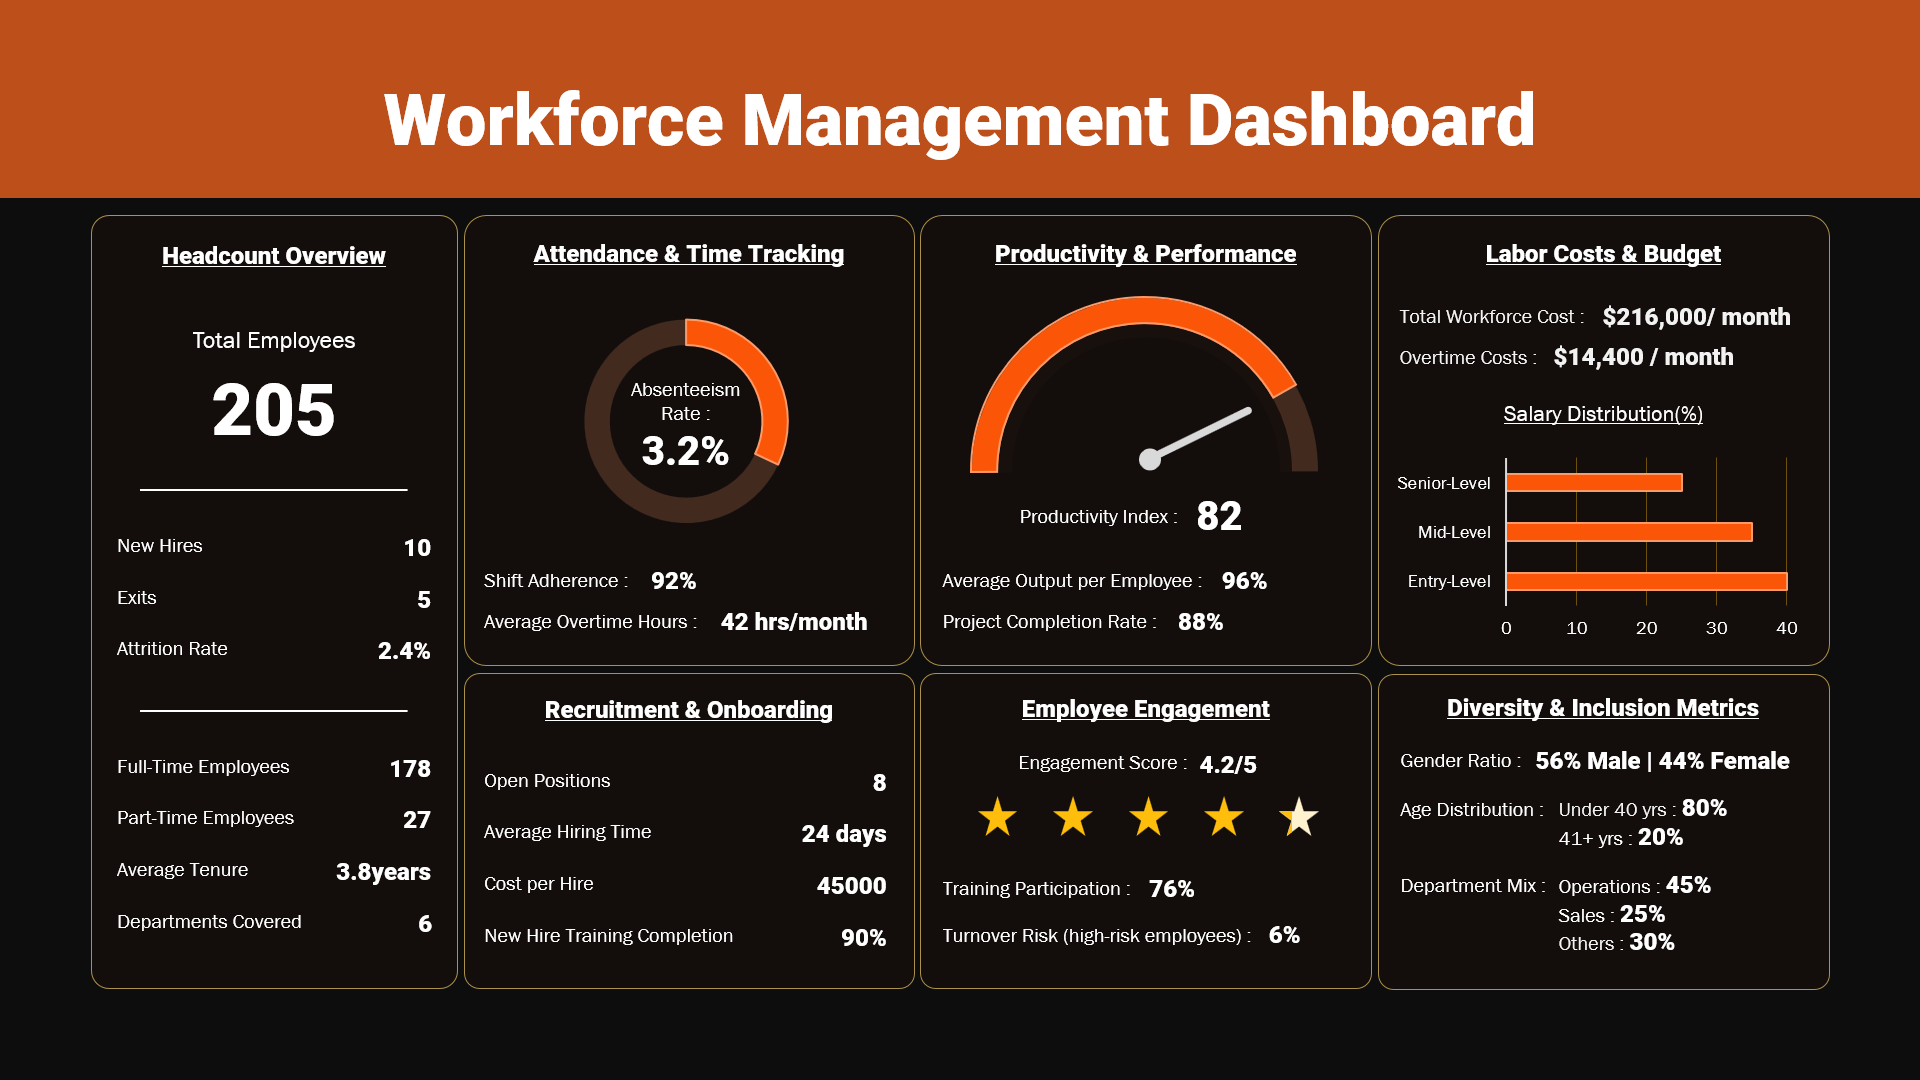
Editable Workforce Management Dashboard PowerPoint Template
Dashboard
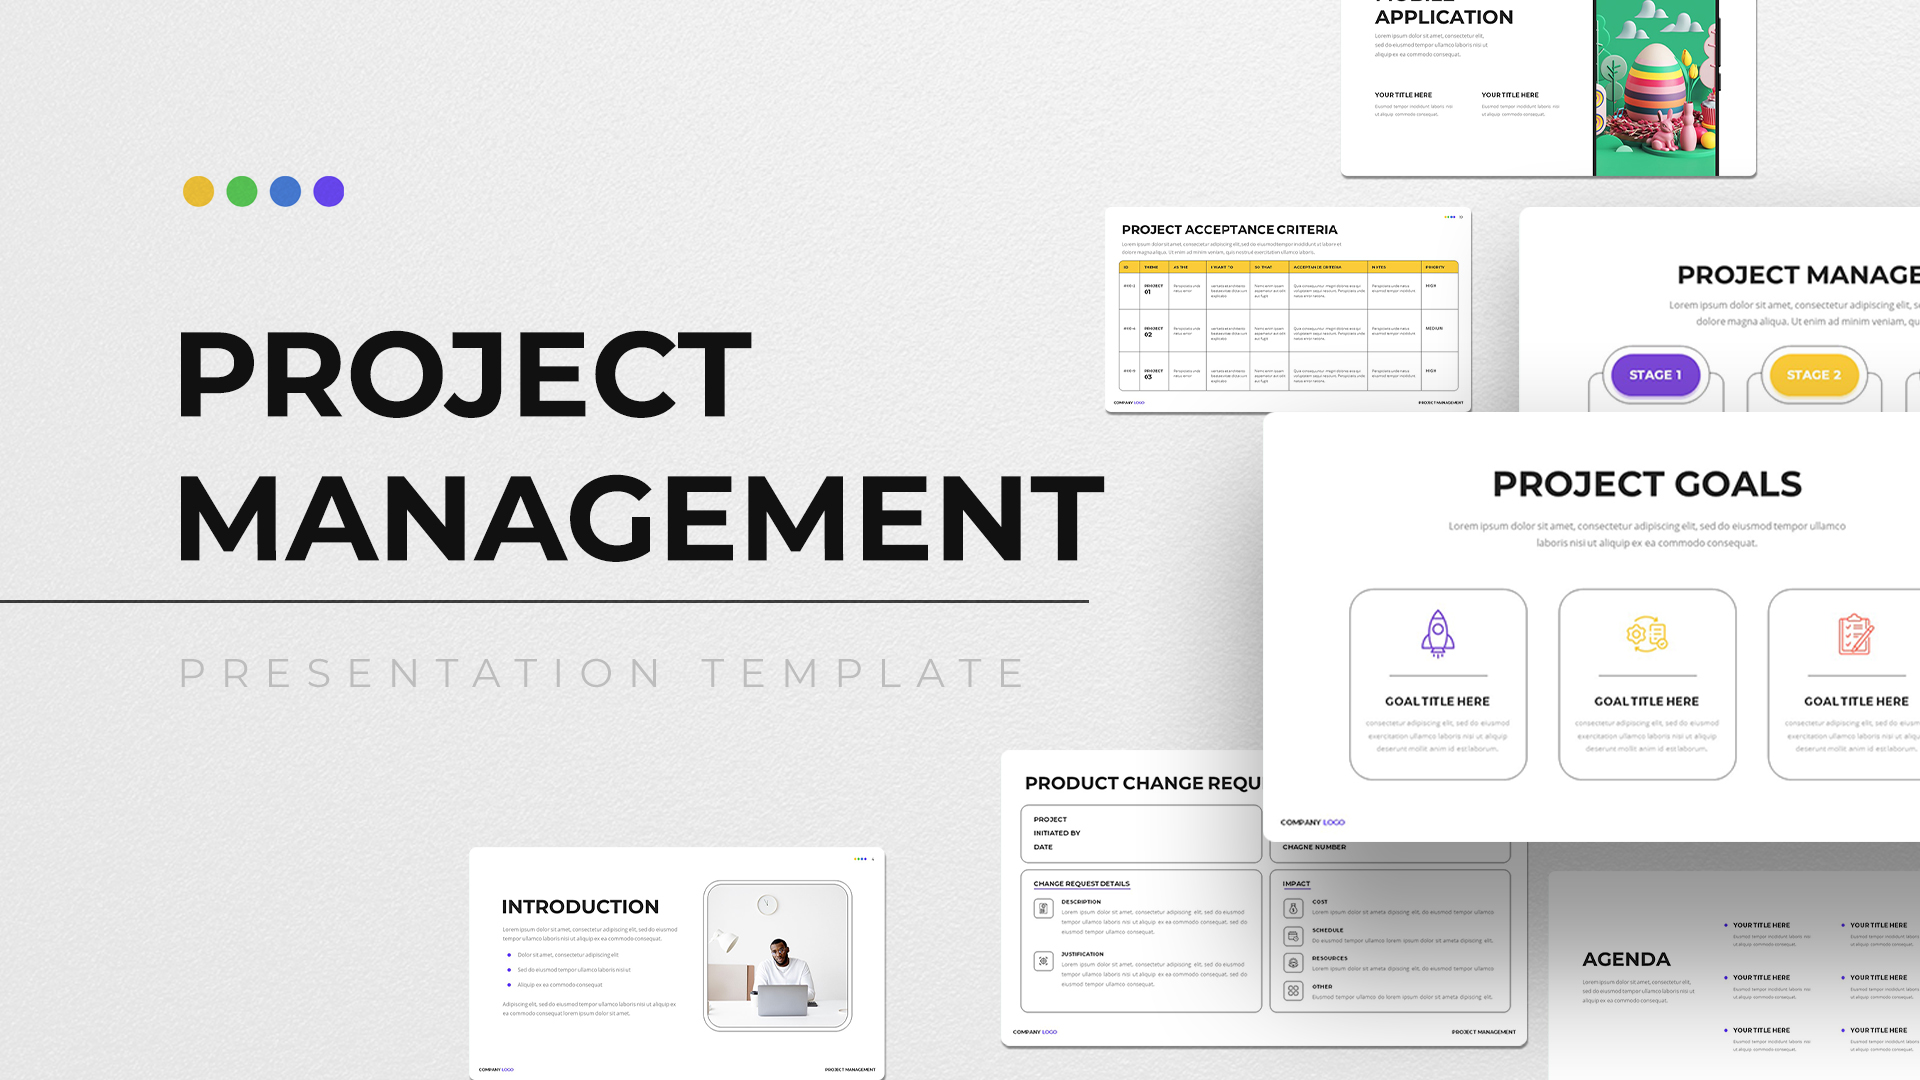
Project Management Deck template for PowerPoint & Google Slides
Project
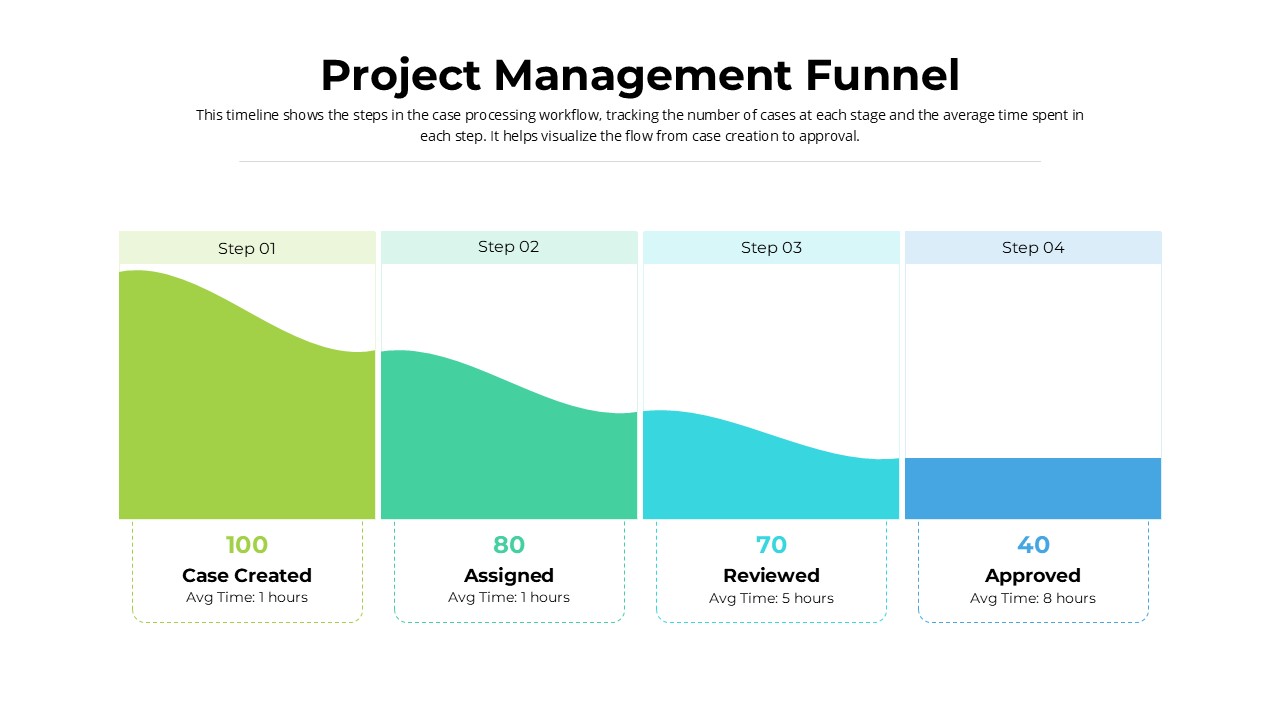
Project Management Funnel Template for PowerPoint & Google Slides
Funnel