Social Media Performance Dashboard Template for PowerPoint & Google Slides


Social Media Dashboard Template for PowerPoint
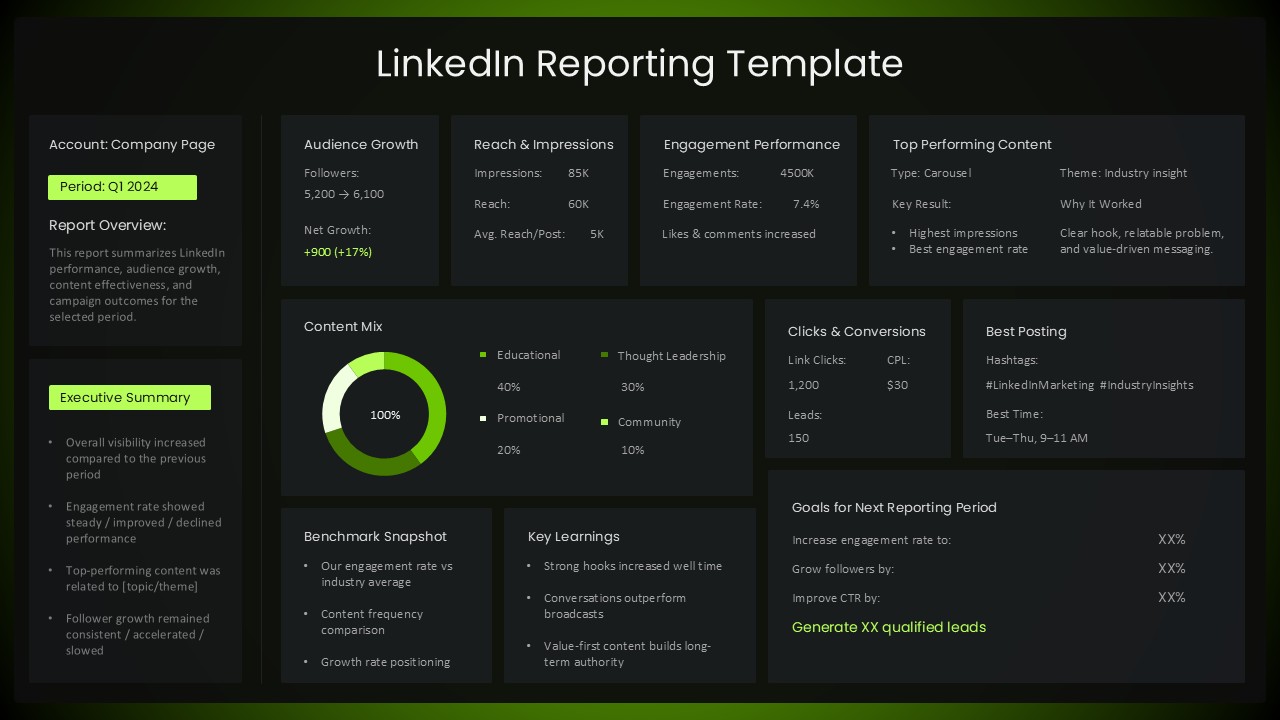
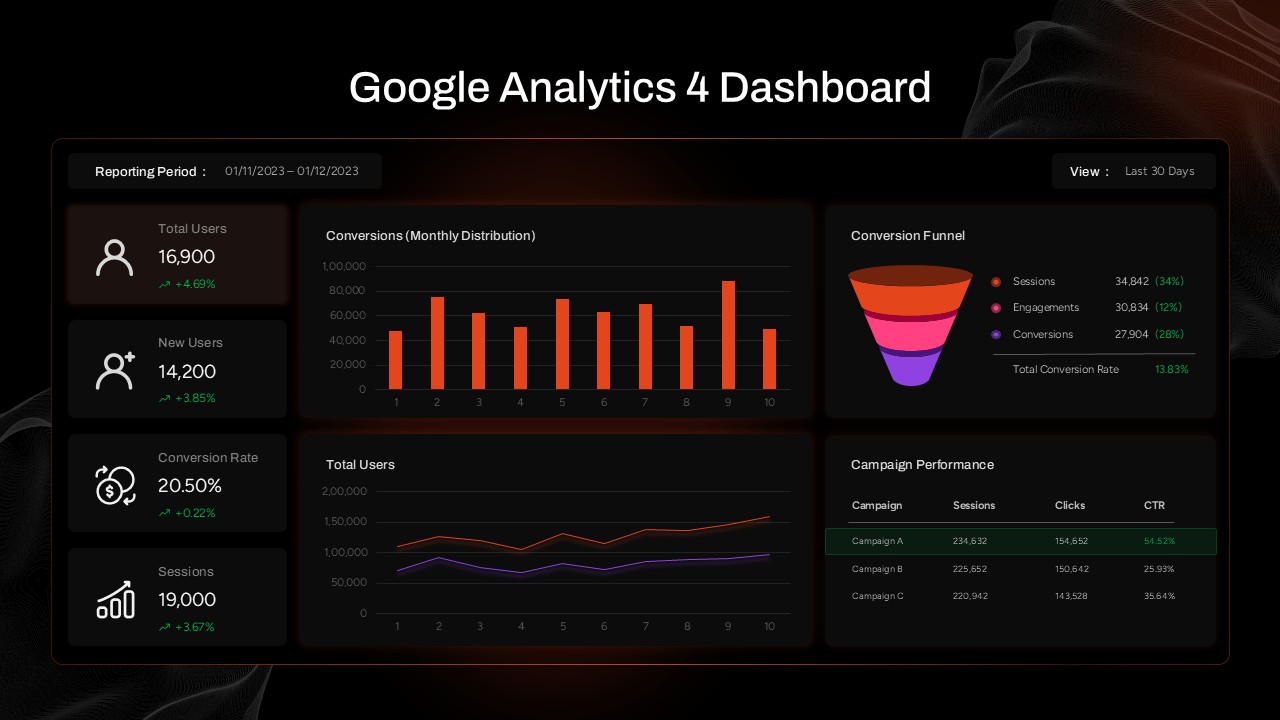
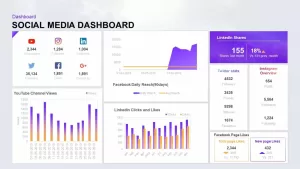
Present key performance indicators and cross-platform metrics in a single, unified view with this comprehensive social media dashboard template for PowerPoint. The clean white canvas houses a structured grid of metric panels covering the most important social platforms and engagement data points in one cohesive layout.
The top-left panel displays subscriber and follower counts with YouTube, Instagram, LinkedIn, Twitter, Facebook, and Google+ icons for quick platform identification. The top-center features a 90-day Facebook daily reach area chart with contrasting purple and gold series, while the bottom-left shows YouTube channel views over time via a dual-tone bar chart. The bottom-center presents LinkedIn clicks and likes in a side-by-side bar chart for direct comparison. On the right, a gradient panel highlights last month’s LinkedIn share count and percent change versus the prior period, followed by stacked summary panels for Twitter follower and friend counts alongside Instagram post and follower totals. A footer panel rounds out the layout by comparing Facebook total page likes and new likes with directional indicators.
A Fully Editable Social Media Dashboard Slide for PowerPoint and Google Slides
Every element in this social media dashboard template is vector-based and built on master layouts for effortless customization in both PowerPoint and Google Slides. Swap icons, update colors via the theme palette, or adjust data ranges without disrupting alignment across the layout. Each chart and metric panel is grouped and labeled, enabling drag-and-drop repositioning and resizing to suit your reporting needs. Preconfigured slide-in animations allow you to reveal KPI sets or chart series sequentially, guiding audience focus through your narrative in a structured and engaging way.
Theme colors, font styles, and data placeholders are organized within the master slide, meaning branding updates and content revisions take minutes rather than hours. The balanced composition prevents information overload, while gradient accents and minimalist typography ensure clarity and professionalism across any screen size or device.
Who Is It For
Digital marketers, social media managers, and analytics teams will find this template particularly valuable for reporting cross-platform performance, benchmarking engagement metrics, and informing strategic planning discussions with stakeholders.
Other Uses
Repurpose this dashboard for quarterly marketing reviews, campaign performance summaries, competitive benchmarking, or executive briefings. Update icons and data placeholders to adapt the layout to any multi-metric reporting scenario across platforms or reporting periods.
Login to download this file

Item ID
SB01493
Related Templates

Social Media Analytics PowerPoint Template
Digital Marketing
Social Media Statistics 2023 Dashboard Template for PowerPoint & Google Slides
Comparison

Website Performance Dashboard template for PowerPoint & Google Slides
Charts
Sales Performance Dashboard template for PowerPoint & Google Slides
Business Report
Performance KPI Dashboard Slide Template for PowerPoint & Google Slides
Business Report
Website Performance Monitoring Dashboard Template for PowerPoint & Google Slides
Business Report
DevOps KPI Dashboard Performance Metrics Template for PowerPoint & Google Slides
Software Development
Monthly Sales Performance Dashboard Template for PowerPoint & Google Slides
Charts
Employee Performance Metrics Dashboard Template for PowerPoint & Google Slides
Employee Performance
LinkedIn Performance Reporting Dashboard Template for PowerPoint & Google Slides
Digital Marketing
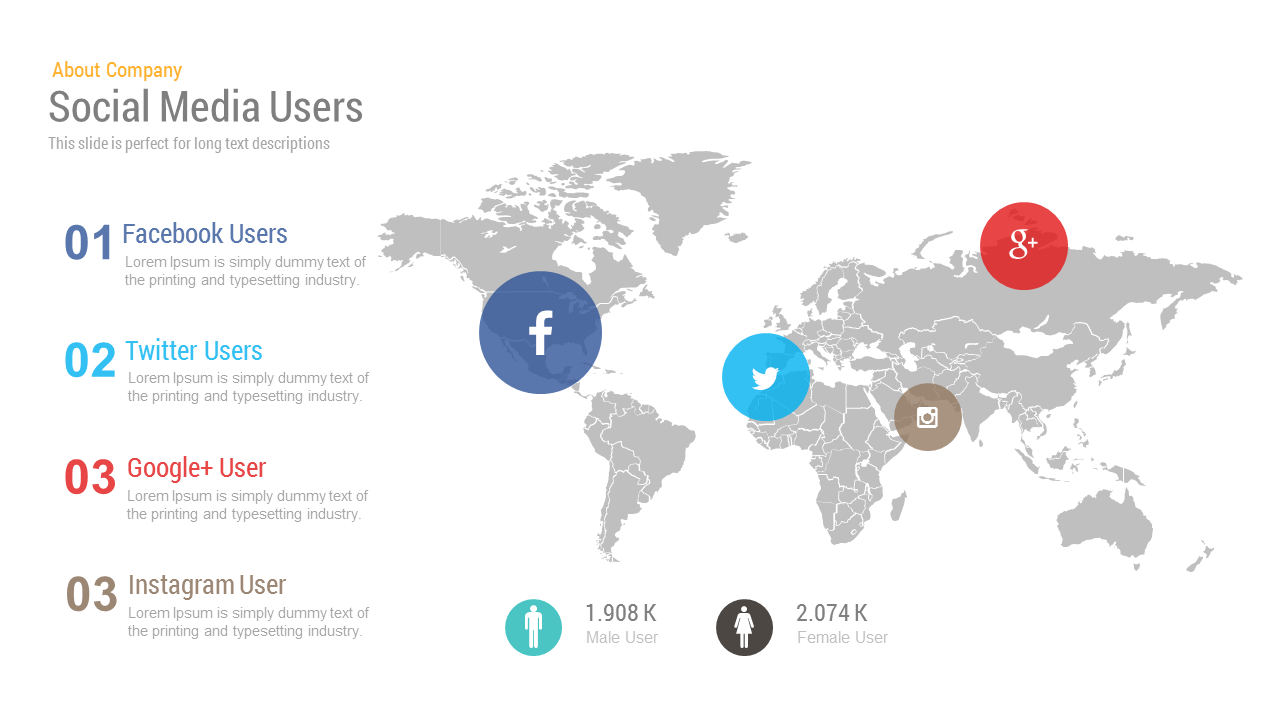
Free Editable Social Media Users Map Template for PowerPoint & Google Slides
World Maps
Free
Social Media Metrics template for PowerPoint & Google Slides
Comparison Chart
Comprehensive Social Media Icons Slide Template for PowerPoint & Google Slides
Advertising

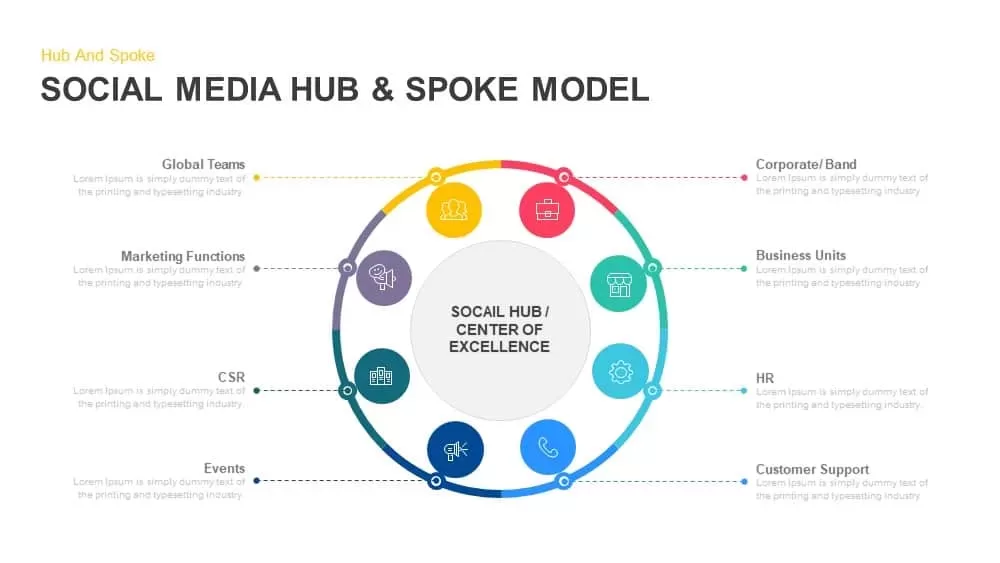
Social Media Hub & Spoke Model Template for PowerPoint & Google Slides
Process
Social Media Market Share Pie Charts Template for PowerPoint & Google Slides
Pie/Donut
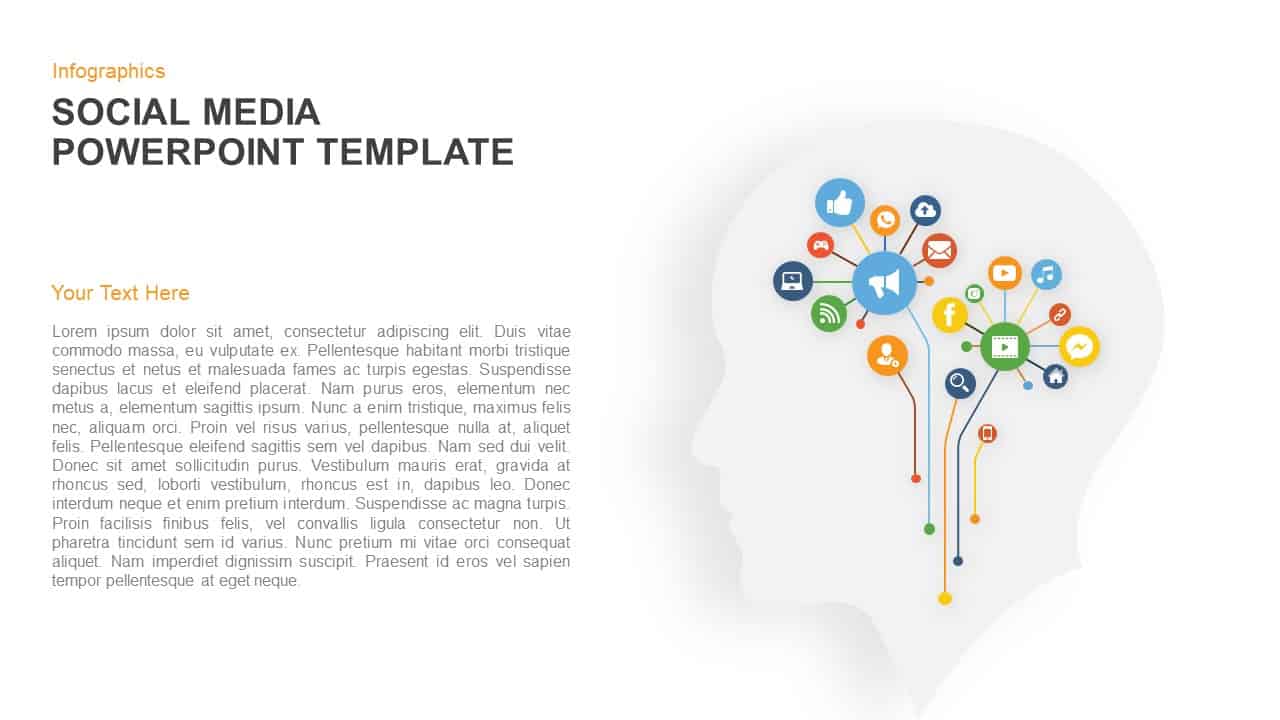
Social Media Mind Network Infographic Template for PowerPoint & Google Slides
Digital Marketing
Social Media Icons for PowerPoint Infographics Presentation
Marketing
Mobile App Social Media Metaphor Template for PowerPoint & Google Slides
Infographics
Social Media Network Infographic Template for PowerPoint & Google Slides
Circular
Social Media Metaphor Illustration Template for PowerPoint & Google Slides
Digital Marketing
Social Media Marketing Tool Template for PowerPoint & Google Slides
Digital Marketing
Free 3D Social Media Icons template for PowerPoint & Google Slides
Digital Marketing
Free
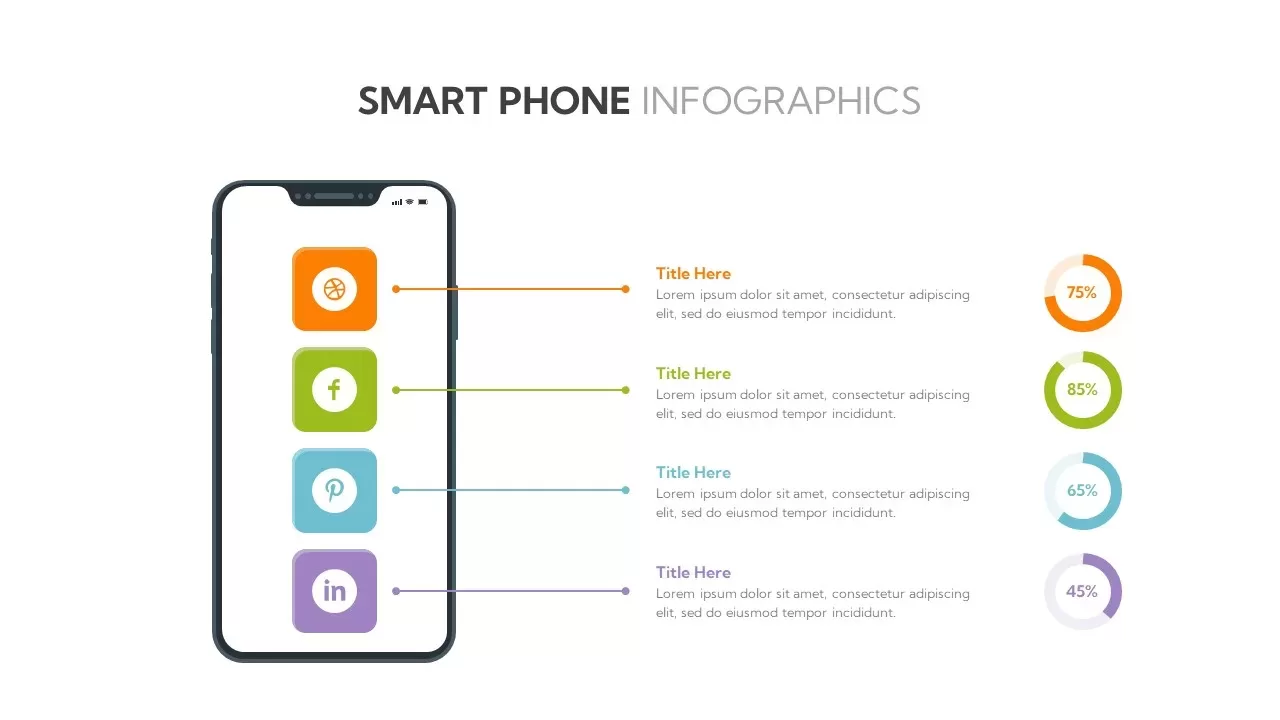
Social Media Smartphone Infographic Template for PowerPoint & Google Slides
Pie/Donut
Popular Social Media Platforms Template
Digital Marketing

Social Media Marketing Agency Pitch Deck Template for PowerPoint & Google Slides
Pitch Deck
Social Media Community Network Slide Template for PowerPoint & Google Slides
Circular
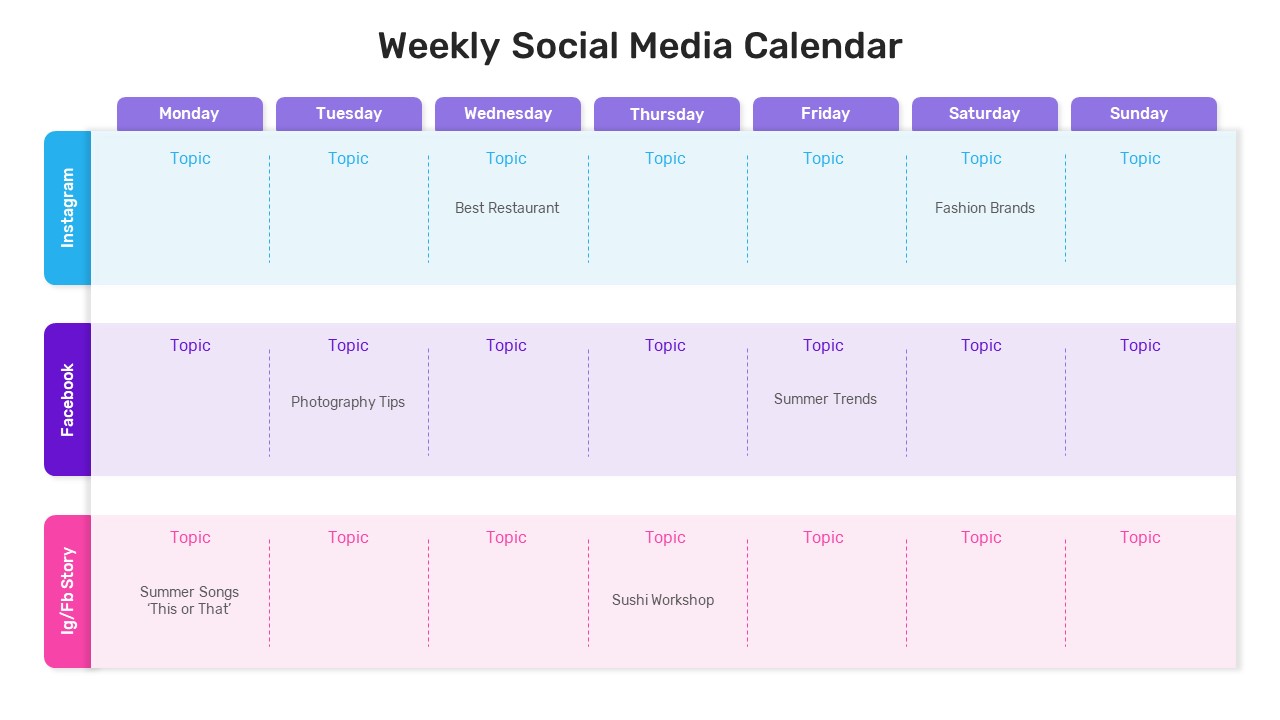
Weekly Social Media Calendar Editable Template
Digital Marketing
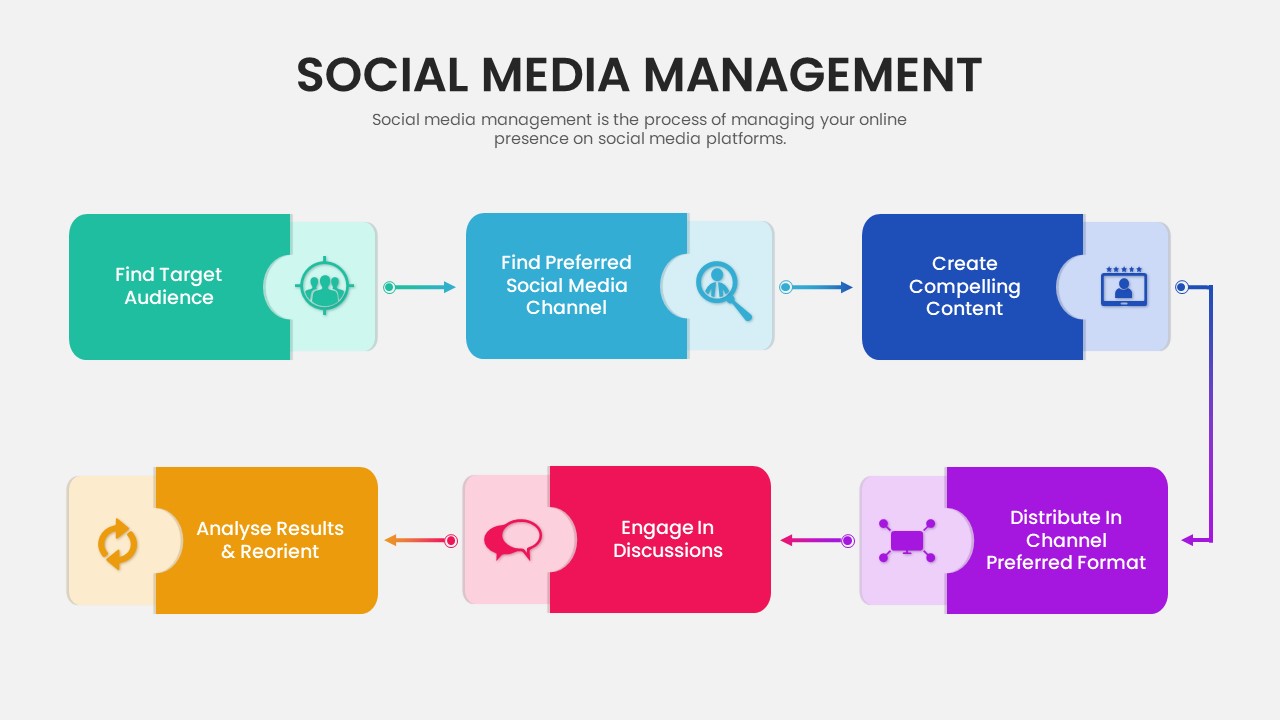
Six-Step Social Media Management Process Template for PowerPoint & Google Slides
Process
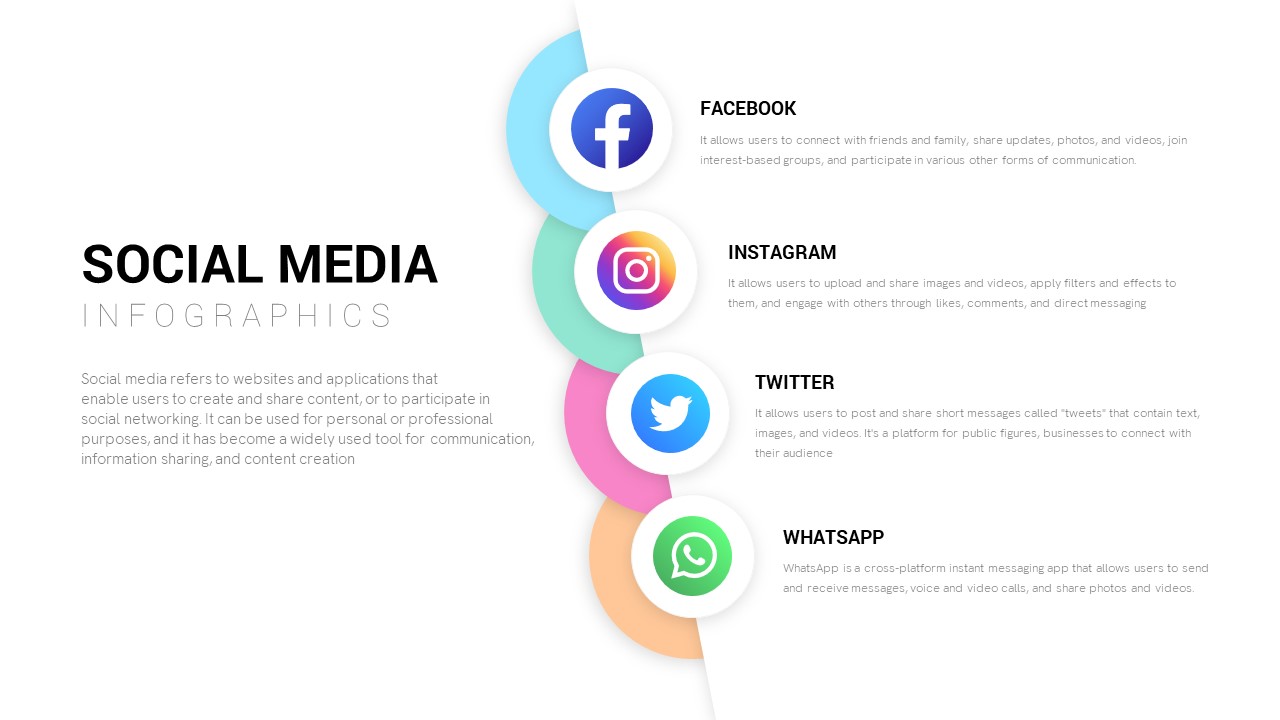
Modern Social Media Infographics Template for PowerPoint & Google Slides
Digital Marketing
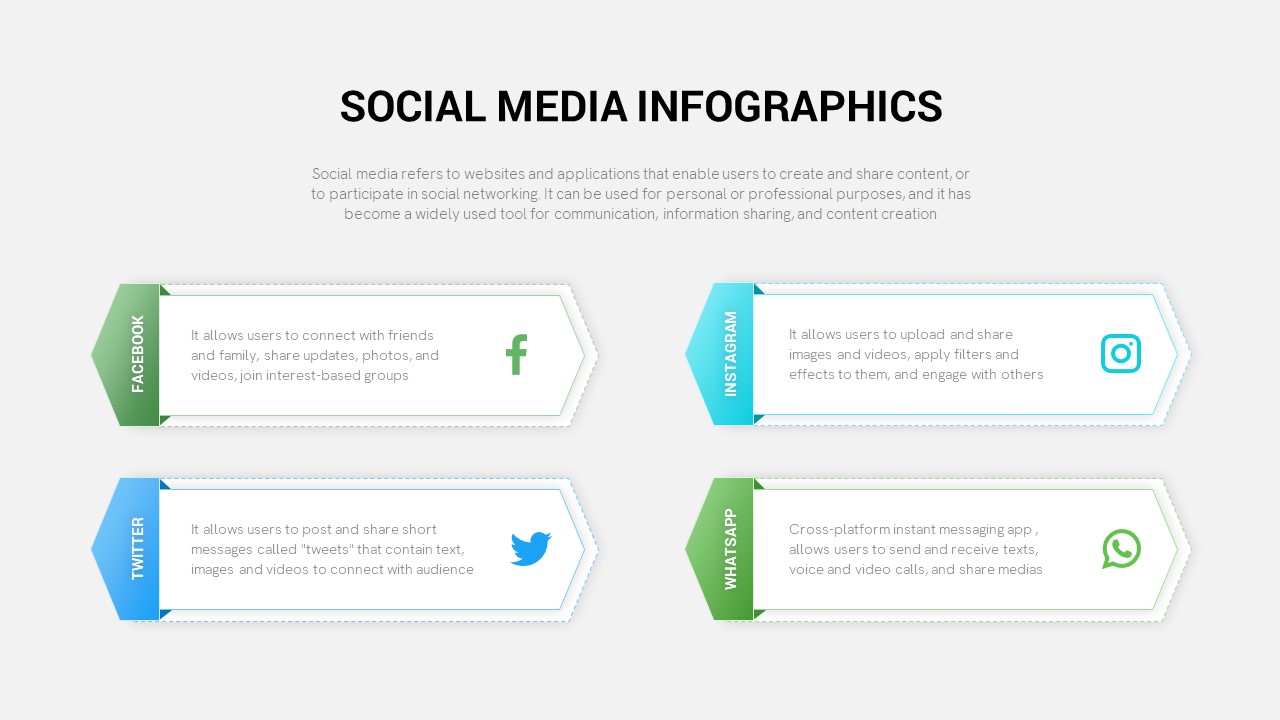
Social Media Infographic Arrow Layout Template for PowerPoint & Google Slides
Arrow
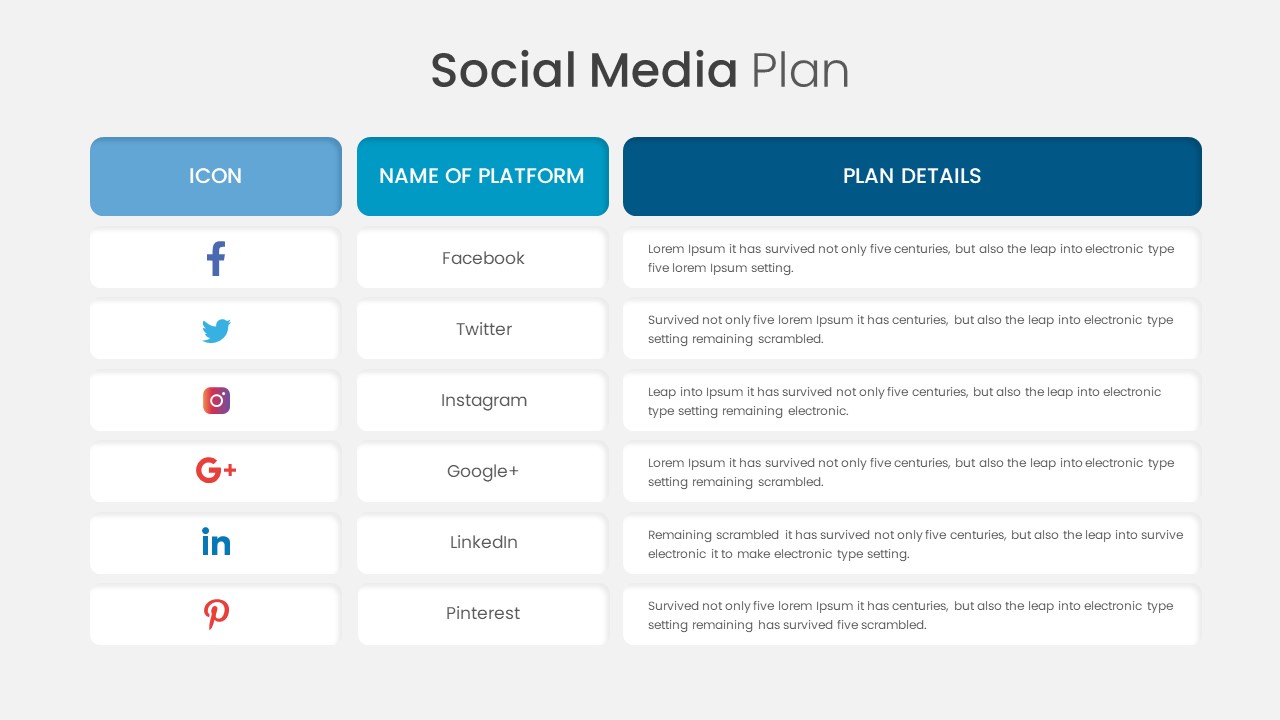
Social Media Plan Table Slide Deck Template for PowerPoint & Google Slides
Process
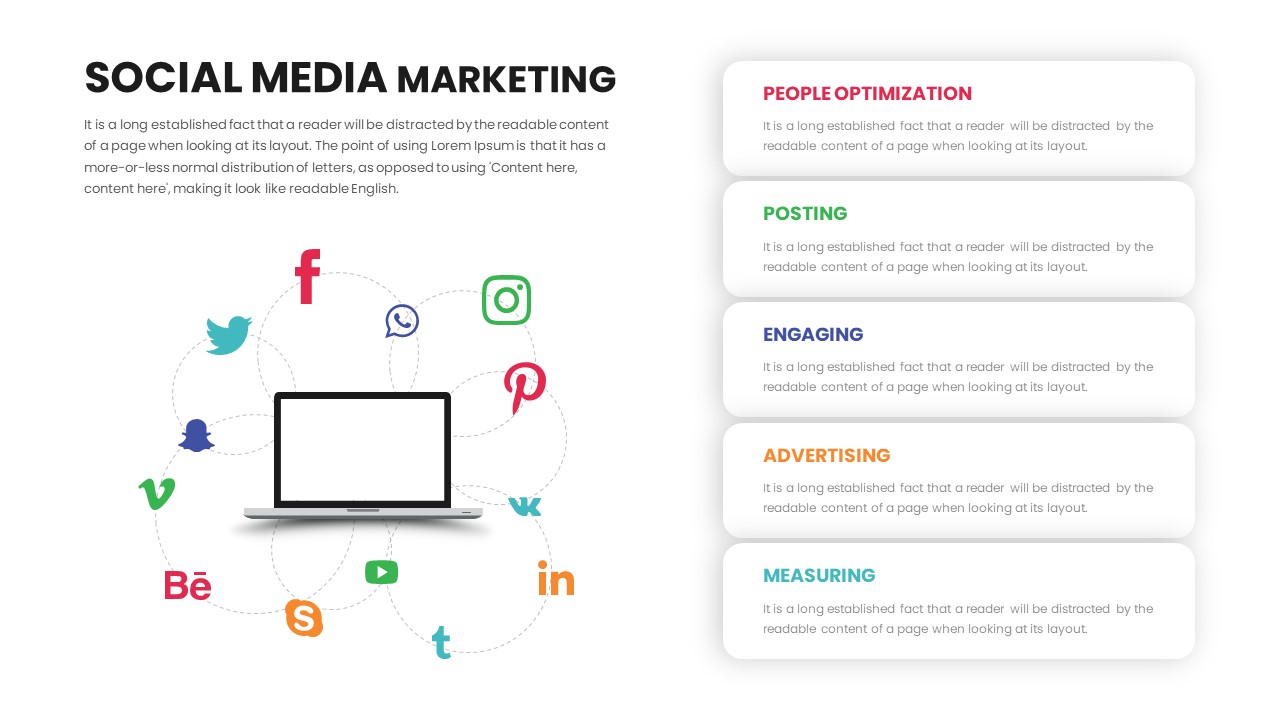
Social Media Marketing Template
Digital Marketing
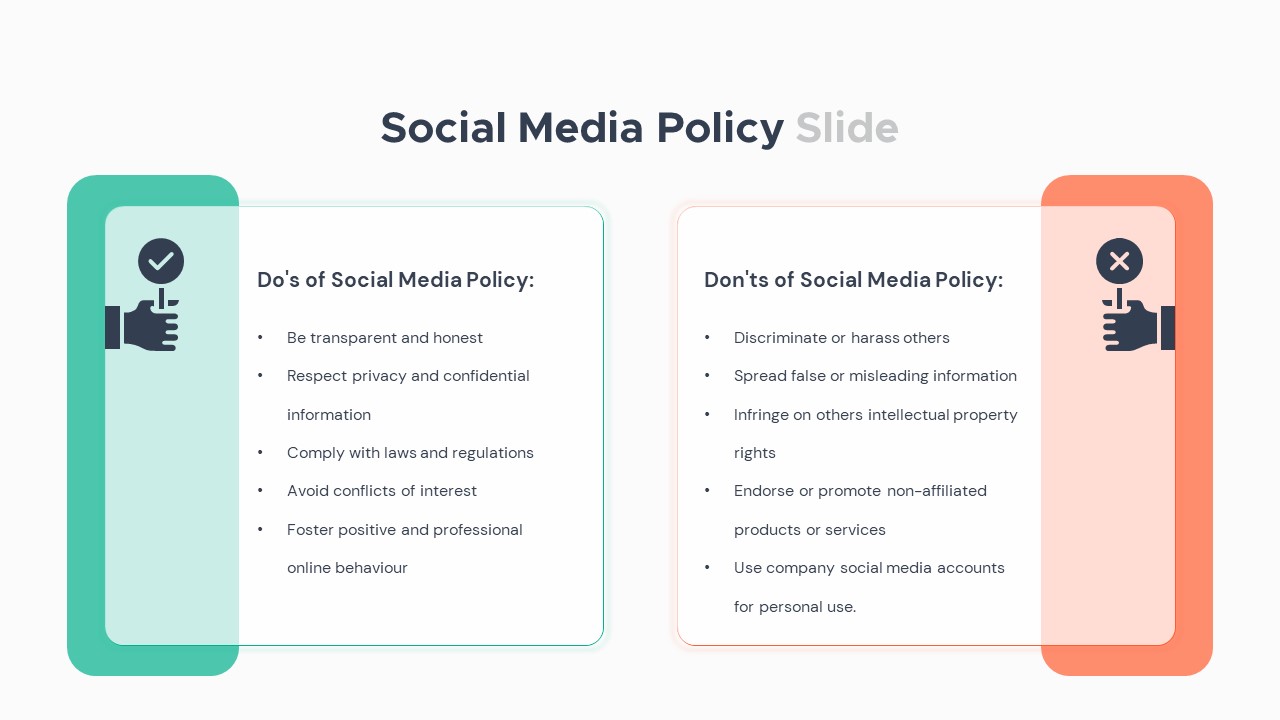
Social Media Policy Dos & Don’ts Slide Template for PowerPoint & Google Slides
Comparison
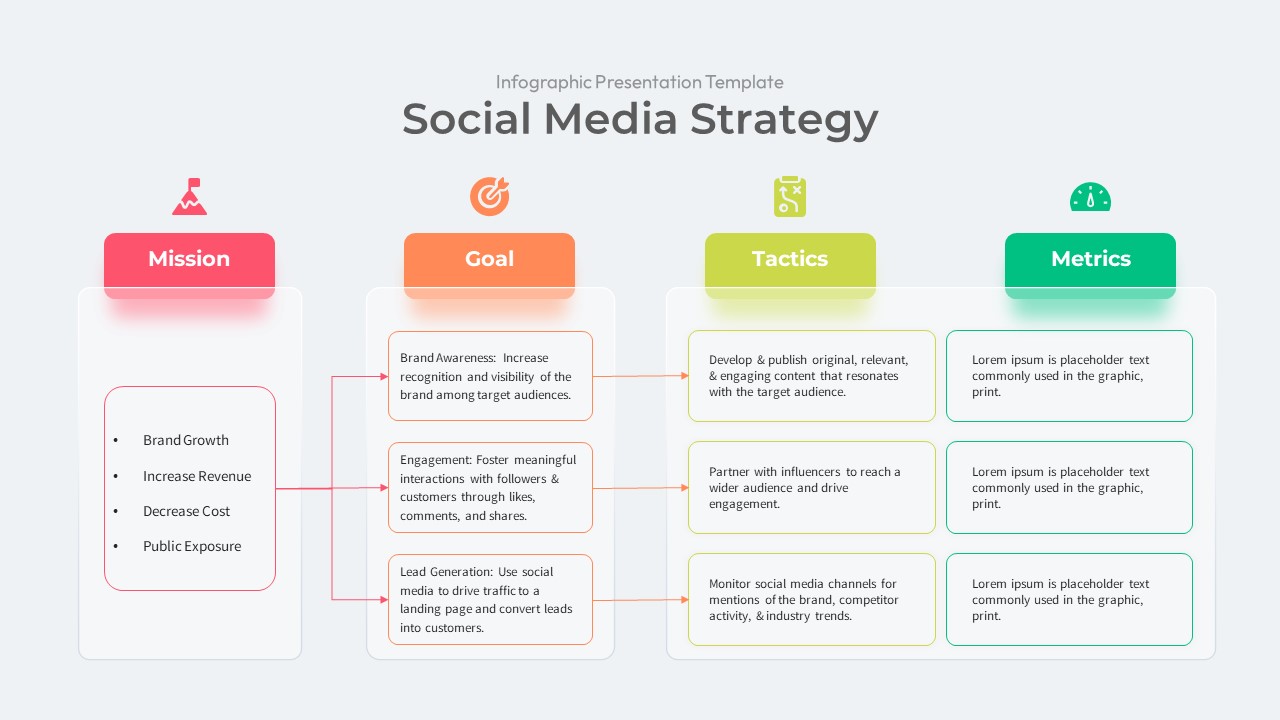
Social Media Strategy Infographic Presentation Template
Digital Marketing
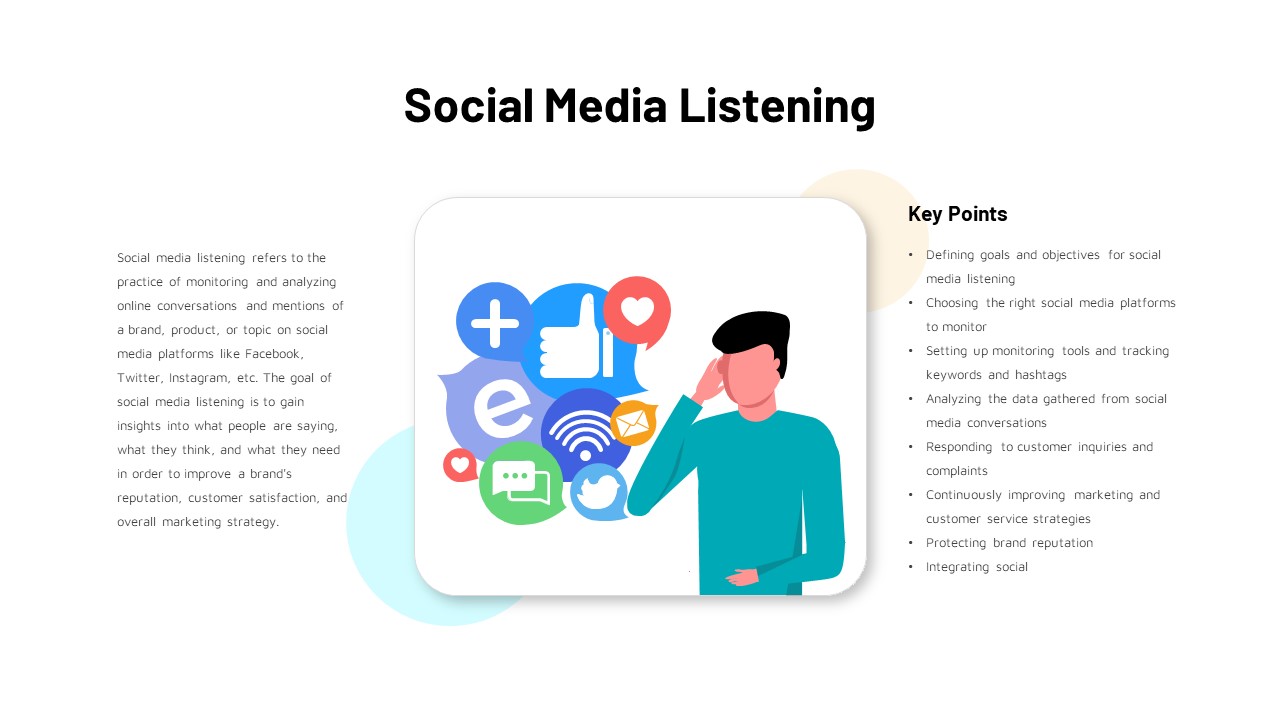
Social Media Listening Overview Slide Template for PowerPoint & Google Slides
Customer Experience
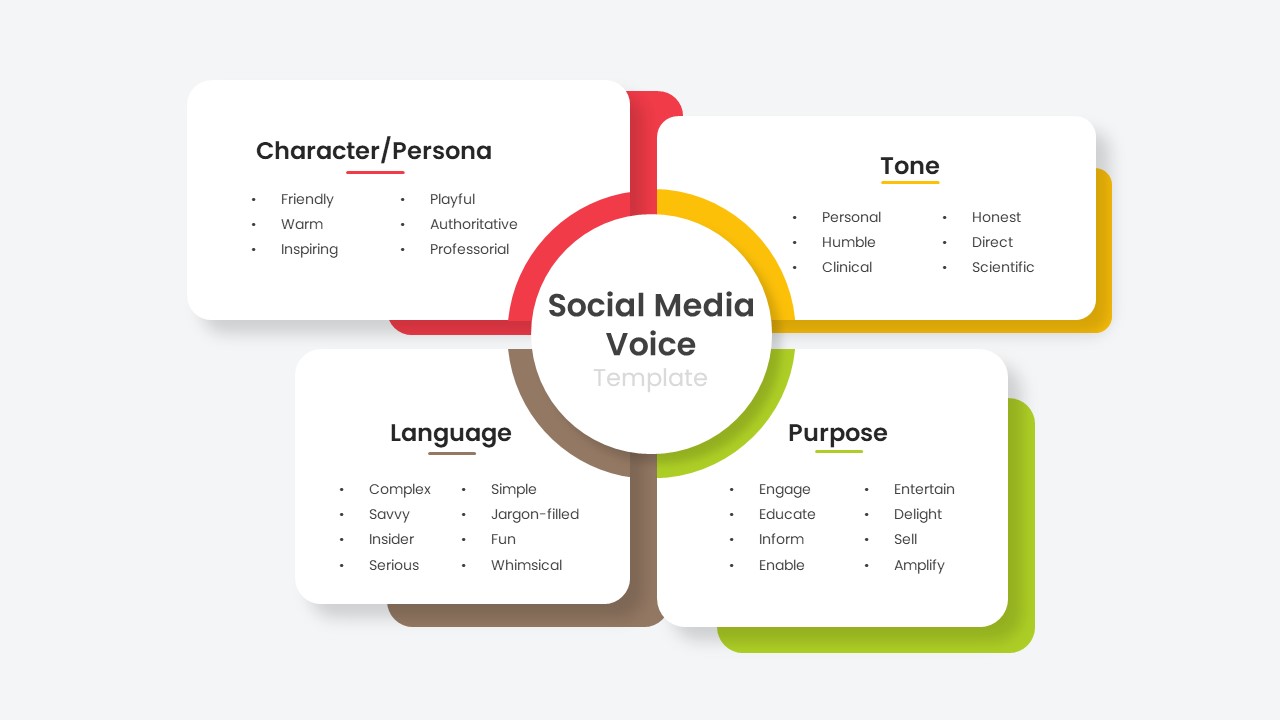
Social Media Voice Template for PowerPoint & Google Slides
Customer Experience
Social Media Hub-and-Spoke Infographics Template for PowerPoint & Google Slides
Circular
Social Media Analysis Metrics Slide Deck Template for PowerPoint & Google Slides
Digital Marketing
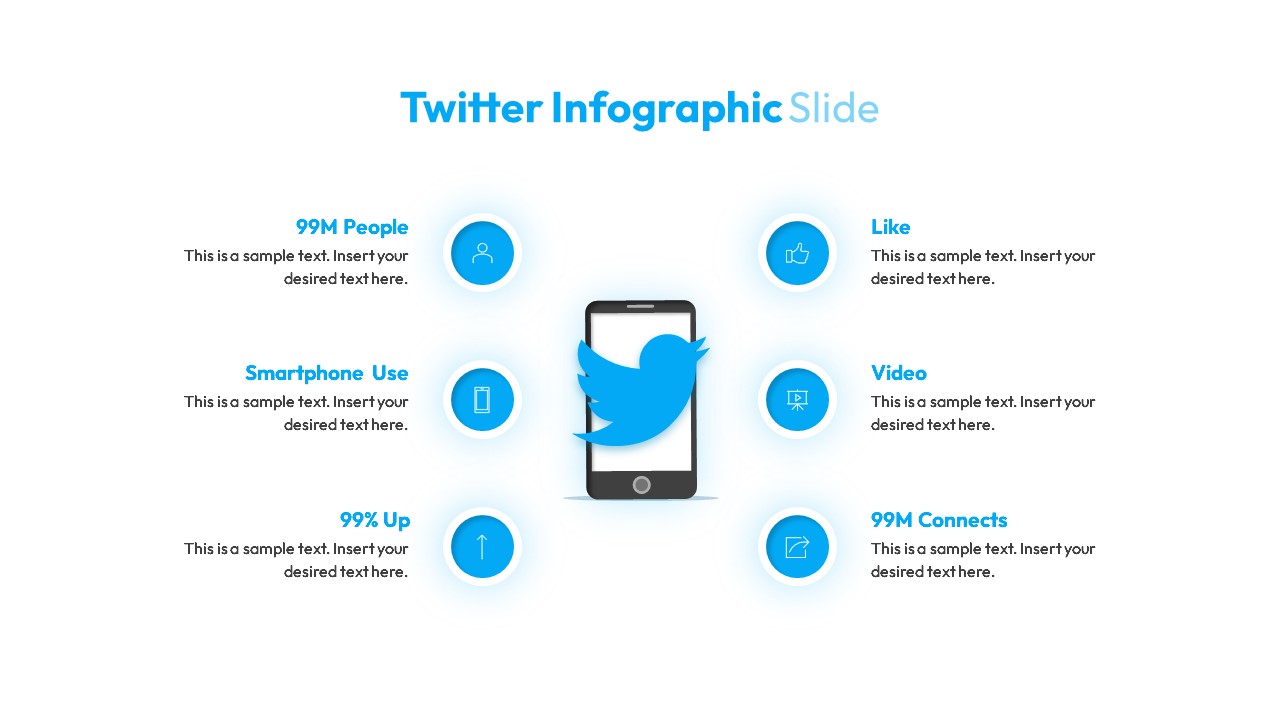
Twitter Infographic Slide
Circular
Social Media Report Presentation Template for PowerPoint & Google Slides
Digital Marketing
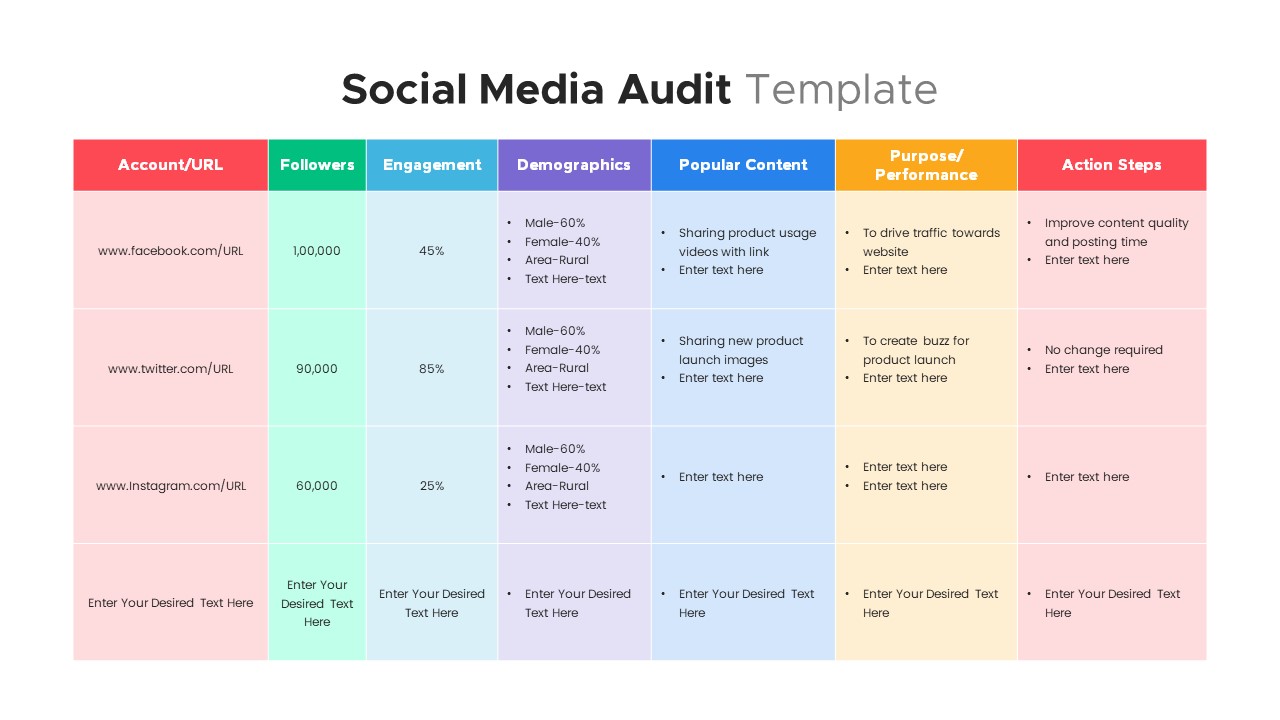
Comprehensive Social Media Audit Template for PowerPoint & Google Slides
Digital Marketing
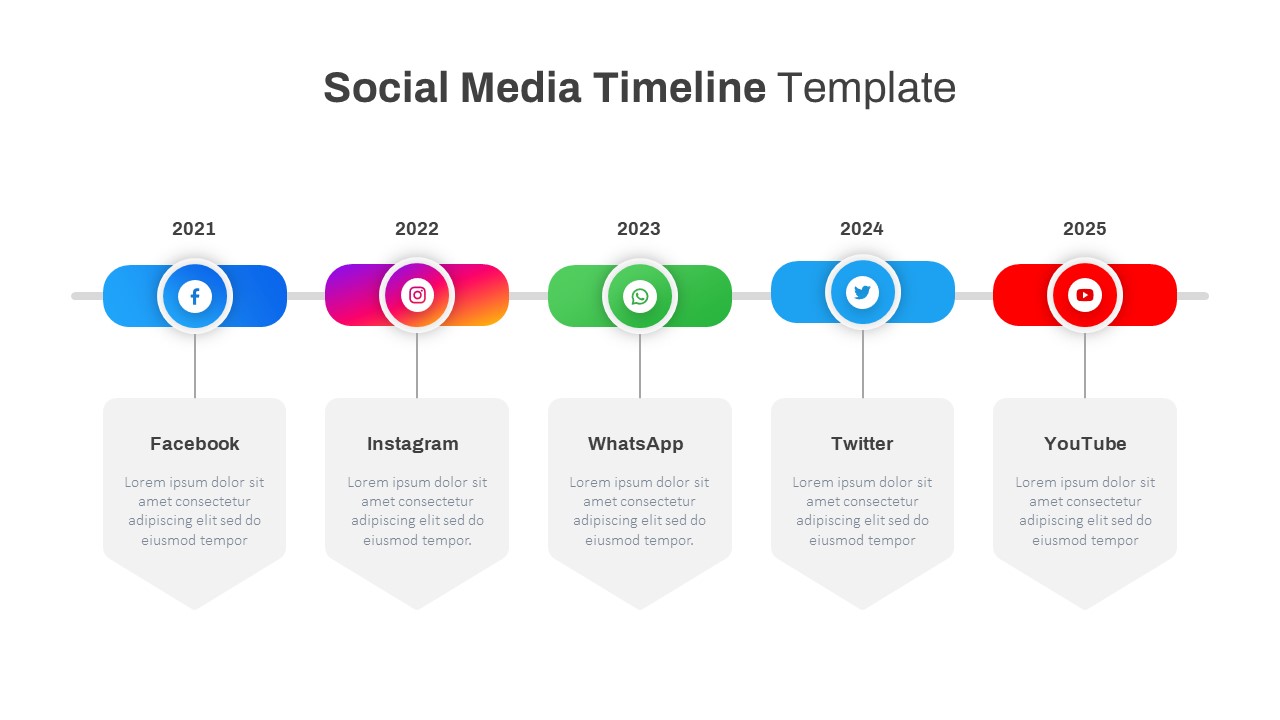
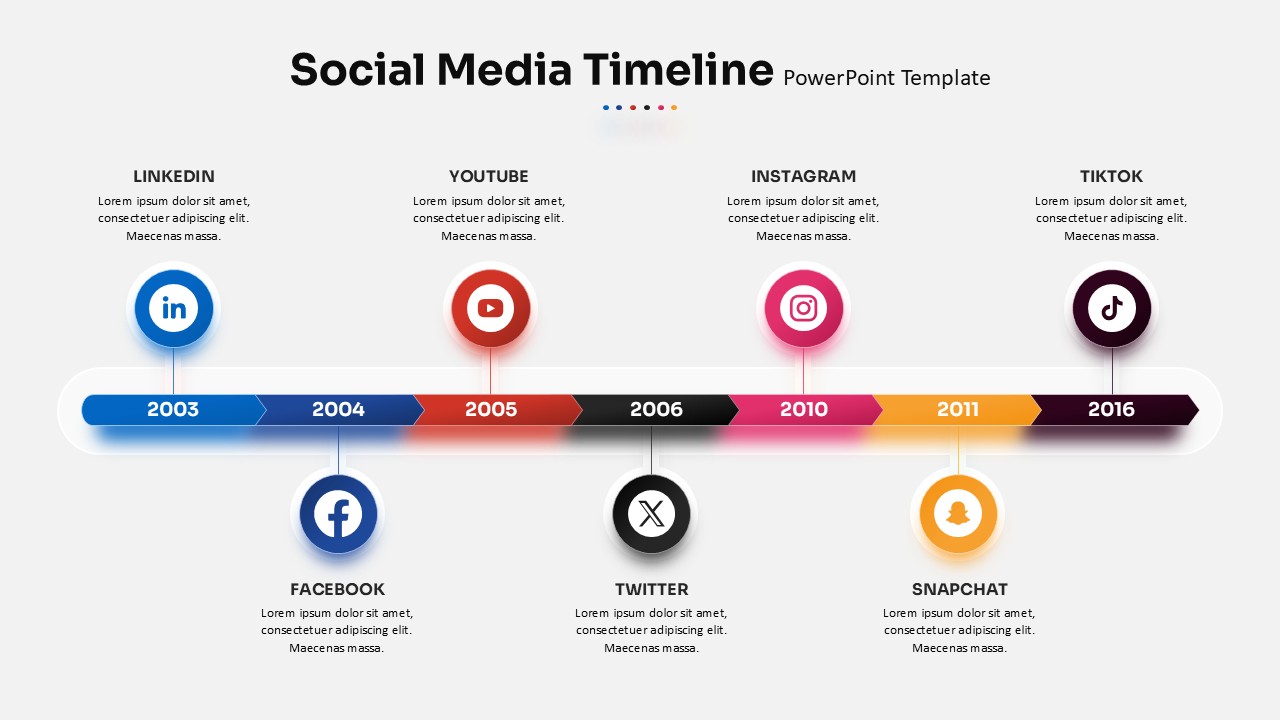
Modern Social Media Timeline Roadmap Template for PowerPoint & Google Slides
Timeline

Social Media Marketing Presentation Template for PowerPoint & Google Slides
Decks
Free Social Media Hub-and-Spoke Infographic Template for PowerPoint & Google Slides
Circular
Free
Social Media Presentation Template for PowerPoint & Google Slides
Pitch Deck
Social Media Marketing Overview Template for PowerPoint & Google Slides
Advertising
Social Media Timeline template for PowerPoint & Google Slides
Timeline
Social Media Recruiting Strategy template for PowerPoint & Google Slides
Business
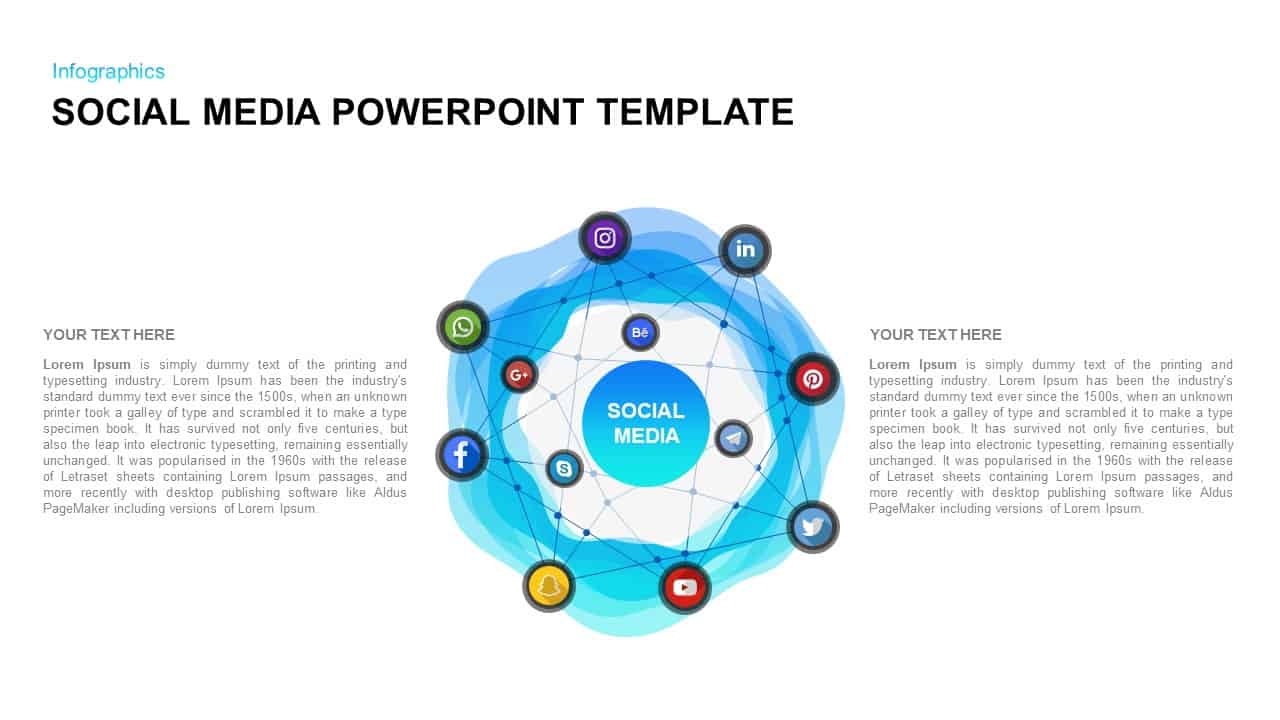
Social Media PowerPoint Template
Process
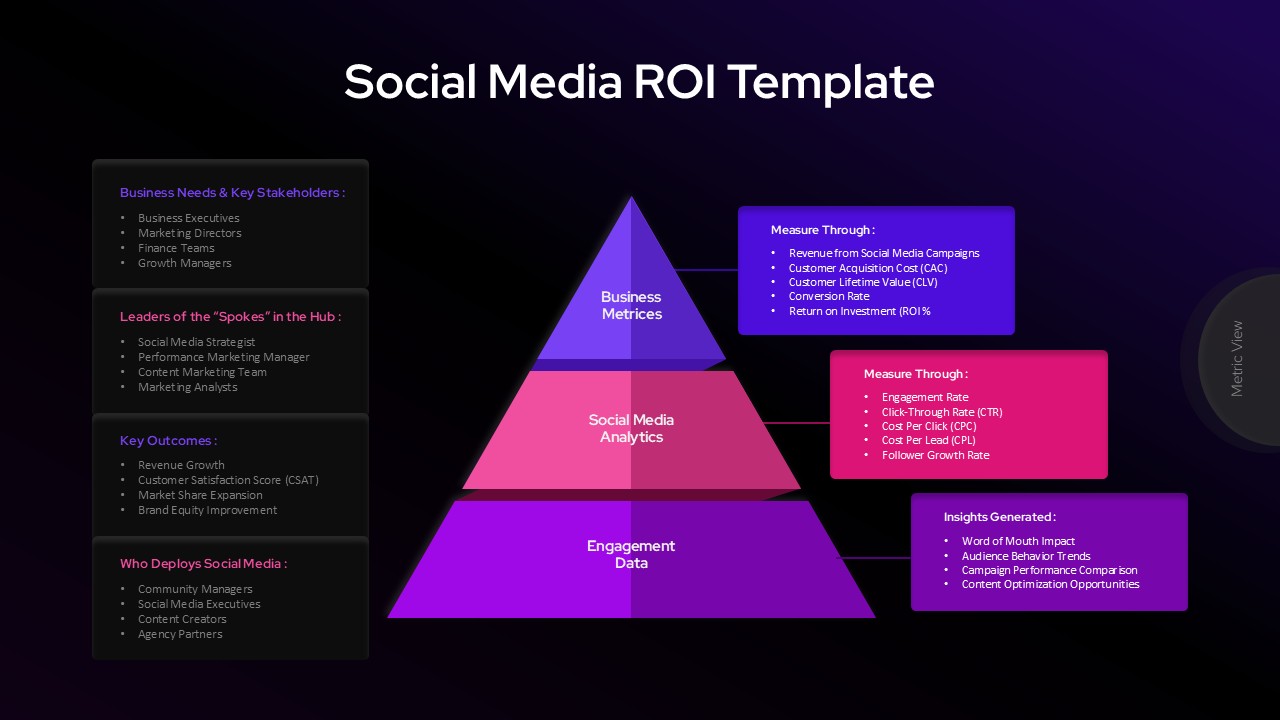
Social Media Marketing ROI Infographic Template for PowerPoint
Digital Marketing
Google Ads Optimization & Performance Infographic Template for PowerPoint & Google Slides
Digital Marketing
Profit Performance Trend Chart Template for PowerPoint & Google Slides
Finance
Sales vs Budget Performance Chart Template for PowerPoint & Google Slides
Bar/Column
Performance Review Process Management Cycle template for PowerPoint & Google Slides
Employee Performance
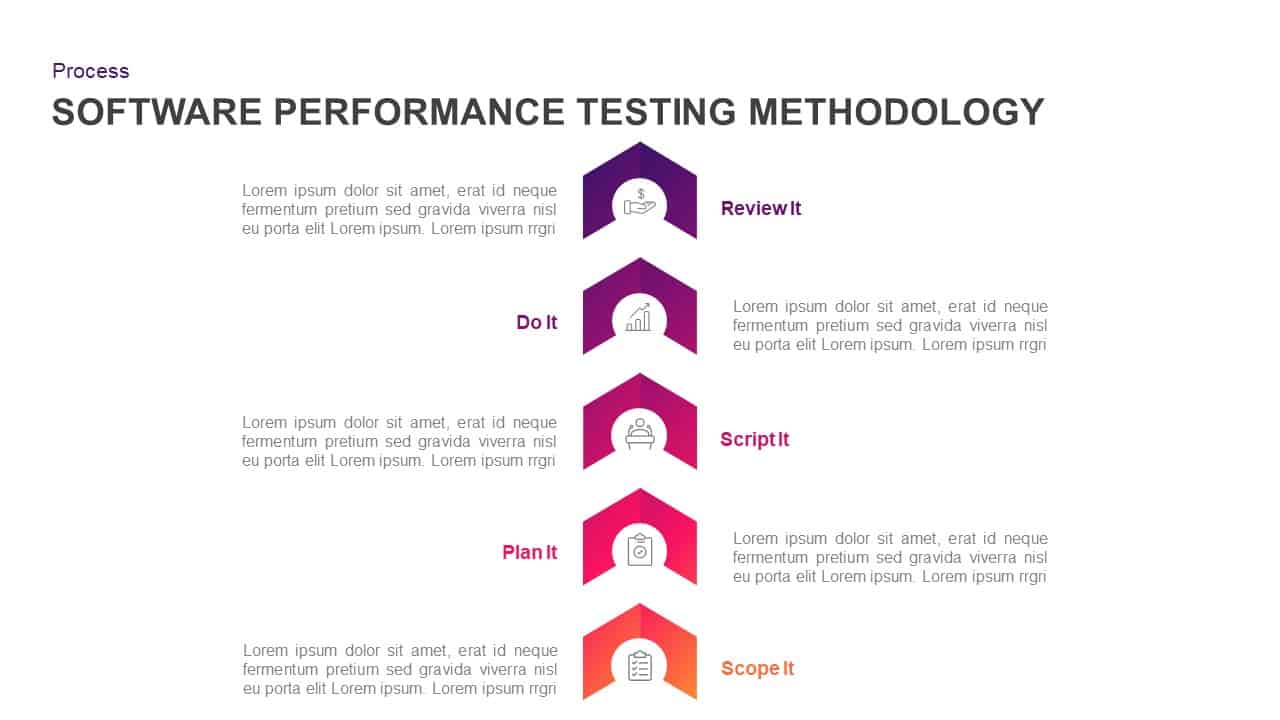
Software Performance Testing Methodology Template for PowerPoint & Google Slides
Process
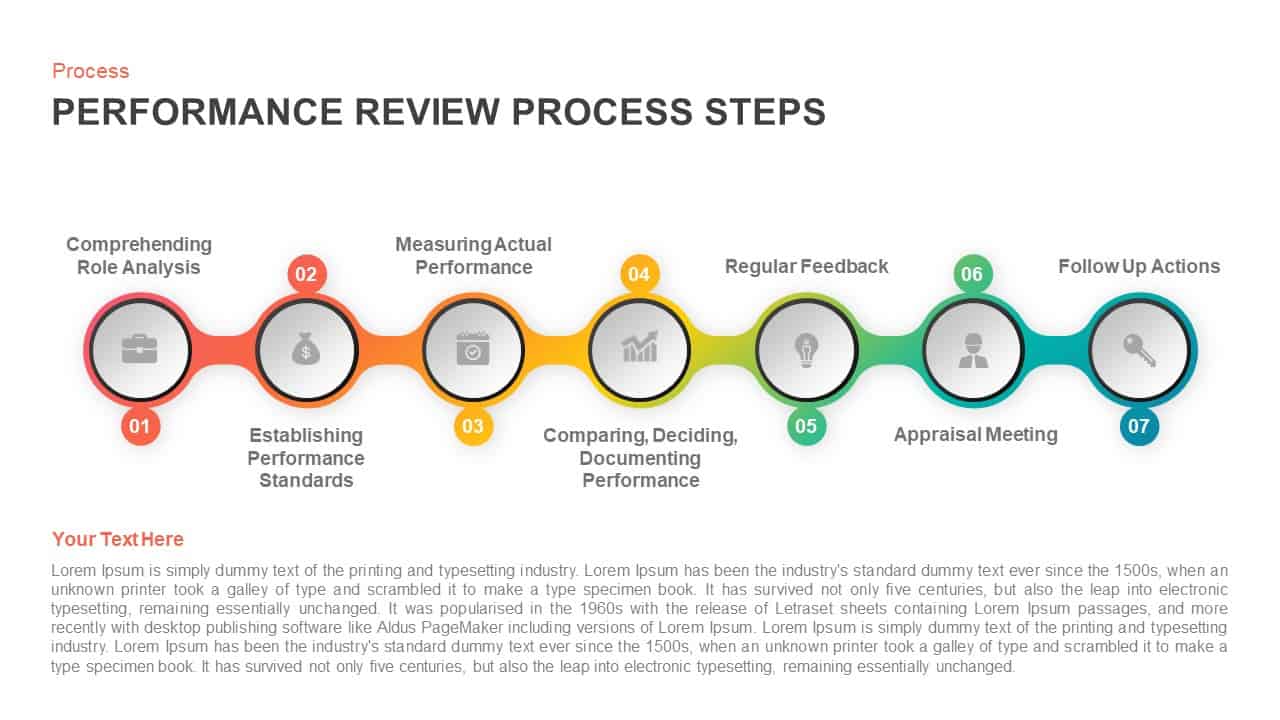
Performance Review Process Steps Template for PowerPoint & Google Slides
Employee Performance
Professional Sales Performance Report Template for PowerPoint & Google Slides
Business Report
Performance Review Progress Management Template for PowerPoint & Google Slides
Process
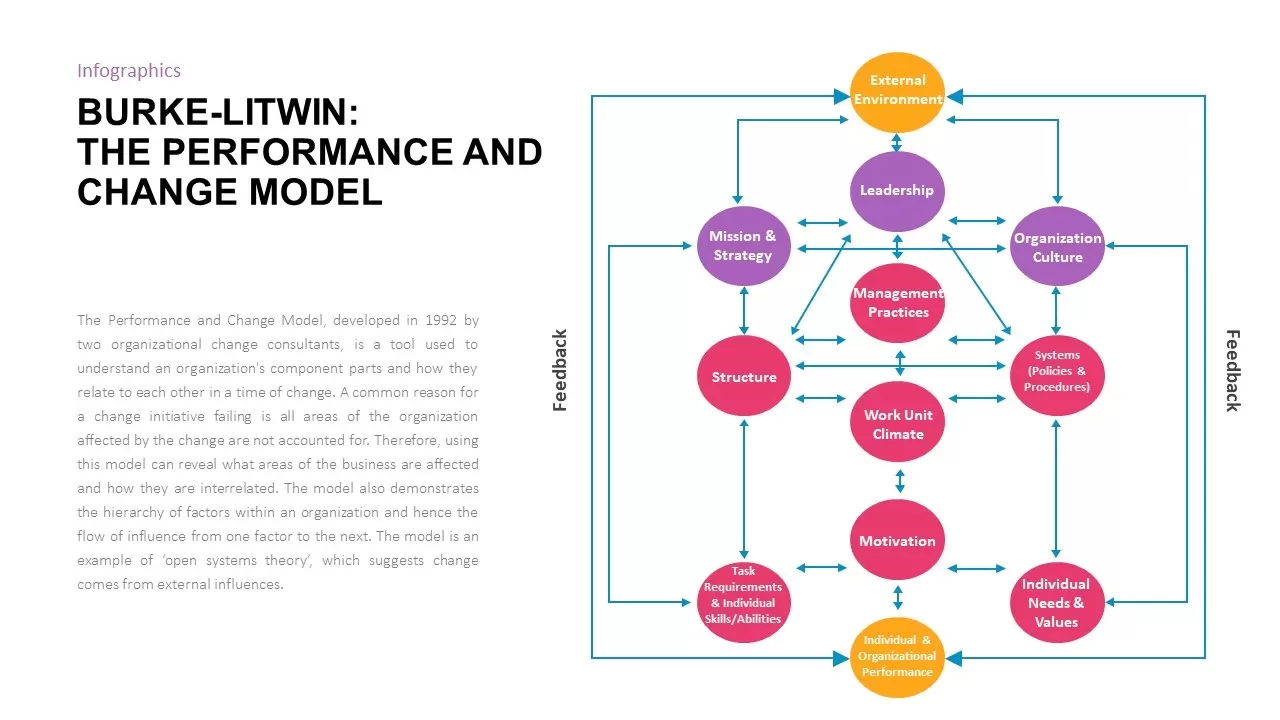
Burke-Litwin Performance and Change Model template for PowerPoint & Google Slides
Infographics
Corporate Performance Management Template for PowerPoint & Google Slides
Pitch Deck
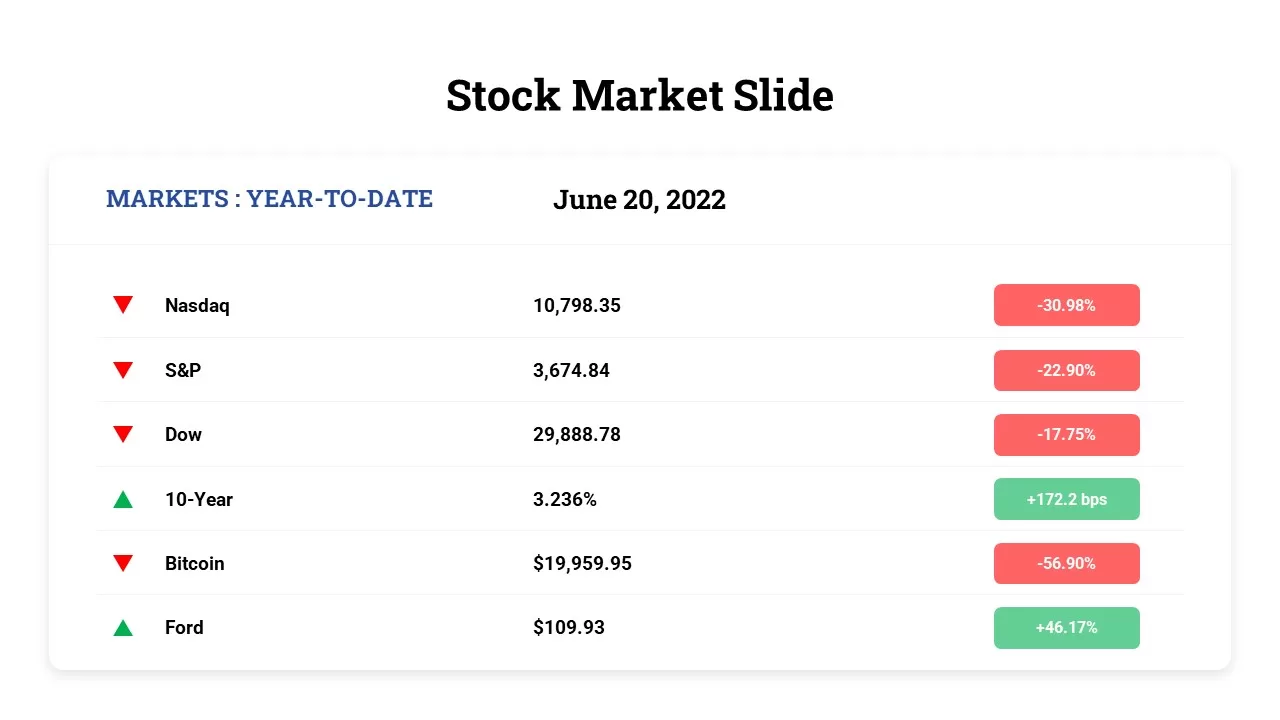
Free Stock Market Performance Overview template for PowerPoint & Google Slides
Finance
Free
9-Box Matrix for Performance & Potential Template for PowerPoint & Google Slides
Employee Performance
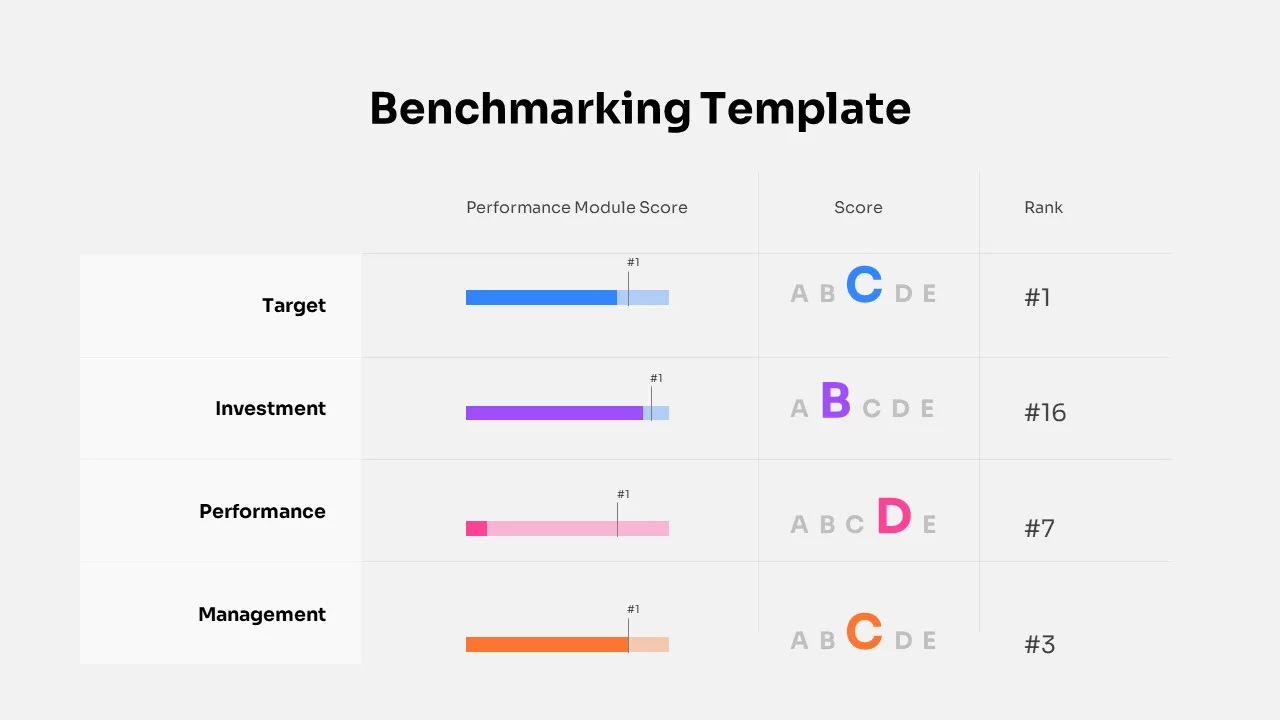
Benchmarking Performance Score Template for PowerPoint & Google Slides
Comparison Chart
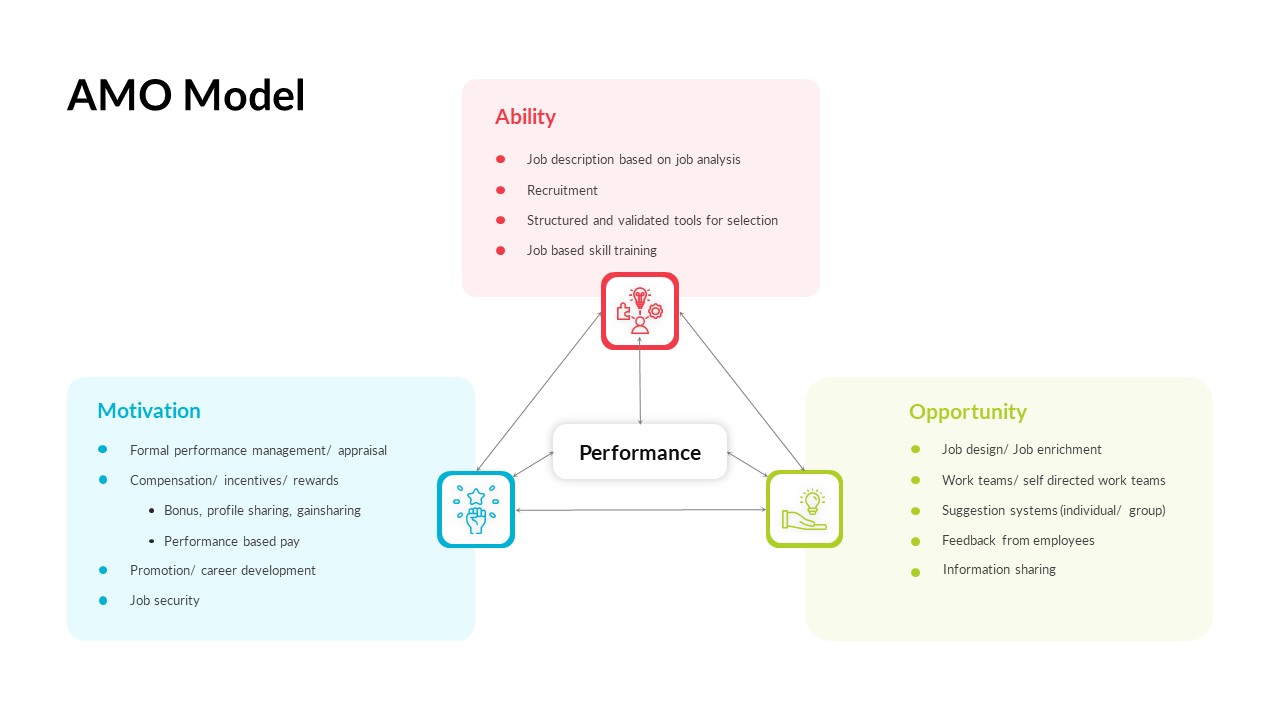
AMO Performance Model Feedback Diagram Template for PowerPoint & Google Slides
Employee Performance
Hits and Misses Performance Comparison Template for PowerPoint & Google Slides
Comparison
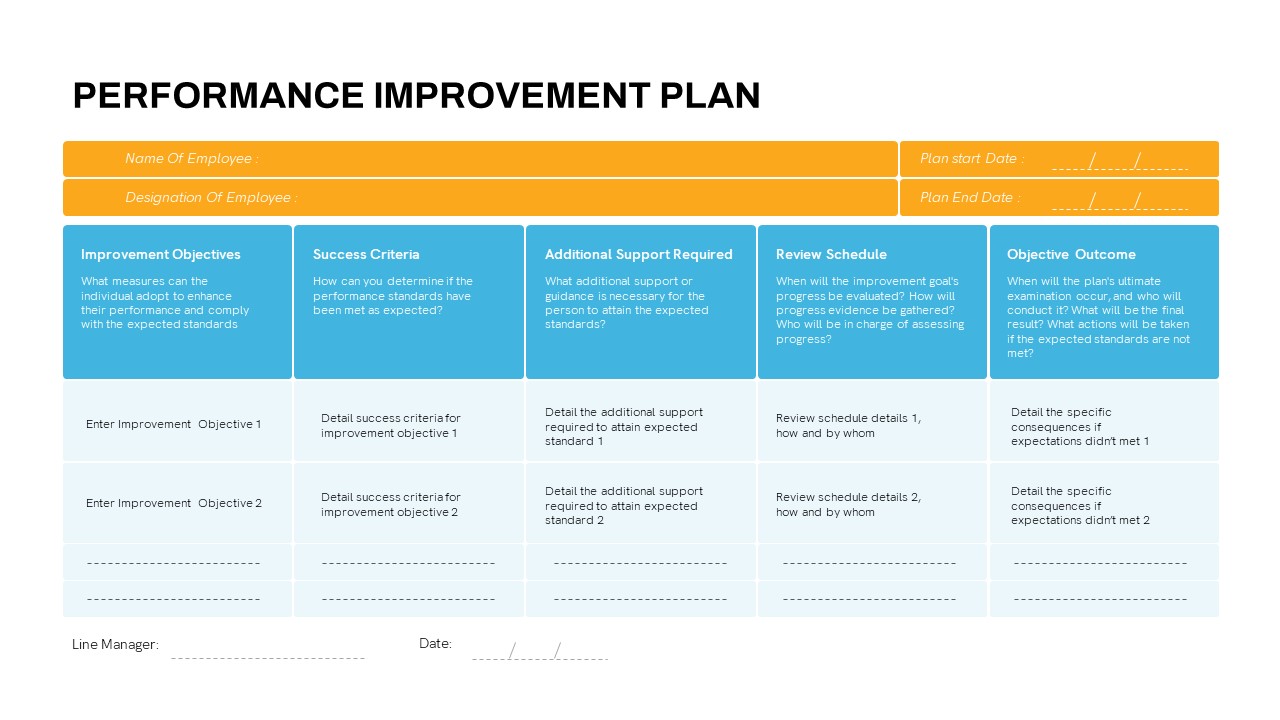
Performance Improvement Plan PowerPoint Template
Employee Performance
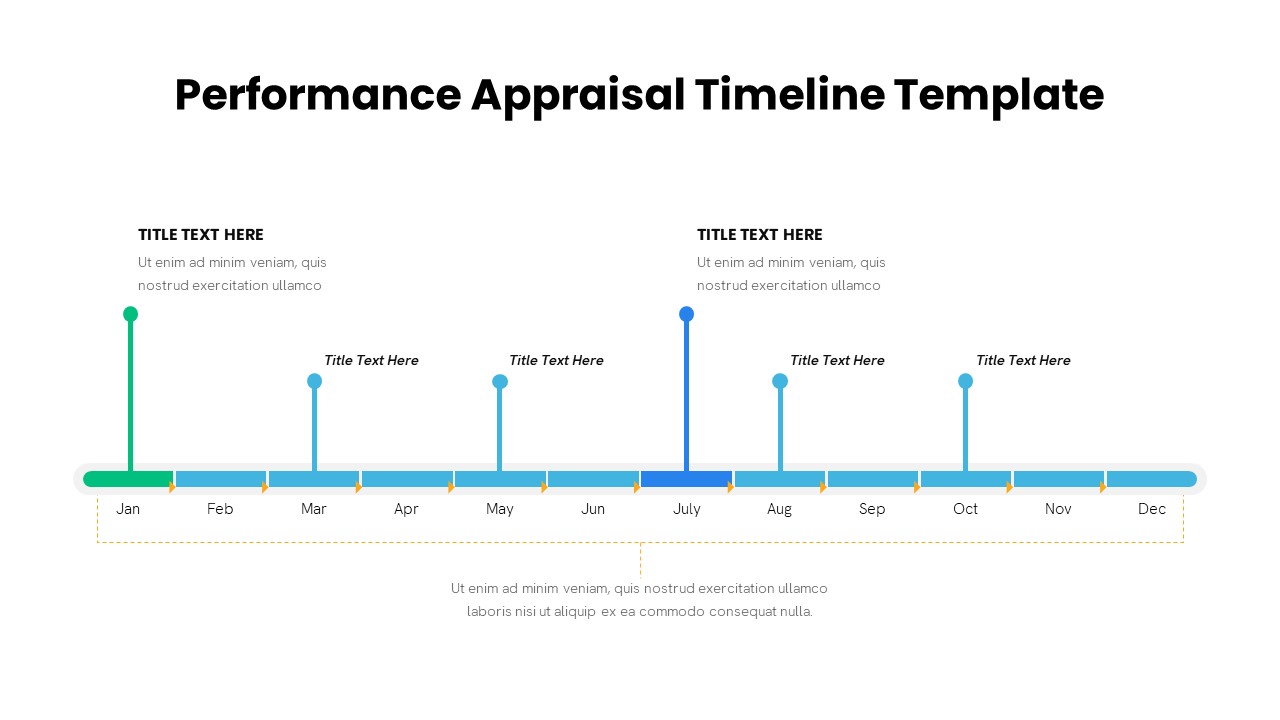
Performance Appraisal Timeline Diagram Template for PowerPoint & Google Slides
Timeline
Performance Review template for PowerPoint & Google Slides
Employee Performance
High Performance Pyramid Diagram Template for PowerPoint & Google Slides
Pyramid
Performance-driven Culture framework template for PowerPoint & Google Slides
Leadership
Meta Ads Performance Overview template for PowerPoint & Google Slides
Advertising
Performance Marketing Strategy template for PowerPoint & Google Slides
Digital Marketing
SEO Performance Report Overview template for PowerPoint & Google Slides
Digital Marketing
Performance Dashboards Overview Template for PowerPoint & Google Slides
Business Report
Learning Curve Performance Growth Chart Template for PowerPoint & Google Slides
Employee Performance
Year-over-Year Performance Comparison Template for PowerPoint & Google Slides
Comparison Chart
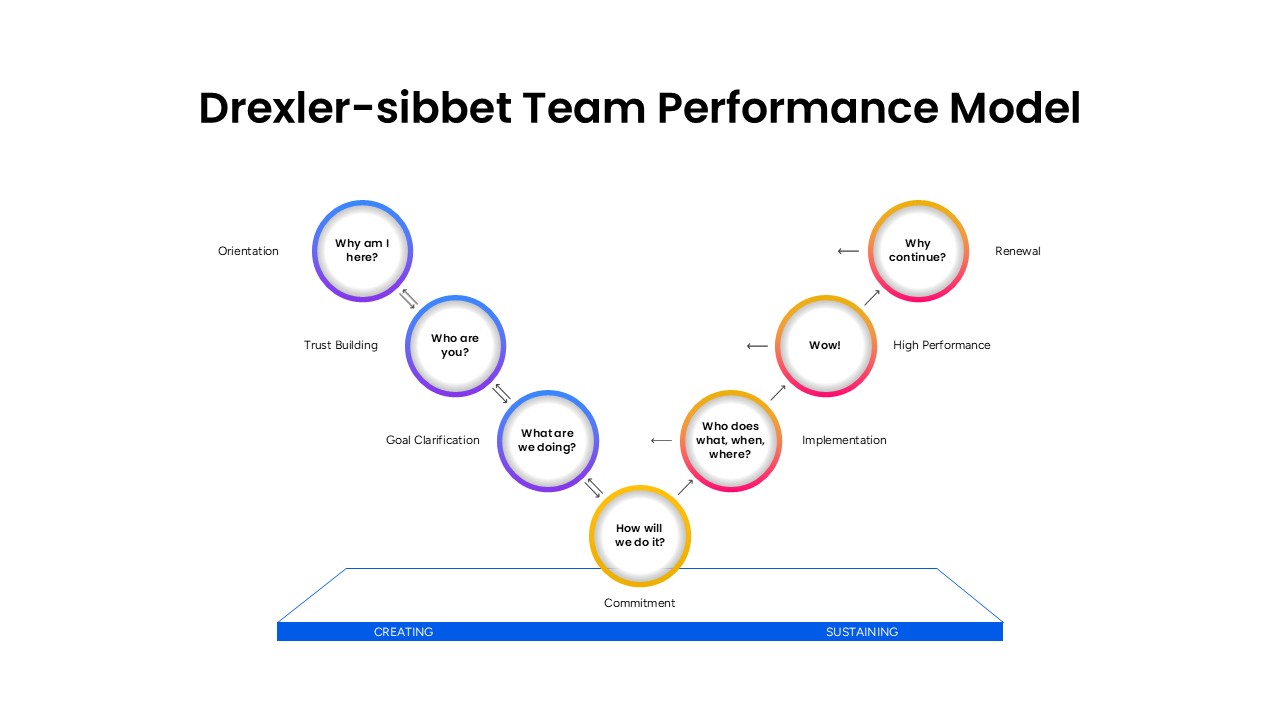
Drexler-Sibbet Team Performance Model Template for PowerPoint & Google Slides
Business Strategy
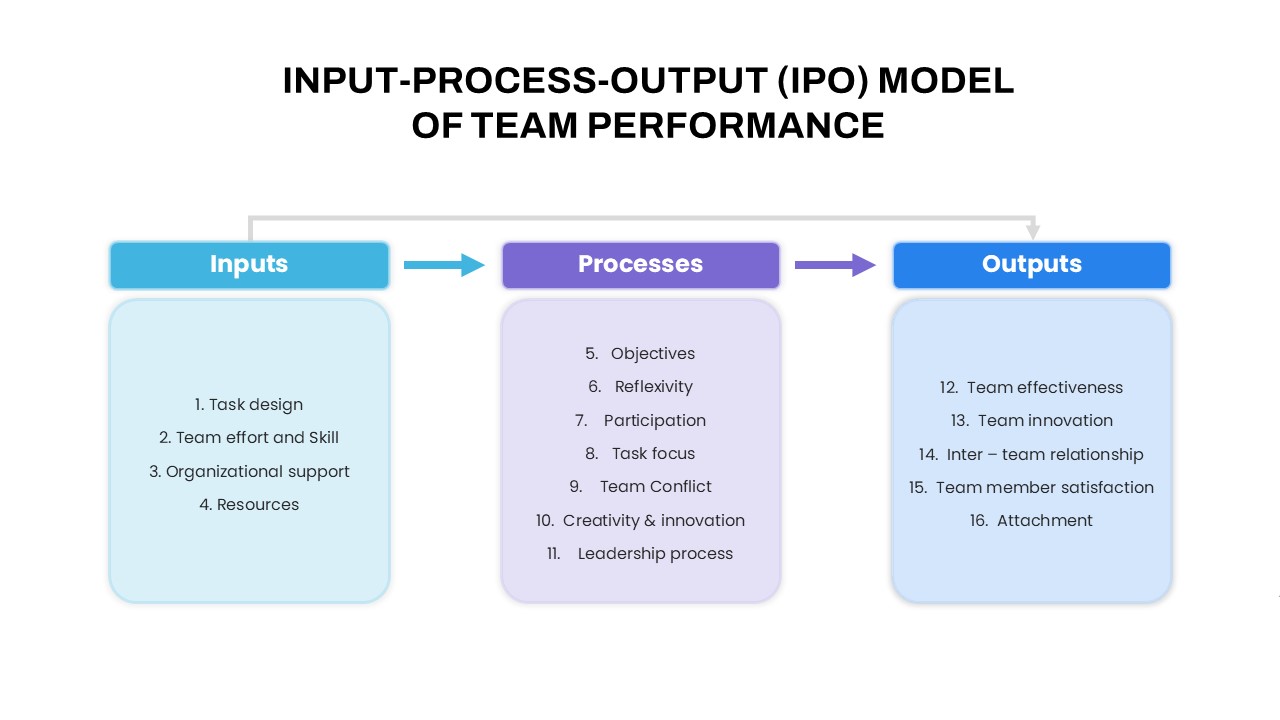
IPO Model of Team Performance for PowerPoint & Google Slides
Process
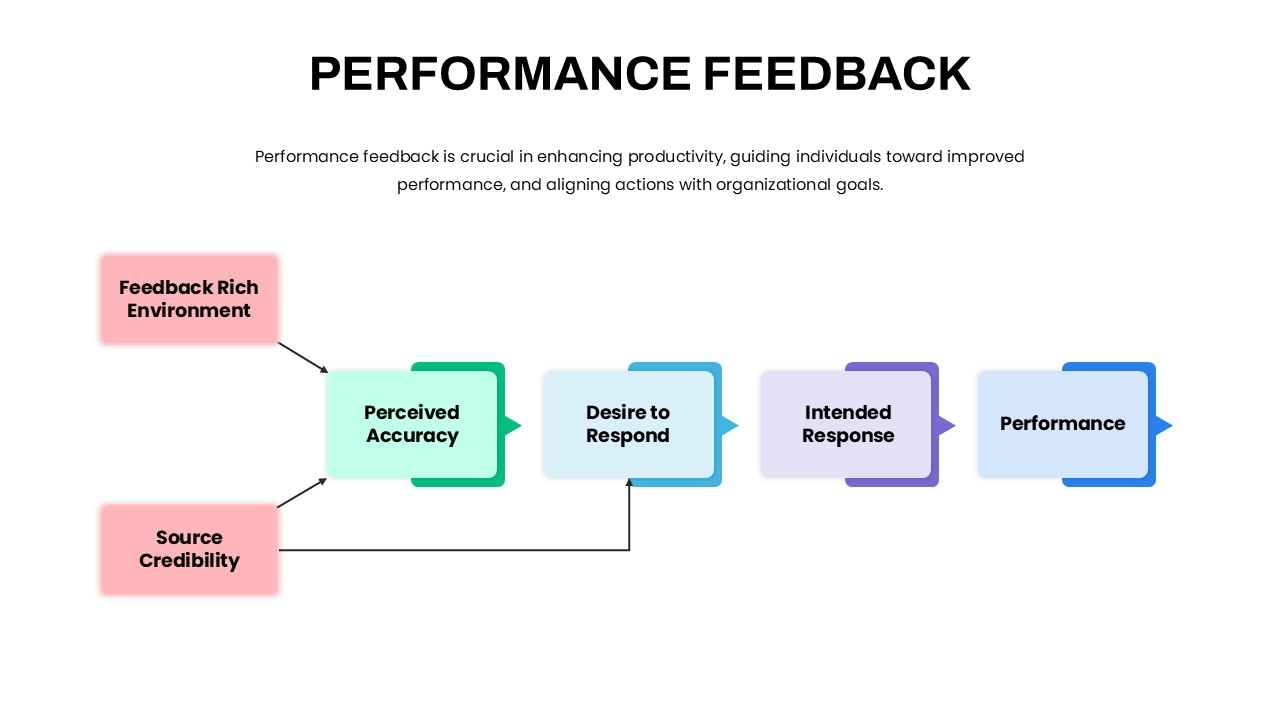
Performance Feedback Model for PowerPoint & Google Slides
Employee Performance
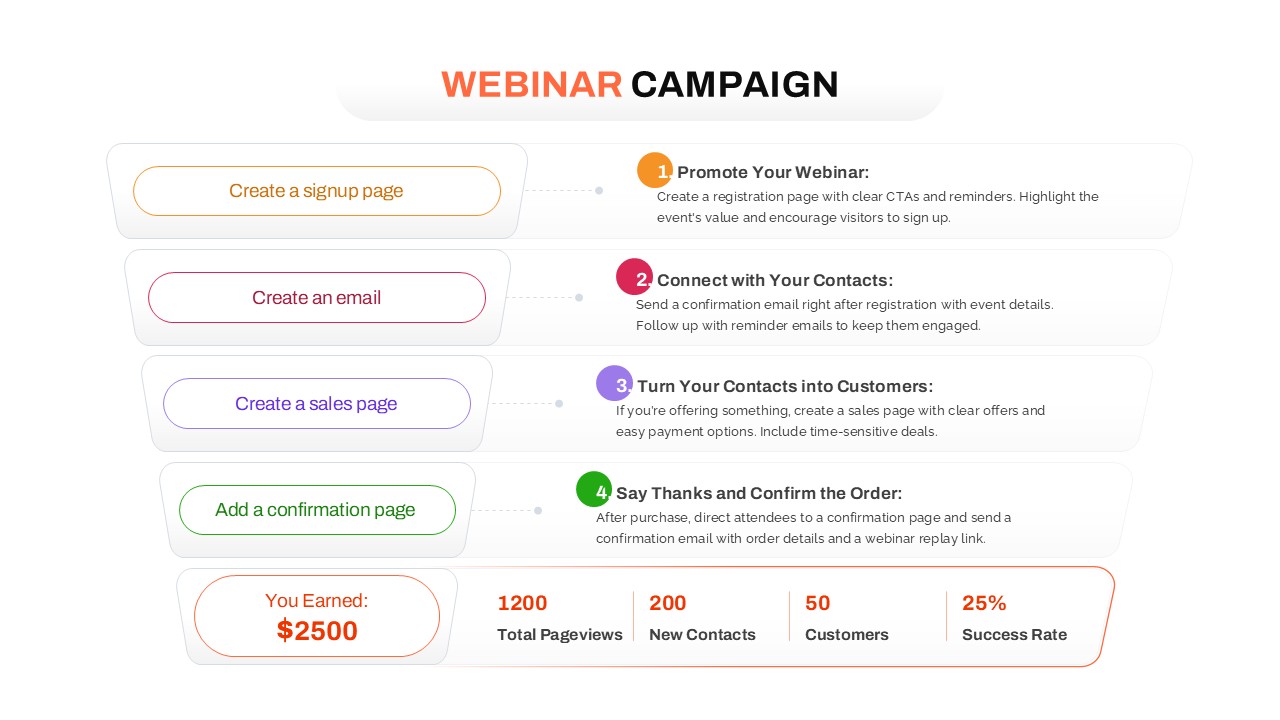
Webinar Campaign Steps and Performance for PowerPoint & Google Slides
Advertising
Google Analytics 4 (GA4) Dashboard Template for PowerPoint & Google Slides
Digital Marketing
Free KPI Dashboard Template for PowerPoint & Google Slides
Charts
Free
Business Dashboard Analytics & KPIs Template for PowerPoint & Google Slides
Bar/Column
Immigration Data Dashboard Template for PowerPoint & Google Slides
Bar/Column
Sales Growth Dashboard: KPI Gauge & Line Template for PowerPoint & Google Slides
Revenue
Bull and Bear Stock Market Dashboard Template for PowerPoint & Google Slides
Infographics
KPI Dashboard Data Overview Slide Template for PowerPoint & Google Slides
Bar/Column
Project Status Dashboard Table Template for PowerPoint & Google Slides
Project Status
Project Status Dashboard with Metrics Template for PowerPoint & Google Slides
Project Status
One Pager Project Status Dashboard Template for PowerPoint & Google Slides
Project Status
Mastodon Metrics Infographic Dashboard Template for PowerPoint & Google Slides
Business Report
Score Card PowerPoint Template
Graphics
Banking Financial Overview Dashboard Template for PowerPoint & Google Slides
Finance
Quarterly Business Review Dashboard Template for PowerPoint & Google Slides
Pitch Deck
Project Progress Dashboard Pie Charts Template for PowerPoint & Google Slides
Project
Customer Interview Insights Dashboard Template for PowerPoint & Google Slides
Customer Experience
Project Status Dashboard Template for PowerPoint & Google Slides
Project Status
Dashboard Project Status Template for PowerPoint & Google Slides
Project Status
Project Status Template Dashboard with Gauge for PowerPoint & Google Slides
Project Status
Employee Headcount Dashboard Report Template for PowerPoint & Google Slides
Employee Performance