Dashboard Template for PowerPoint Presentation
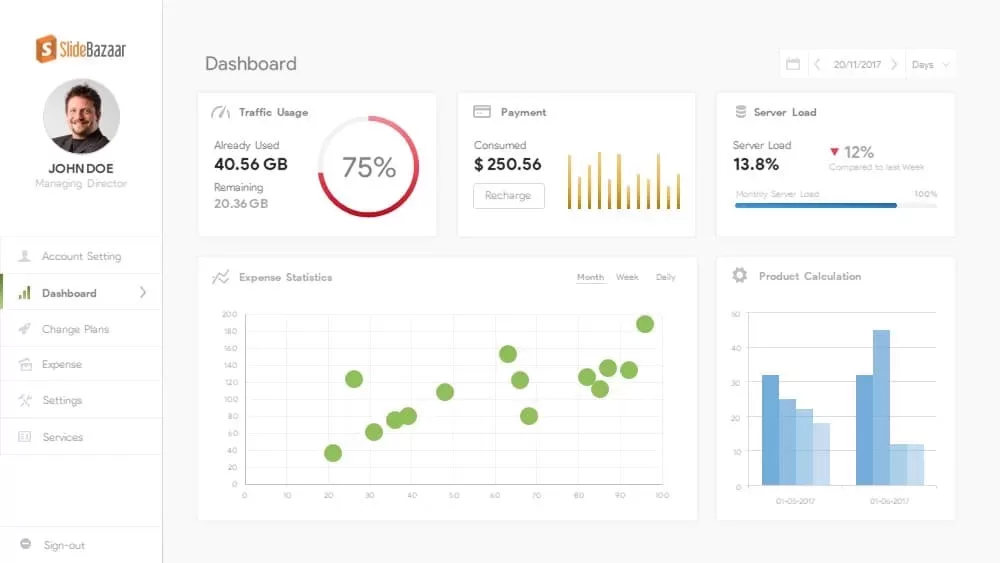
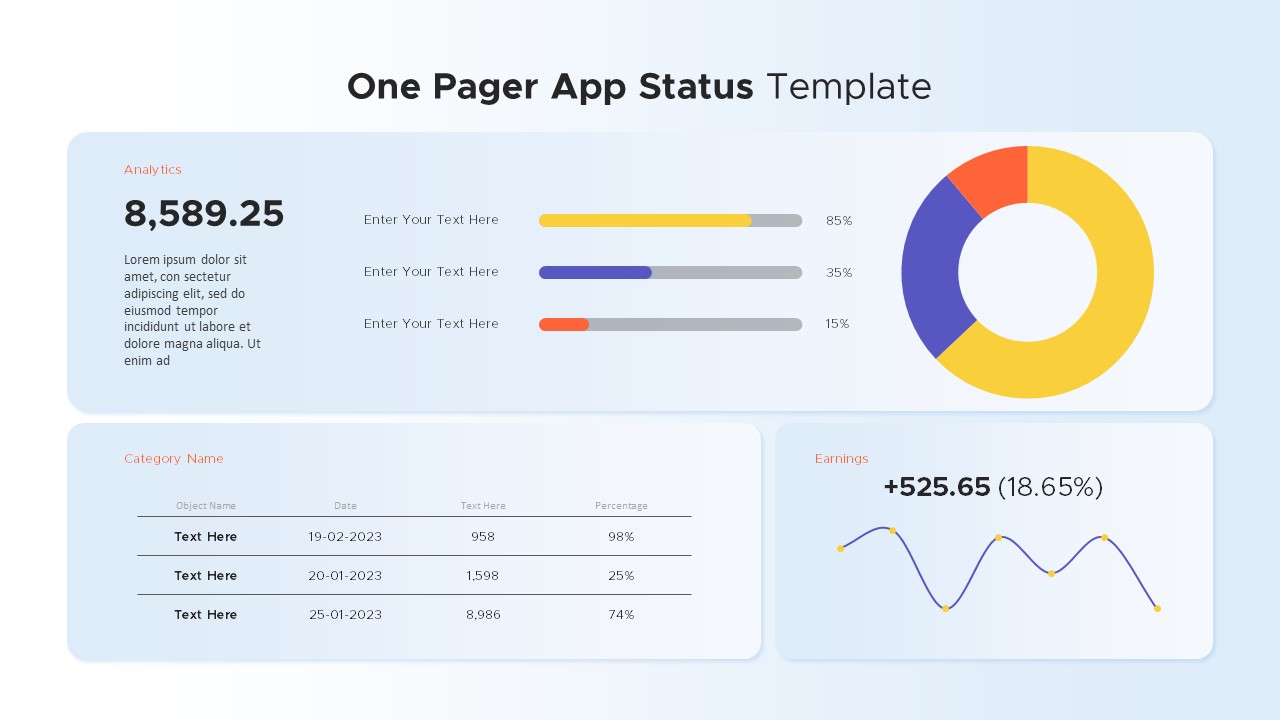
The dashboard template for PowerPoint presentation is a business pitch for presenting the ongoing status of a company. You can monitor sales performance and financial allocations, and revenue growth with this statistical visual aid. It is a data-driven PowerPoint slide that contains 11 different statistical graphical charts with a master dashboard. The sales dashboard ppt presentation helps quickly view key performance indicators related to particular business objectives or goals. In addition, the users can project separate data individually using the other individual templates. The set of charts ppt diagram is a collection of global data dashboard with line graphs and map, speedometer gauge template, area chart PowerPoint with bar chart and growth meter, line chart PowerPoint showing sales and revenue growth, and a master PowerPoint including all the statistical devices in a single PowerPoint deck.
Dashboard PowerPoint template is a software application used to track and monitor the status or health of an organization or department by reporting on key performance indicators, business metrics, and analytics. Recording instrument panels have a long history in business intelligence to review information into quickly digestible analytics that provides at glance perceptibility into business or organization’s performance. The value of a reporting dashboard is in its ability to adapt behavior and enterprise incremental, continuous improvement.
You can use the dashboard ppt template to present existing data with future forecasts, and numbers describe actual values. The dashboard components are fully data-driven, so the users attain full support from the PowerPoint presentation’s research team. The combined elements of these graphs and charts allow for a systematic and extensive data analysis. By correlating these different types of information, the presenter can focus on certain aspects, such as sales, customer demography, etc. It is better to remain unchanged, the structure and statistical tools are organized in a highly professional manner.
Login to download this file
Add to favorites
Add to collection


