Year-over-Year Stacked Gender Bar Chart Template for PowerPoint & Google Slides


Description
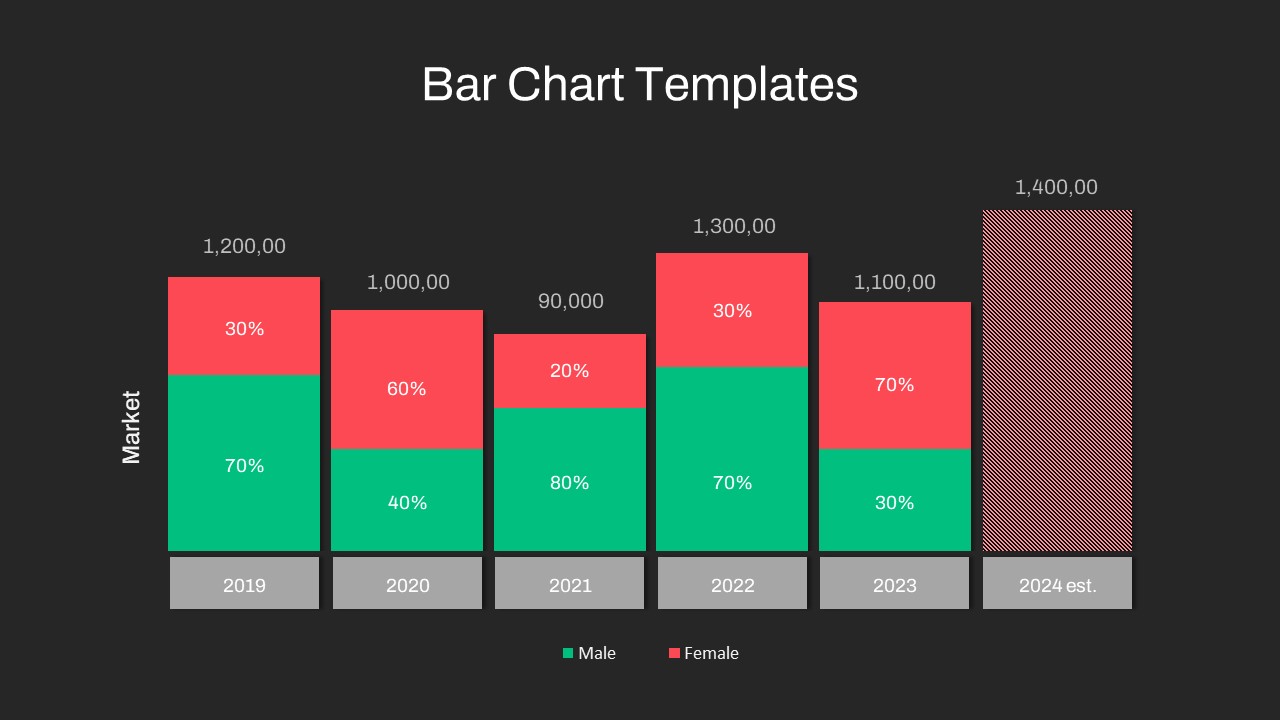
Visualize year-over-year demographic shifts with this stacked gender bar chart slide. A clean white canvas hosts six vertical columns for January through August metrics, plus an estimated bar for 2024. Each column is divided into green “Male” and red “Female” segments—complete with percentage labels—to clearly illustrate changing ratios. Orange data labels atop each column display total values, while a concise legend decodes color mappings. The 2024 estimate column is rendered in a red hatch pattern to distinguish projected data from actuals.
Built on master slides, every element can be customized in seconds. Swap the green and red fills for your brand colors, adjust column widths, or modify percentage labels without breaking the layout. Vector-based shapes ensure crisp visuals at any resolution, whether on a projector, printed handout, or HD display. Gridlines and axis labels remain legible in any aspect ratio, and right-to-left language support makes this slide globally ready.
Intuitive grouping and descriptive layer names simplify edits—duplicate bars, add new data points, or conceal the 2024 estimate with a click. A hidden dark-mode variant preserves contrast in dim environments, while preconfigured entrance animations reveal each column or data series sequentially to guide audience focus.
Ideal for financial analysts, HR teams, and market researchers, this bar chart template empowers you to tell data-driven stories with clarity and impact. Whether you’re comparing survey results, tracking sales by gender, or presenting workforce diversity trends, this slide combines precision and polish to keep stakeholders engaged.
Who is it for
Financial analysts, marketing managers, and HR professionals will benefit from this slide when reporting demographic breakdowns, workforce diversity metrics, or survey results. Consultants and educators can also leverage its clear structure for teaching data visualization best practices.
Other Uses
Repurpose this layout for product segment comparisons, budget breakdowns, customer satisfaction surveys, or any scenario requiring stacked category analysis. Simply update segment labels, color mappings, and data values to suit your narrative.
Login to download this file

Item ID
SB03747
Related Templates

Multi-Series Stacked Bar Chart Template for PowerPoint & Google Slides
Bar/Column
Animated Stacked Bar Chart Template for PowerPoint & Google Slides
Bar/Column
Stacked Bar Chart for PowerPoint & Google Slides
Bar/Column
100% Stacked Bar Chart for PowerPoint & Google Slides
Bar/Column
Three-Year Bar Chart template for PowerPoint & Google Slides
Charts
Gender Comparison People Infographic Template for PowerPoint & Google Slides
Comparison
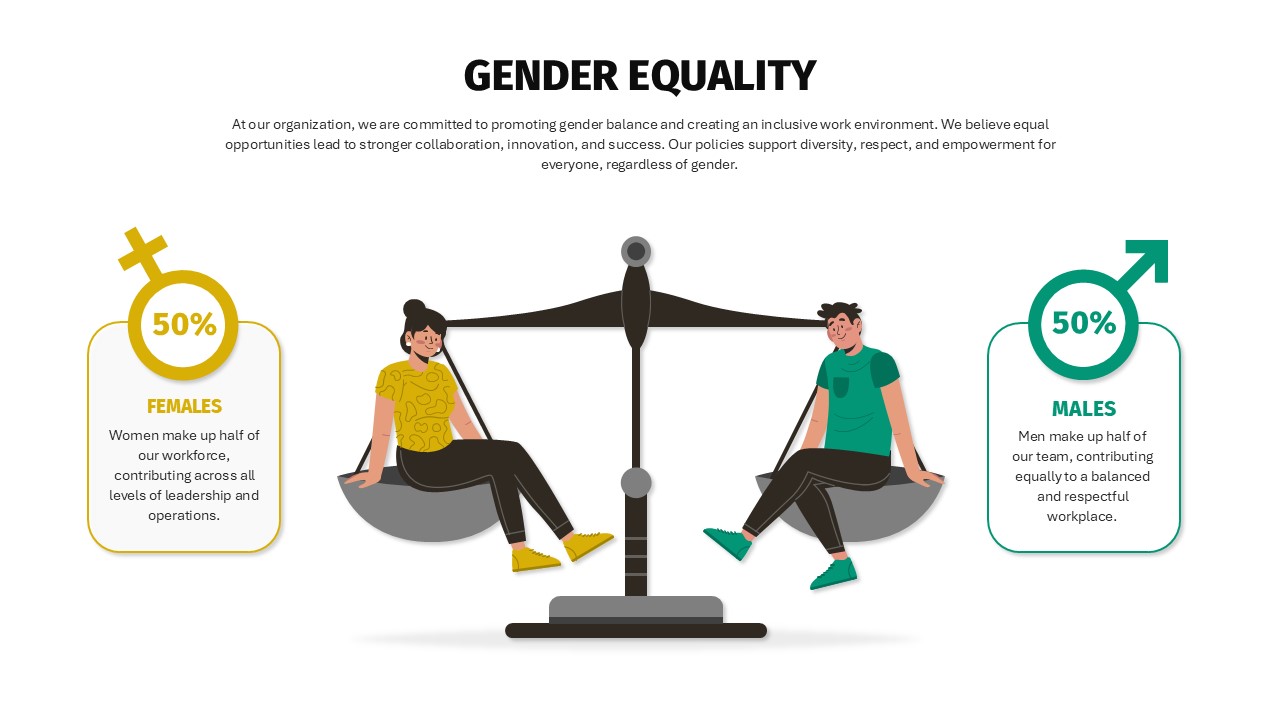
Balanced Gender Equality Scale Infographic Template for PowerPoint & Google Slides
Comparison
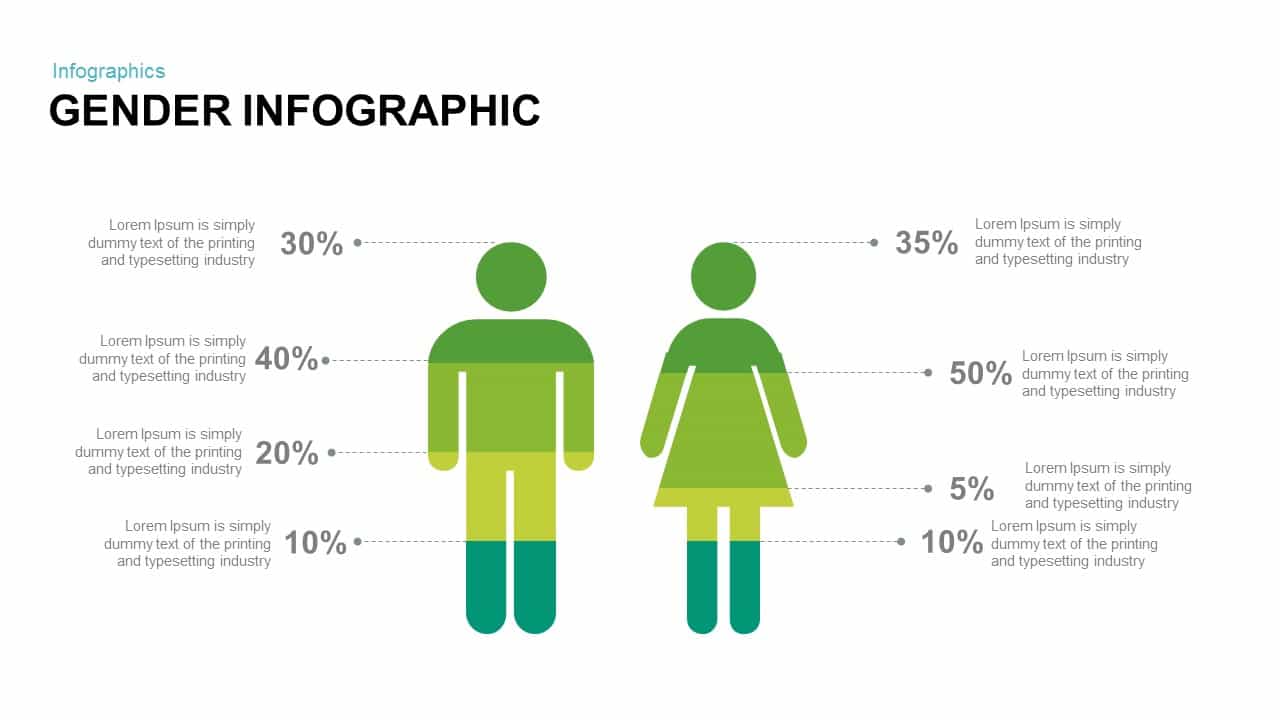
Gender Infographic for PowerPoint & Google Slides
Infographics
Free Stacked Column Chart Data Visualization Template for PowerPoint & Google Slides
Bar/Column
Free
Professional 100% Stacked Column Chart Template for PowerPoint & Google Slides
Bar/Column
Dynamic Three-Series Stacked Area Chart Template for PowerPoint & Google Slides
Comparison Chart
Stacked Waterfall Chart Template for PowerPoint & Google Slides
Bar/Column
Stacked Gantt Chart Timeline Slide Template for PowerPoint & Google Slides
Gantt Chart
Stacked Area Chart with Financial Highlights for PowerPoint & Google Slides
Finance
Year-over-Year Performance Comparison Template for PowerPoint & Google Slides
Comparison Chart
3D Stacked Infographic Layers Data Template for PowerPoint & Google Slides
Pyramid

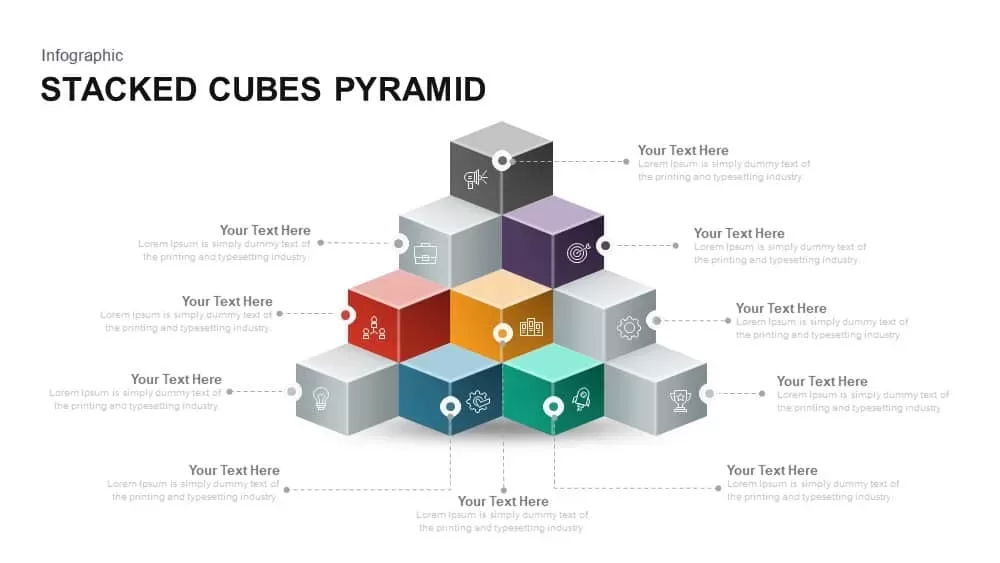
Stacked Cubes Pyramid Infographic Template for PowerPoint & Google Slides
Pyramid
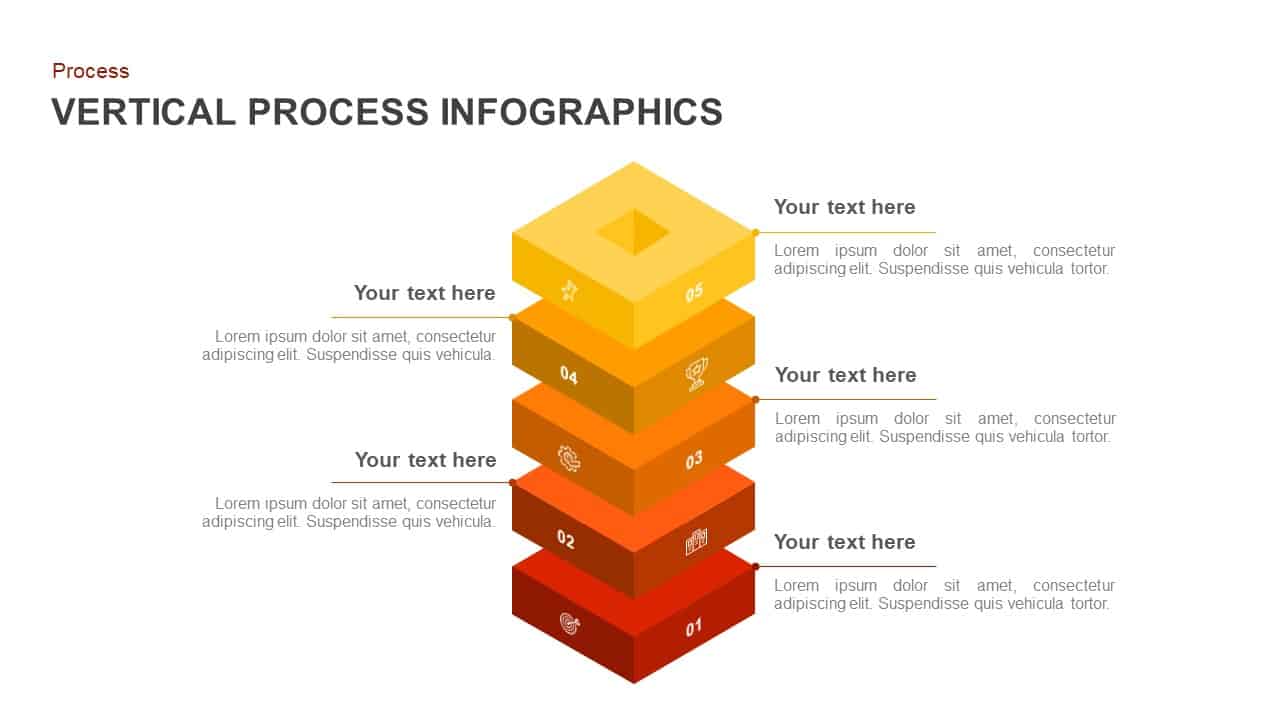
Vertical Stacked Process Infographic Template for PowerPoint & Google Slides
Process
Stacked Cubes Pyramid Six-Option Diagram Template for PowerPoint & Google Slides
Pyramid
Elegant Stacked Photo Collage Layout Template for PowerPoint & Google Slides
Graphics
Bar Chart Sample template for PowerPoint & Google Slides
Bar/Column
Creative Data Analysis Bar Chart template for PowerPoint & Google Slides
Bar/Column
3D Bar Chart Data Infographics Template for PowerPoint & Google Slides
Bar/Column
Creative Bar Chart template for PowerPoint & Google Slides
Charts
Comparison Bar Chart template for PowerPoint & Google Slides
Comparison Chart
3D Cylinder Bar Chart Template for PowerPoint & Google Slides
Bar/Column
Pencil Bar Chart Data Analysis Template for PowerPoint & Google Slides
Bar/Column

Monthly Reports Bar Chart template for PowerPoint & Google Slides
Bar/Column

Colorful Radial Bar Chart Template for PowerPoint & Google Slides
Bar/Column
Interactive Product Comparison Bar Chart Template for PowerPoint & Google Slides
Bar/Column
For and Against Vote Count Bar Chart Template for PowerPoint & Google Slides
Bar/Column
Entertainment Industry Revenue Bar Chart Template for PowerPoint & Google Slides
Bar/Column
Distracting Factors at Work Bar Chart Template for PowerPoint & Google Slides
Bar/Column
Statistics Infographic & KPI Bar Chart Template for PowerPoint & Google Slides
Bar/Column
Monthly Recurring Revenue KPI Bar Chart Template for PowerPoint & Google Slides
Bar/Column
Combination Bar and Line Chart Template for PowerPoint & Google Slides
Bar/Column
Animated Clustered Bar Chart Template for PowerPoint & Google Slides
Bar/Column
Simple Bar Chart Data Visualization Template for PowerPoint & Google Slides
Bar/Column
Clustered Bar Chart Comparison Template for PowerPoint & Google Slides
Bar/Column
Waterfall Bar Chart Analysis Template for PowerPoint & Google Slides
Bar/Column
Timeline Comparison Slide PowerPoint Template
Comparison Chart
Mirror Bar Chart Comparison Template for PowerPoint & Google Slides
Bar/Column
Dynamic Bar-of-Pie Chart Comparison Template for PowerPoint & Google Slides
Pie/Donut
Expanding Margins Analysis Bar Chart Template for PowerPoint & Google Slides
Charts
Quarterly Revenue Comparison Bar Chart Template for PowerPoint & Google Slides
Bar/Column
Quarterly Sales Review Bar Chart Template for PowerPoint & Google Slides
Bar/Column
Data Analysis Bar Chart with Insights Template for PowerPoint & Google Slides
Bar/Column
Free
Horizontal Bar Chart Slide with Icons Template for PowerPoint & Google Slides
Bar/Column
Two-Option Bar Chart Comparison Table Template for PowerPoint & Google Slides
Comparison
Bar Gantt Chart Template for PowerPoint & Google Slides
Gantt Chart
USA Map with Bar Chart Template for PowerPoint & Google Slides
World Maps
Sales Bar Chart for PowerPoint & Google Slides
Bar/Column
Bar Data Chart Slide for PowerPoint & Google Slides
Bar/Column

Radial Bar Chart Diagram for PowerPoint & Google Slides
Bar/Column
Minimal Multi-Year Column Chart Template for PowerPoint & Google Slides
Bar/Column
Half Year Gantt Chart Templat for PowerPoint & Google Slides
Gantt Chart
3D Cylinder Bar Chart Visualization Template for PowerPoint
Bar/Column
Free New Year’s Resolution Slides Pack for PowerPoint & Google Slides 2023
Graphics
Free
3D Bar Graph Infographic Template for PowerPoint & Google Slides
Bar/Column
Five-Stage Vertical Bar Process Template for PowerPoint & Google Slides
Process
Progress Timeline Bar PowerPoint Template
Timeline
Progress Bar and Milestone Visualization Template for PowerPoint & Google Slides
Timeline

Blank Bar Graph Template for PowerPoint & Google Slides
Bar/Column
Progress Bar Graph Layout Design for PowerPoint & Google Slides
Charts
Progress Bar Infographic for PowerPoint & Google Slides
Business
Progress Bar infographic pack for PowerPoint & Google Slides
Business
Five Options Business Bar Graph for PowerPoint & Google Slides
Business Report
Multi-Year Timeline Infographic Template for PowerPoint & Google Slides
Timeline
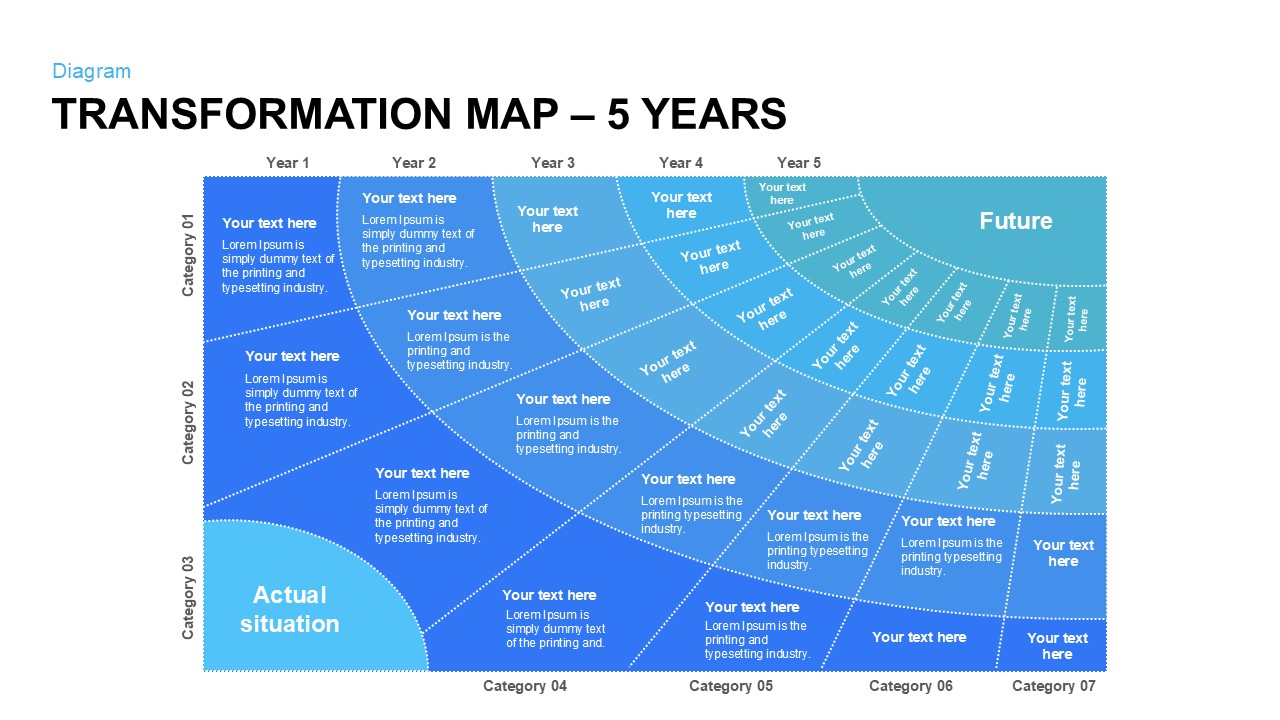
Five-Year Transformation Map Diagram Template for PowerPoint & Google Slides
Process
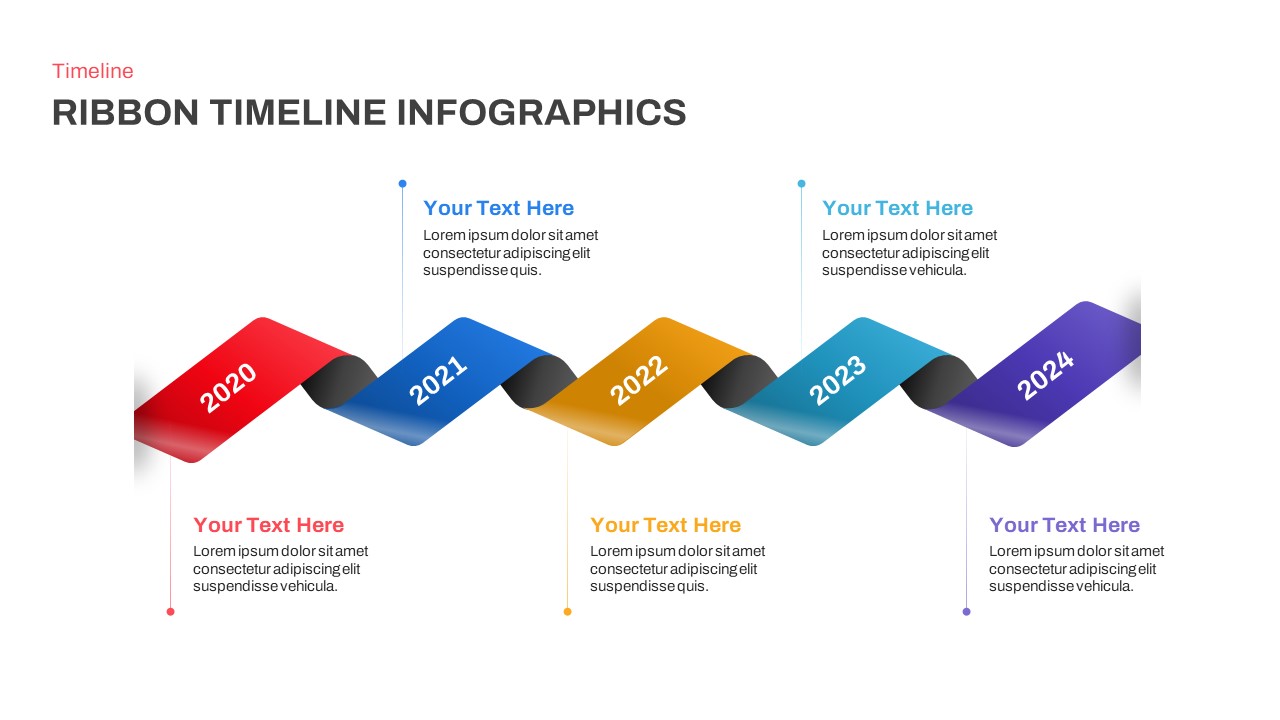
Five-Year Ribbon Timeline Diagram Template for PowerPoint & Google Slides
Timeline
Five-Year Gradient Timeline Infographic Template for PowerPoint & Google Slides
Timeline
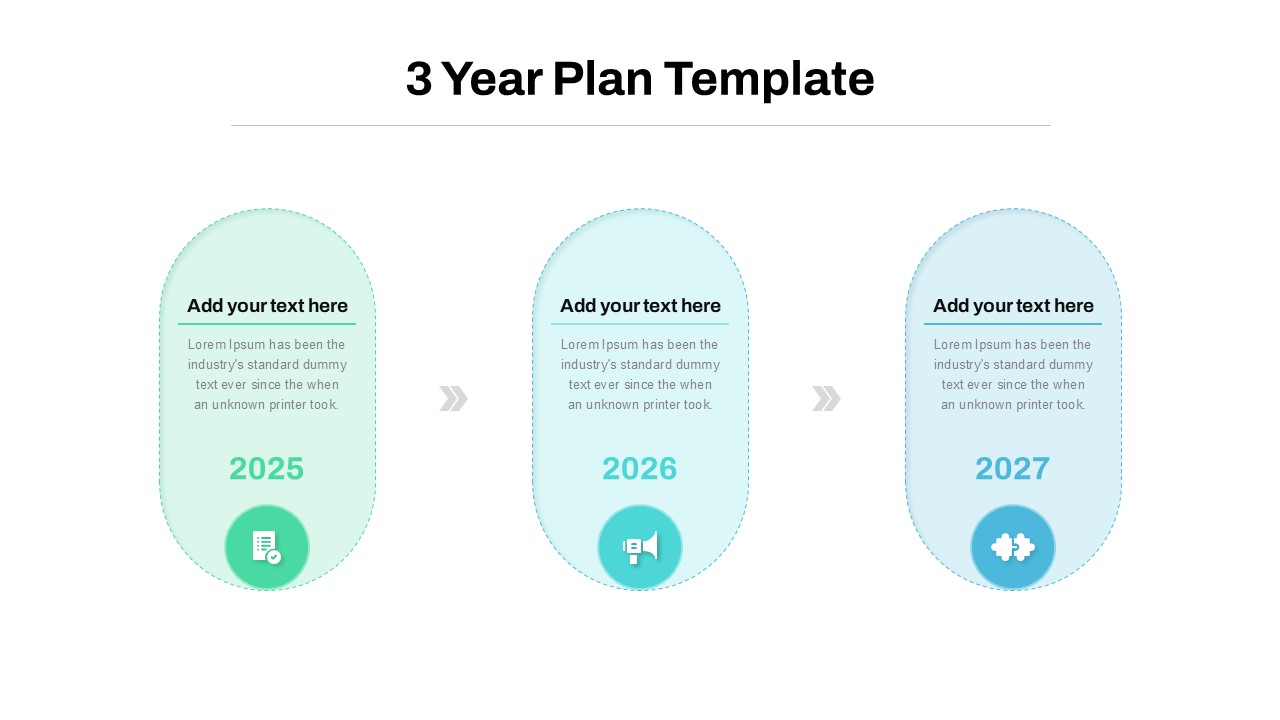
3 Year Strategic Plan Template for PowerPoint & Keynote
Timeline
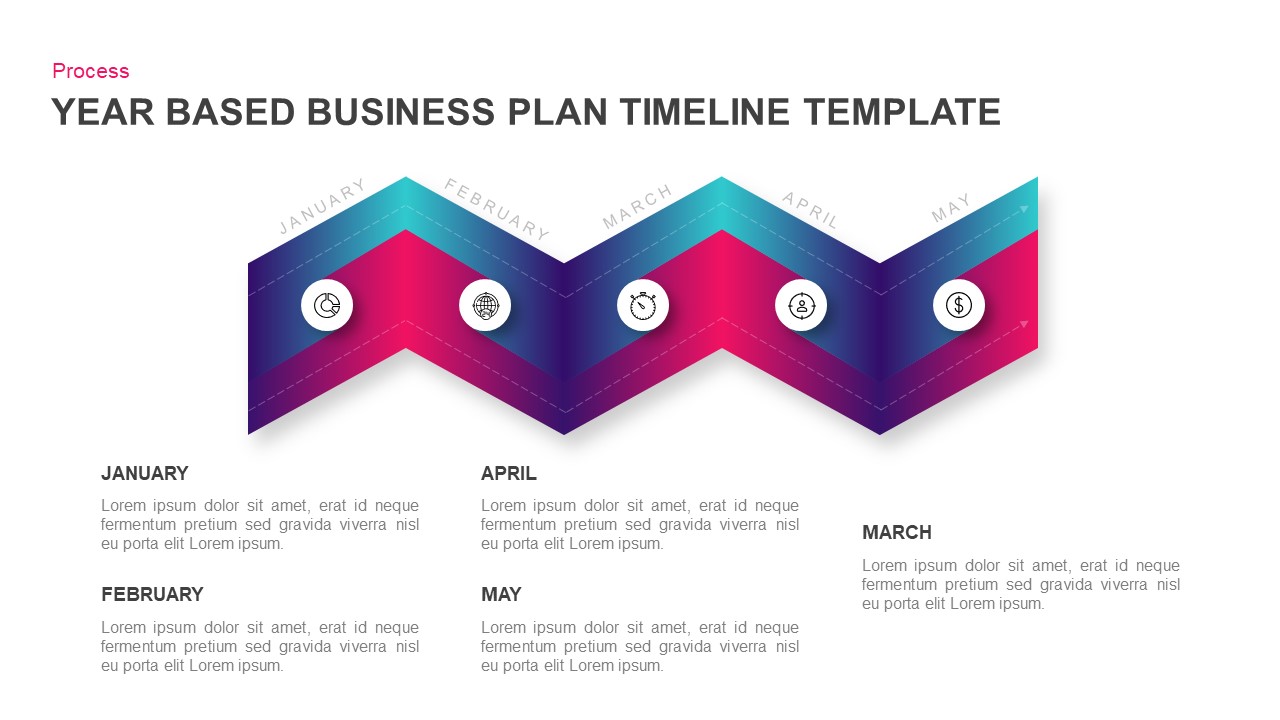
Year-Based Business Plan Zigzag Timeline Template for PowerPoint & Google Slides
Business Plan
3 Year Strategic Plan PowerPoint template And Slides
Timeline
Colorful Four-Year Timeline Layout Template for PowerPoint & Google Slides
Timeline
Colorful Five-Year Timeline Layout Template for PowerPoint & Google Slides
Timeline

Free Multi-Year Arrow Timeline Infographic Template for PowerPoint & Google Slides
Timeline
Free
Free Elegant Happy New Year Greeting Slide Template for PowerPoint & Google Slides
Graphics
Free
Milestone Timeline with Year Markers Template for PowerPoint & Google Slides
Timeline
Three-Year Vertical Milestone Timeline Template for PowerPoint & Google Slides
Timeline
Three-Year Project Roadmap Timeline Template for PowerPoint & Google Slides
Timeline
5 Year Timeline Template for PowerPoint & Google Slides
Timeline
Five-Year Plan Timeline Diagram Template for PowerPoint & Google Slides
Timeline
Multi-Year S-Shaped Roadmap Timeline Template for PowerPoint & Google Slides
Timeline
Three-Year Plan Timeline Diagram Template for PowerPoint & Google Slides
Timeline
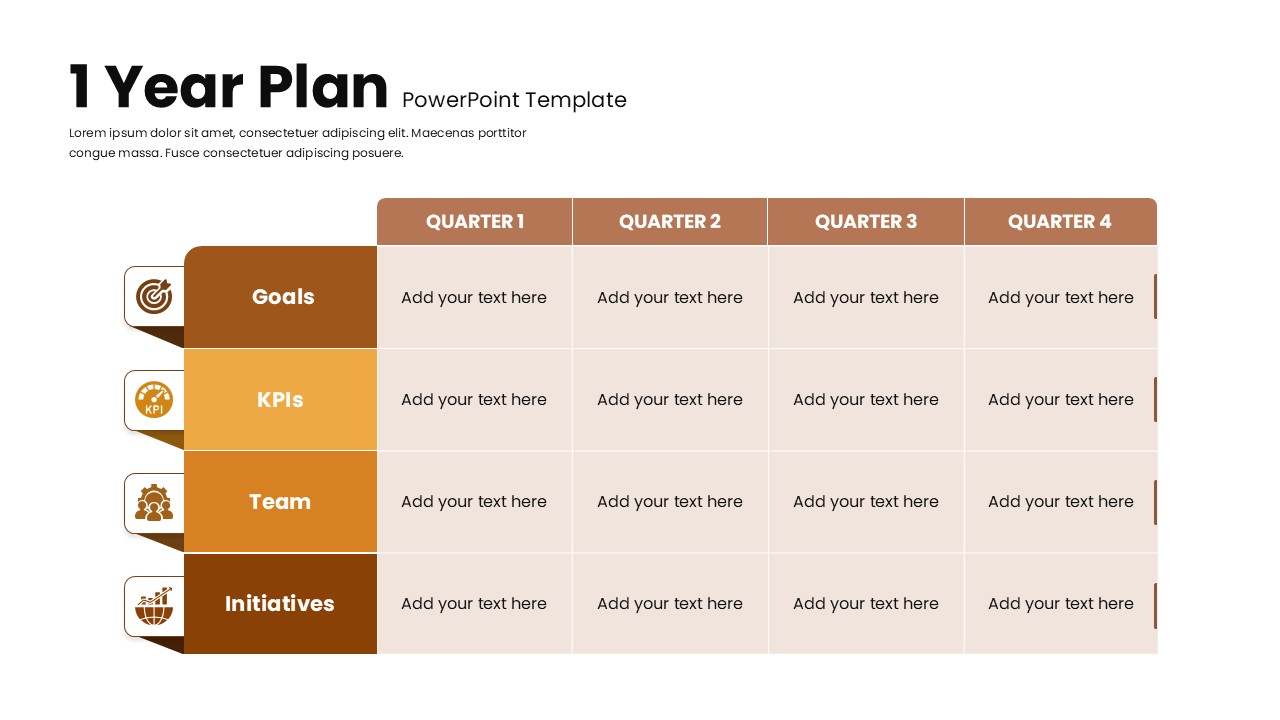
1 Year Plan Overview template for PowerPoint & Google Slides
Business Plan
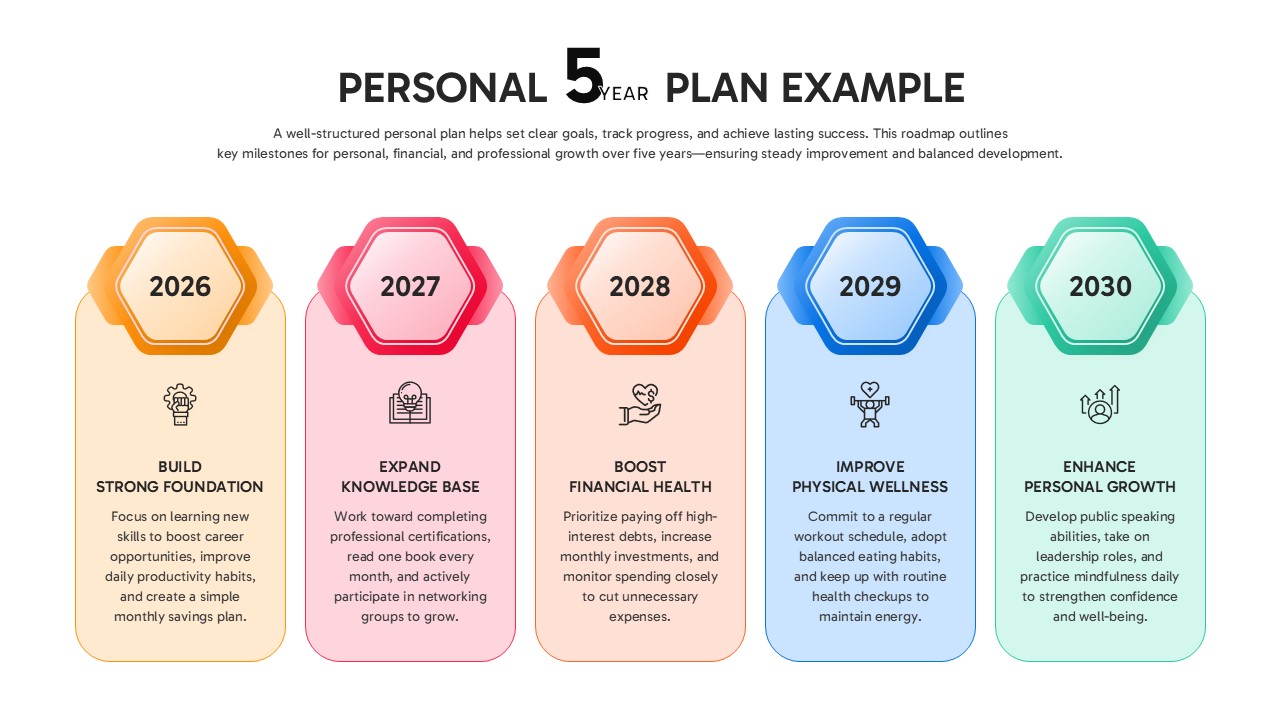
Personal 5-Year Roadmap Plan Example Template for PowerPoint & Google Slides
Timeline
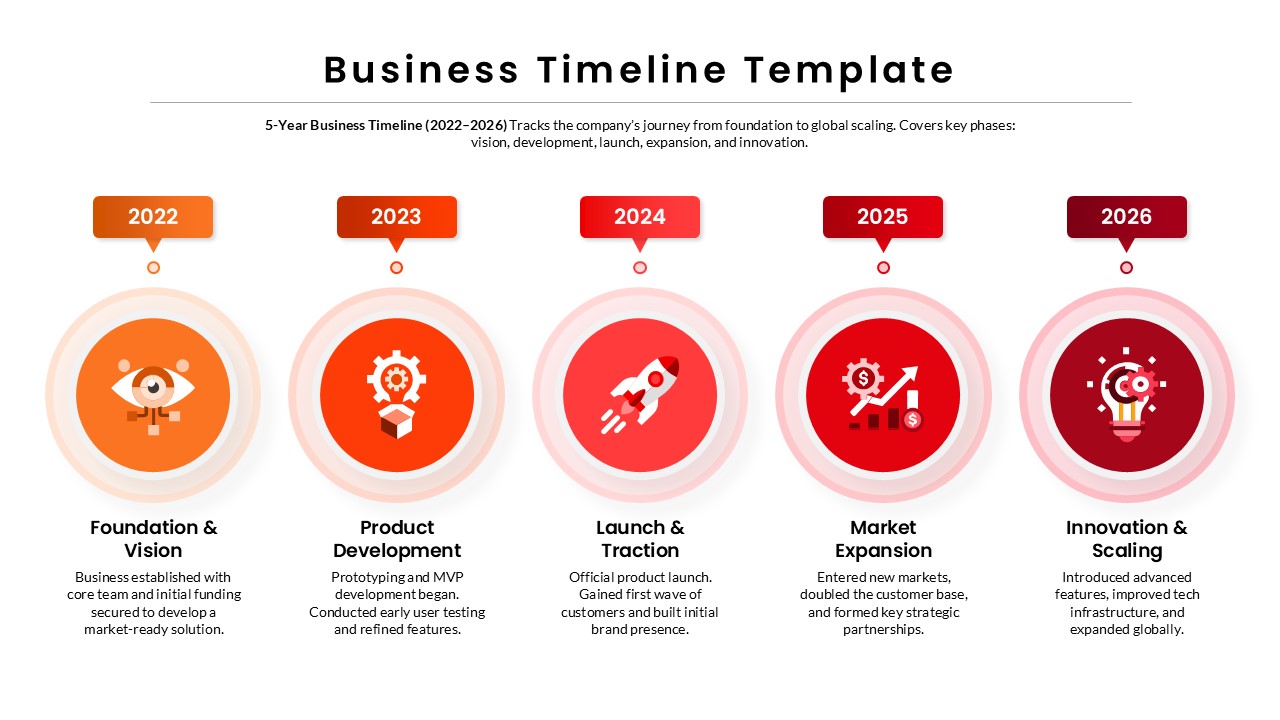
5-Year Business Timeline Template for PowerPoint & Google Slides
Timeline
End of Year Review Dashboard Template for PowerPoint & Google Slides
Business Report
Year in Review KPI Highlights Slide for PowerPoint & Google Slides
Business Report
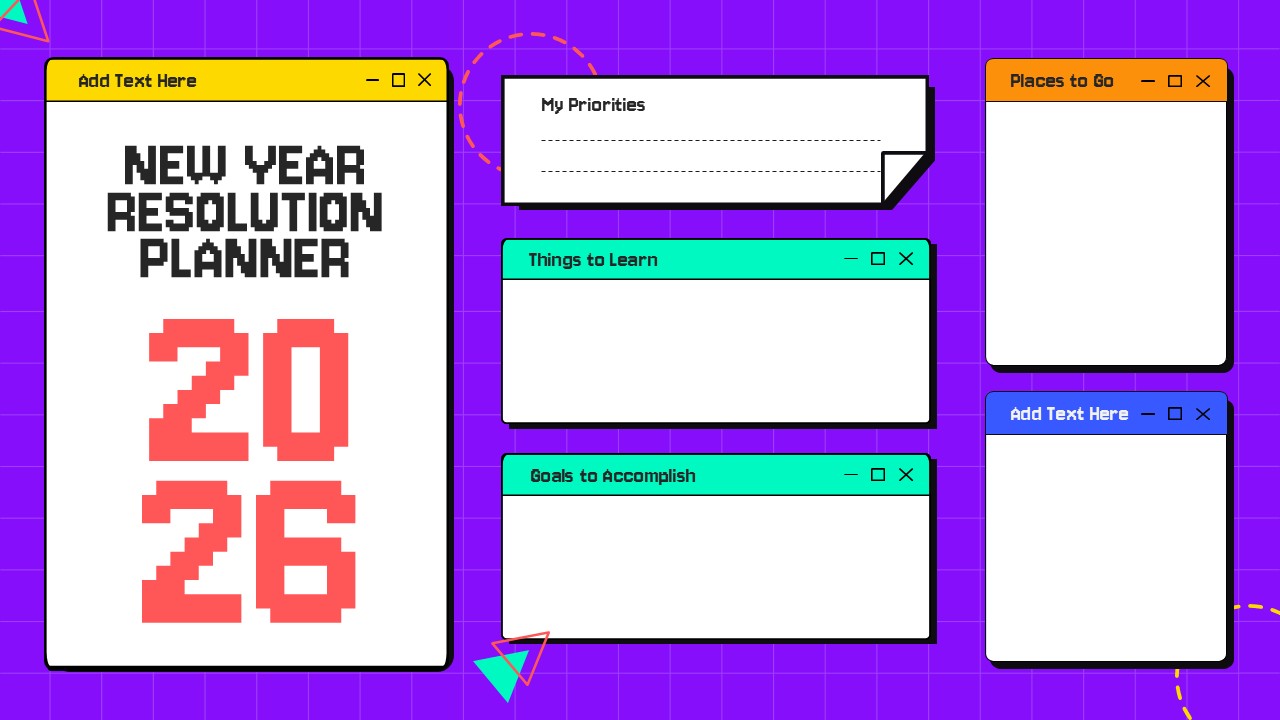
Creative New Year Resolution Planner for PowerPoint & Google Slides
Leadership
Free
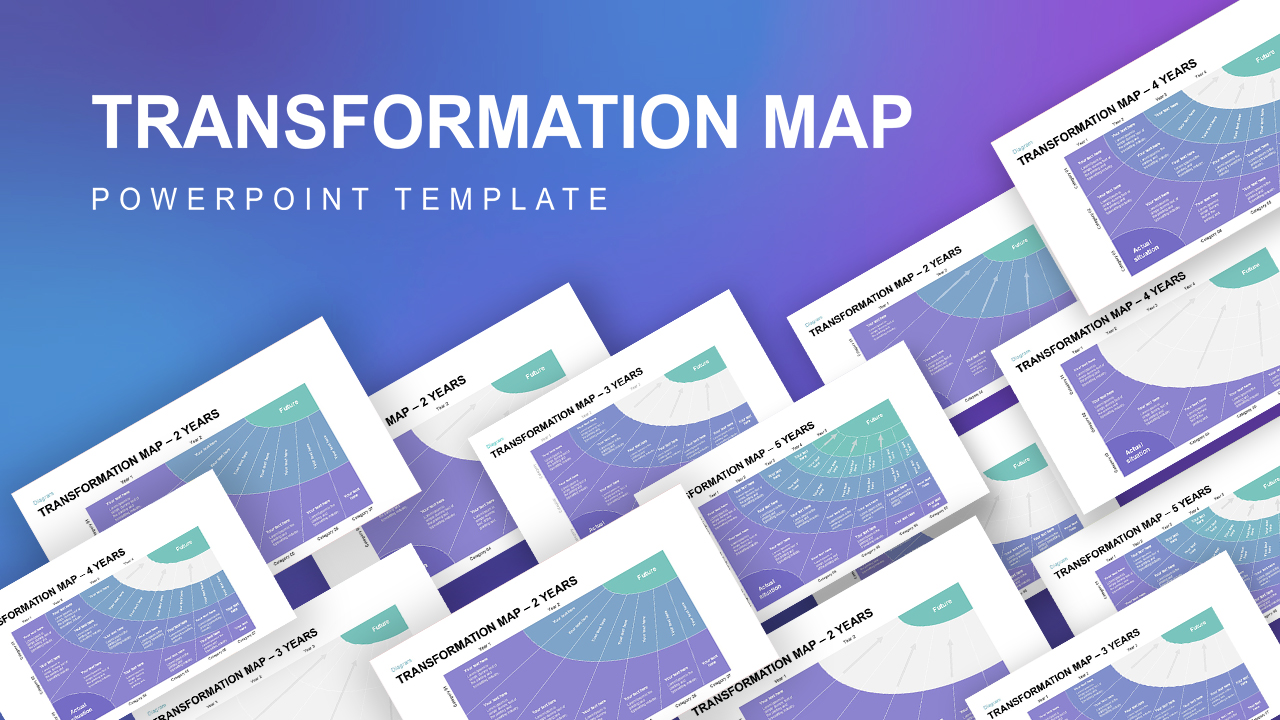
2, 3, 4, 5 Year Transformation Map PowerPoint Template
Happy New Year 2025 PowerPoint Template
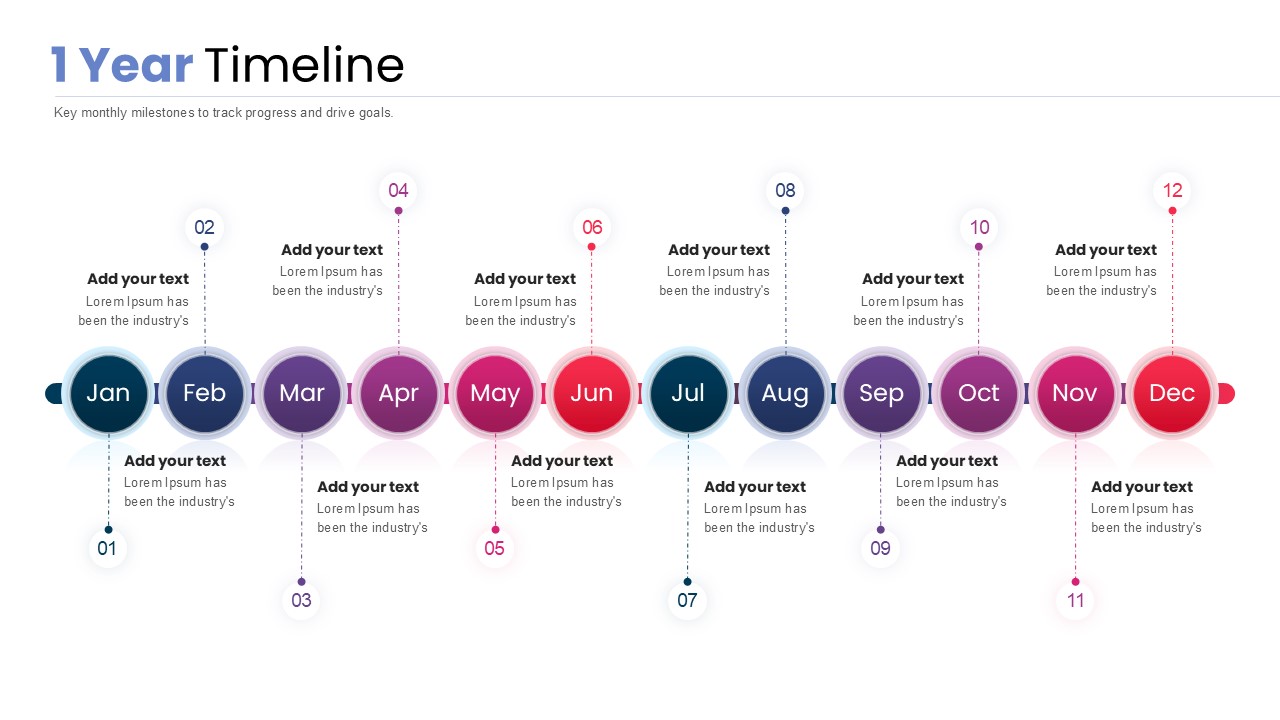
1 Year Timeline PowerPoint Template
Timeline
Quad Chart Infographic Pack of 8 Slides Template for PowerPoint & Google Slides
Comparison Chart
Free Professional Gantt Chart Pack – 4 Slides Template for PowerPoint & Google Slides
Gantt Chart
Free
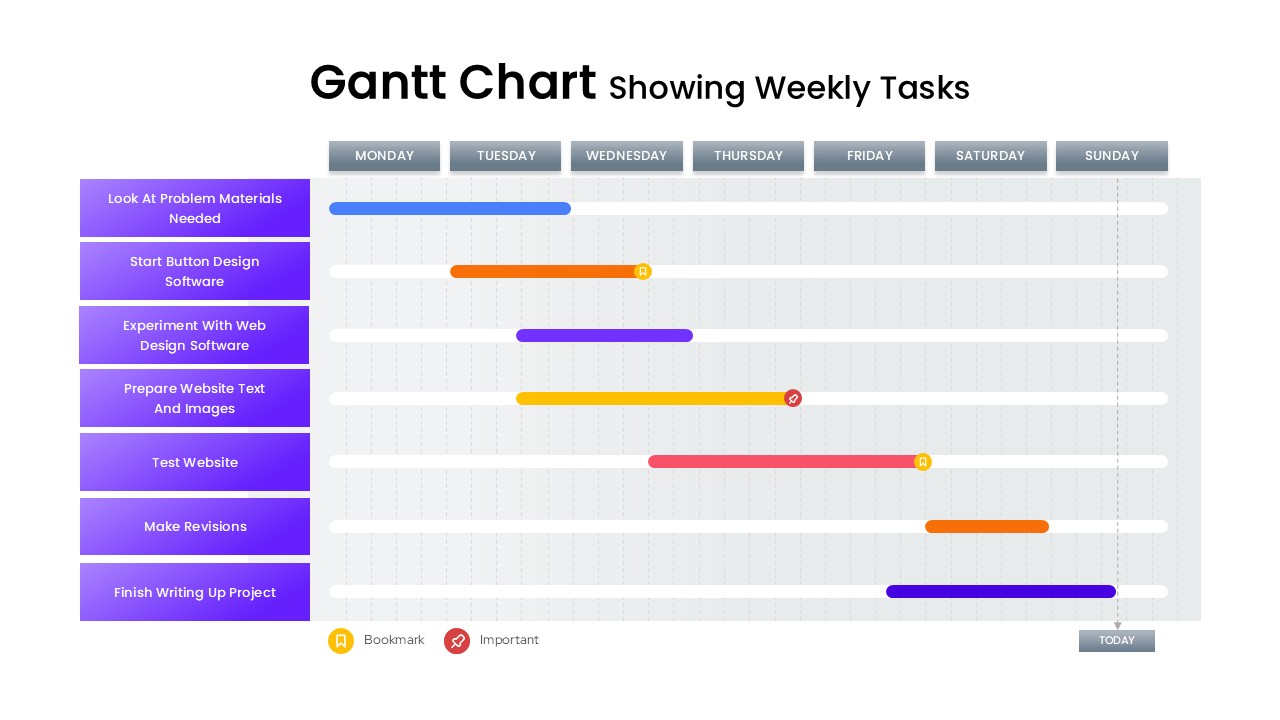
Gantt Chart Template Showing Weekly Tasks Template for PowerPoint & Google Slides
Gantt Chart
Vertical Split Flow Chart Diagram Template for PowerPoint & Google Slides
Flow Charts
Modern Image-Based Organizational Chart Template for PowerPoint & Google Slides
Infographics
Quarterly Gantt Chart with Today Marker Template for PowerPoint & Google Slides
Gantt Chart