


Statistics PowerPoint Templates & Keynotes
Present your data using our massive collection of statistics powerpoint templates. All charts are designed to present your numbers with accuracy and clarity. The statistics powerpoint templates are extremely easy to edit as the templates are made with 100% editable vectors. Change graphs and charts to illustrate your data. All templates work with powerpoint templates, keynotes, and google slides. Download the templates and make your presentations stand out!
![]() Filter
Filter
Filter
-

Circle Graph Data Visualization Template for PowerPoint & Google Slides
Circular
-

3D Spheres Fill Level Infographic Deck Template for PowerPoint & Google Slides
Comparison
-

3D Cylinder Bar Chart Visualization Template for PowerPoint
Bar/Column
-

Radial Bar Chart Diagram for PowerPoint & Google Slides
Bar/Column
-

Website Performance Dashboard template for PowerPoint & Google Slides
Charts
-
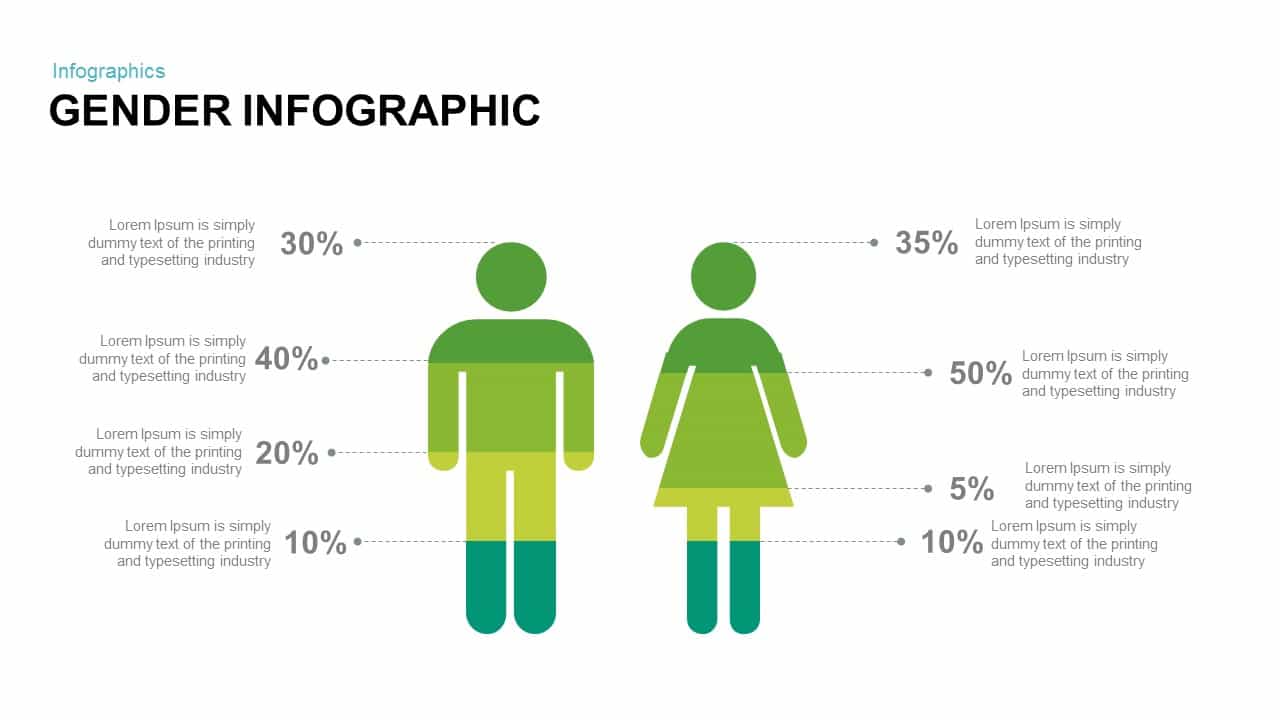
Gender Infographic for PowerPoint & Google Slides
Infographics
-

Business Dashboard Analytics & KPIs Template for PowerPoint & Google Slides
Bar/Column
-

Data Analytics Dashboard Design template for PowerPoint & Google Slides
Bar/Column
-

Curved Line Graph for PowerPoint & Google Slides
Timeline
-
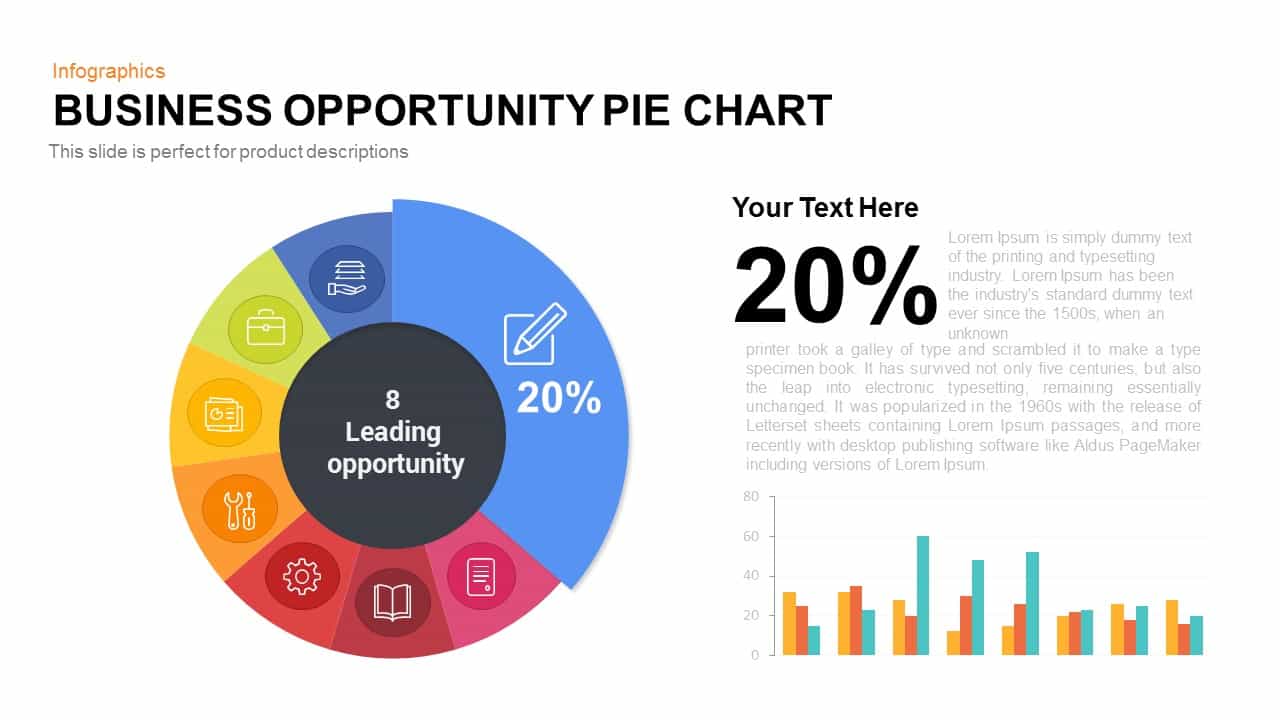
Business Opportunity Pie Chart Template for PowerPoint & Google Slides
Pie/Donut
-

Pencil Bar Chart Data Analysis Template for PowerPoint & Google Slides
Bar/Column
-

Five 3D Growth Arrow Infographic Slide Template for PowerPoint & Google Slides
Arrow
-

3D Cylinder Bar Chart Template for PowerPoint & Google Slides
Bar/Column
-
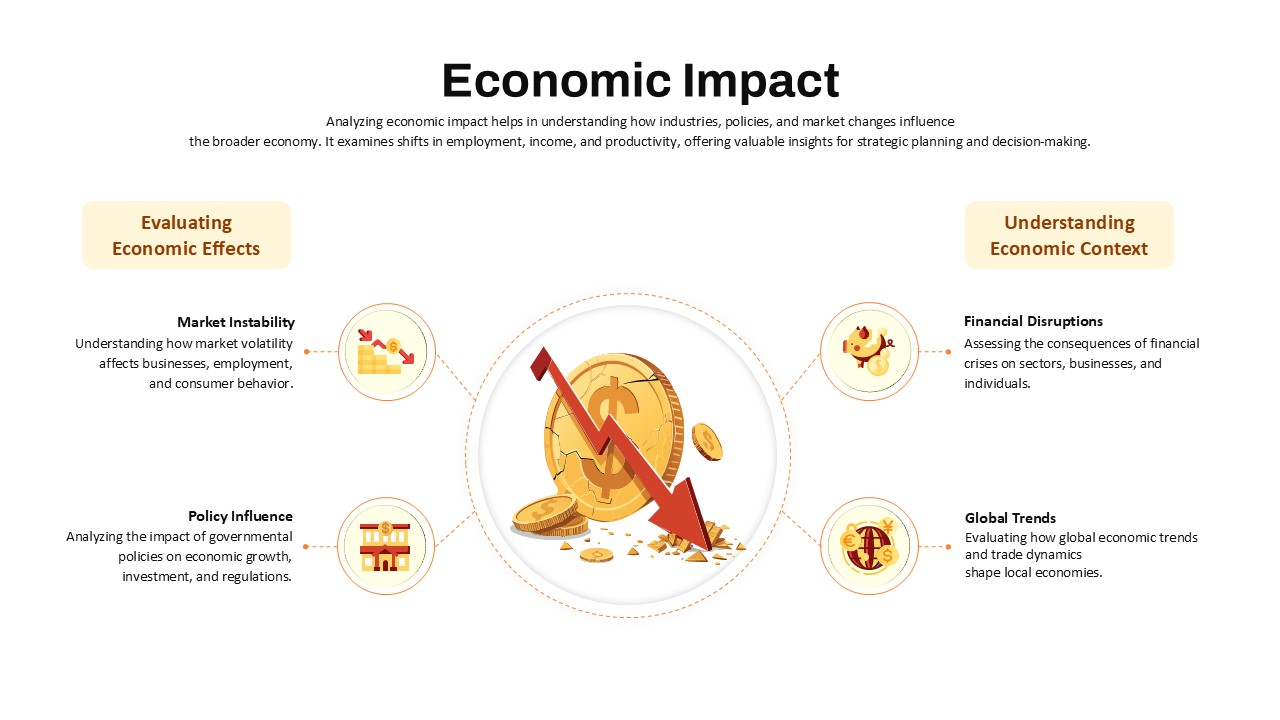
Economic Impact Assessment template for PowerPoint & Google Slides
Business Report
-

Professional Animated Sales Presentation Template for PowerPoint & Google Slides
Pitch Deck
-

Financial Snapshot & Metrics Overview Template for PowerPoint & Google Slides
Finance
-

Free Infographic Statistics Dashboard Slide for PowerPoint & Google Slides
Bar/Column
Free
-

Dynamic Sunburst Chart Visualization Template for PowerPoint & Google Slides
Charts
-
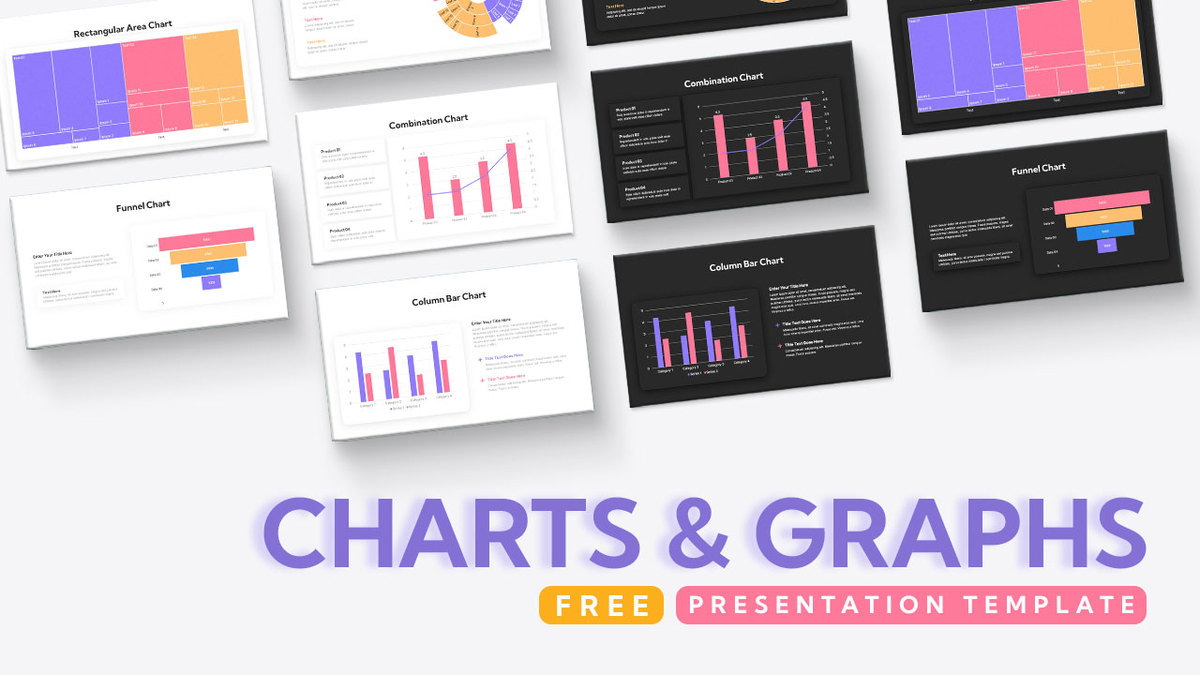
Free Comprehensive Charts & Graphs Template for PowerPoint & Google Slides
Charts
Free
-

Year-over-Year Stacked Gender Bar Chart Template for PowerPoint & Google Slides
Bar/Column
-
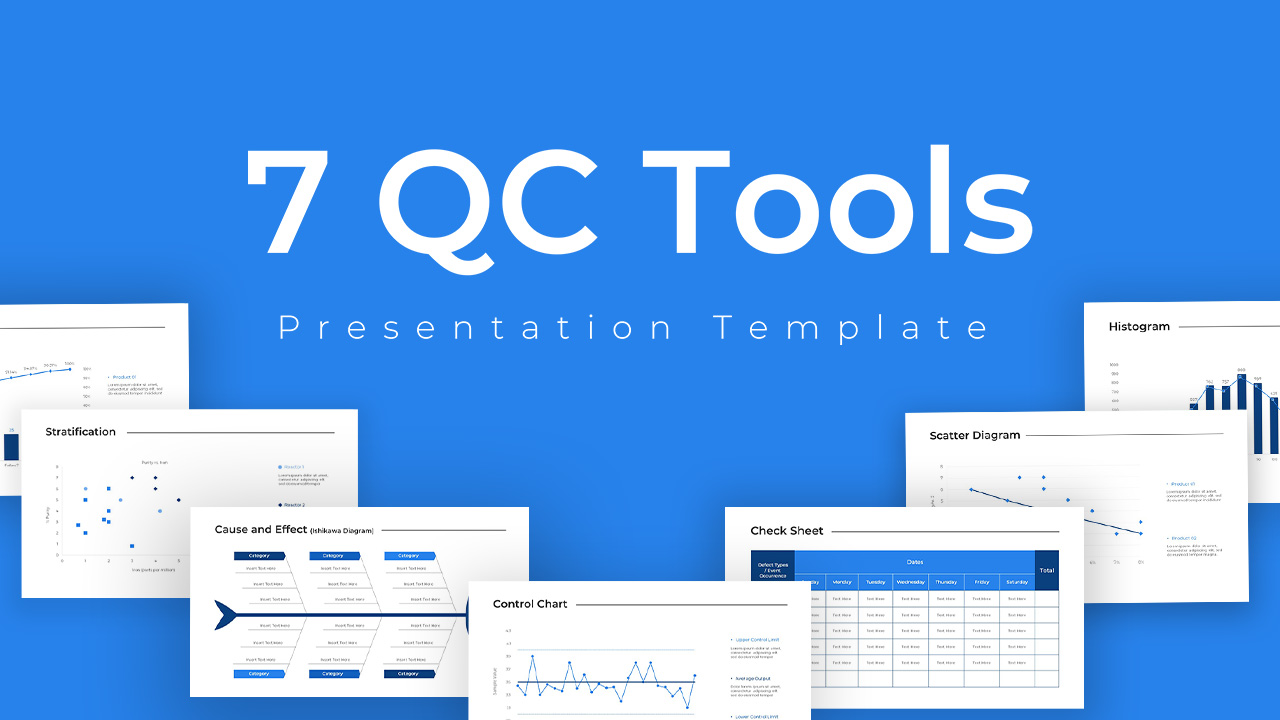
Seven Quality Control Tools Diagram Template for PowerPoint & Google Slides
Decks
-

Rectangle Area Chart with Gradient Fill Template for PowerPoint & Google Slides
Comparison Chart
-

Grouped Column Chart Comparison Template for PowerPoint & Google Slides
Bar/Column
-

Data Over Timeline Chart Template for PowerPoint
Charts
-

Minimal Multi-Year Column Chart Template for PowerPoint & Google Slides
Bar/Column
-

Simple Bar Chart Data Visualization Template for PowerPoint & Google Slides
Bar/Column
-

Clustered Column Chart Template for PowerPoint & Google Slides
Bar/Column
-

Clustered Bar Chart Comparison Template for PowerPoint & Google Slides
Bar/Column
-

Animated Stacked Bar Chart Template for PowerPoint & Google Slides
Bar/Column
-

Waffle Chart Data Visualization Template for PowerPoint & Google Slides
Comparison Chart
-

Dynamic Statistics & Progress Charts Template for PowerPoint & Google Slides
Pie/Donut
-

Statistics Infographic Template for PowerPoint and Google Slides
Bar/Column
-
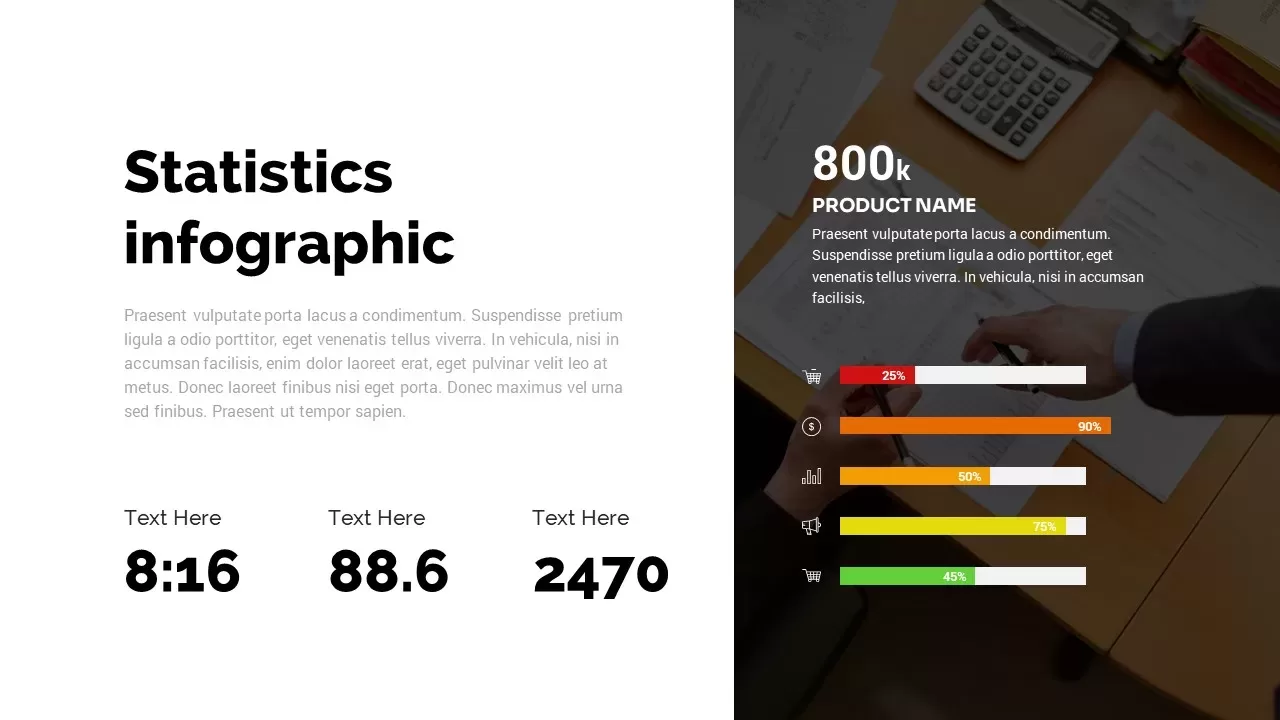
Statistics Infographic Template for PowerPoint & Google Slides
Infographics
-

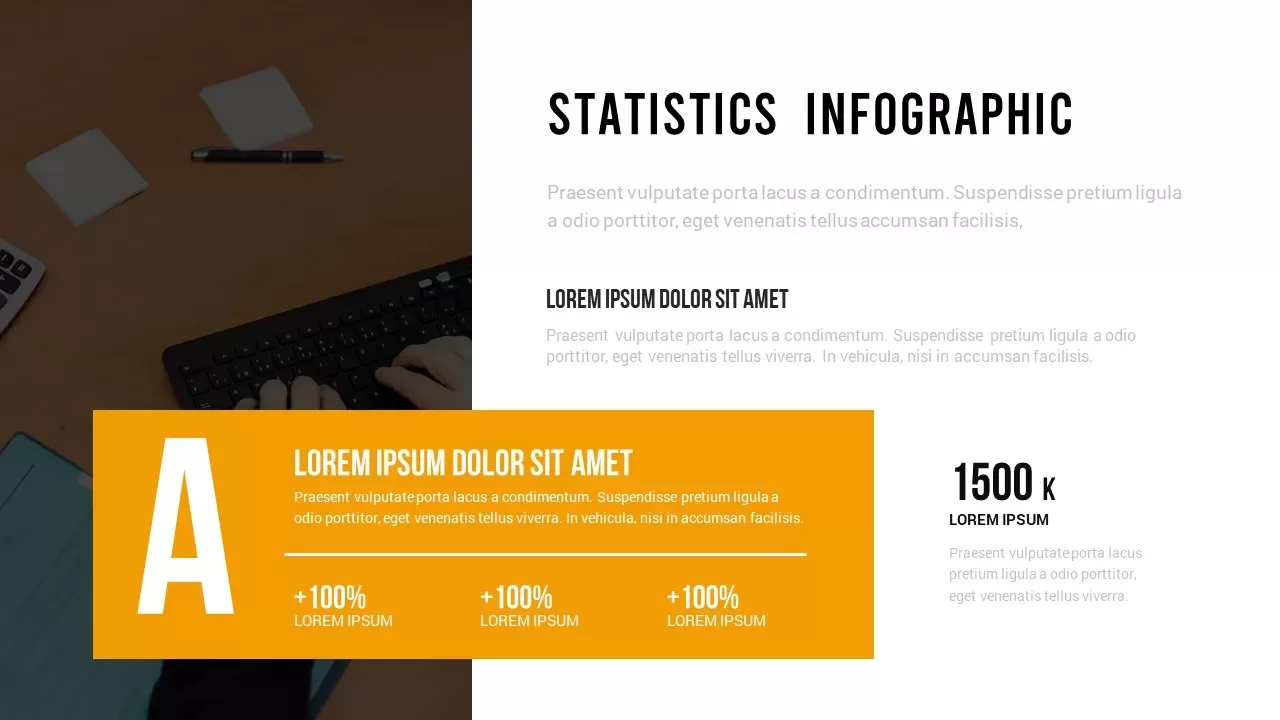
Statistics Infographic & KPI Bar Chart Template for PowerPoint & Google Slides
Bar/Column
-
Statistic Infographic Template
Bar/Column