Sample Bar Chart PowerPoint Template


Sample Bar Chart PowerPoint Template
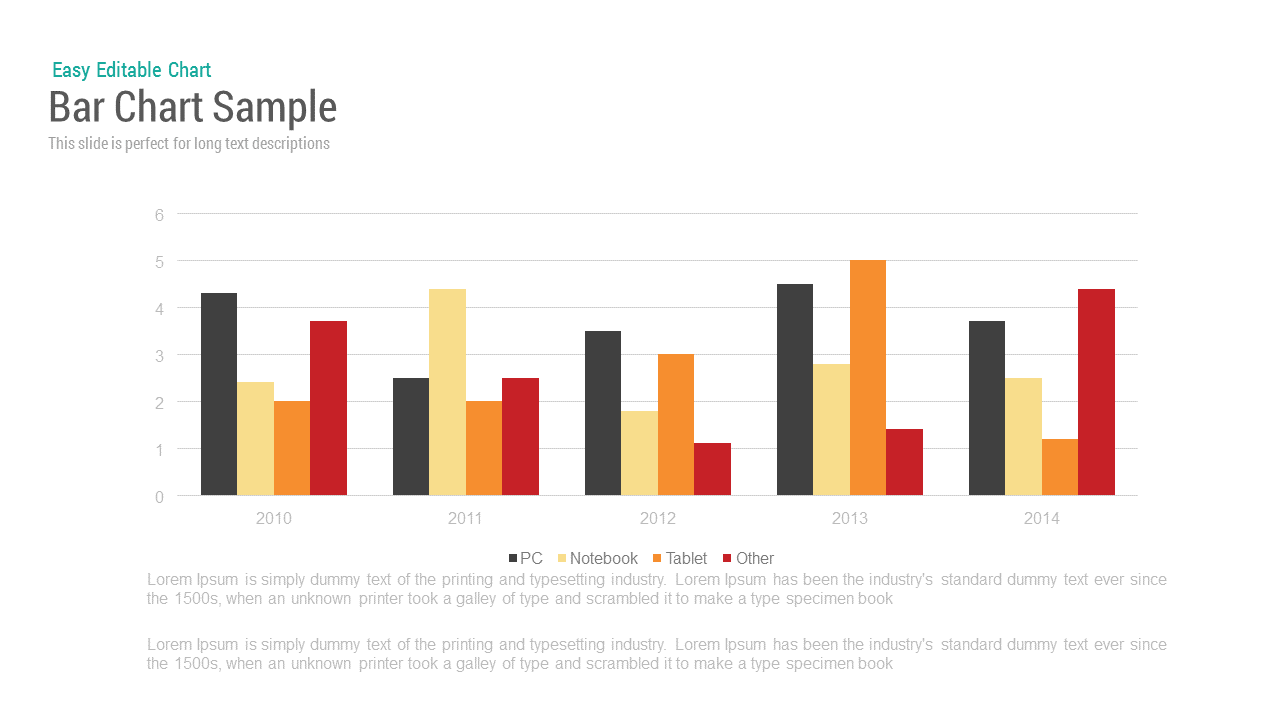
Sample bar chart PowerPoint template is created for the statistical representation of information that is useful for the easy learning of an analytical report. The clustered bar chart PowerPoint template contains four bars in each cluster. The height of the bars is generally proportional to the value of the data. This bar chart sample template can be used to make splendid presentations in PowerPoint and present data while maintaining the spectators focused in your performance. This can be edited to make sales presentations. The distinct design makes them stand out against the black and white background. The graphics are designed to eye-catching. They present a professional design that is ideal for formal business and research presentations.
Using the bar chart PowerPoint template, different statistical data can be presented. It is ideal for the presentation of either sales projections or historical sales data. This template can be used to examine diverse fiscal information, for the resolutions of making important business choices. The users can edit the features of this PowerPoint template, change color combination reshape the bars, are some of the few.
Sample bar chart template is commonly used when you need to represent data or make comparisons. It has X and Y axis, while one axis shows the categories, other shows the value associated to it. Bar Chart are mostly rectangular bars on a graph displayed either horizontally or vertically and the length of the bars vary depending on the values. This group bar chart sample has more than two bars which show comparison amongst more than one category. You can add in the necessary details, text and prepare a slide to show revenue gained or lost over a period of time, company performance, product sale, business growth etc. Bar Chart used during a meeting will add value to your presentations; the template is having both keynote and PowerPoint version.
Login to download this file

Item ID
SB00002
Related Templates

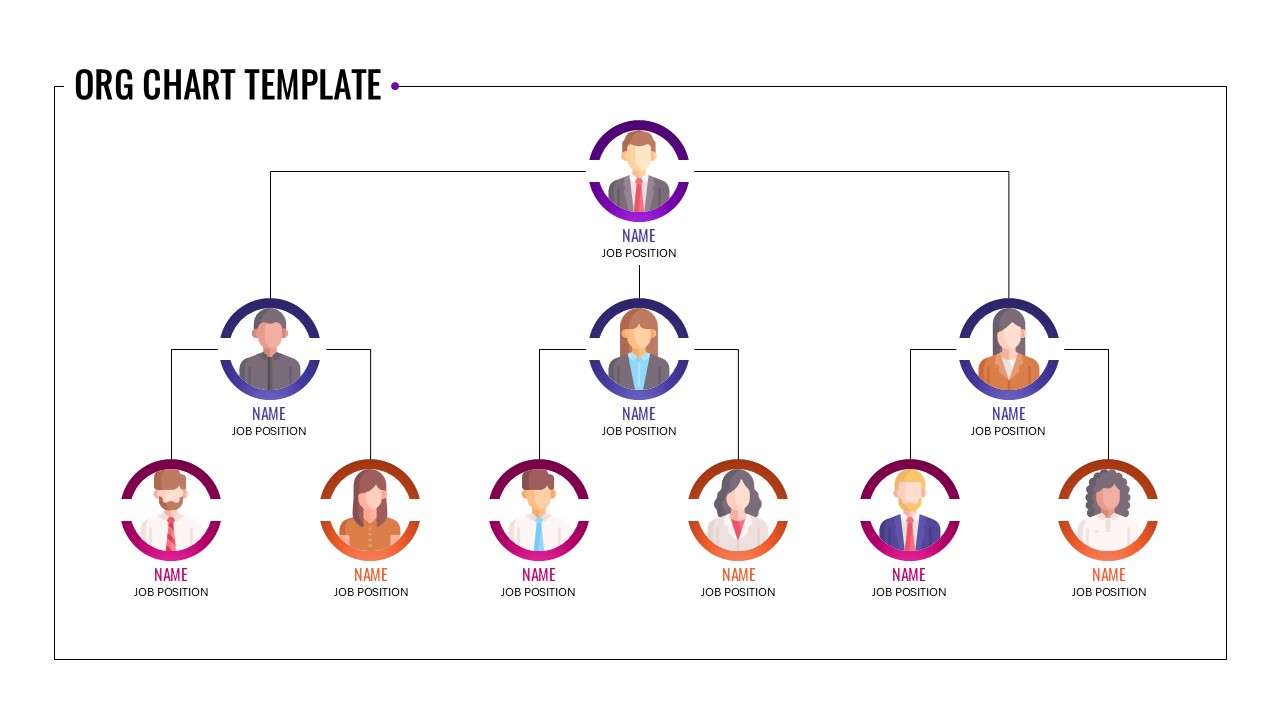
Circular Sample Org Chart Template for PowerPoint & Google Slides
Org Chart
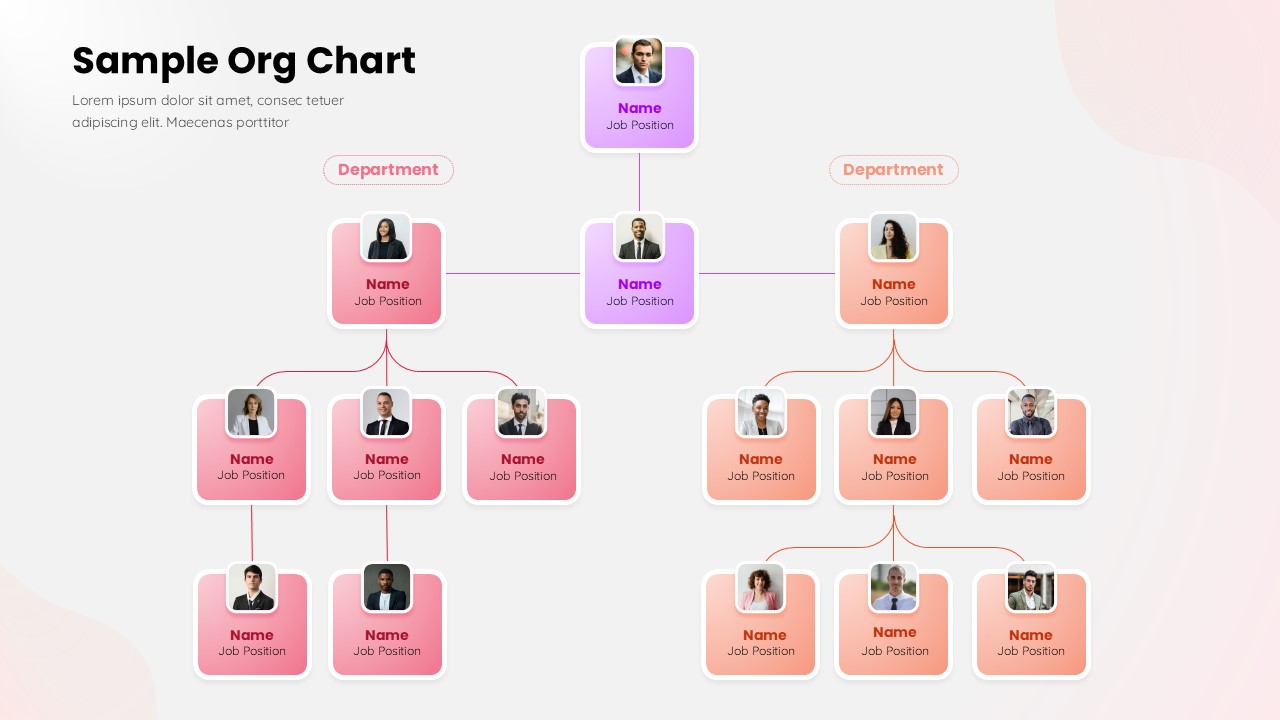
Sample Org Chart Template for PowerPoint & Google Slides
Org Chart
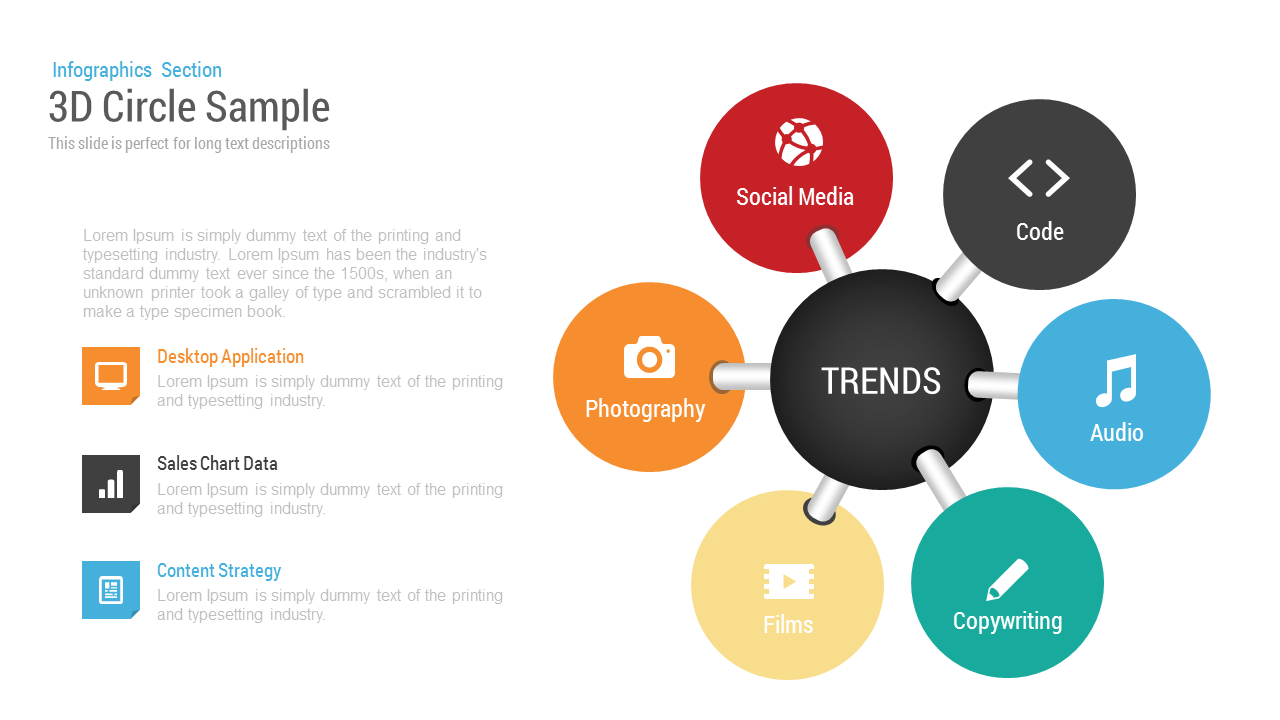
3D Circle Sample Editable Slide Template for PowerPoint
Circular
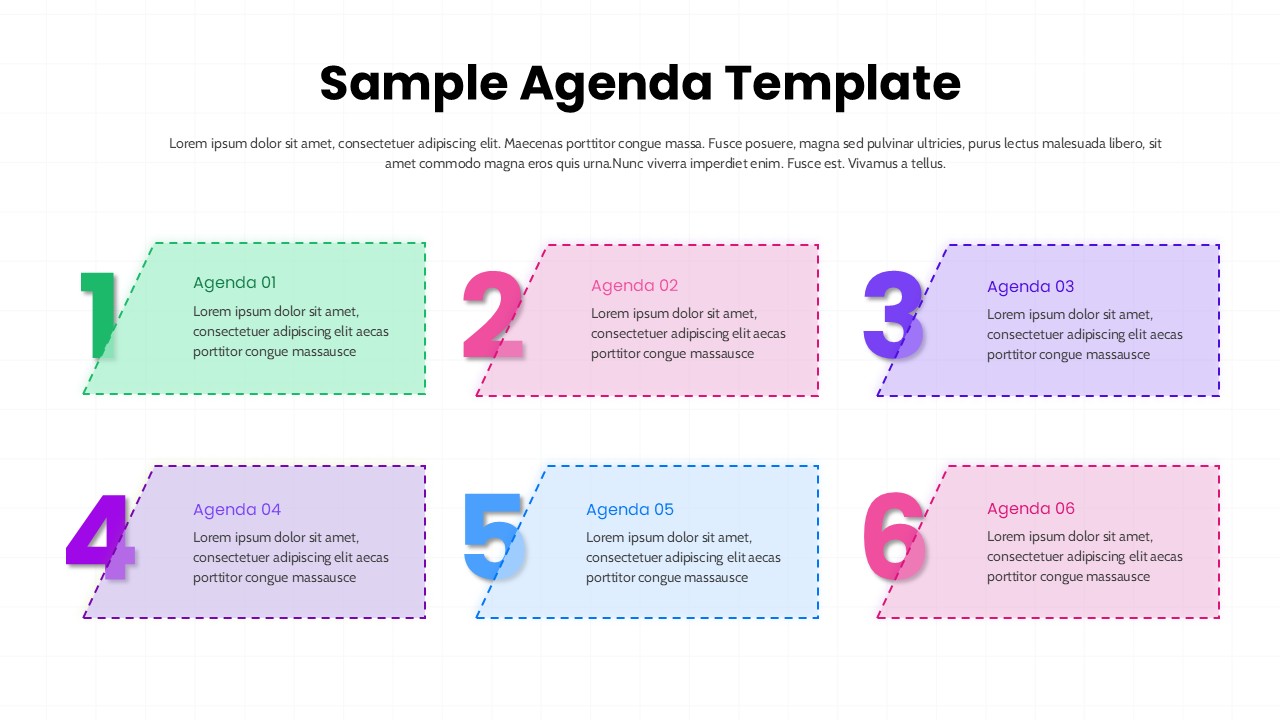
Sample Agenda Numbered Cards Template for PowerPoint & Google Slides
Agenda
Comparison Bar Chart template for PowerPoint & Google Slides
Comparison Chart
Three Bar Chart PowerPoint Template
Charts
Pencil Bar Chart Data Analysis Template for PowerPoint & Google Slides
Bar/Column

Monthly Reports Bar Chart template for PowerPoint & Google Slides
Bar/Column
Interactive Product Comparison Bar Chart Template for PowerPoint & Google Slides
Bar/Column
Data Bar Chart Template for PowerPoint and Keynote
Bar/Column
For and Against Vote Count Bar Chart for PowerPoint Presentation
Bar/Column
Entertainment Industry Revenue Bar Chart Template for PowerPoint & Google Slides
Bar/Column
Statistics Infographic & KPI Bar Chart Template for PowerPoint & Google Slides
Bar/Column
Multi-Series Stacked Bar Chart Template for PowerPoint & Google Slides
Bar/Column
Simple Bar Chart Data Visualization Template for PowerPoint & Google Slides
Bar/Column
Dynamic Bar-of-Pie Chart Comparison Template for PowerPoint & Google Slides
Pie/Donut
Expanding Margins Analysis Bar Chart Template for PowerPoint & Google Slides
Charts
Quarterly Sales Review Bar Chart Template for PowerPoint & Google Slides
Bar/Column
Two-Option Bar Chart Comparison Table Template for PowerPoint & Google Slides
Comparison
Bar Gantt Chart Template for PowerPoint & Google Slides
Gantt Chart