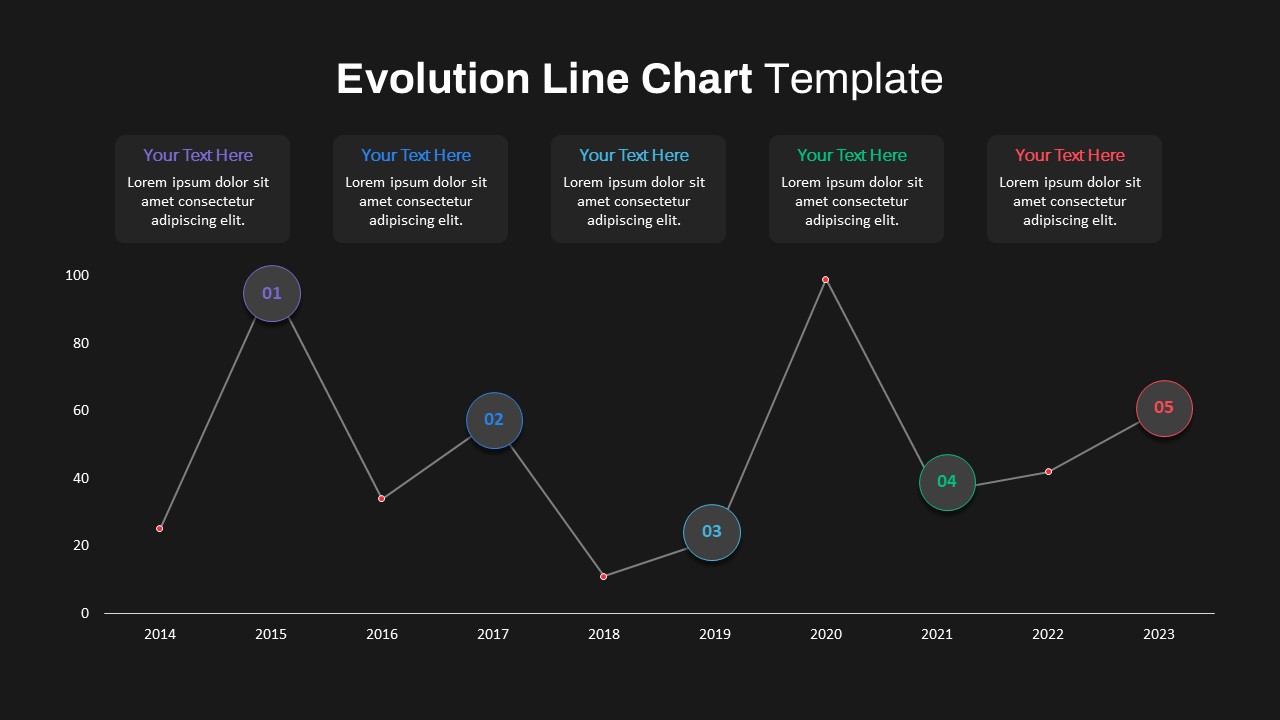
Evolution Line Chart with Milestones Template for PowerPoint & Google Slides

Description
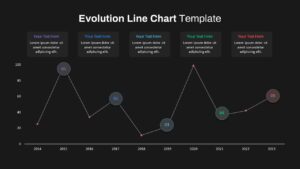
Bring your data story to life with this Evolution Line Chart slide designed to visualize trends, milestones, and performance metrics across years. The left-hand side features a clean line graph spanning years, with numbered circular markers in purple, blue, cyan, green, and red highlighting key data points. Above each marker, customizable text boxes allow you to annotate insights, milestones, or project phases. The right-aligned section showcases the chart legend and axis labels with crisp typography, ensuring clarity and focus. Its minimalist white background, subtle gridlines, and accent colors keep your audience’s attention on critical shifts over time. Subtle drop shadows and rounded data markers lend a modern professional aesthetic that aligns with corporate branding.
Built on master slides, this template offers editable placeholders for data labels, circle icons, and text callouts. Easily adjust the time range, add or remove milestone markers, change color accents, or update font styles in just a few clicks. The balanced layout and generous white space facilitate seamless storytelling—whether you’re reporting quarterly growth, project milestones, or operational performance.
Who is it for
Product managers, business analysts, marketing teams, financial planners, and consultants seeking to present trend analyses, performance reviews, or strategic roadmaps will find this slide invaluable. C-suite executives and stakeholders will appreciate the clear visual narrative when evaluating business health and forecasting future outcomes.
Other Uses
Adapt this timeline chart for project status updates, sales figures, customer journey mapping, budget tracking, academic research, or training sessions. Duplicate and rename the milestone labels to track phases in product development, event planning, or compliance milestones—making this slide a flexible tool for any presentation context.
Login to download this file

Item ID
SB03665
Related Templates

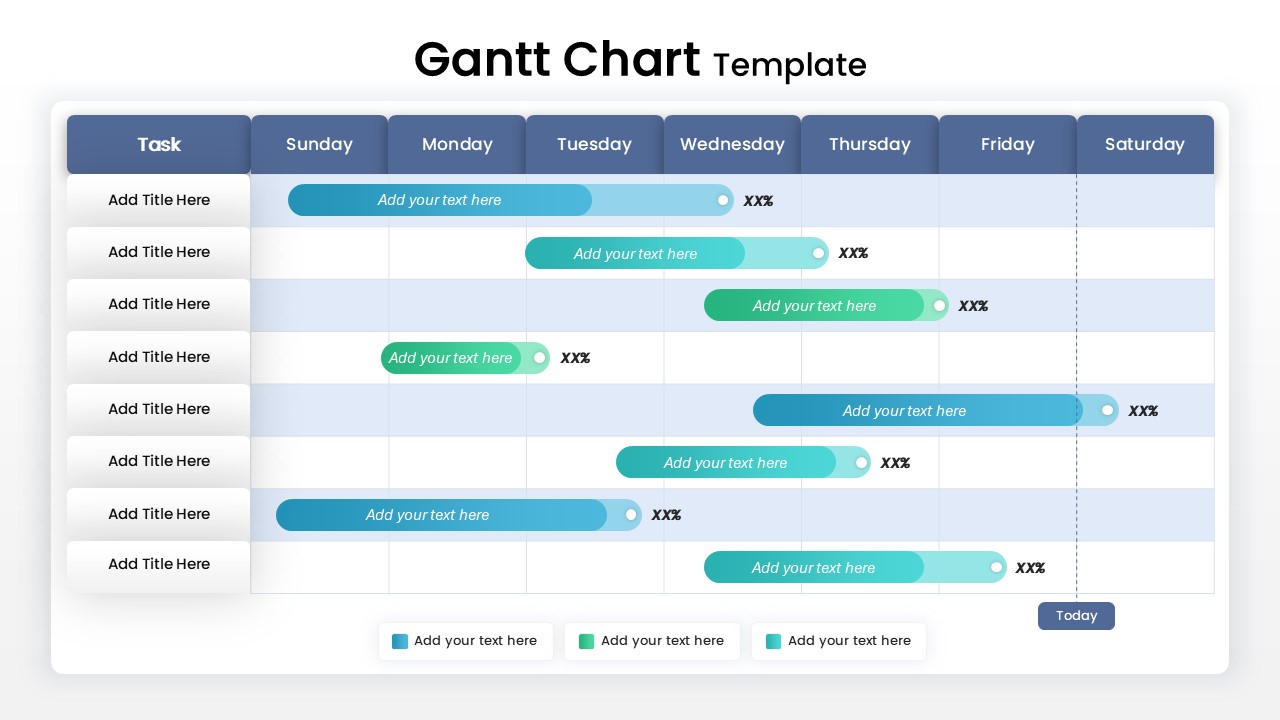
Weekly Gantt Chart with Milestones Template for PowerPoint & Google Slides
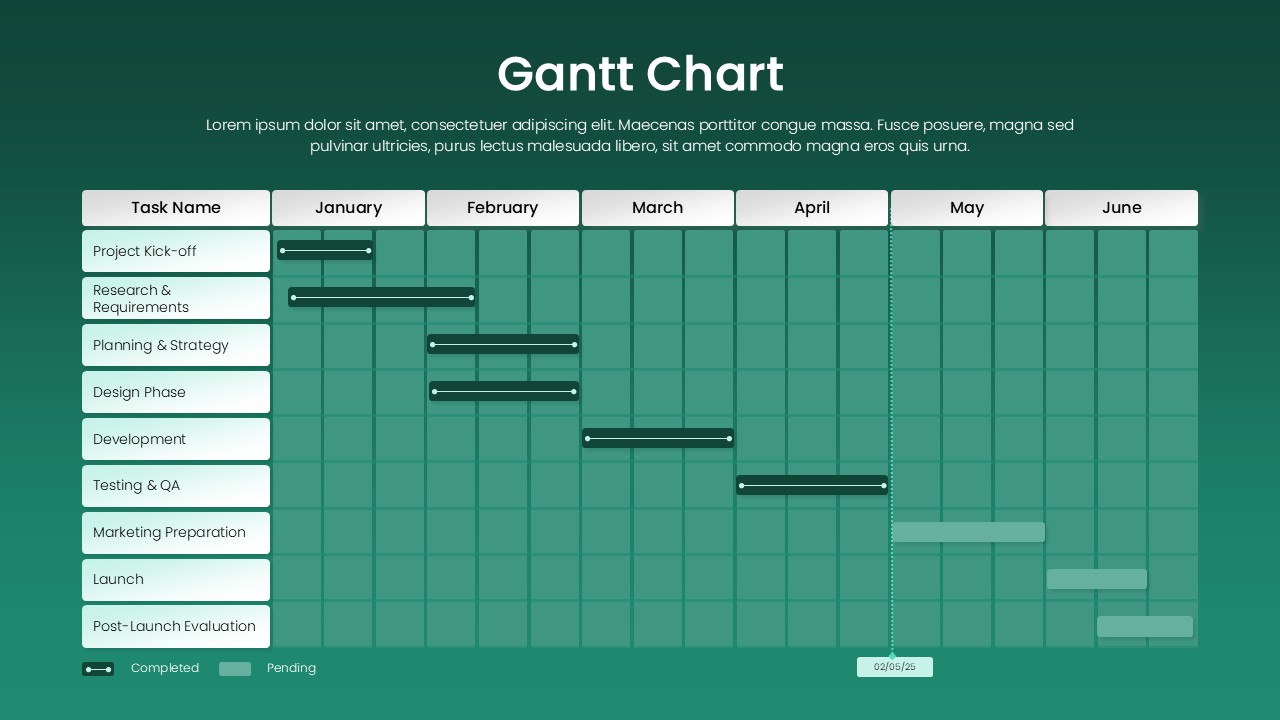
Gantt Chart
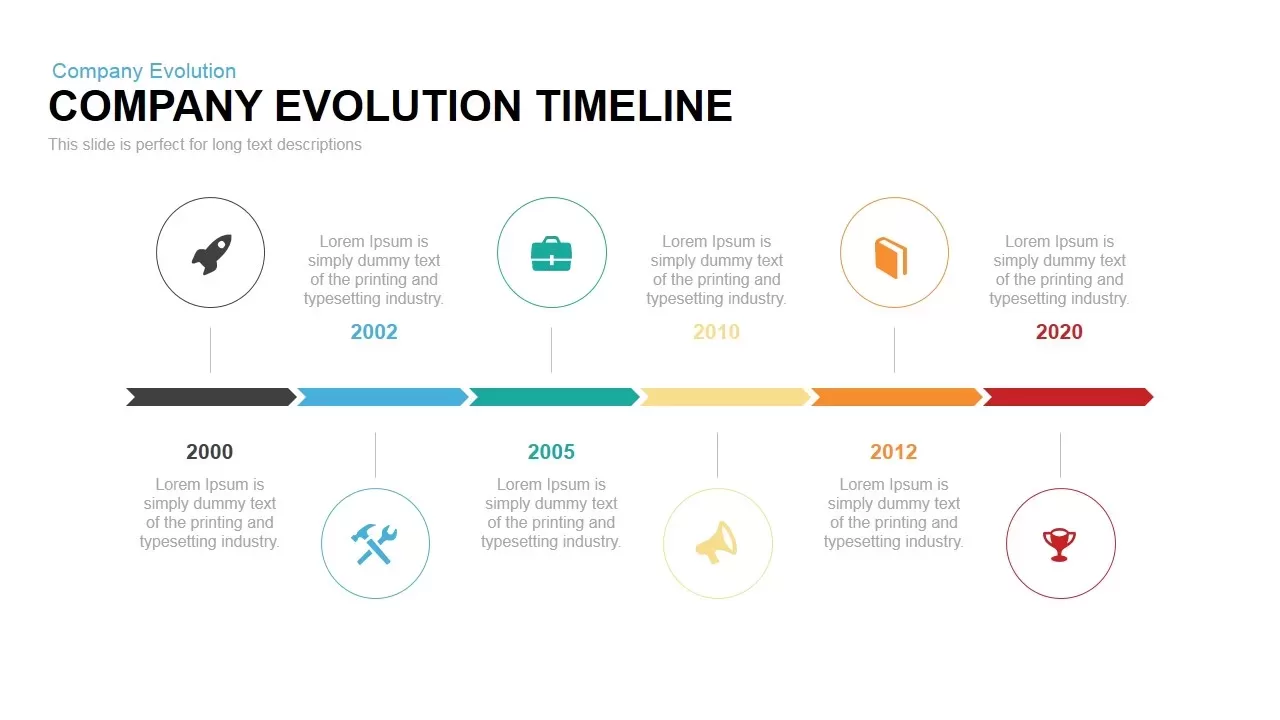
Evolution Timeline template for PowerPoint & Google Slides
Timeline
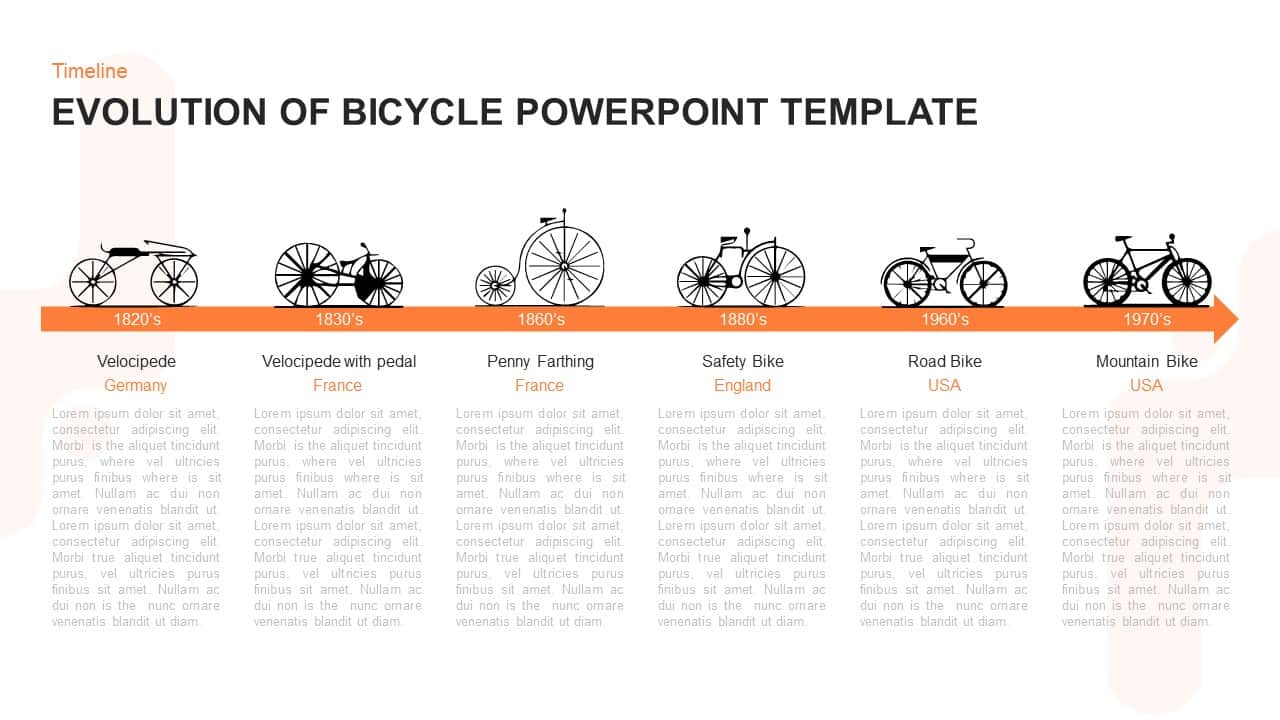
Evolution of Bicycle Timeline Diagram Template for PowerPoint & Google Slides
Timeline
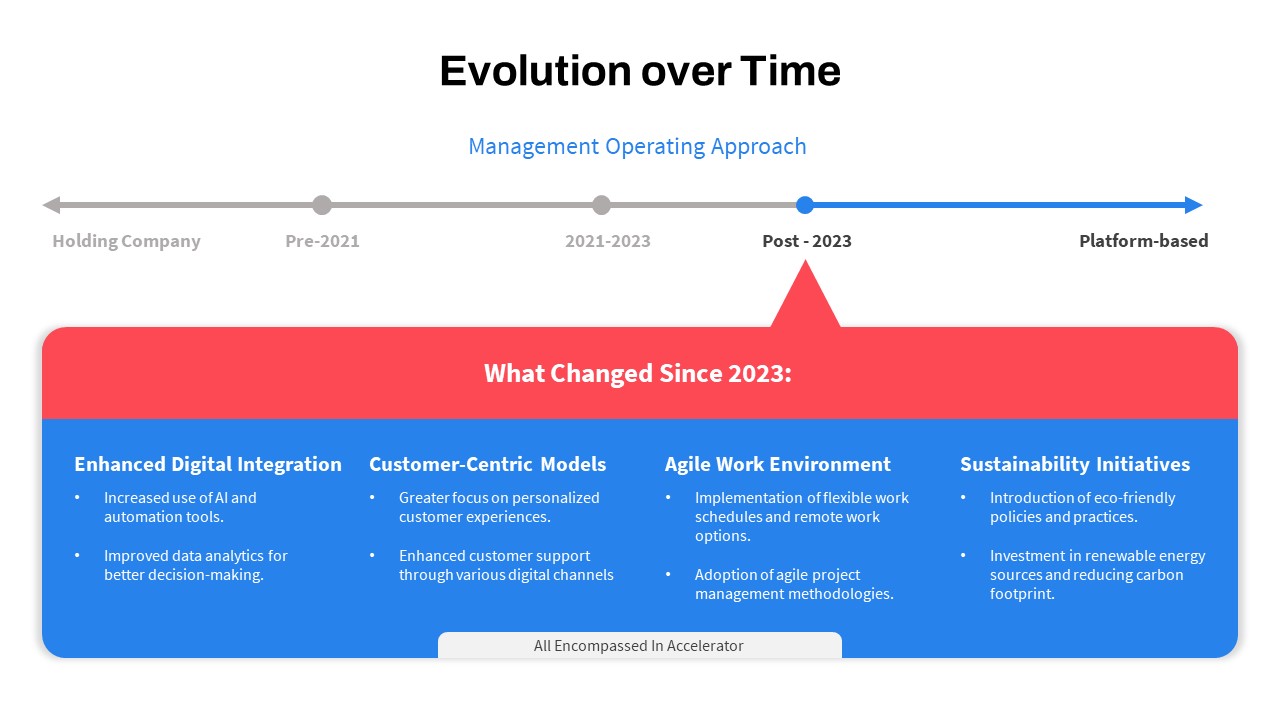
Operating Approach Evolution Timeline Template for PowerPoint & Google Slides
Timeline
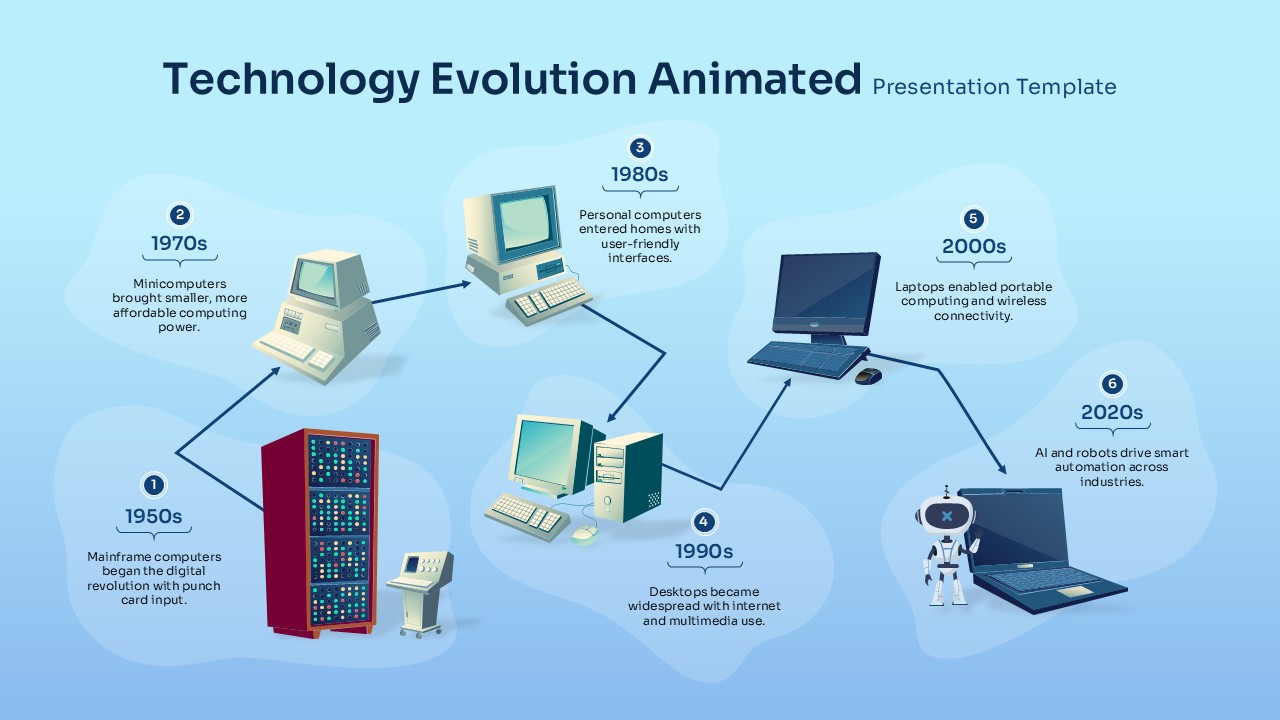
Technology Evolution Animated template for PowerPoint & Google Slides
Technology
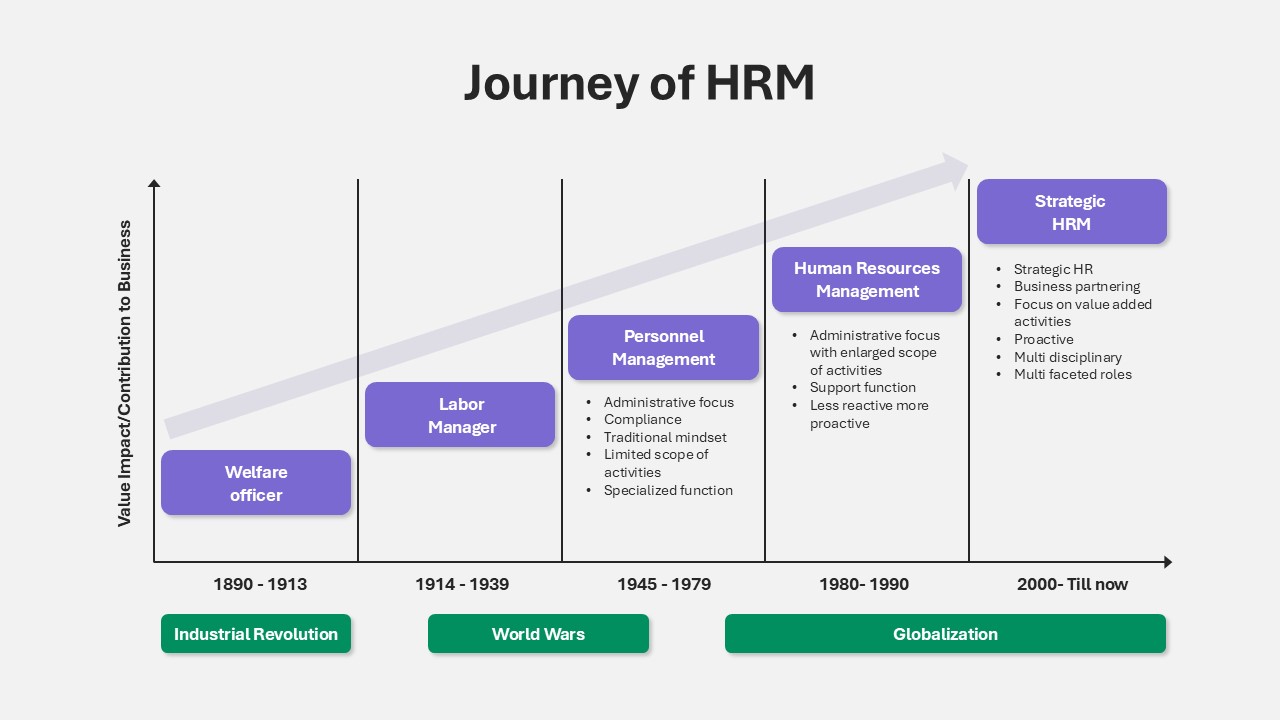
Journey of HRM Timeline Evolution Template for PowerPoint & Google Slides
HR

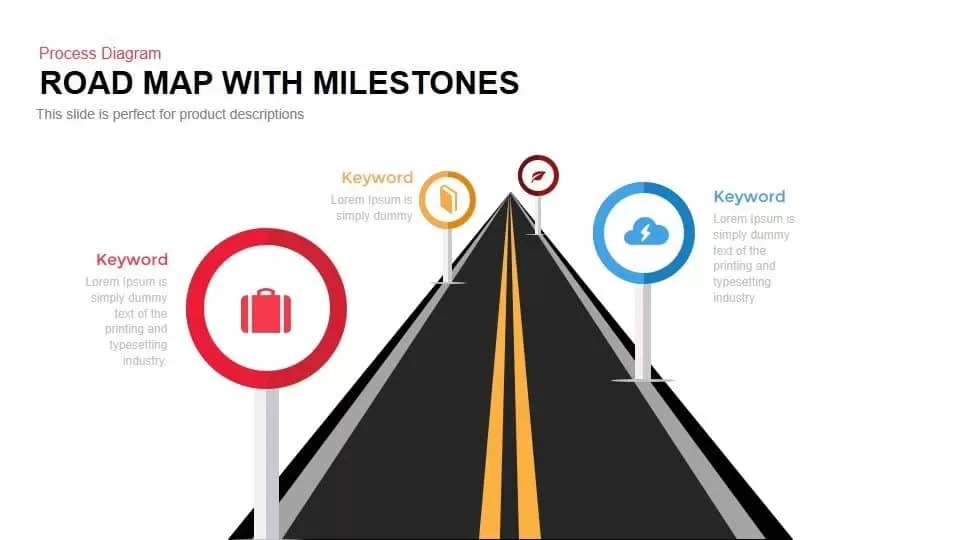
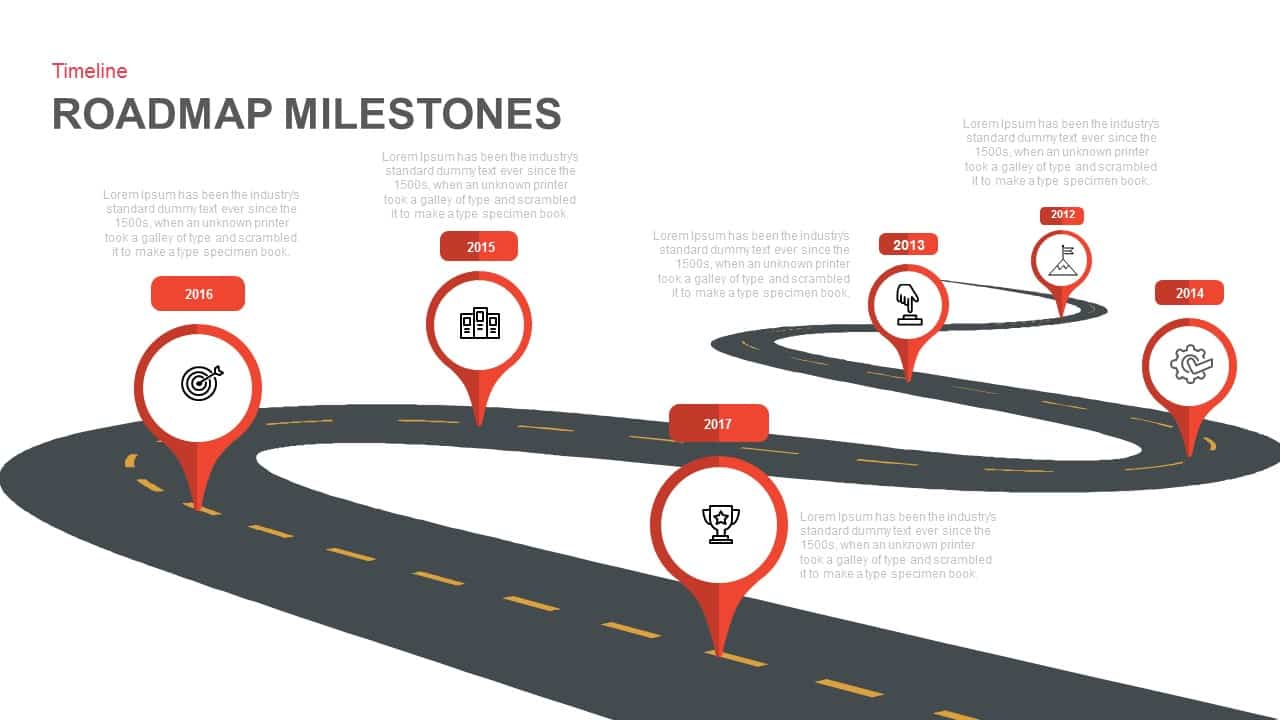
Roadmap with Milestones Process Diagram Template for PowerPoint & Google Slides
Roadmap
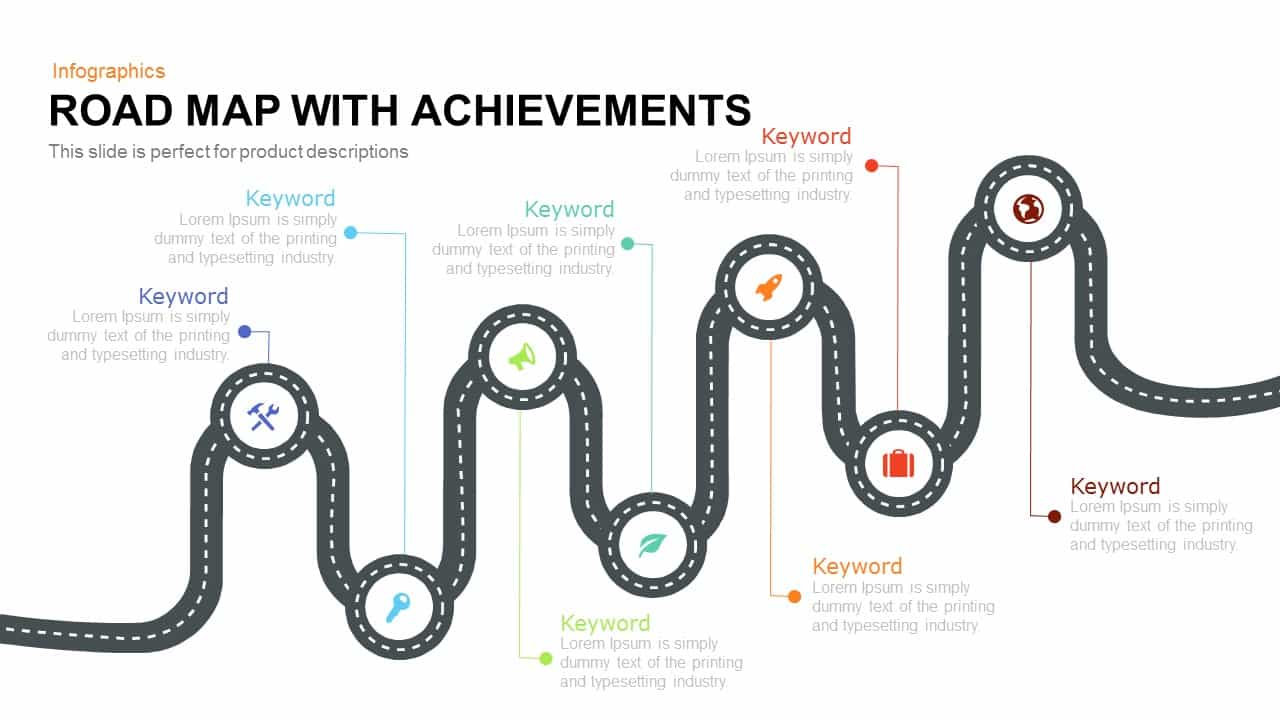
Road Map with Achievements Milestones Template for PowerPoint & Google Slides
Roadmap
Five-Stage Star Diagram for Milestones Template for PowerPoint & Google Slides
Process
Timeline Roadmap with Milestones Template
Roadmap

Timeline Roadmap Milestones Infographic Template for PowerPoint & Google Slides
Roadmap
5 Business Milestones Timeline Template for PowerPoint & Google Slides
Timeline
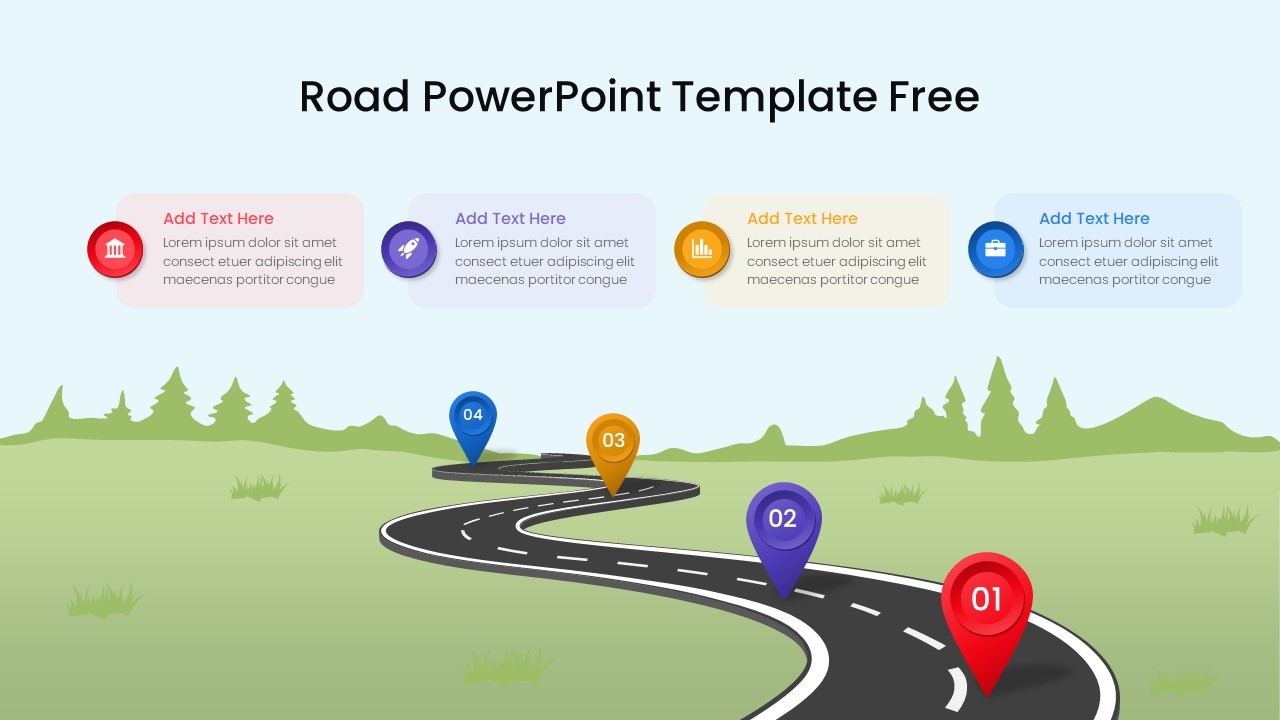
Free Winding Road Timeline Milestones Template for PowerPoint & Google Slides
Roadmap
Free
Roadmap Milestones template for PowerPoint & Google Slides
Business Strategy
Accomplishment Milestones Achievement template for PowerPoint & Google Slides
Business
Client Onboarding Milestones Process Template for PowerPoint & Google Slides
Process
Business Milestones & Achievements Template for PowerPoint & Google Slides
Company Profile
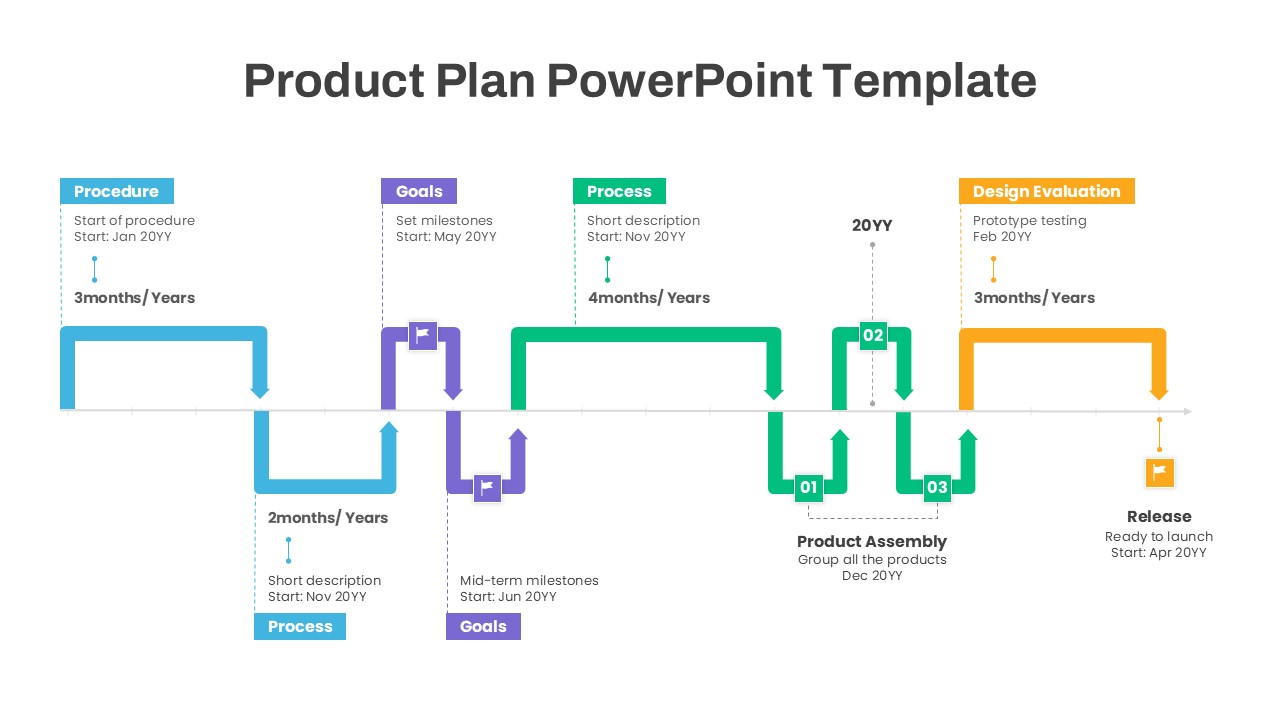
Product Plan Timeline and Milestones Template for PowerPoint & Google Slides
Timeline
Roadmap Milestones Timeline for PowerPoint & Google Slides
Roadmap
Curved Roadmap with Milestones Slide for PowerPoint & Google Slides
Roadmap
Free
Line Chart Analysis template for PowerPoint & Google Slides
Charts
Application Revenue Line Chart KPI Template for PowerPoint & Google Slides
Revenue
Combination Bar and Line Chart Template for PowerPoint & Google Slides
Bar/Column
Editable Multi-Series Peak Line Chart Template for PowerPoint & Google Slides
Comparison Chart
Arrow Line Chart Template for PowerPoint & Google Slides
Comparison Chart
Data Over Time Line Chart template for PowerPoint & Google Slides
Charts
Growth Curve Line Chart Visualization Template for PowerPoint & Google Slides
Charts
Multiple Line Chart Comparison Template for PowerPoint & Google Slides
Comparison Chart
Multi-Series Line Chart with Icons Template for PowerPoint & Google Slides
Comparison Chart
Interactive Jump Line Data Chart Template for PowerPoint & Google Slides
Comparison Chart
Skimming Pricing Strategy Line Chart Template for PowerPoint & Google Slides
Business Strategy
Dynamic Financial Analysis Line Chart Template for PowerPoint & Google Slides
Finance
3D Line Chart for PowerPoint & Google Slides
Charts
Data-Driven Line Chart Diagram Template for PowerPoint
Comparison Chart
Line Graph Analysis template for PowerPoint & Google Slides
Charts
Multi-Series Curved Line Graph Analytics Template for PowerPoint & Google Slides
Comparison Chart
Sales Growth Dashboard: KPI Gauge & Line Template for PowerPoint & Google Slides
Revenue

Creative Clothing Line Presentation Template for PowerPoint & Google Slides
Pitch Deck
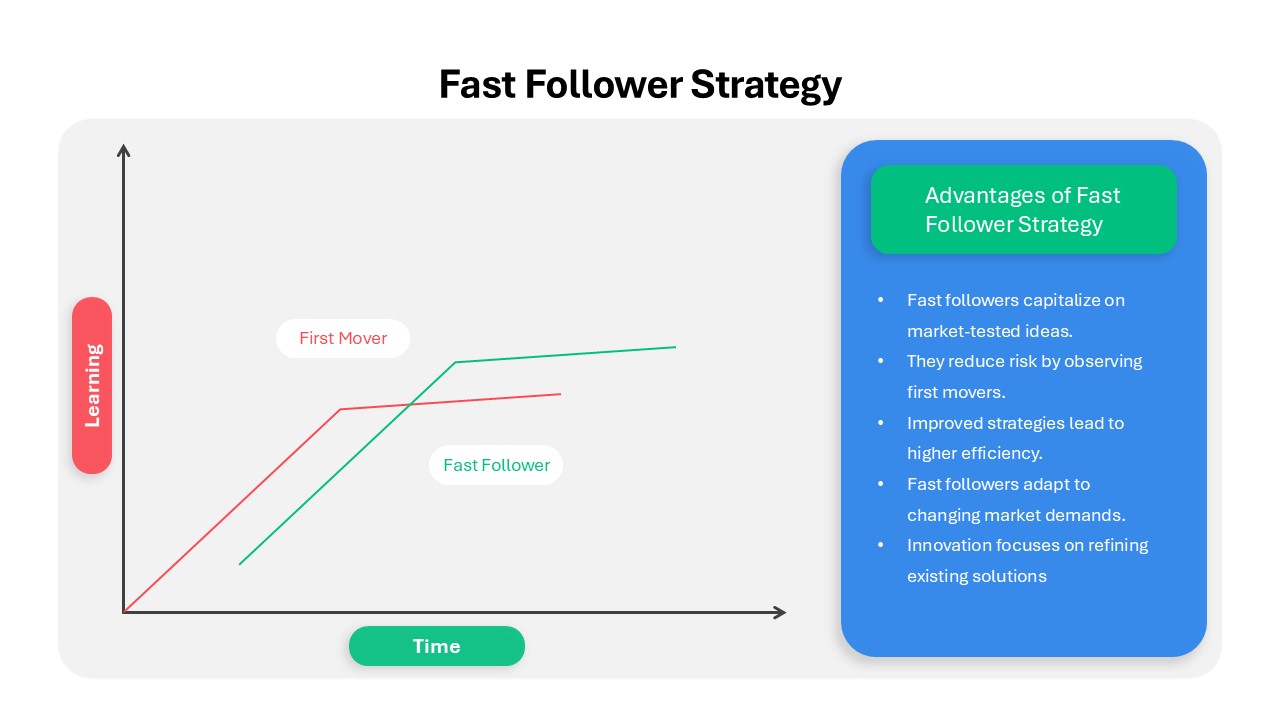
Fast Follower Strategy Line Graph Template for PowerPoint & Google Slides
Comparison Chart
3Ps Triple Bottom Line Venn Diagram Template for PowerPoint & Google Slides
Circular
4 People Racing to Finish Line Template for PowerPoint & Google Slides
Accomplishment
Curved Line Graph for PowerPoint & Google Slides
Timeline
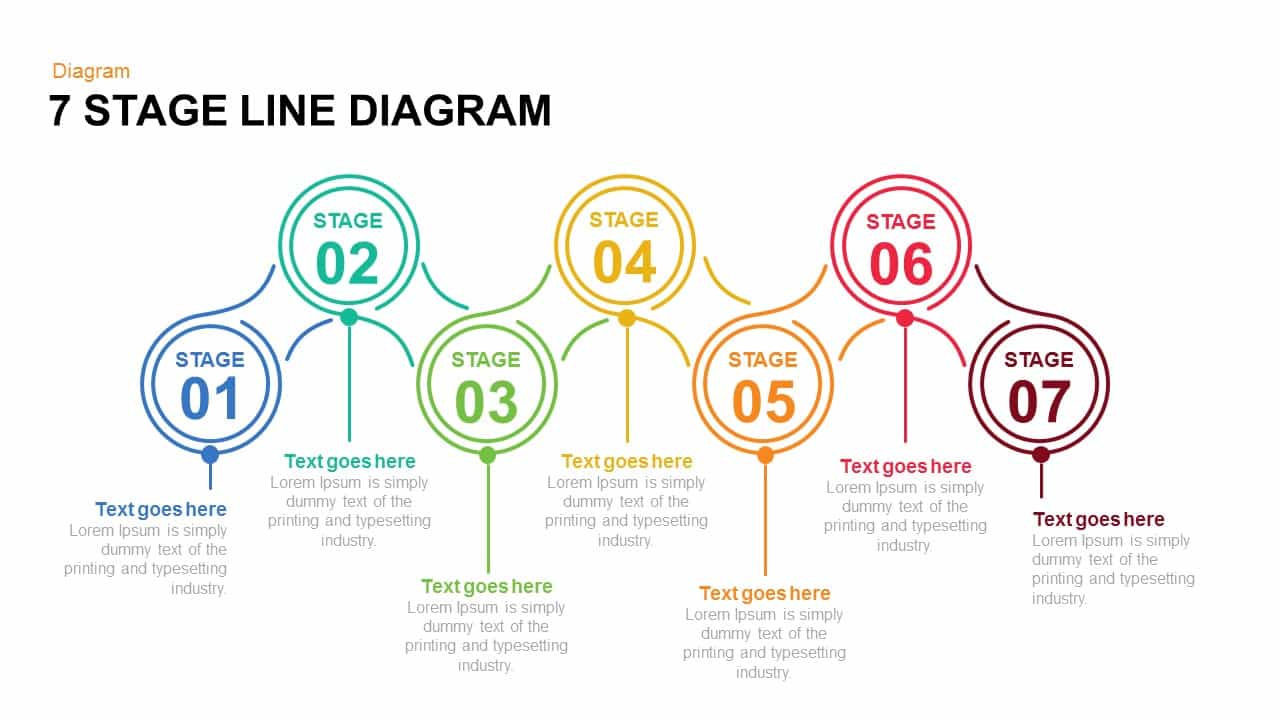
7 and 6 Stage Line Diagram Overview for PowerPoint & Google Slides
Infographics
Five and Six Step Line Linear Stage Diagram for PowerPoint & Google Slides
Infographics
Quad Chart Infographic Pack of 8 Slides Template for PowerPoint & Google Slides
Comparison Chart
Free Professional Gantt Chart Pack – 4 Slides Template for PowerPoint & Google Slides
Gantt Chart
Free
Donut Chart template for PowerPoint & Google Slides
Pie/Donut
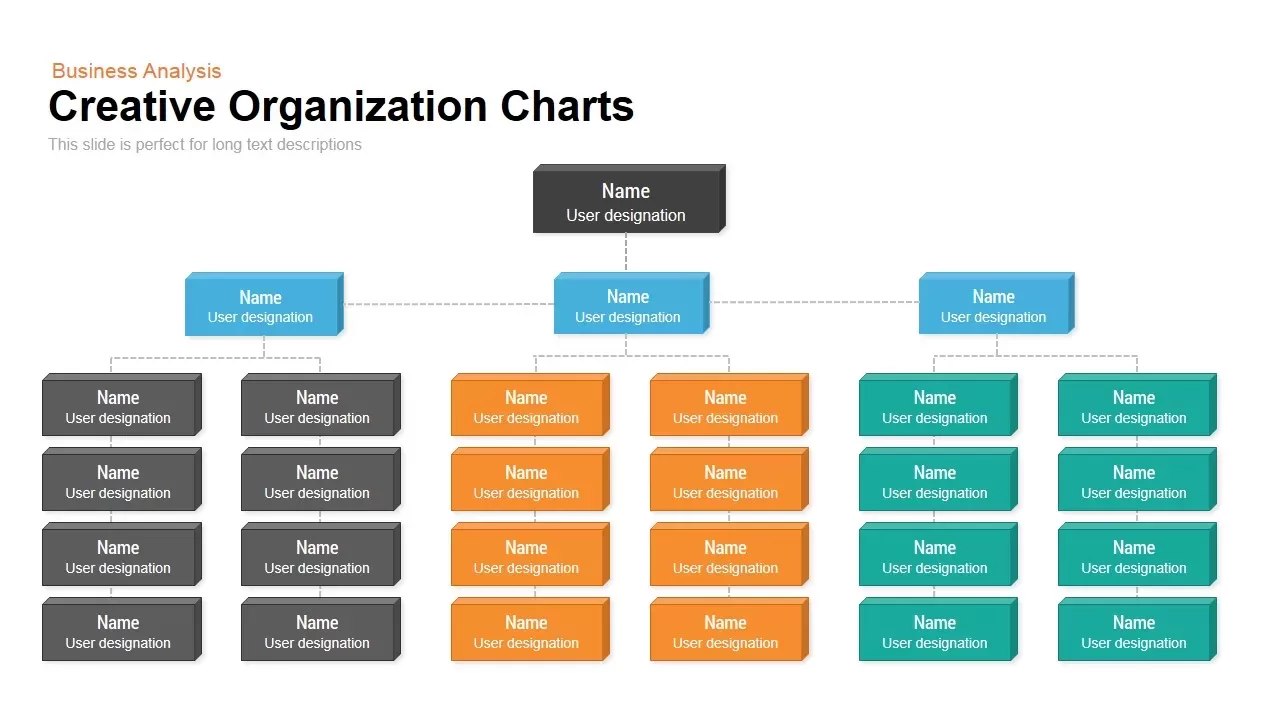
Organization Chart template for PowerPoint & Google Slides
Org Chart
Three-Year Bar Chart template for PowerPoint & Google Slides
Charts
Market Development Matrix Chart Template for PowerPoint & Google Slides
Comparison Chart
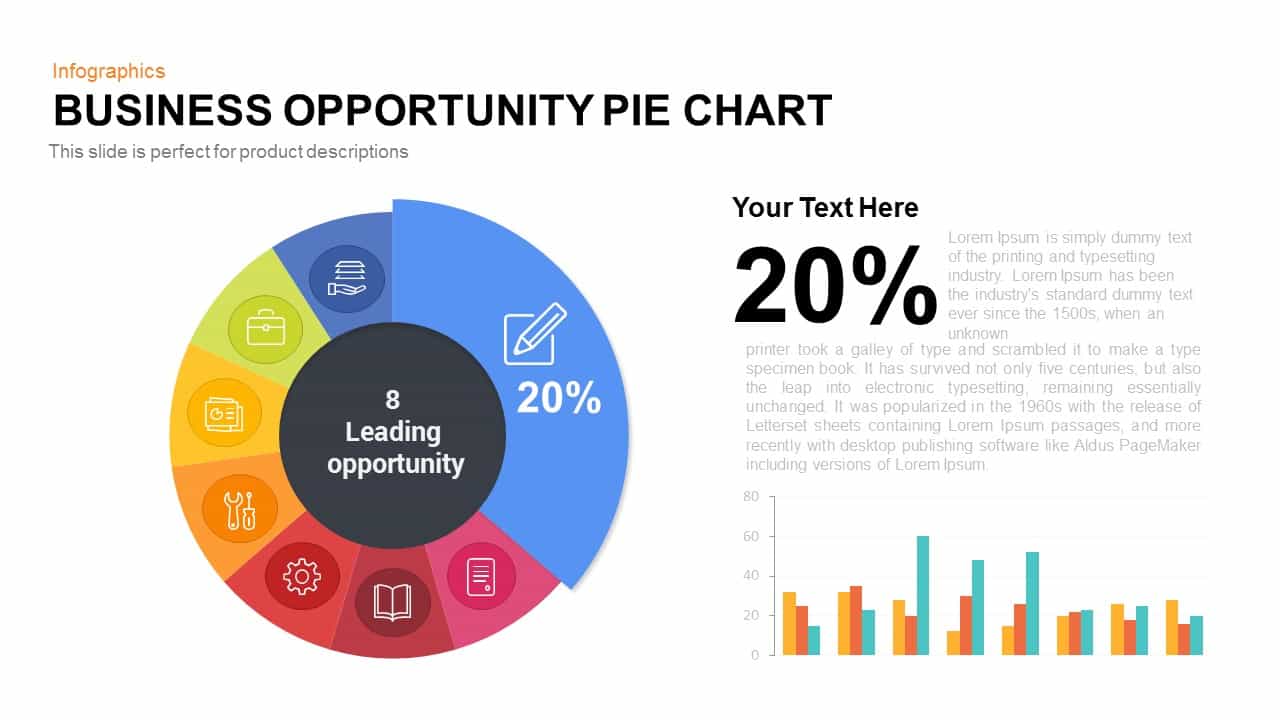
Business Opportunity Pie Chart Template for PowerPoint & Google Slides
Pie/Donut
Horizontal Multi-Level Hierarchy Chart template for PowerPoint & Google Slides
Org Chart

Monthly Reports Bar Chart template for PowerPoint & Google Slides
Bar/Column

Product Usage Analytics Dashboard Chart Template for PowerPoint & Google Slides
Bar/Column
Sales vs Budget Performance Chart Template for PowerPoint & Google Slides
Bar/Column
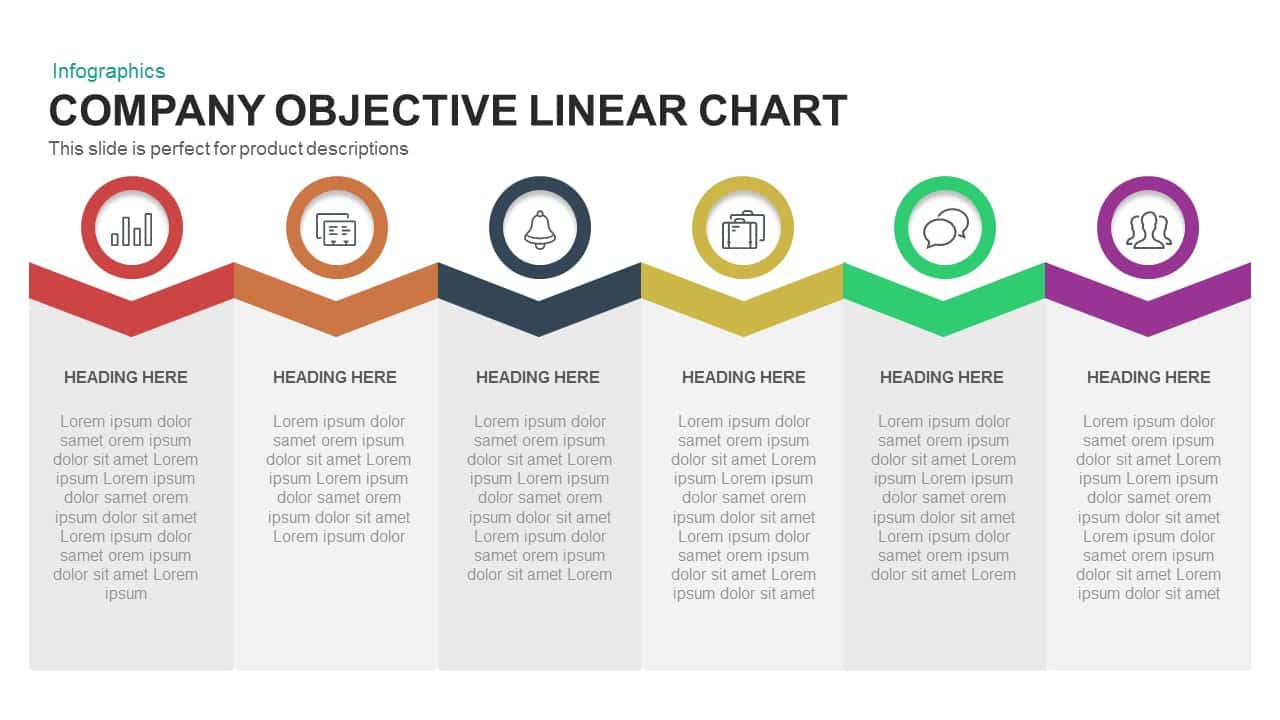
Company Objective Linear Chart Template for PowerPoint & Google Slides
Flow Charts
Organization Chart Overview template for PowerPoint & Google Slides
Org Chart
Organization Department Hexagon Chart Template for PowerPoint & Google Slides
Org Chart
Corporate Organizational Chart PowerPoint Template
Org Chart
Entertainment Industry Revenue Bar Chart Template for PowerPoint & Google Slides
Bar/Column

BMI Category Comparison Chart Template for PowerPoint & Google Slides
Comparison
Flow Chart Diagram Template for PowerPoint & Google Slides
Flow Charts
30-60-90 Day Donut Chart Plan Infographic Template for PowerPoint & Google Slides
Timeline
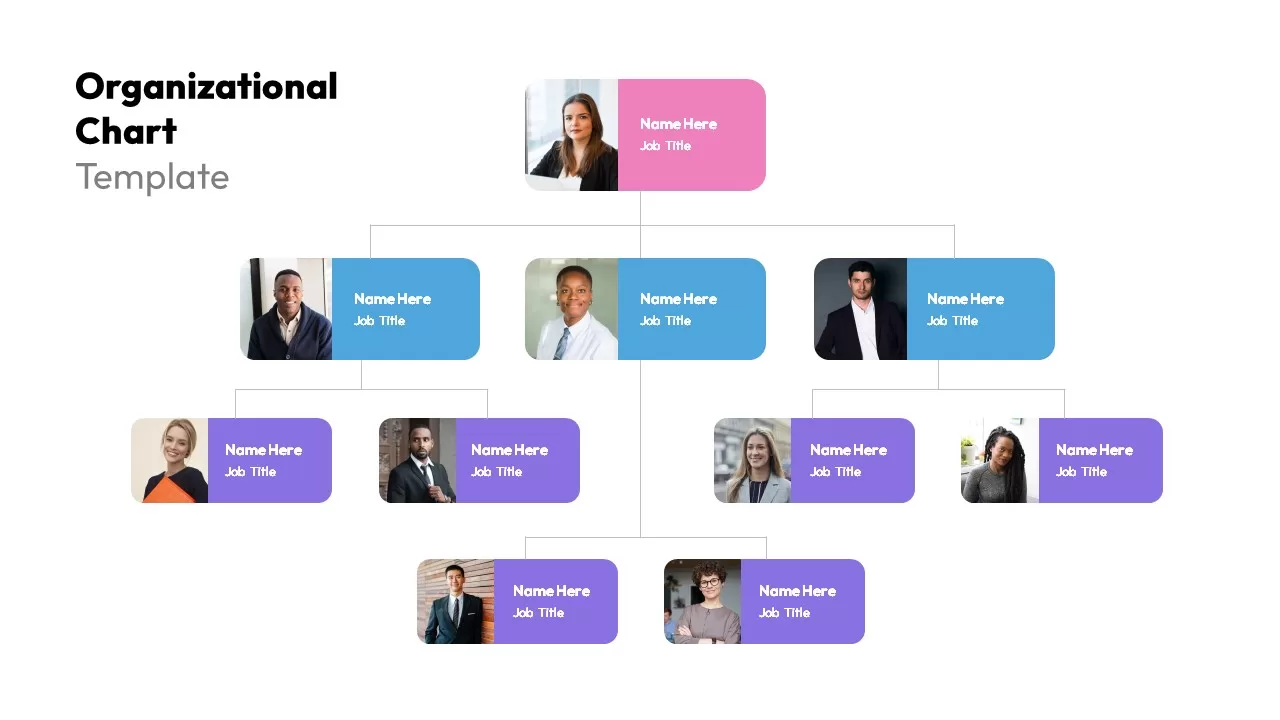
Modern Photo-Based Organizational Chart Template for PowerPoint & Google Slides
Org Chart
Modern Image-Based Organizational Chart Template for PowerPoint & Google Slides
Infographics
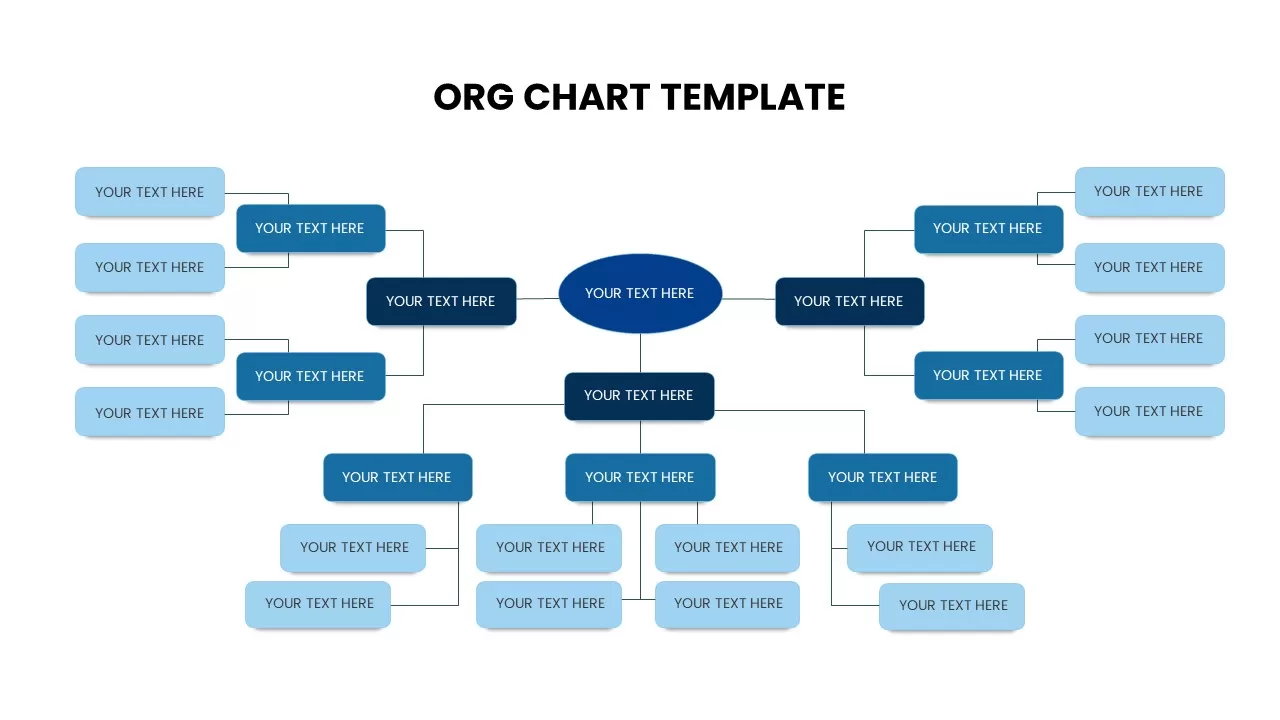
Organizational Chart Overview template for PowerPoint & Google Slides
Org Chart
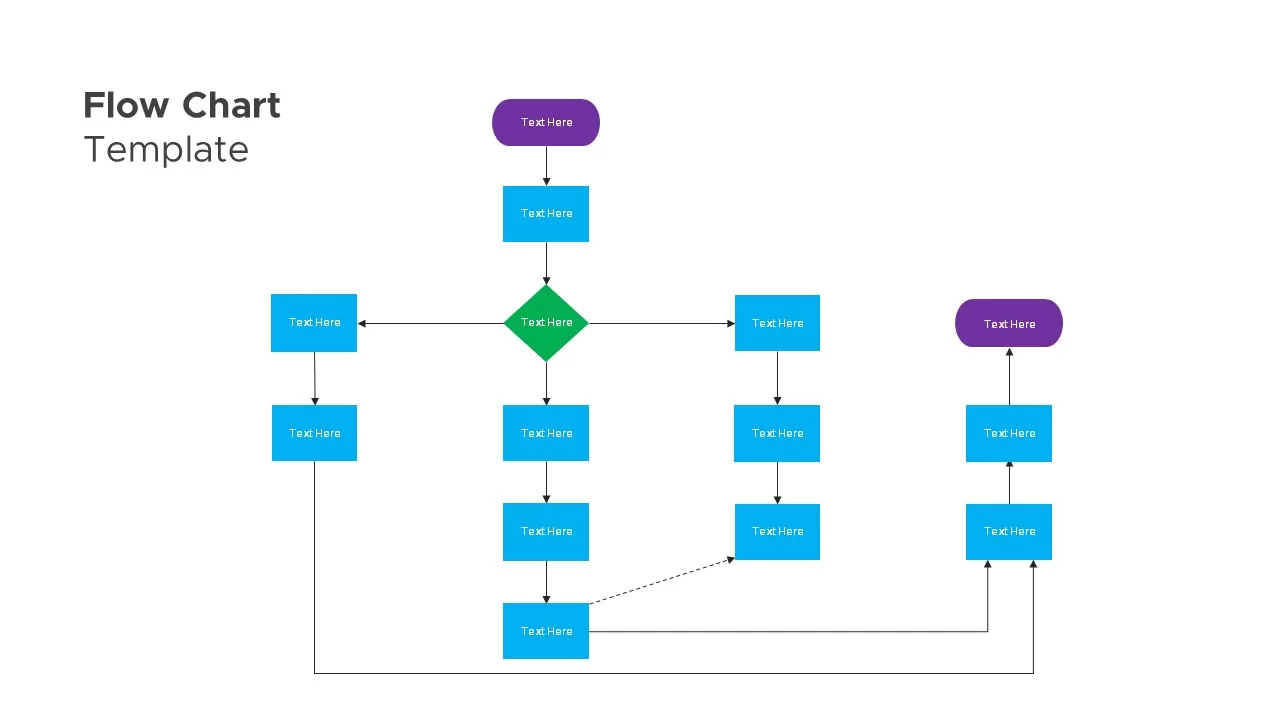
Flow Chart Template for PowerPoint & Google Slides
Flow Charts
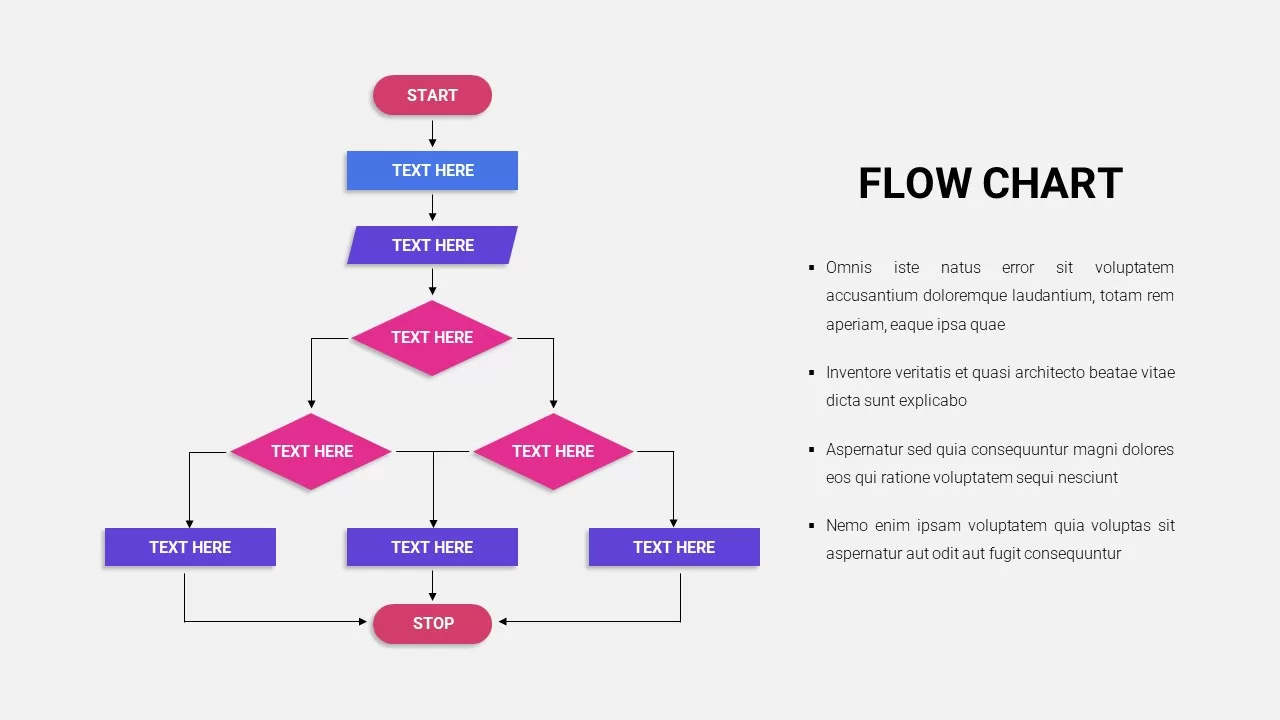
Flow Chart Template for PowerPoint & Google Slides
Flow Charts
Organizational Chart template for PowerPoint & Google Slides
Org Chart
Free Circular Multi-Step Flow Chart Diagram Template for PowerPoint & Google Slides
Flow Charts
Free
Free Curved Arrow Progress Chart template for PowerPoint & Google Slides
Project
Free
Animated Implementation Timeline Chart Template for PowerPoint & Google Slides
Timeline
Functional Organization Chart Structure Template for PowerPoint & Google Slides
Org Chart
Free Stacked Column Chart Data Visualization Template for PowerPoint & Google Slides
Bar/Column
Free
Animated Clustered Bar Chart Template for PowerPoint & Google Slides
Bar/Column
Animated Stacked Bar Chart Template for PowerPoint & Google Slides
Bar/Column
Clustered Bar Chart Comparison Template for PowerPoint & Google Slides
Bar/Column
Simple Area Chart Data Trends Analysis Template for PowerPoint & Google Slides
Comparison Chart
Waterfall Chart Data Visualization Template for PowerPoint & Google Slides
Comparison Chart
Year-over-Year Stacked Gender Bar Chart Template for PowerPoint & Google Slides
Bar/Column
Animated Hexagon Org Chart Diagram Template for PowerPoint & Google Slides
Org Chart
Population Age Distribution Pyramid Chart Template for PowerPoint & Google Slides
Pyramid
Multi-Variation Thermometer Chart Template for PowerPoint & Google Slides
Bar/Column
Wastewater Treatment Process Flow Chart Template for PowerPoint & Google Slides
Flow Charts
Multi-Level Wheel Chart Diagram template for PowerPoint & Google Slides
Pie/Donut
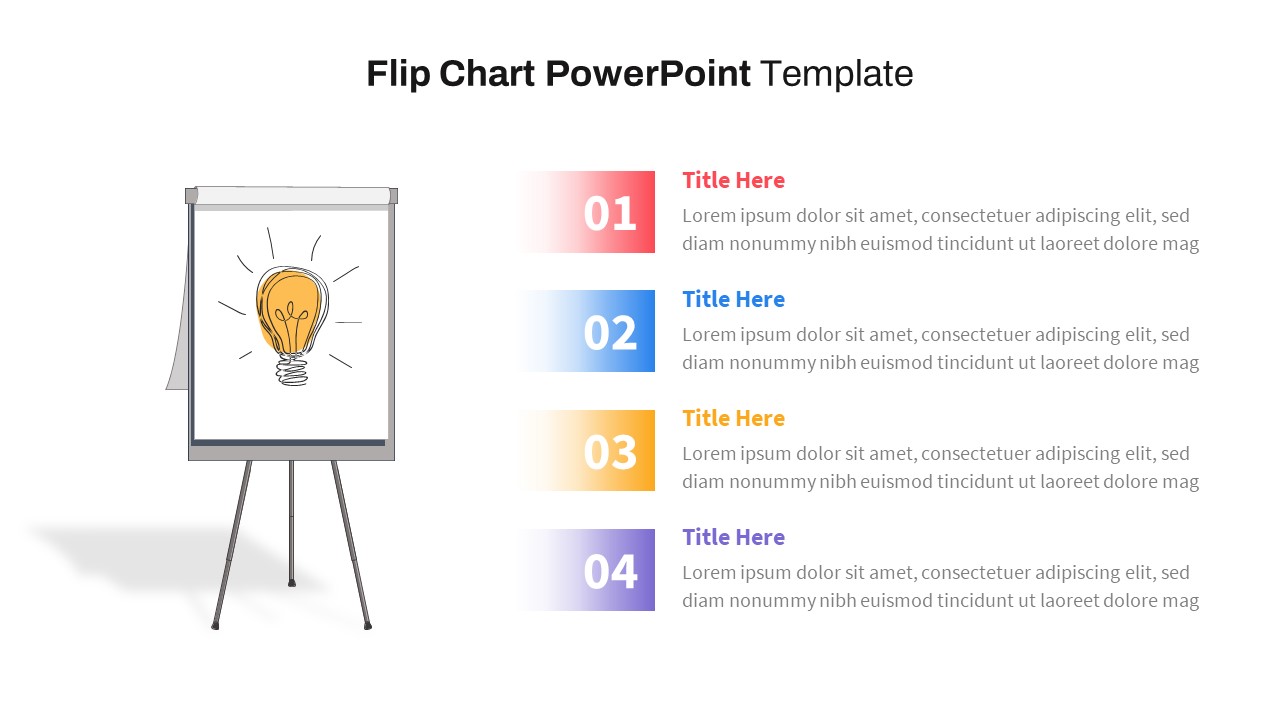
Flip Chart Four-Step List Layout Template for PowerPoint & Google Slides
Process
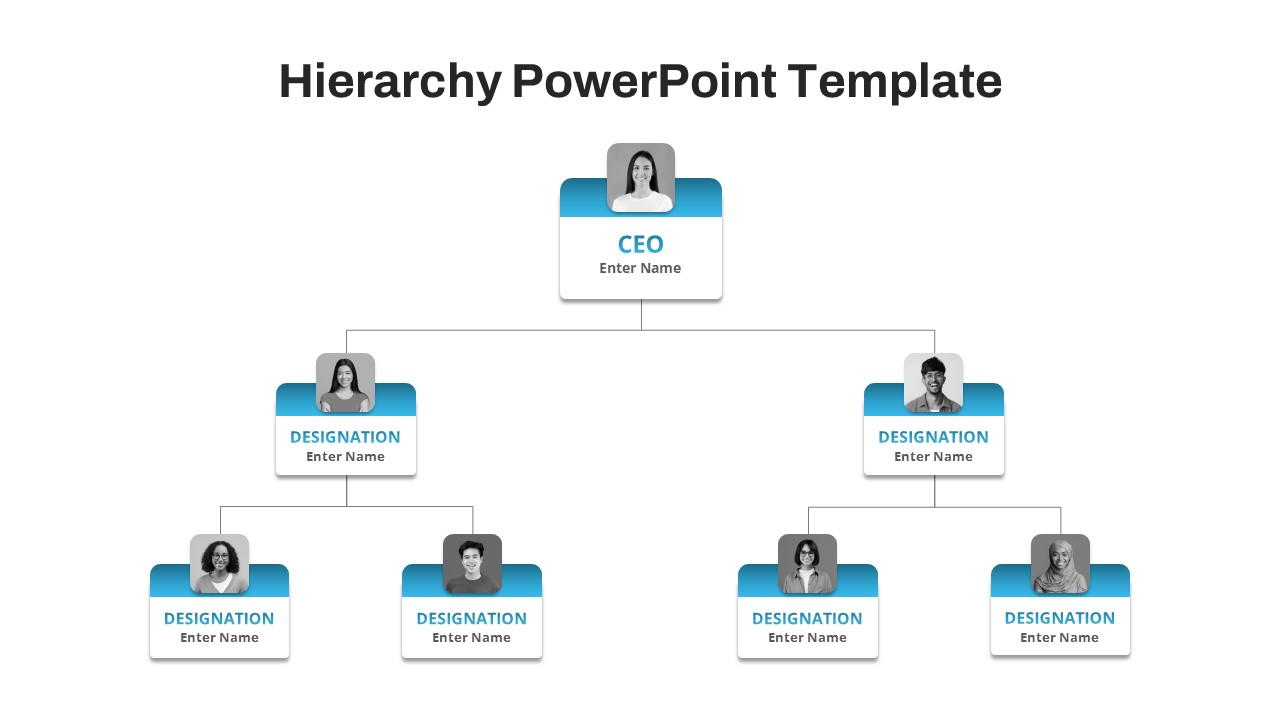
Free Corporate Hierarchy Organizational Chart Template for PowerPoint & Google Slides
Org Chart
Free
Expanding Margins Analysis Bar Chart Template for PowerPoint & Google Slides
Charts
Annual Growth Trend Analysis Chart template for PowerPoint & Google Slides
Business Report
Quarterly Sales Review Bar Chart Template for PowerPoint & Google Slides
Bar/Column
Professional Table of Organization Chart Template for PowerPoint & Google Slides
Org Chart
Competitor Comparison Chart Design Template for PowerPoint & Google Slides
Comparison
Event Planning Gantt Chart template for PowerPoint & Google Slides
Business
Feasibility Matrix Comparison Chart Template for PowerPoint & Google Slides
Comparison Chart
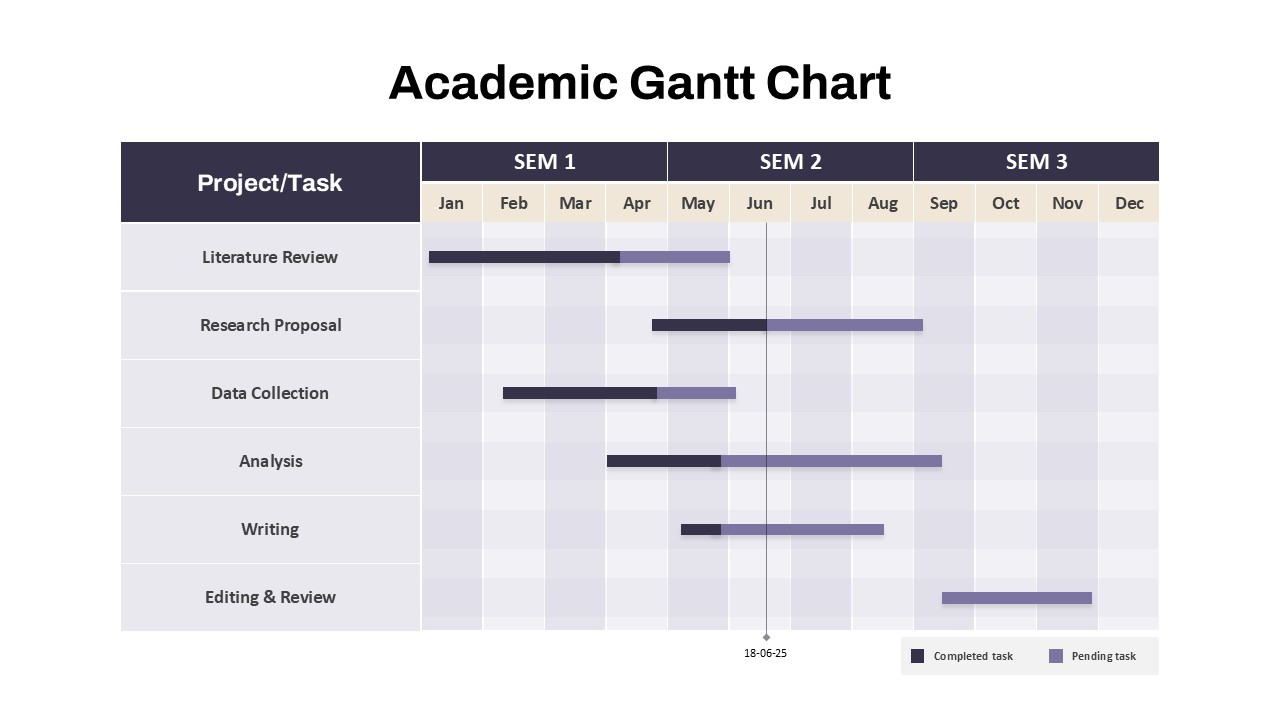
Academic Gantt Chart template for PowerPoint & Google Slides
Business
Bar Gantt Chart Template for PowerPoint & Google Slides
Gantt Chart
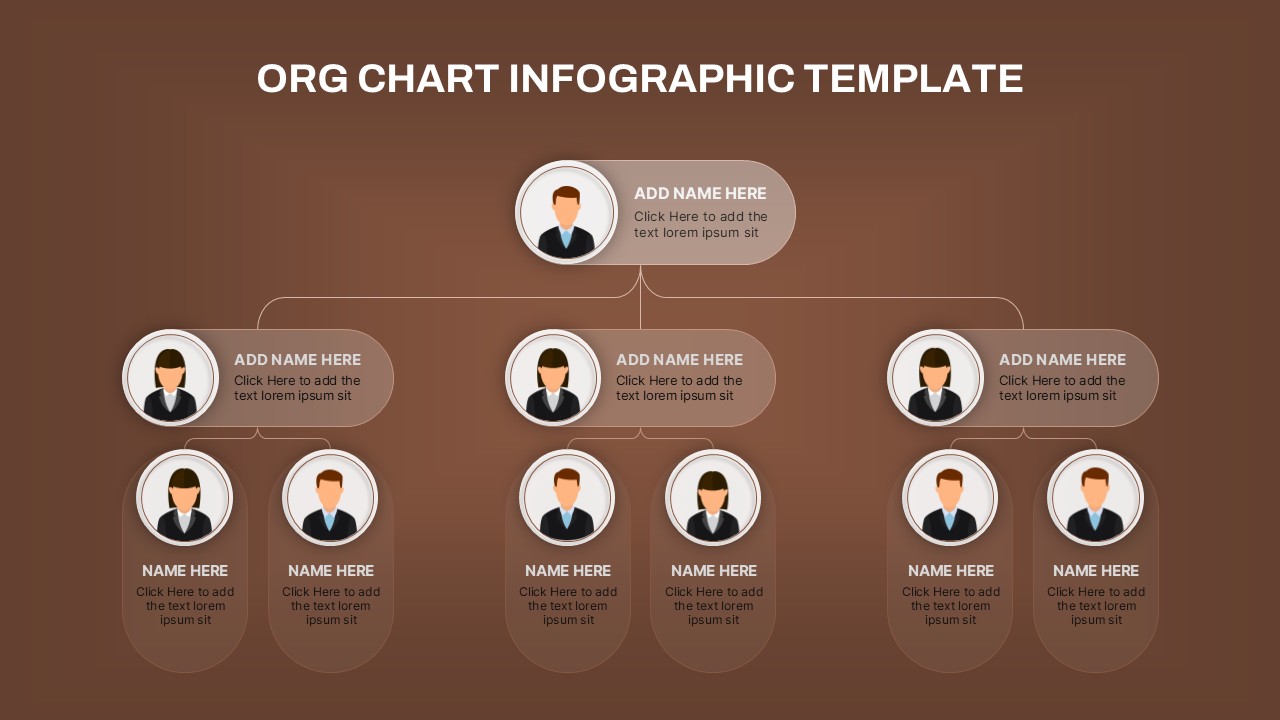
Hierarchical Org Chart Infographic Template for PowerPoint & Google Slides
Org Chart
Green Gantt Chart Template for PowerPoint & Google Slides
Gantt Chart
Colorful Annual Gantt Chart Project Planner Template for PowerPoint & Google Slides
Gantt Chart
7 Step 6 Month Gantt Chart Timeline Template for PowerPoint & Google Slides
Gantt Chart