Dynamic Financial Analysis Line Chart Template for PowerPoint & Google Slides

Description
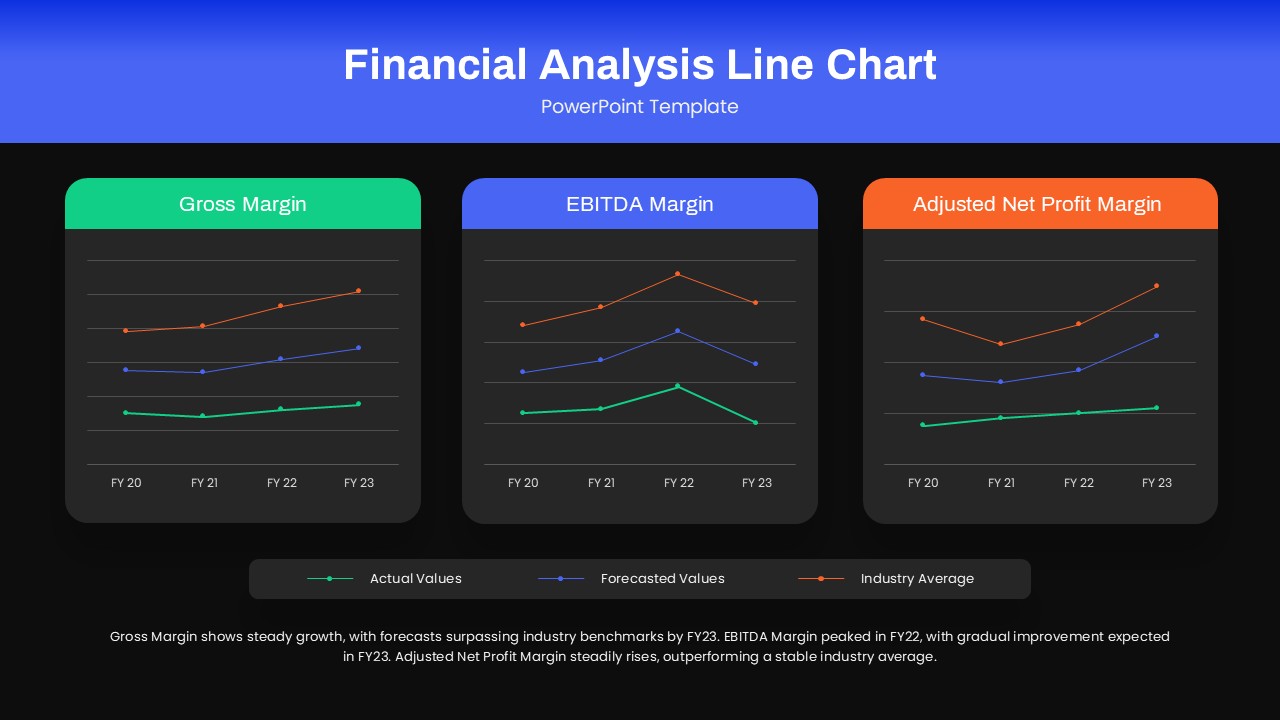
Engineered on a crisp white canvas and accented by a bold blue header bar, this slide features three distinct chart cards—Gross Margin, EBITDA Margin, and Adjusted Net Profit Margin—plotted across FY20 to FY23. Each card displays overlapping trend lines for Actual Values (green), Forecasted Values (blue), and Industry Average (orange), enabling clear side-by-side comparisons against benchmarks. Subtle gridlines, rounded card corners, and soft drop shadows maintain a minimalist aesthetic while enhancing visual hierarchy.
Built on master slides for both PowerPoint and Google Slides, every element is fully editable: update data series, tweak color accents to match brand guidelines, and resize or reposition cards without losing vector clarity. A centralized legend and customizable summary text area below the charts allow you to highlight key takeaways, call out anomalies, and guide stakeholder discussions. The modular layout can be duplicated or repurposed across multiple deck sections to ensure consistency and eliminate formatting headaches.
Additional features include clean FY axis labels for precise cross-year analysis, transparent card backgrounds for alternative color integrations, and grouping of geometric shapes for easy icon or callout overlays. Whether you’re presenting quarterly results, conducting board reviews, or leading strategic planning workshops, this versatile template transforms raw financial metrics into polished visual narratives that drive informed decision-making.
Who is it for
CFOs, financial analysts, corporate finance teams, investment managers, and business consultants will benefit from this slide when reporting profitability trends, forecasting performance, or benchmarking against industry standards.
Other Uses
Repurpose this layout for revenue forecasting, cost-of-goods-sold analysis, customer retention KPIs, sales pipeline tracking, or operational metric dashboards to maintain a cohesive visual identity across all financial presentations.
Login to download this file

Item ID
SB04325
Related Templates

Line Chart Analysis template for PowerPoint & Google Slides
Charts

Creative Dynamic Gantt Chart Timeline Template for PowerPoint & Google Slides
Timeline
Capital Structure Dynamic Split Chart Template for PowerPoint & Google Slides
Comparison Chart

Dynamic Marketing Radar Chart Analytics Template for PowerPoint & Google Slides
Comparison
Dynamic Benchmarking Comparison Chart Template for PowerPoint & Google Slides
Comparison Chart
Dynamic Three-Series Stacked Area Chart Template for PowerPoint & Google Slides
Comparison Chart
Dynamic Sunburst Chart Visualization Template for PowerPoint & Google Slides
Charts
Dynamic Bar-of-Pie Chart Comparison Template for PowerPoint & Google Slides
Pie/Donut
Line Graph Analysis template for PowerPoint & Google Slides
Charts
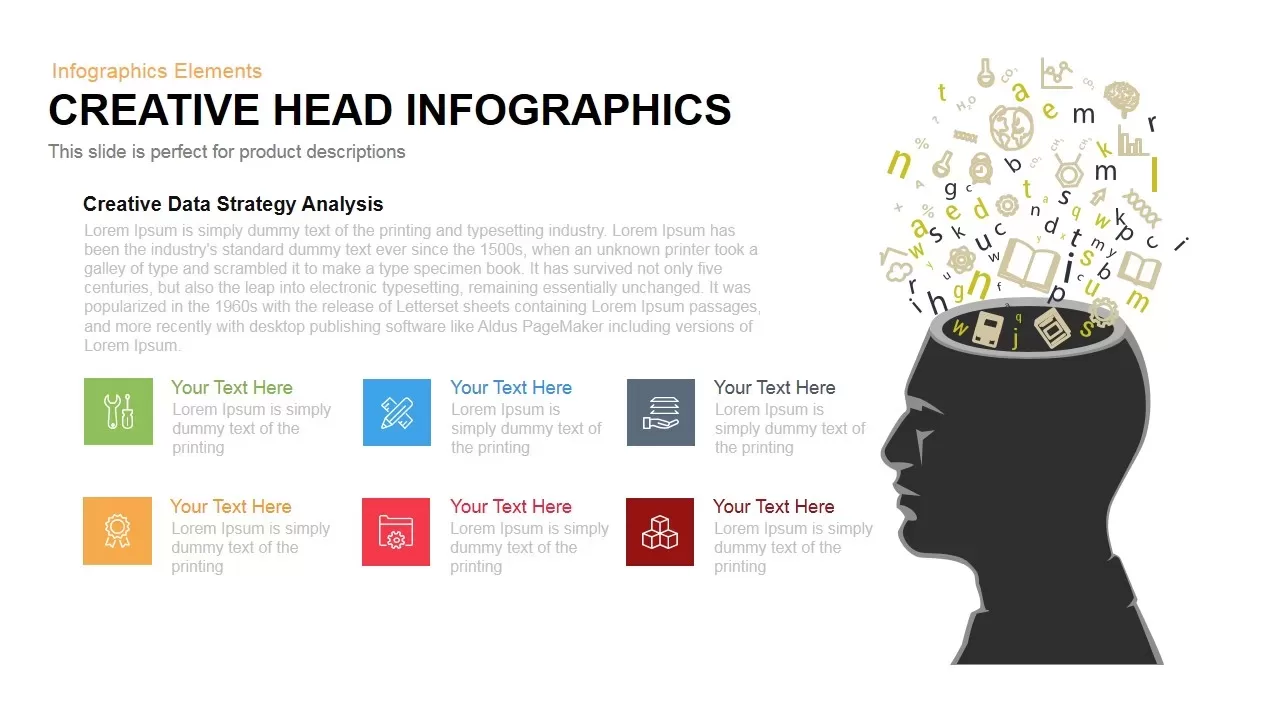
Dynamic Creative Head Infographics Template for PowerPoint & Google Slides
Circular
Dynamic 4 Gear Process Diagram Template for PowerPoint & Google Slides
Process
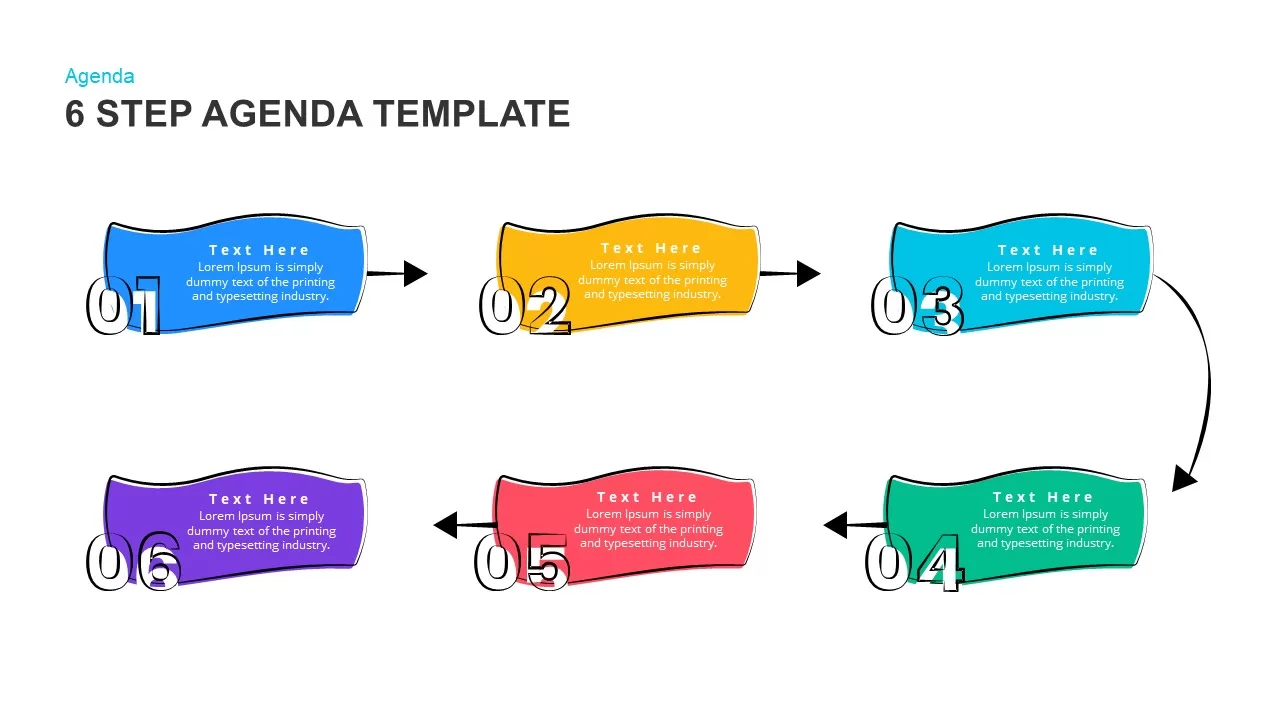
Modern & Dynamic 6-Step Agenda Sequence Template for PowerPoint & Google Slides
Agenda
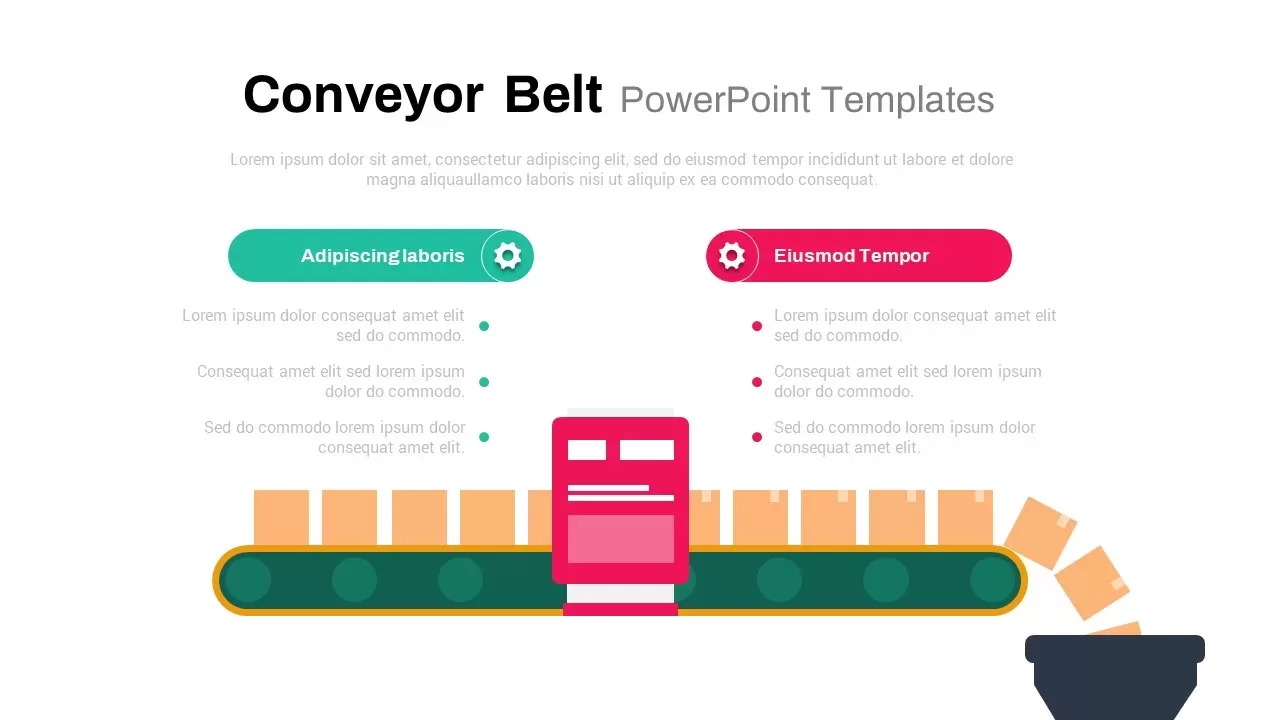
Conveyor Belt Presentation Template
Process
Dynamic Statistics & Progress Charts Template for PowerPoint & Google Slides
Pie/Donut
Dynamic Circular Hub-and-Spoke Infographic Template for PowerPoint & Google Slides
Circular
Dynamic 3D Rubik’s Cube Diagram Pack Template for PowerPoint & Google Slides
Infographics
Dynamic Boxing Training Cover Slide Template for PowerPoint & Google Slides
Graphics
Dynamic Relay Race Presentation Slide Template for PowerPoint & Google Slides
Graphics
Dynamic Fundraising Thermometer Slide Template for PowerPoint & Google Slides
Revenue
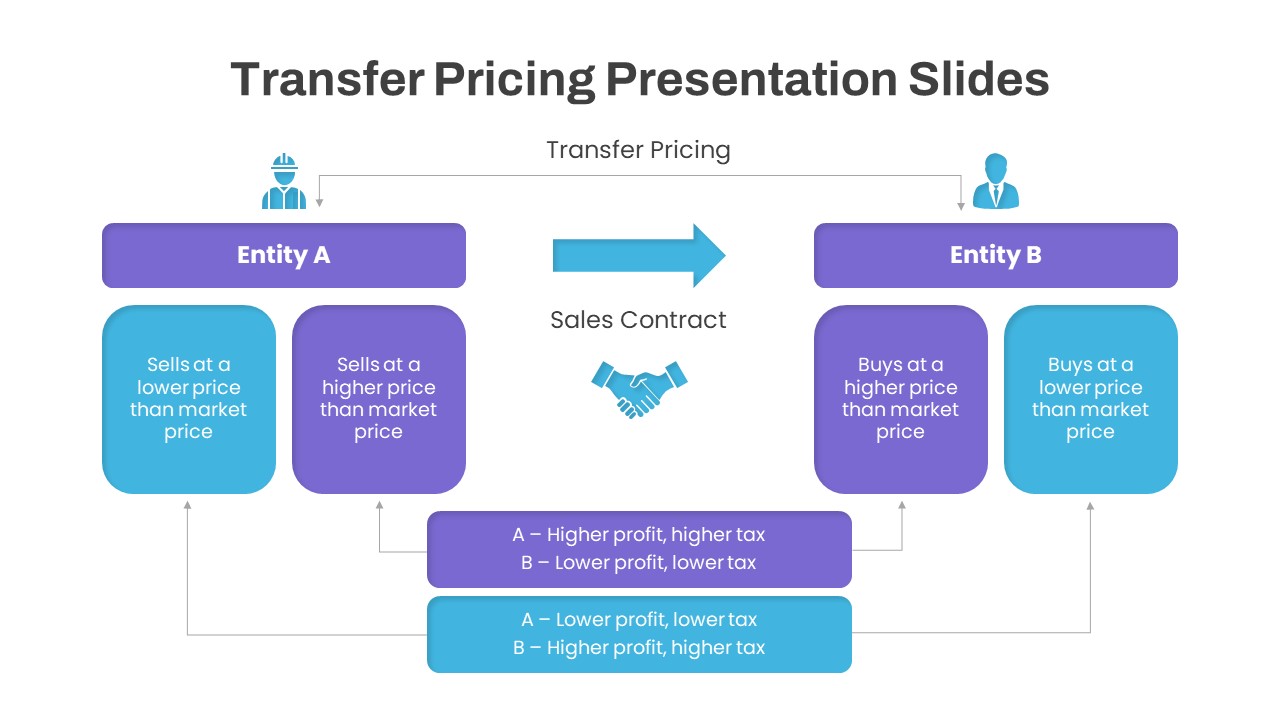
Transfer Pricing PowerPoint Template
Finance