


Expanding Margins Analysis Bar Chart Template for PowerPoint & Google Slides

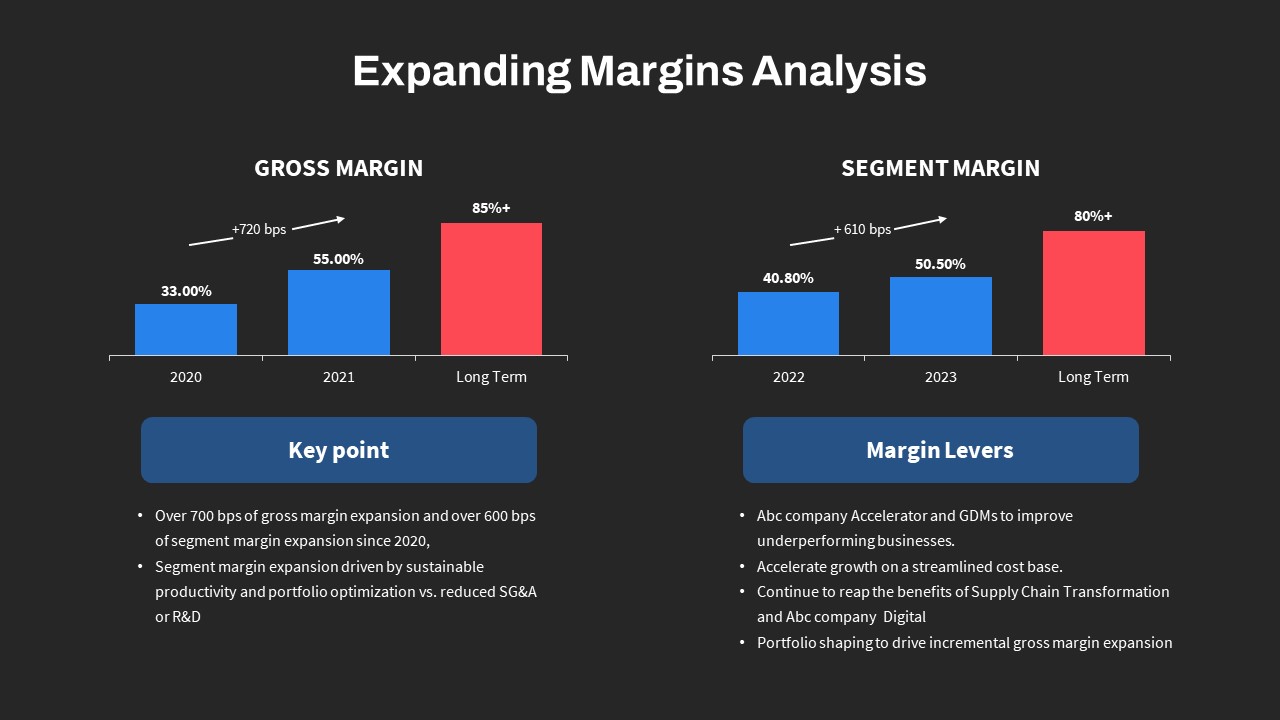

Elevate financial storytelling with this dual bar-chart slide illustrating gross and segment margin expansion. The left chart presents gross margin growth from 33.00% in 2020 to 55.00% in 2021, targeting 85%+ long term; the right chart displays segment margin rising from 40.80% in 2022 to 50.50% in 2023 en route to an 80%+ goal. Crisp percentage labels appear above each bar, while upward arrows with +720 bps and +610 bps callouts underscore key gains. Historical data bars adopt a vibrant blue tone; long-term targets are highlighted in bold red. Customizable light-blue callout boxes beneath each chart deliver concise summaries and detailed margin levers—covering productivity improvements and portfolio optimization.
Designed for flexible branding, this template leverages master slide layouts, editable vector shapes, and unified typography to support corporate standards. Quickly swap percentage values, adjust bar fills to match brand palettes, or customize the circular gradient arrow icon to reflect deck progression. A clean grid alignment, generous whitespace, and subtle drop shadows maintain visual clarity across projector or desktop displays. Fully compatible with PowerPoint and Google Slides, the slide ensures high-resolution fidelity, seamless transitions, and effortless integration within larger deck assemblies.
Whether you’re presenting an investor update, board review, or operational briefing, this margins analysis slide combines data-driven precision with modern design, enabling teams to highlight performance metrics, support strategic discussions, drive alignment across stakeholders, and accelerate decision-making processes.
Who is it for
Finance leaders, FP&A analysts, and executive teams will benefit from this slide for margin expansion reports, strategic roadmap briefings, or cost-efficiency initiatives. Strategy consultants and corporate development professionals can also illustrate performance trends and leverage margin levers.
Other Uses
Repurpose this design for revenue growth analysis, cost-saving presentations, pricing strategy reviews, or efficiency benchmarking. Swap metrics to track customer acquisition costs, churn rates, or EBITDA margins, ensuring versatility across finance and operations. Use the callout boxes to highlight key drivers or risk factors for targeted discussions.
Login to download this file

Item ID
SB04278
Related Templates

Creative Data Analysis Bar Chart template for PowerPoint & Google Slides
Bar/Column
Pencil Bar Chart Data Analysis Template for PowerPoint & Google Slides
Bar/Column
Waterfall Bar Chart Analysis Template for PowerPoint & Google Slides
Bar/Column
Data Analysis Bar Chart with Insights Template for PowerPoint & Google Slides
Bar/Column
Free
Comparison Bar Chart template for PowerPoint & Google Slides
Comparison Chart
3D Cylinder Bar Chart Template for PowerPoint & Google Slides
Bar/Column

Monthly Reports Bar Chart template for PowerPoint & Google Slides
Bar/Column
Interactive Product Comparison Bar Chart Template for PowerPoint & Google Slides
Bar/Column
For and Against Vote Count Bar Chart Template for PowerPoint & Google Slides
Bar/Column
Entertainment Industry Revenue Bar Chart Template for PowerPoint & Google Slides
Bar/Column
Statistics Infographic & KPI Bar Chart Template for PowerPoint & Google Slides
Bar/Column
Multi-Series Stacked Bar Chart Template for PowerPoint & Google Slides
Bar/Column
Monthly Recurring Revenue KPI Bar Chart Template for PowerPoint & Google Slides
Bar/Column
Animated Stacked Bar Chart Template for PowerPoint & Google Slides
Bar/Column
Simple Bar Chart Data Visualization Template for PowerPoint & Google Slides
Bar/Column
Mirror Bar Chart Comparison Template for PowerPoint & Google Slides
Bar/Column
Quarterly Sales Review Bar Chart Template for PowerPoint & Google Slides
Bar/Column
Horizontal Bar Chart Slide with Icons Template for PowerPoint & Google Slides
Bar/Column
Two-Option Bar Chart Comparison Table Template for PowerPoint & Google Slides
Comparison
Bar Gantt Chart Template for PowerPoint & Google Slides
Gantt Chart


