Growth Curve Line Chart Visualization Template for PowerPoint & Google Slides


Description
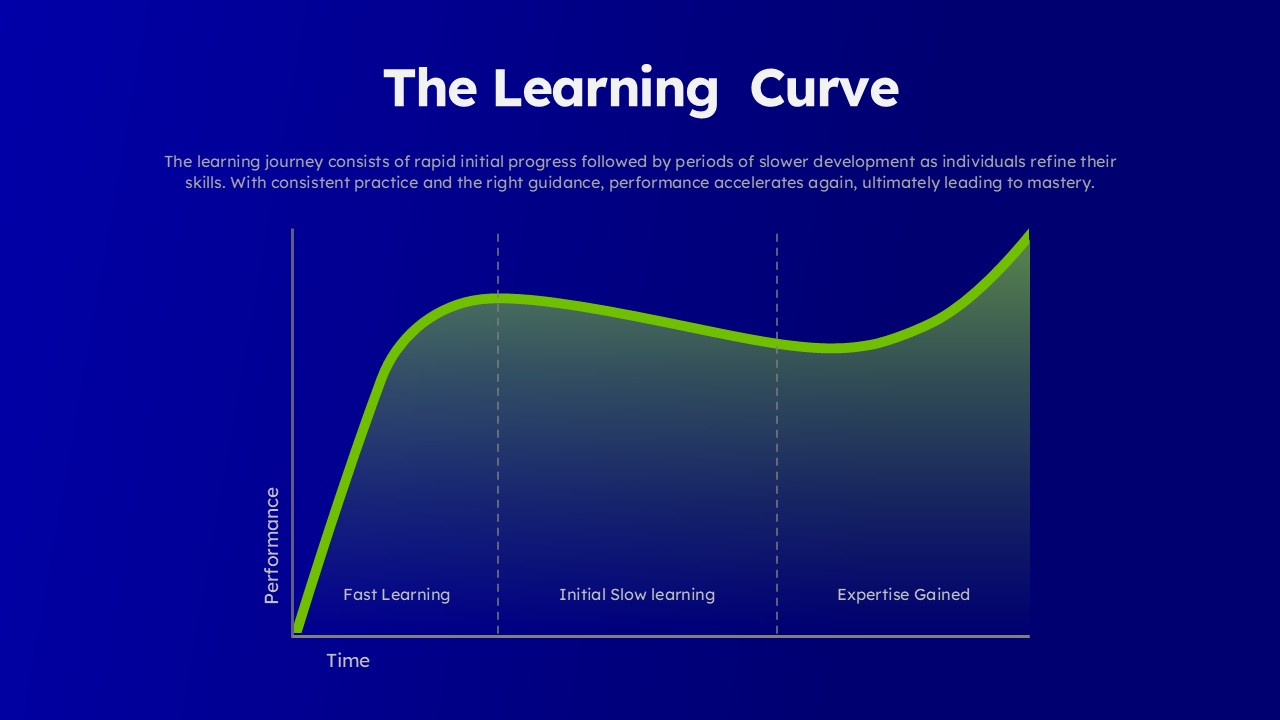
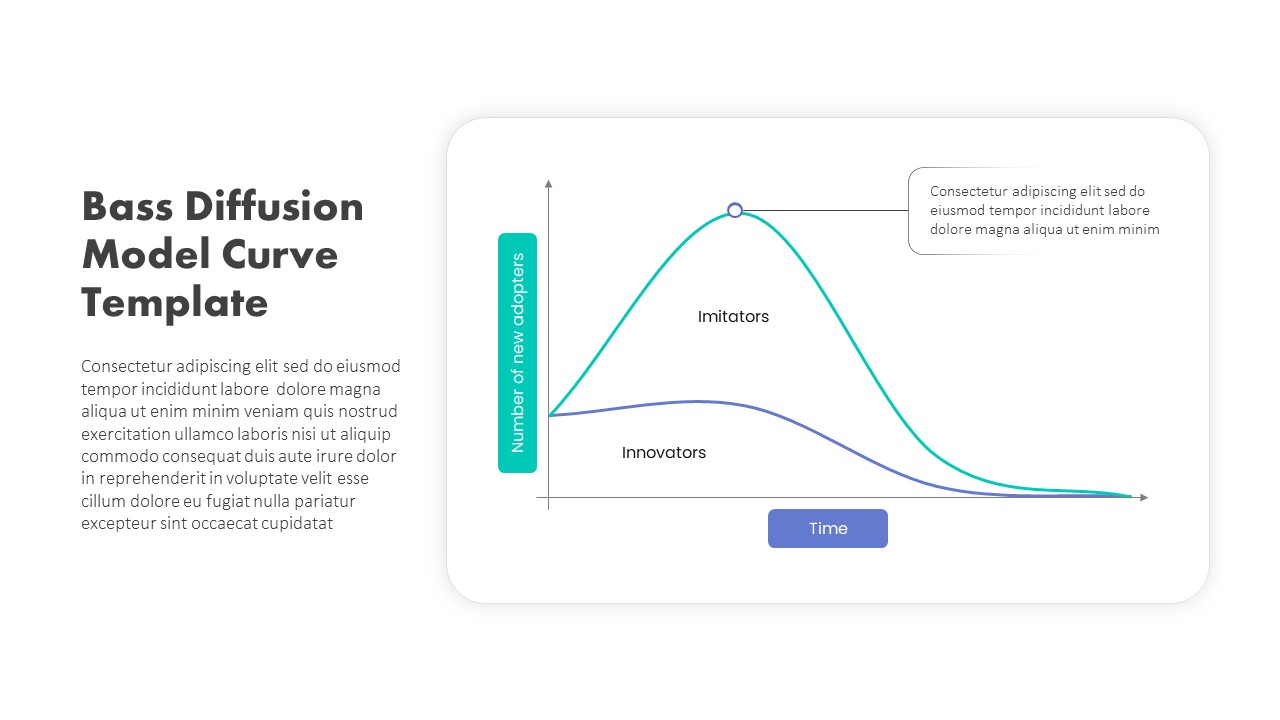
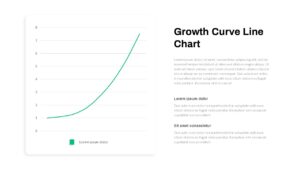
Leverage this dynamic growth curve line chart slide to illustrate exponential trends and performance metrics with clarity and impact. The two-column layout pairs a crisp, white-background chart on the left with customizable text placeholders on the right, enabling you to contextualize data insights alongside narrative commentary. The chart features subtle gray gridlines, minimal axis labels, and a vibrant green trend line that scales smoothly from baseline through accelerated growth phases. A clean legend placeholder beneath the chart ensures clear series identification, while ample padding and rounded corners contribute to a modern, professional aesthetic.
Built for efficiency, this asset includes fully editable vector elements, chart placeholders linked to native PowerPoint data tables, and master-slide integration for swift global updates. Swap colors, adjust line weights, or modify axis intervals in seconds to align with your brand guidelines. The layout accommodates a headline, a summary paragraph, and multiple subheadings for detailed analysis or callouts, making it ideal for executive briefings and stakeholder presentations. Responsive design ensures full-resolution clarity across monitors and projectors, while compatibility with Google Slides preserves formatting fidelity and interactive chart functionality.
Whether presenting quarterly KPIs, forecasting revenue growth, or tracking user adoption curves, this template streamlines your workflow and enhances audience engagement. Its minimalist design minimizes distractions, focusing attention on key performance indicators and trend narratives. Optimized for rapid data iteration and collaborative editing, this slide empowers teams to deliver data-driven stories with confidence and precision.
Advanced formatting options allow you to integrate additional data series, apply trendline equations, or annotate key inflection points to highlight critical milestones. Use built-in placeholder icons to represent product launches, marketing campaigns, or financial targets, and adjust typography styles to reinforce brand identity. With support for both light and dark themes, this slide adapts seamlessly to diverse presentation environments.
Who is it for
Business analysts, financial planners, marketing strategists, and product managers who need to present growth trajectories or performance metrics in clear, visually engaging formats.
Other Uses
Repurpose this slide for revenue forecasts, user adoption reporting, KPI dashboards, financial reviews, investment pitches, or product launch timelines. Its editable design also suits trend analysis, milestone tracking, and progress reporting across departments.
Login to download this file

Item ID
SB03661
Related Templates

Learning Curve Performance Growth Chart Template for PowerPoint & Google Slides
Employee Performance
3D Cone Chart Data Visualization template for PowerPoint & Google Slides
Bar/Column
Waffle Chart Data Visualization Template for PowerPoint & Google Slides
Comparison Chart
Free Stacked Column Chart Data Visualization Template for PowerPoint & Google Slides
Bar/Column
Free
Simple Bar Chart Data Visualization Template for PowerPoint & Google Slides
Bar/Column
XY Bubble Chart Data Visualization Template for PowerPoint & Google Slides
Comparison Chart
Waterfall Chart Data Visualization Template for PowerPoint & Google Slides
Comparison Chart
Dynamic Sunburst Chart Visualization Template for PowerPoint & Google Slides
Charts
Segmented Scatter Chart Data Visualization Template for PowerPoint & Google Slides
Business Strategy
Greiner’s Growth Model Curve template for PowerPoint & Google Slides
Infographics
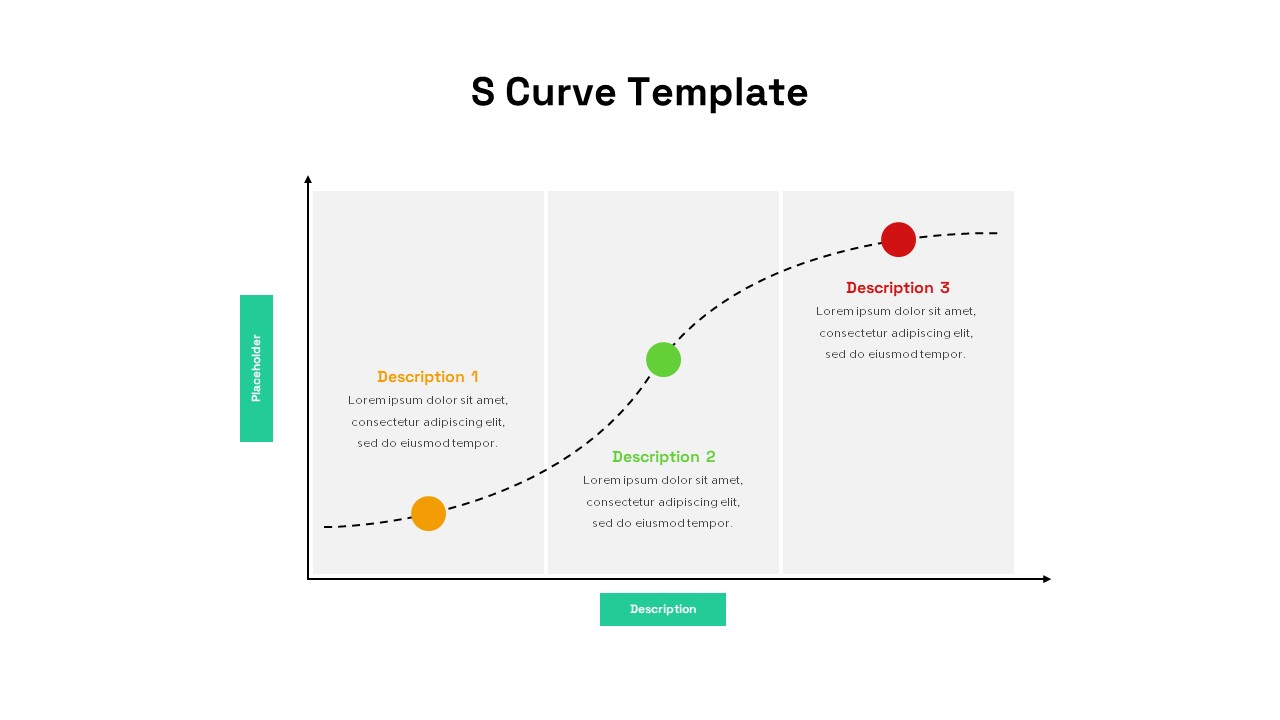
Three-Stage S Curve Growth Diagram Template for PowerPoint & Google Slides
Process
3D Cylinder Bar Chart Visualization Template for PowerPoint
Bar/Column
Sales Growth Dashboard: KPI Gauge & Line Template for PowerPoint & Google Slides
Revenue
Circle Graph Data Visualization Template for PowerPoint & Google Slides
Circular

Bold Diamond Risk Alert Visualization Template for PowerPoint & Google Slides
Risk Management
Gear Pie Diagram Data Visualization Template for PowerPoint & Google Slides
Pie/Donut
Leaf Infographic Data Visualization Template for PowerPoint & Google Slides
Infographics
Mobile Infographics Data Visualization Template for PowerPoint & Google Slides
Infographics
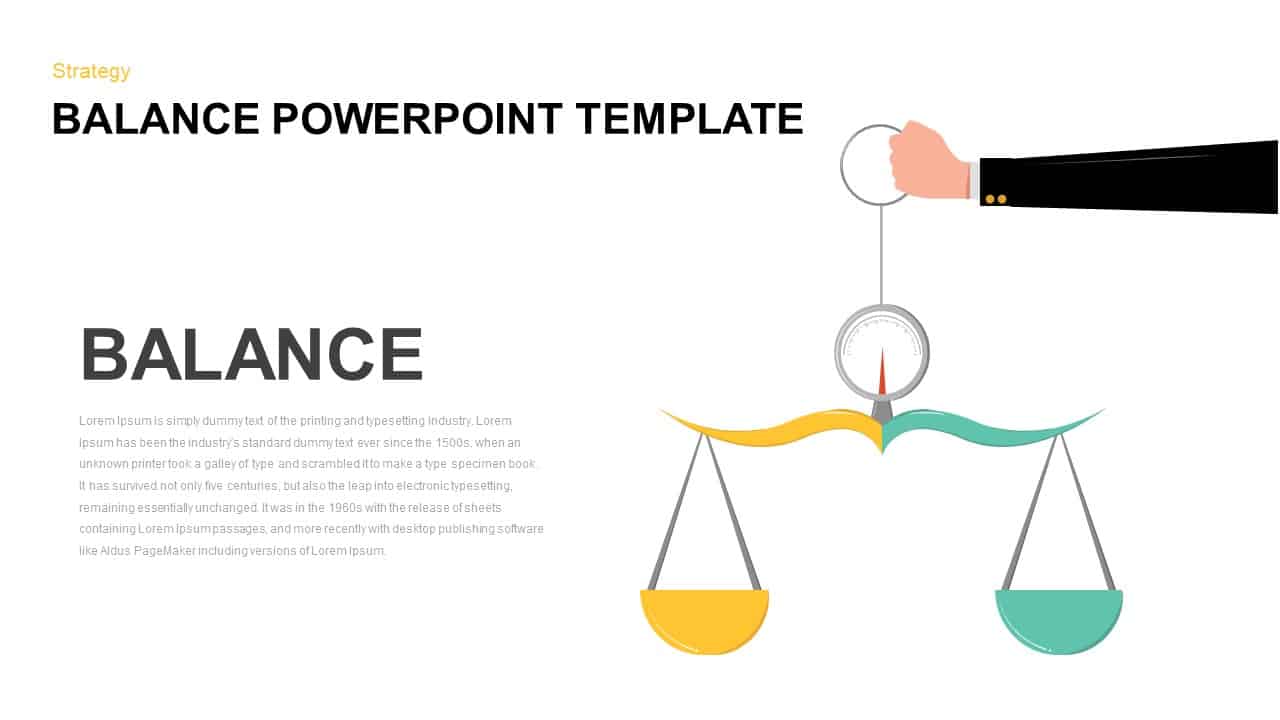
Balance Scale Visualization Infographic Template for PowerPoint & Google Slides
Comparison
Medical Infographics Data Visualization Template for PowerPoint & Google Slides
Health
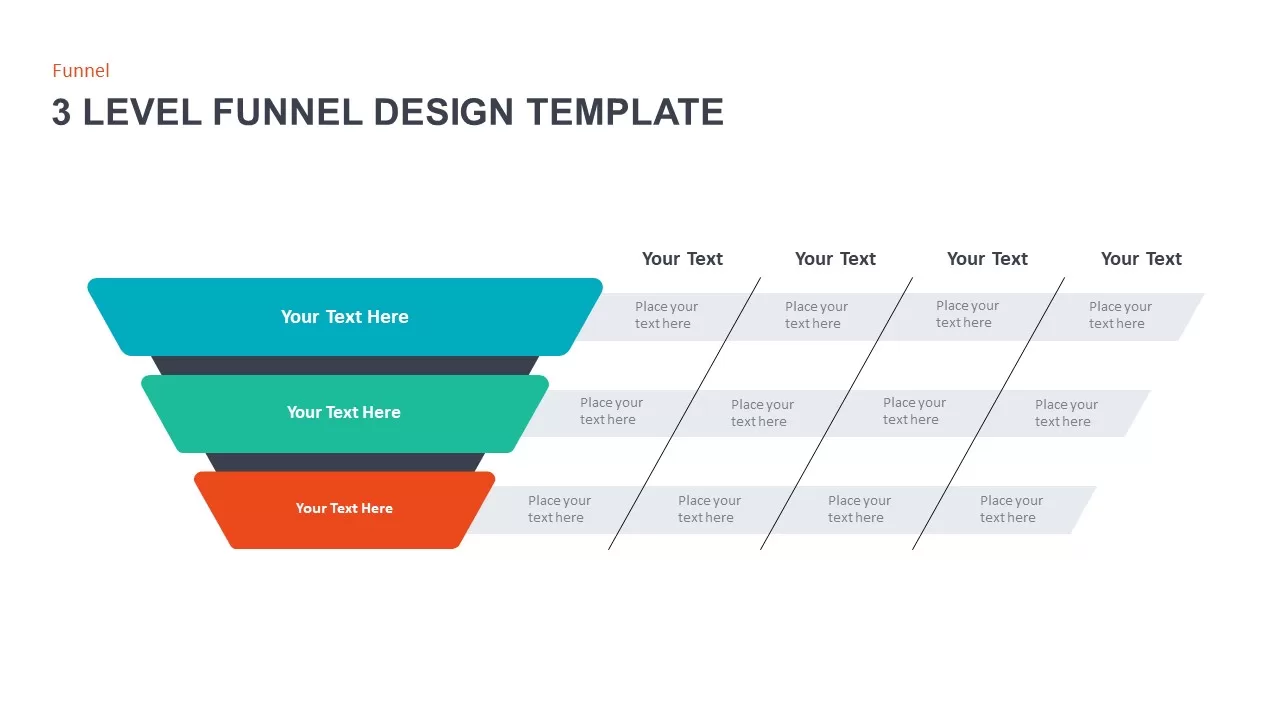
3 Level Funnel Design Visualization Template for PowerPoint & Google Slides
Funnel
KPI Dashboard Data Visualization Template for PowerPoint & Google Slides
Bar/Column
Professional Risk Heat Map Visualization Template for PowerPoint & Google Slides
Risk Management
Professional Heatmap Data Visualization Template for PowerPoint & Google Slides
Infographics
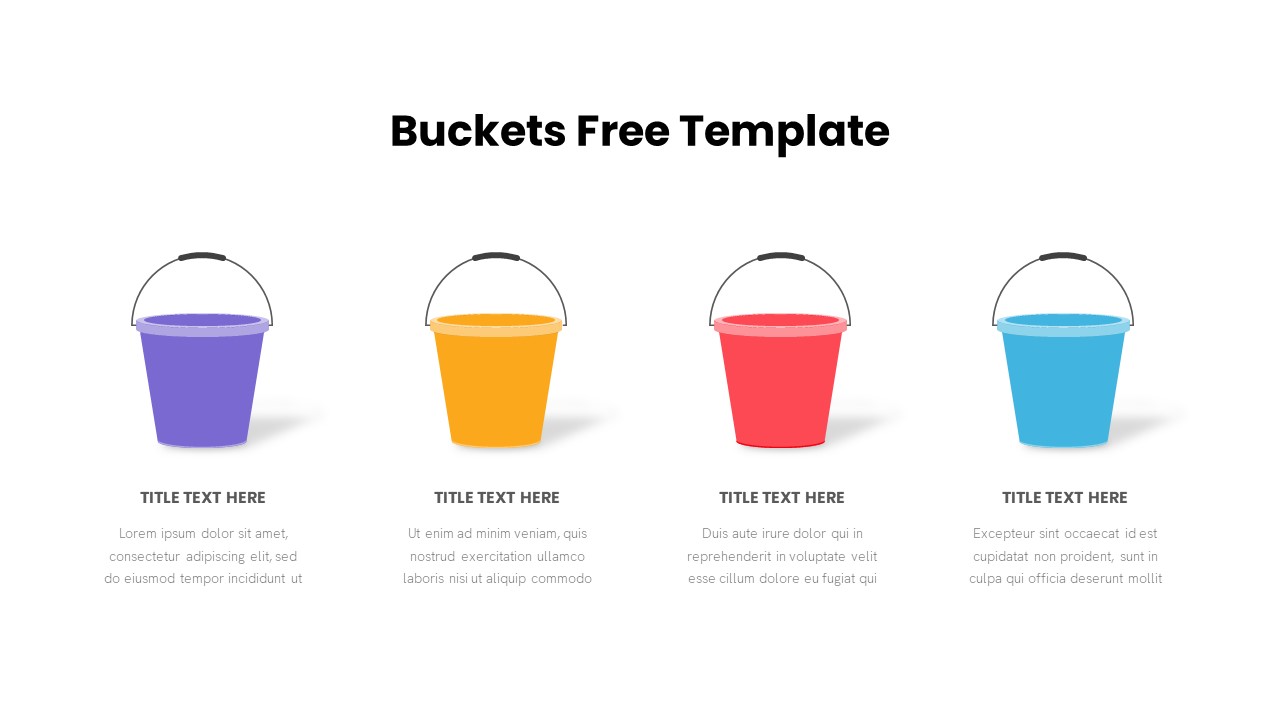
Free Bucket Process Visualization Template for PowerPoint & Google Slides
Process
Free
Animated Light Bulb Visualization Template for PowerPoint & Google Slides
Process
UK Counties Map Data Visualization Template for PowerPoint & Google Slides
World Maps
Progress Bar and Milestone Visualization Template for PowerPoint & Google Slides
Timeline
Free Big Data Network Visualization Template for PowerPoint & Google Slides
Circular
Free
Kentucky County Map Visualization Template for PowerPoint & Google Slides
World Maps
Free Four Box Style Visualization PPT Template & Slides
Process
Free

Line Chart Analysis template for PowerPoint & Google Slides
Charts

Application Revenue Line Chart KPI Template for PowerPoint & Google Slides
Revenue
Combination Bar and Line Chart Template for PowerPoint & Google Slides
Bar/Column
Editable Multi-Series Peak Line Chart Template for PowerPoint & Google Slides
Comparison Chart
Arrow Line Chart Template for PowerPoint & Google Slides
Comparison Chart
Data Over Time Line Chart template for PowerPoint & Google Slides
Charts
Evolution Line Chart with Milestones Template for PowerPoint & Google Slides
Timeline
Multiple Line Chart Comparison Template for PowerPoint & Google Slides
Comparison Chart
Multi-Series Line Chart with Icons Template for PowerPoint & Google Slides
Comparison Chart
Interactive Jump Line Data Chart Template for PowerPoint & Google Slides
Comparison Chart
Skimming Pricing Strategy Line Chart Template for PowerPoint & Google Slides
Business Strategy
Dynamic Financial Analysis Line Chart Template for PowerPoint & Google Slides
Finance
3D Line Chart for PowerPoint & Google Slides
Charts

Growth Arrow for Progress & Growth template for PowerPoint & Google Slides
Arrow
Data-Driven Line Chart Diagram Template for PowerPoint
Comparison Chart
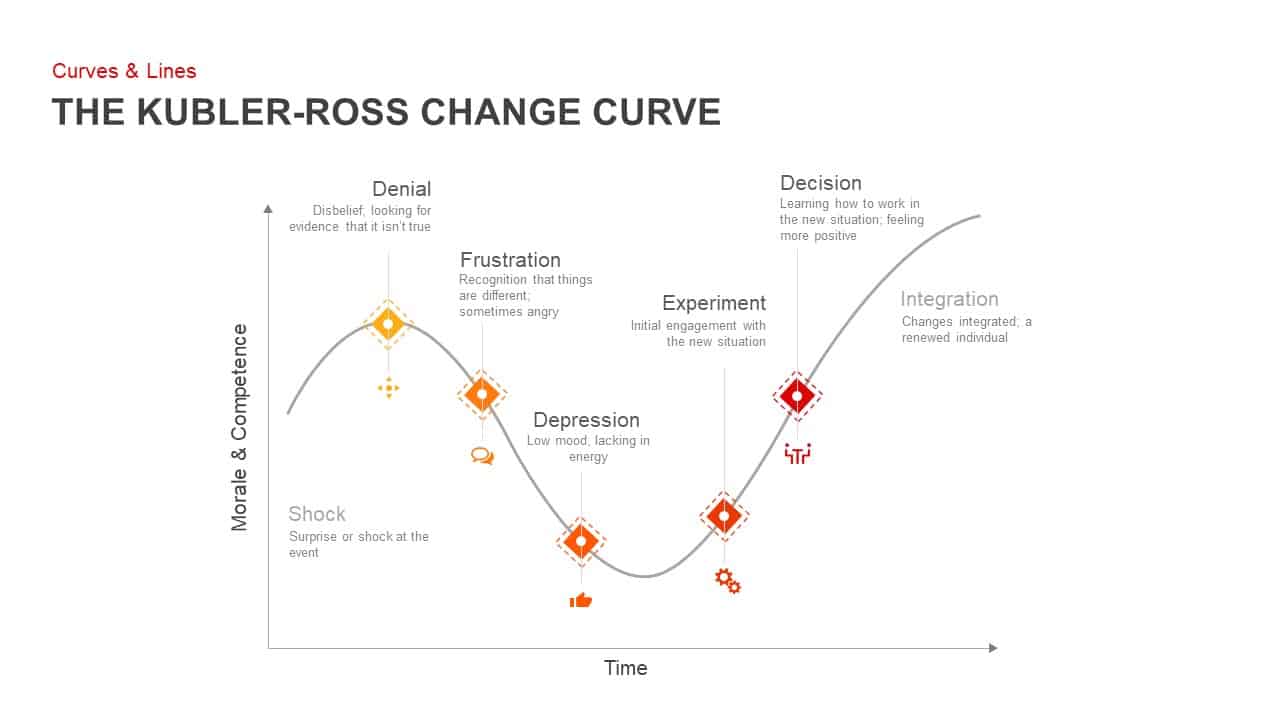
Kubler-Ross Change Curve Diagram Template for PowerPoint & Google Slides
Timeline
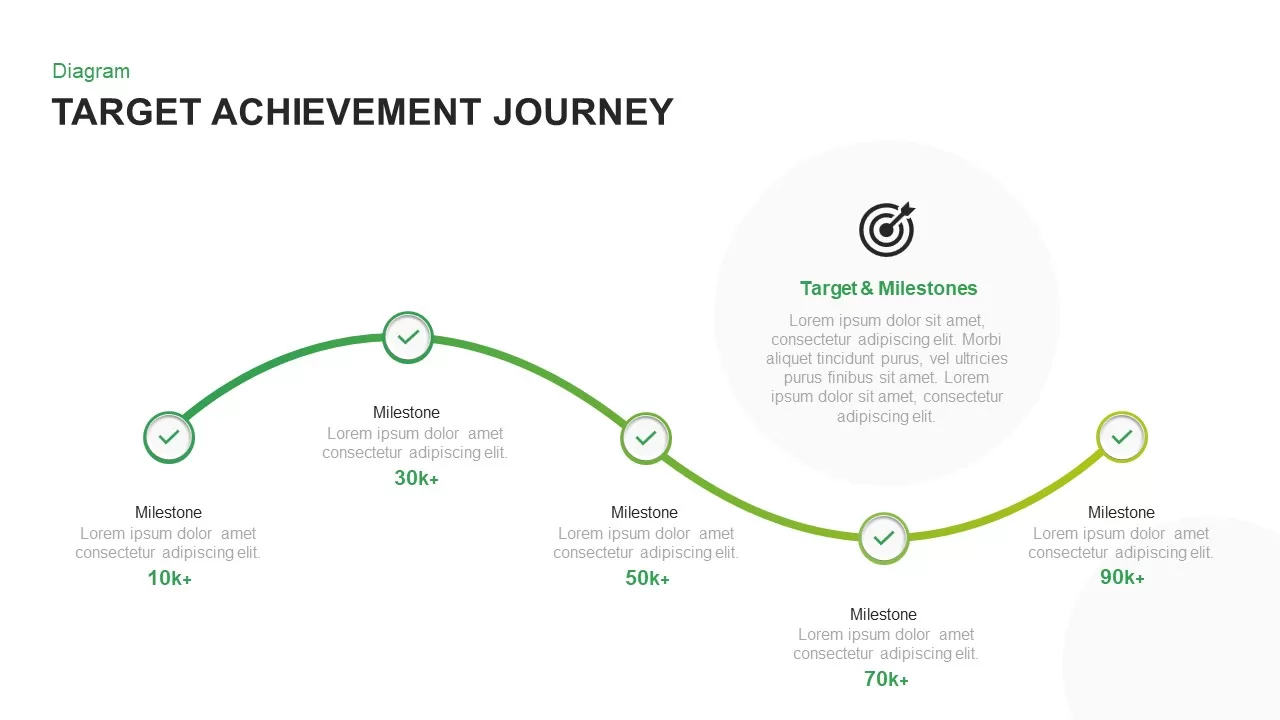
Target Achievement Milestone Curve Template for PowerPoint & Google Slides
Roadmap

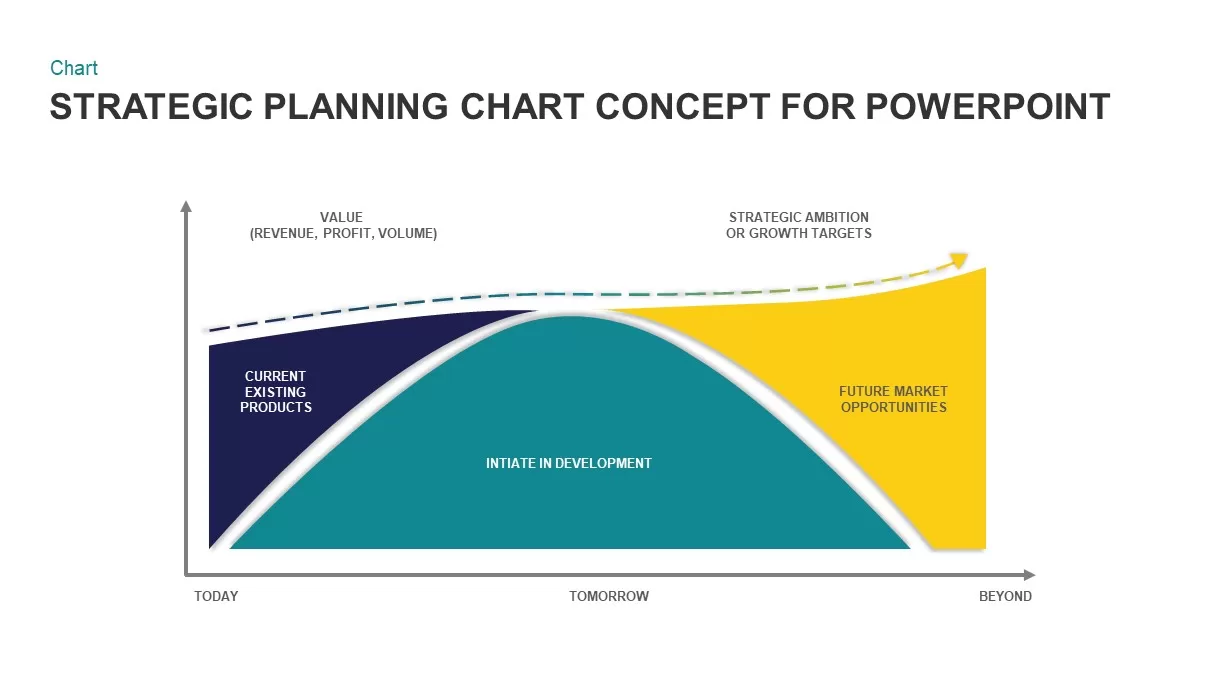
Strategic Planning Curve Diagram Template for PowerPoint & Google Slides
Charts
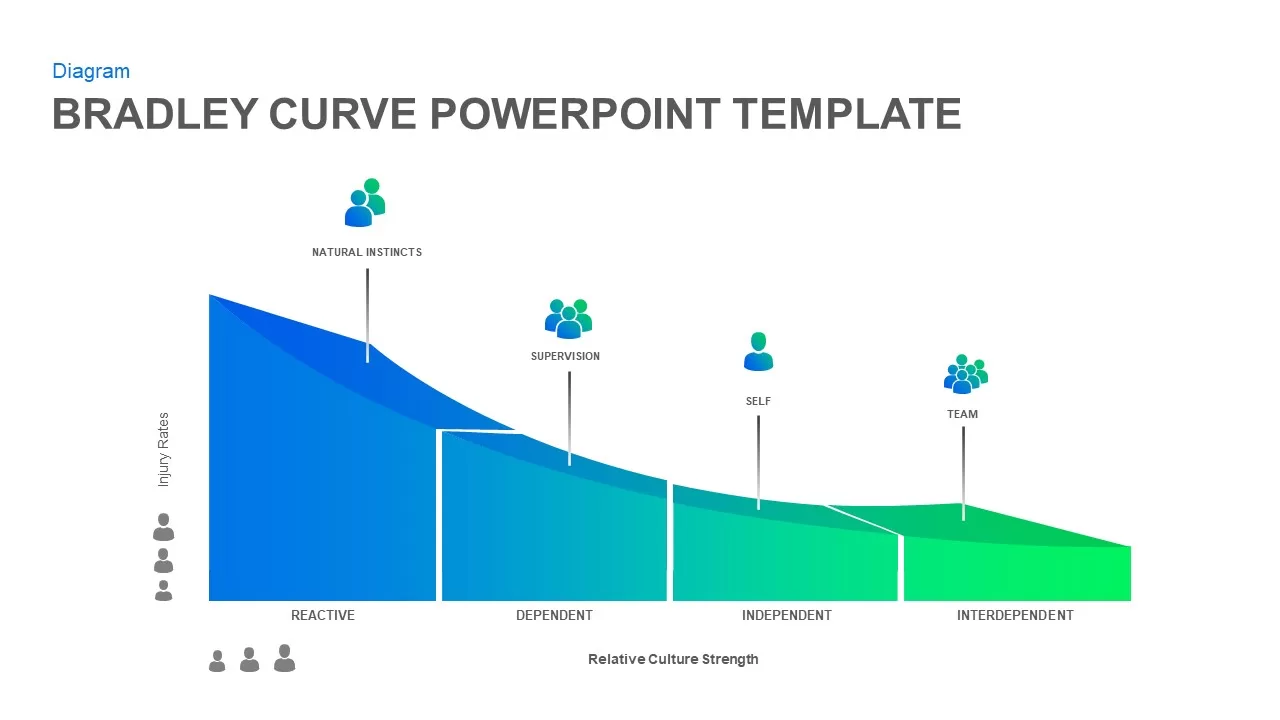
Bradley Curve Infographic Template for PowerPoint & Google Slides
Infographics
Snake Shaped Curve Diagram template for PowerPoint & Google Slides
Business
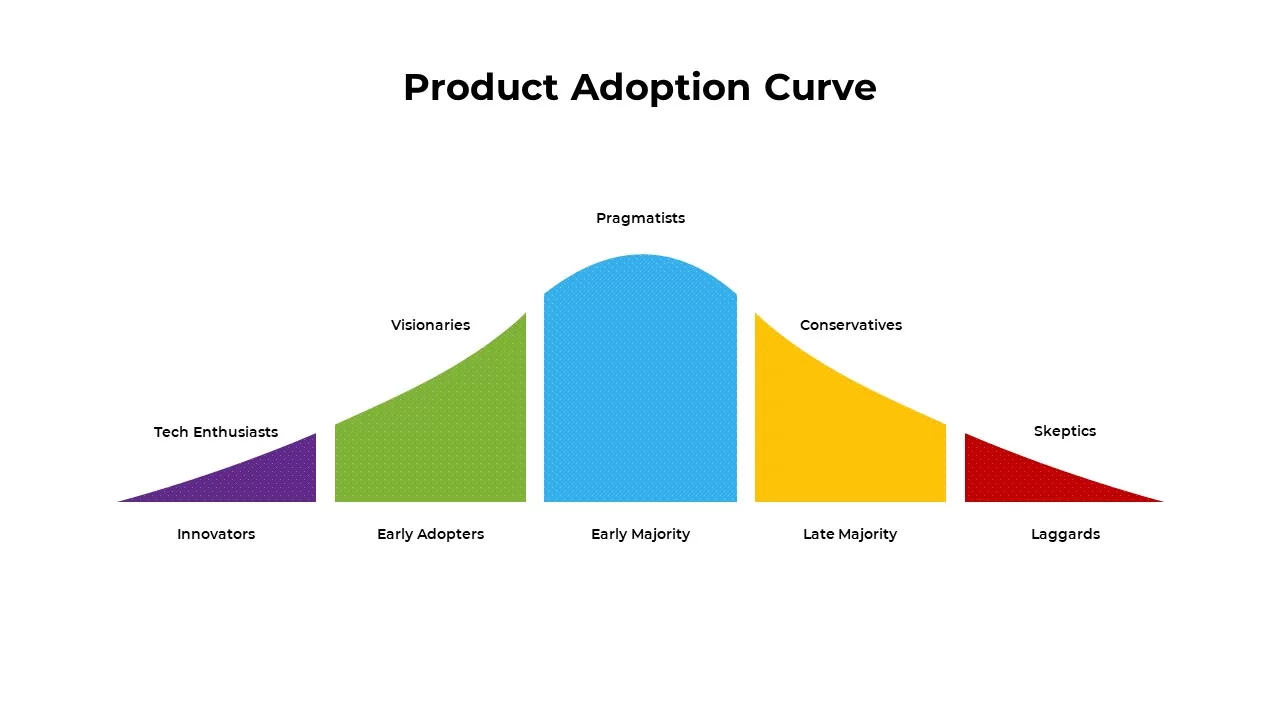
Product Adoption Curve Template for PowerPoint & Google Slides
Process
8-Bell Curve Infographic Slide Template for PowerPoint & Google Slides
Comparison Chart
S-Curve Progression Framework Diagram Template for PowerPoint & Google Slides
Charts
Bass Diffusion Model Curve for Adoption Template for PowerPoint & Google Slides
Comparison Chart
Experience Curve Analysis Diagram Template for PowerPoint & Google Slides
Business Strategy
Economies of Scale Cost Curve Comparison Template for PowerPoint & Google Slides
Comparison Chart
Gartner Hype Cycle Adoption Curve Diagram Template for PowerPoint & Google Slides
Infographics
Line Graph Analysis template for PowerPoint & Google Slides
Charts
Multi-Series Curved Line Graph Analytics Template for PowerPoint & Google Slides
Comparison Chart

Creative Clothing Line Presentation Template for PowerPoint & Google Slides
Pitch Deck
Fast Follower Strategy Line Graph Template for PowerPoint & Google Slides
Comparison Chart
3Ps Triple Bottom Line Venn Diagram Template for PowerPoint & Google Slides
Circular
4 People Racing to Finish Line Template for PowerPoint & Google Slides
Accomplishment
Curved Line Graph for PowerPoint & Google Slides
Timeline
7 and 6 Stage Line Diagram Overview for PowerPoint & Google Slides
Infographics
Five and Six Step Line Linear Stage Diagram for PowerPoint & Google Slides
Infographics
Business Growth Metaphor Chart Template for PowerPoint & Google Slides
Business
Annual Growth Trend Analysis Chart template for PowerPoint & Google Slides
Business Report
Sales Growth Comparison Chart & Table Template for PowerPoint & Google Slides
Bar/Column
Revenue vs Target Growth Chart Template for PowerPoint & Google Slides
Revenue
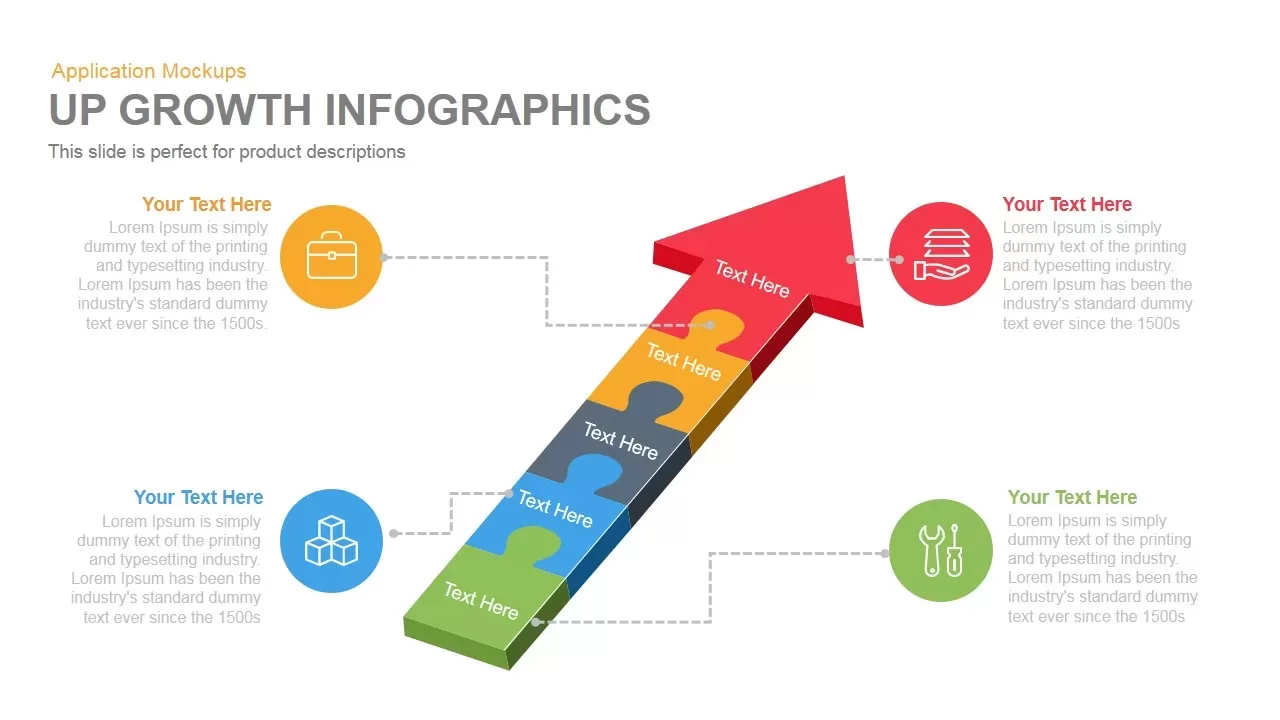
Growth Infographics template for PowerPoint & Google Slides
Arrow
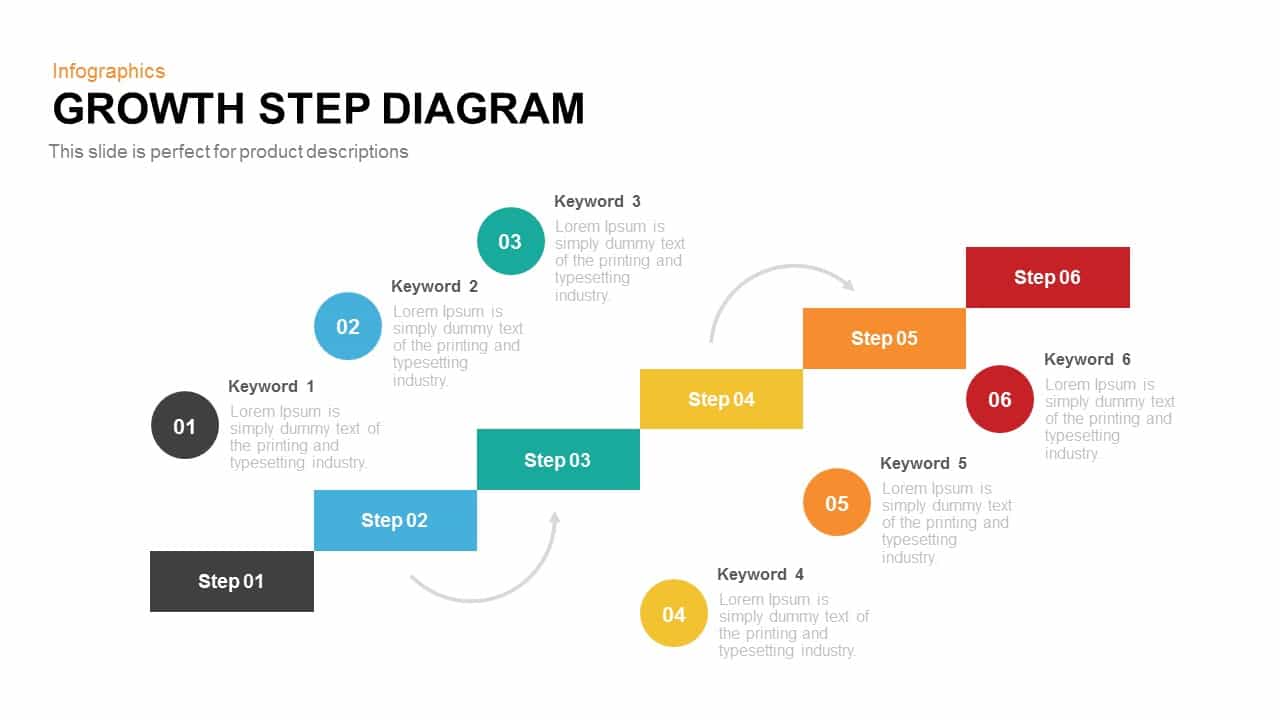
Growth Step Diagram template for PowerPoint & Google Slides
Infographics
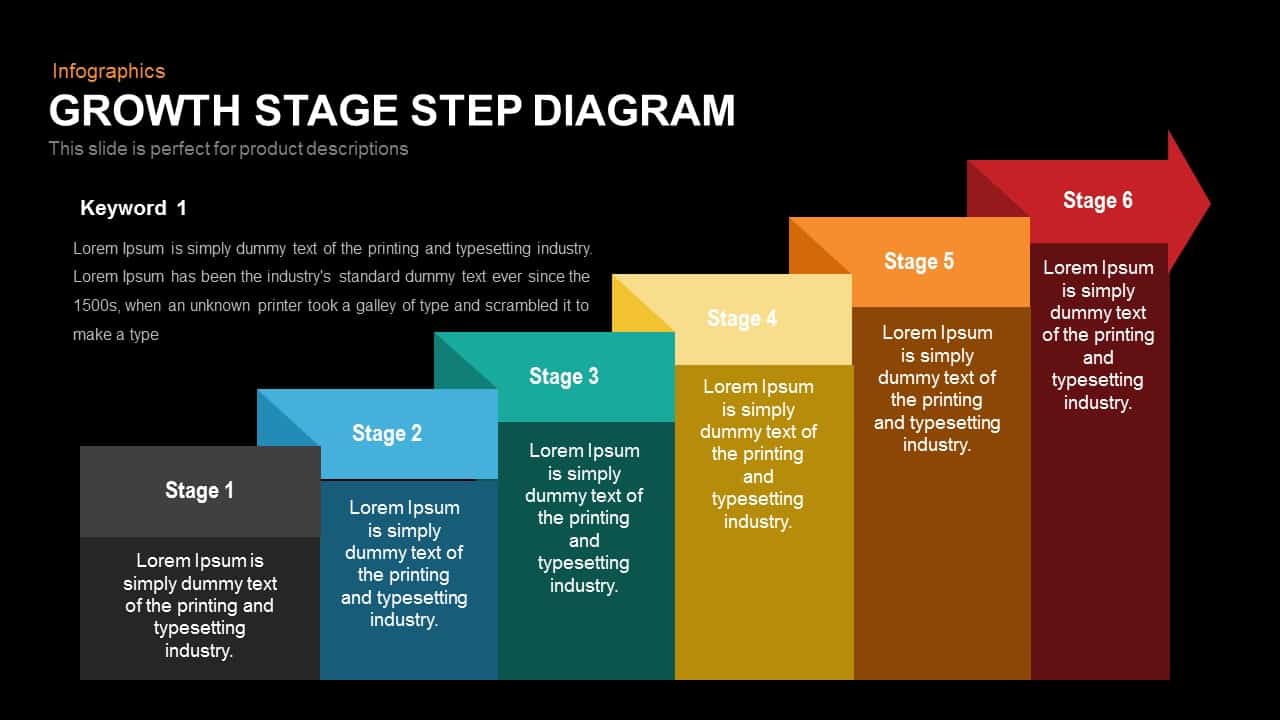
Growth Stage Diagram template for PowerPoint & Google Slides
Process
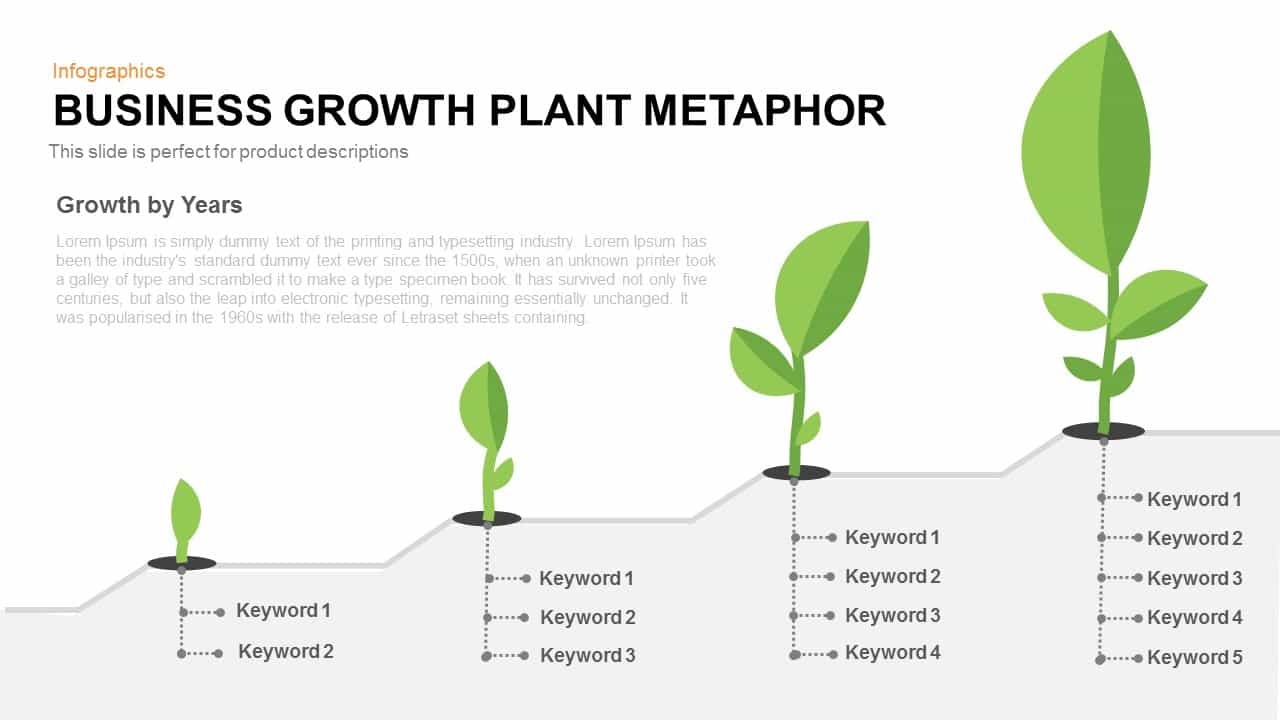
Business Growth Plant Metaphor Timeline Template for PowerPoint & Google Slides
Business Strategy
Five 3D Growth Arrow Infographic Slide Template for PowerPoint & Google Slides
Arrow

Tree Growth Stage Infographic Template for PowerPoint & Google Slides
Timeline
Improvement Growth Arrow Metaphor Template for PowerPoint & Google Slides
Bar/Column
Growth Sign Board Infographics template for PowerPoint & Google Slides
Timeline
Five-Stage Growth Arrow Infographic Template for PowerPoint & Google Slides
Arrow
Ansoff Matrix Growth Strategy Model Template for PowerPoint & Google Slides
BCG
Six Stage Incremental Growth template for PowerPoint & Google Slides
Timeline
Growth Plant Infographics template for PowerPoint & Google Slides
Process
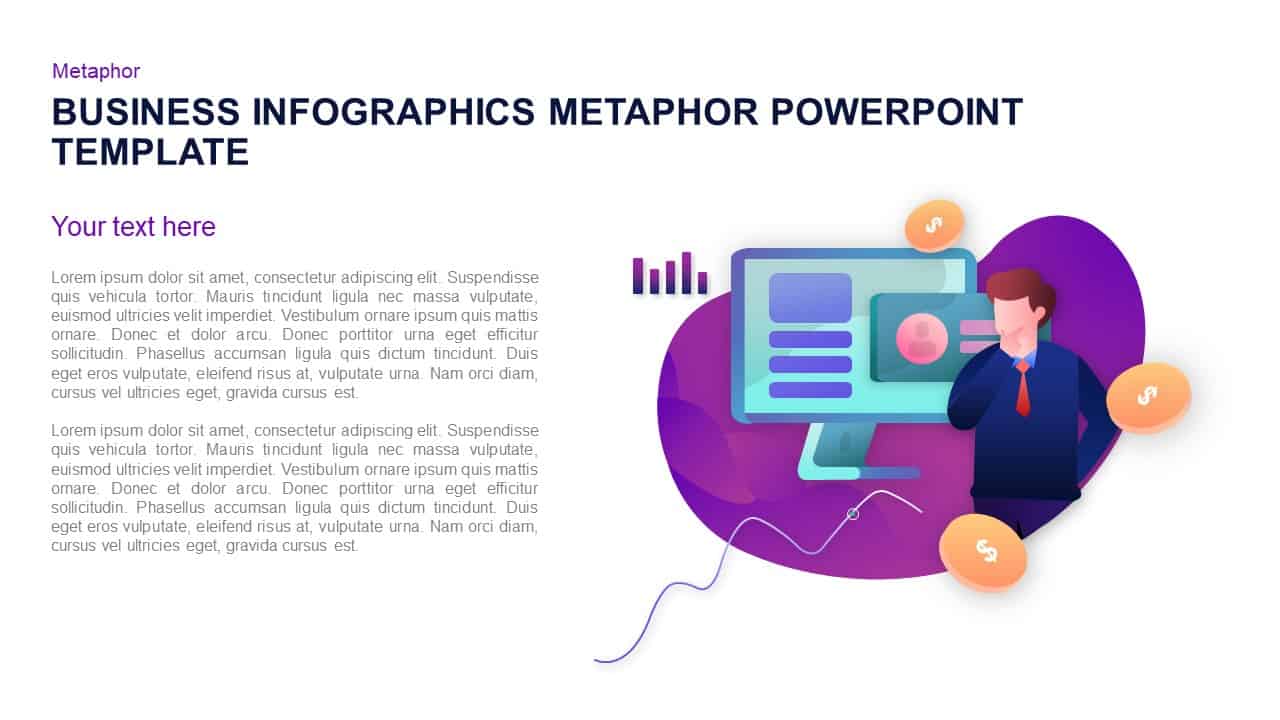
Business Growth Infographic Metaphor Template for PowerPoint & Google Slides
Revenue
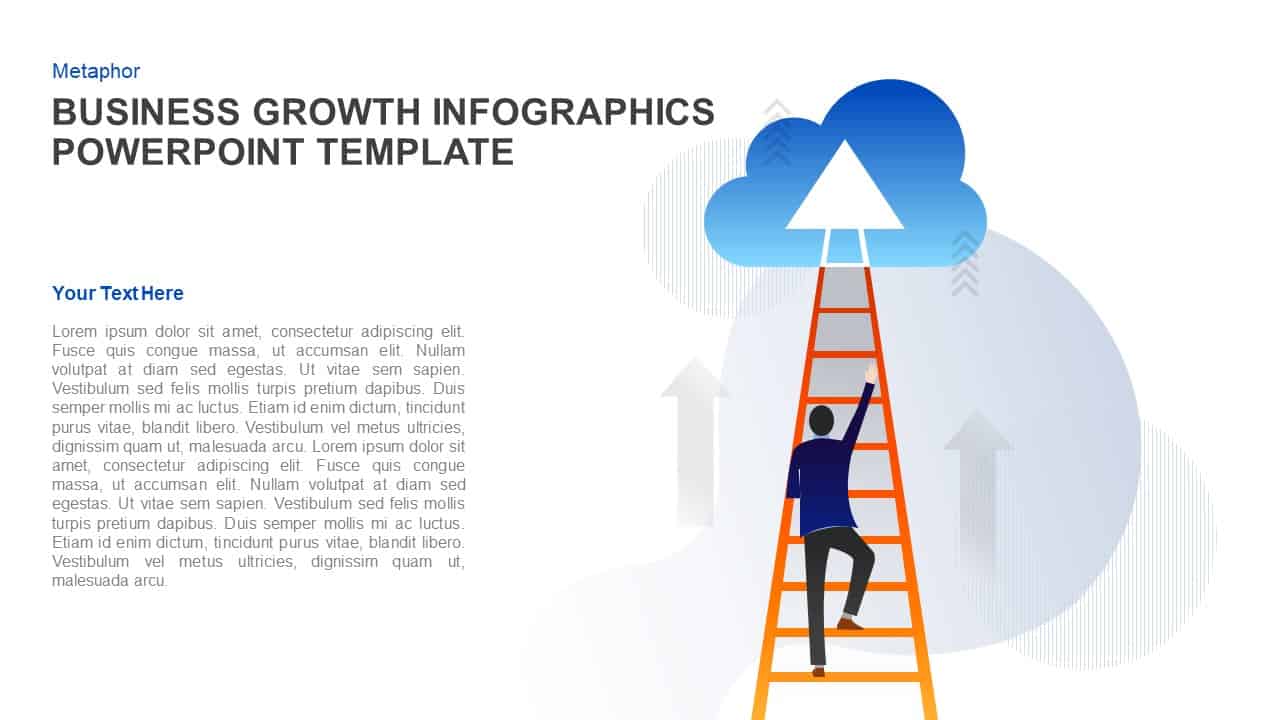
Business Growth Ladder to Cloud Metaphor Template for PowerPoint & Google Slides
Vision and Mission
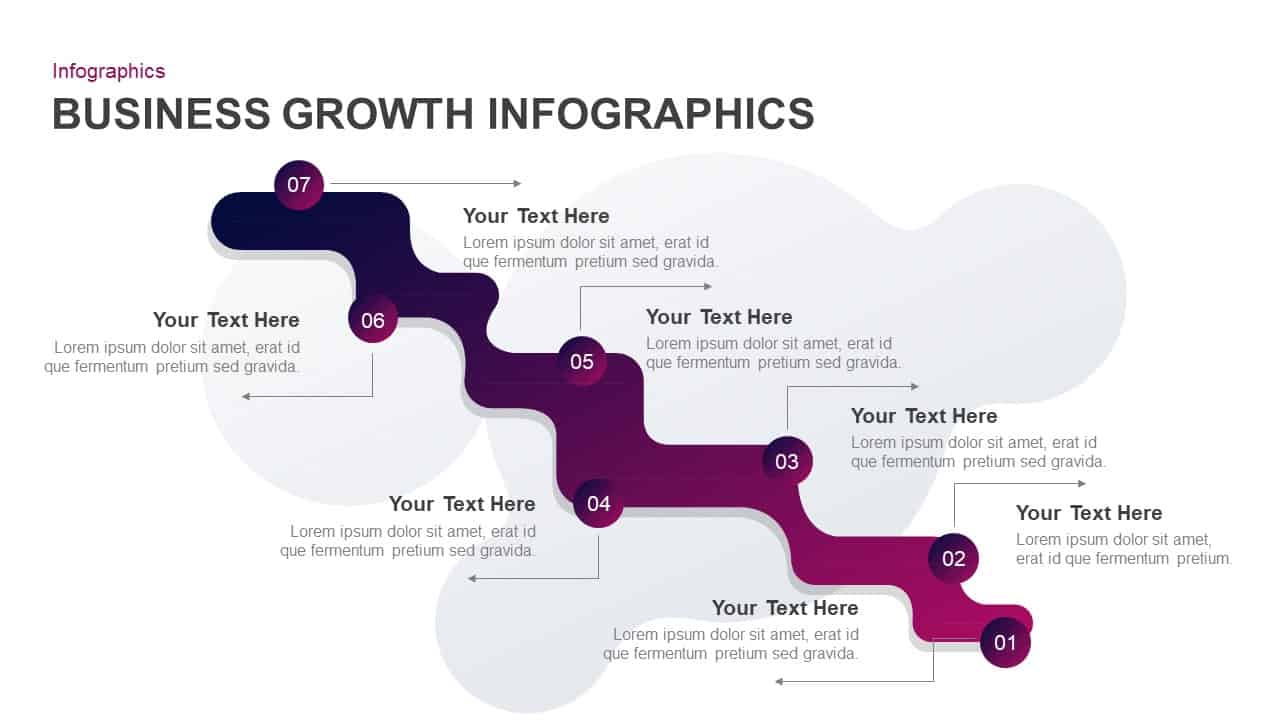
Business Growth Infographics Template for PowerPoint & Google Slides
Roadmap
5-Stage Financial Growth Timeline Template for PowerPoint & Google Slides
Timeline
Business Growth Plant Infographics Pack Template for PowerPoint & Google Slides
Process
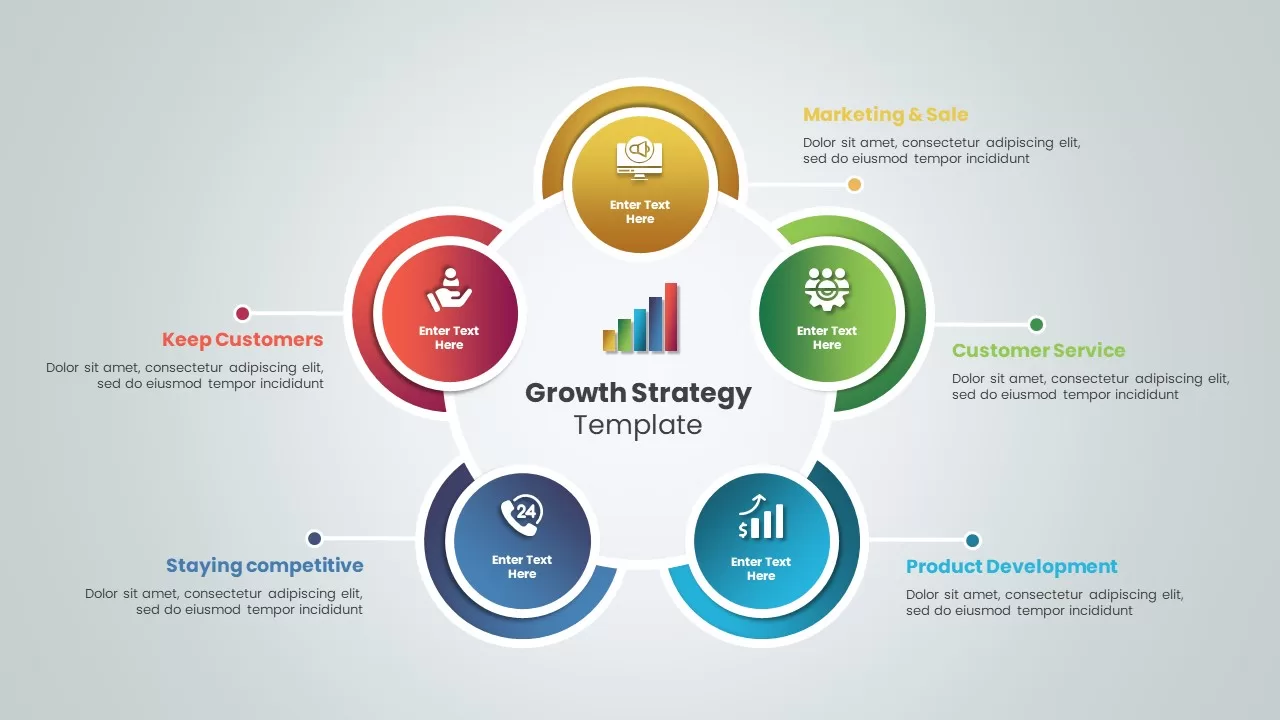
Growth Strategy Circular Diagram Template for PowerPoint & Google Slides
Circular
3D Growth Blocks Template for PowerPoint & Google Slides
Process
Growth vs Fixed Mindset Diagram Template for PowerPoint & Google Slides
Comparison
Abraham Maslow Growth Quote Slide Template for PowerPoint & Google Slides
Vision and Mission
Dynamic Investment & Finance Growth Template for PowerPoint & Google Slides
Finance
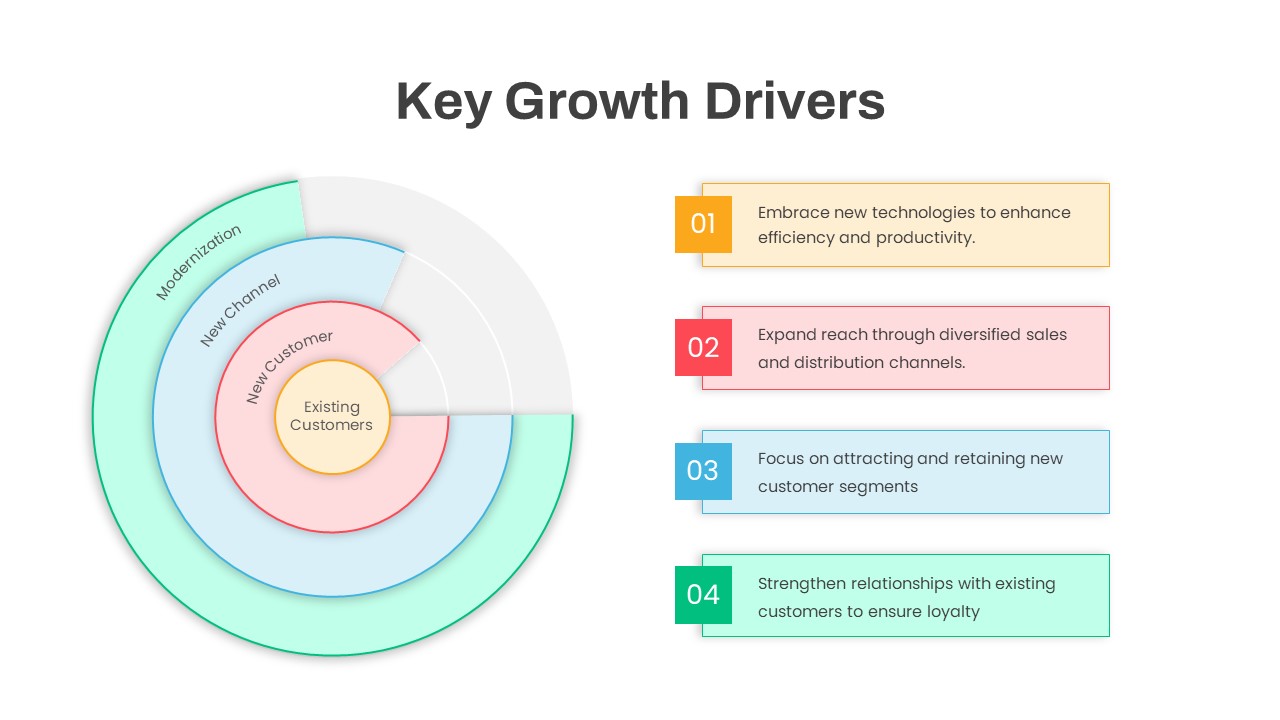
Circular Key Growth Drivers Diagram Template for PowerPoint & Google Slides
Circular

Quarterly Net Interest Income Growth Template for PowerPoint & Google Slides
Bar/Column
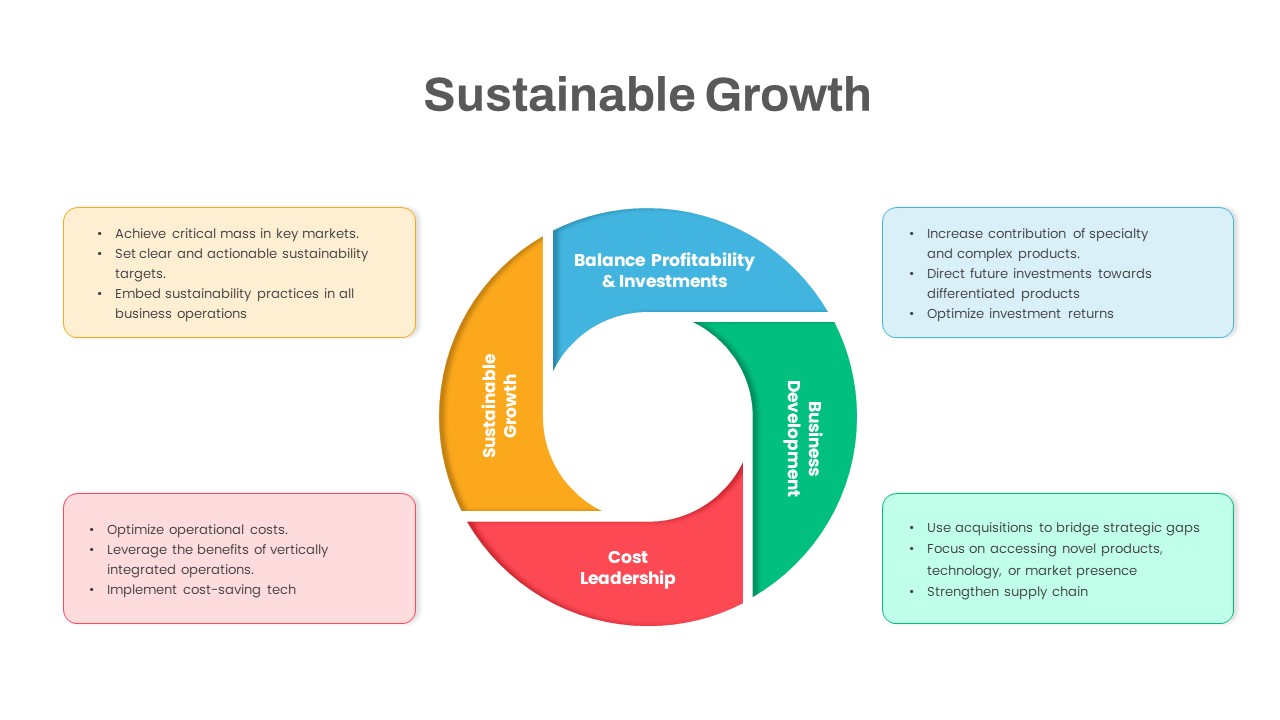
Sustainable Growth Circular Diagram Template for PowerPoint & Google Slides
Circular
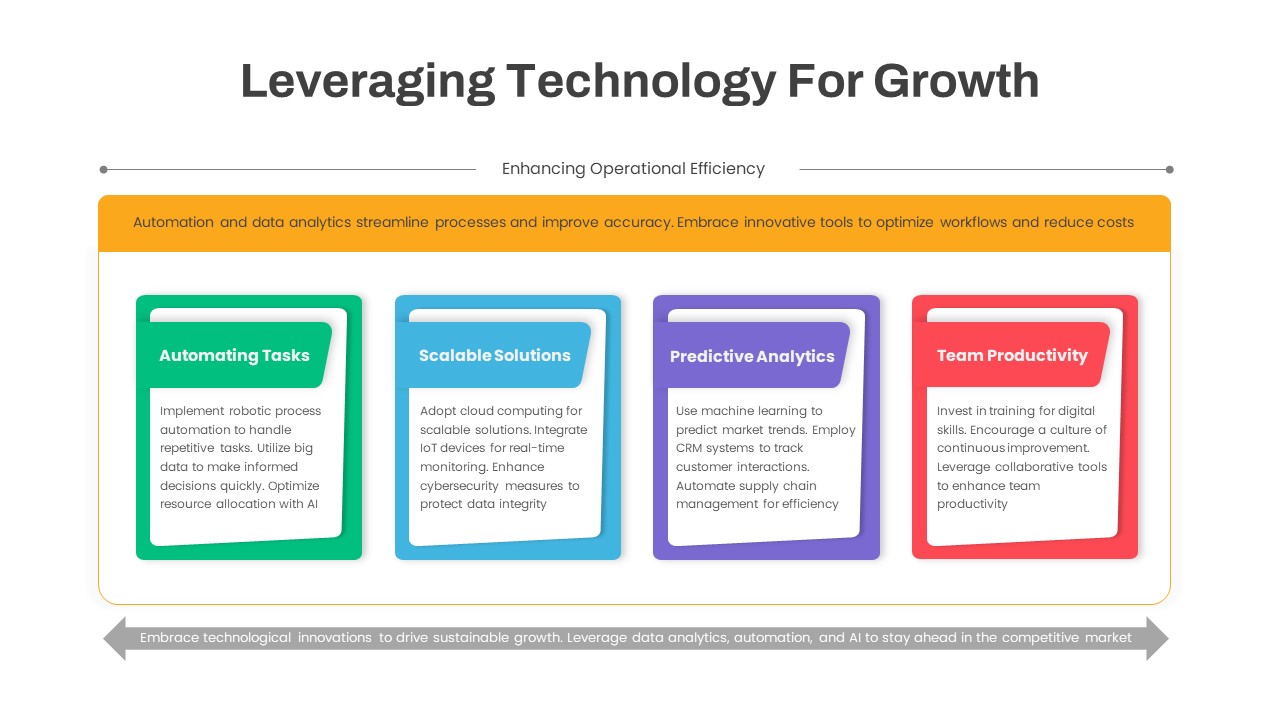
Leveraging Technology for Growth Slide Template for PowerPoint & Google Slides
Information Technology
Ansoff Growth Matrix Professional Template for PowerPoint & Google Slides
Comparison
Modern Growth Hacking Venn Diagram Template for PowerPoint & Google Slides
Circular
Ansoff Growth Matrix Template for PowerPoint & Google Slides
Business Strategy