Sales Growth Dashboard: KPI Gauge & Line Template for PowerPoint & Google Slides

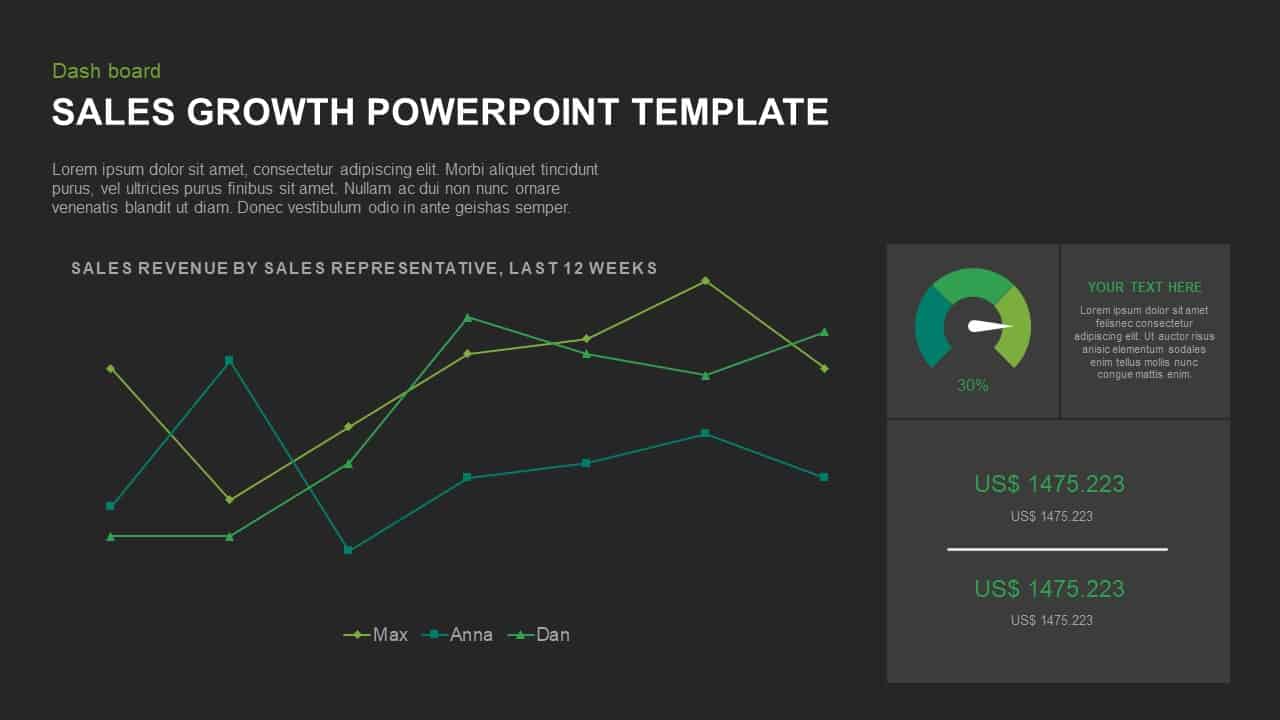
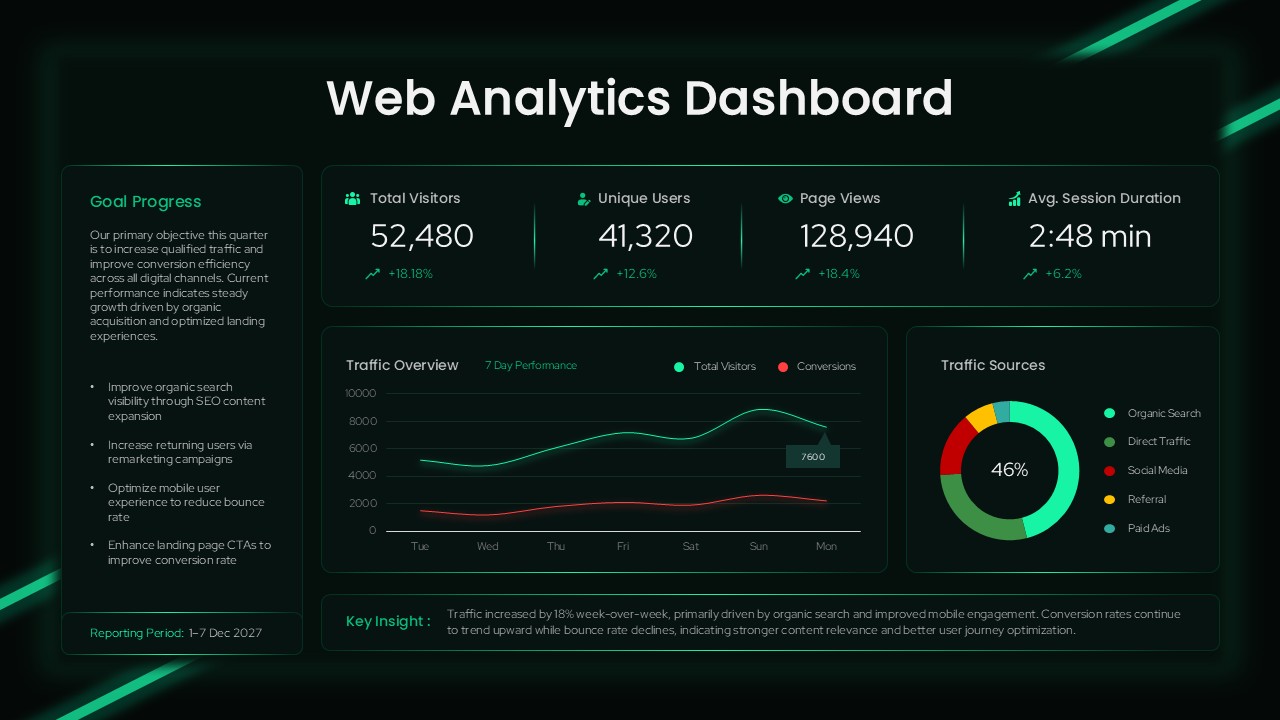
Showcase your sales performance with this dynamic Sales Growth dashboard slide featuring a multi-series line chart and KPI gauge components. The left side presents a clean 12-week line graph comparing revenue trends across three sales representatives—Max, Anna, and Dan—using distinct green hues and simple markers to highlight performance over time. On the right, a semi-circular gauge visualizes overall progress as a percentage, accompanied by two prominent revenue callouts in customizable text boxes. Subtle gray panel backgrounds, minimalist axis labels, and crisp typography create a balanced layout that emphasizes data clarity and brand alignment.
Fully editable and optimized for both PowerPoint and Google Slides, this template leverages master slides, vector shapes, and intuitive placeholders to streamline customization. Users can instantly update data series, adjust color themes, and modify gauge thresholds or text labels without disrupting the layout. Whether you are preparing an executive briefing, sales kickoff presentation, or monthly performance review, this dashboard offers a professional, modern aesthetic that enhances stakeholder engagement and simplifies complex data communication.
Beyond standard sales meetings, this versatile asset can be repurposed for financial reports, marketing analytics, product performance tracking, or KPI monitoring across departments. Adjust the chart series to reflect customer acquisition, website traffic, or project milestones, and use the gauge element to spotlight completion rates, budget utilization, or quality metrics. Duplicate panels to compare multiple time periods or regional performance, and apply branded color palettes to maintain visual consistency across corporate presentations. With drag-and-drop simplicity and prebuilt formatting controls, this slide empowers presenters to deliver compelling, data-driven stories that drive actionable insights and strategic alignment.
Who is it for
Business leaders, sales managers, marketing analysts, and consultants who need to present revenue trends and KPIs. Ideal for sales teams, executive stakeholders, and project managers seeking a clear, data-driven overview of representative performance.
Other Uses
Repurpose for financial reporting, marketing campaign reviews, product launch metrics, or internal KPI tracking. Use the gauge to display completion rates, customer satisfaction scores, or budget utilization, and the line chart for any time-series data comparison.
Login to download this file

Item ID
SB01408
Related Templates

4DX Scoreboard KPI Gauge Dashboard Template for PowerPoint & Google Slides
Business Strategy
Interactive Benchmarking Gauge Dashboard Template for PowerPoint & Google Slides
Pie/Donut
Risk Level Gauge Comparison Dashboard Template for PowerPoint & Google Slides
Comparison
Project Status Template Dashboard with Gauge for PowerPoint & Google Slides
Project Status

Application Revenue Line Chart KPI Template for PowerPoint & Google Slides
Revenue
Free KPI Dashboard Template for PowerPoint & Google Slides
Charts
Free

Efficiency KPI Dashboard Metaphor Template for PowerPoint & Google Slides
Infographics
Performance KPI Dashboard Slide Template for PowerPoint & Google Slides
Business Report
KPI Dashboard template for PowerPoint & Google Slides
Business Report
KPI Dashboard Overview template for PowerPoint & Google Slides
Finance
KPI Dashboard Data Visualization Template for PowerPoint & Google Slides
Bar/Column
KPI Dashboard Data Overview Slide Template for PowerPoint & Google Slides
Bar/Column
Customer Satisfaction KPI Dashboard Template for PowerPoint & Google Slides
Customer Experience
Michigan County Map with KPI Dashboard Template for PowerPoint & Google Slides
World Maps
DevOps KPI Dashboard Performance Metrics Template for PowerPoint & Google Slides
Software Development
Purchasing KPI Metrics Dashboard Template for PowerPoint & Google Slides
Business Report
Procurement KPI Dashboard & Metrics Template for PowerPoint & Google Slides
Business Report
Patient-Satisfaction KPI Dashboard for PowerPoint & Google Slides
Business
Growth Curve Line Chart Visualization Template for PowerPoint & Google Slides
Charts
Speedometer Infographic Gauge Comparison Template for PowerPoint & Google Slides
Comparison
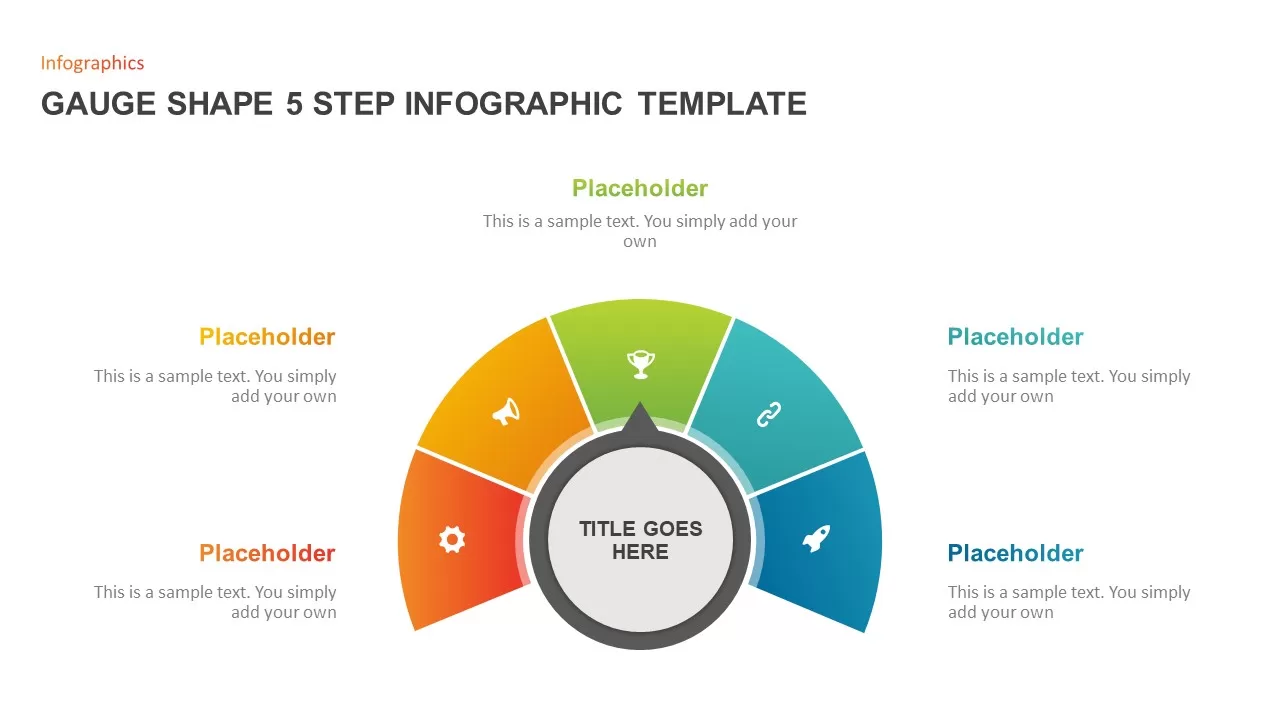
Gauge Shape 5-Step Infographic Diagram Template for PowerPoint & Google Slides
Process
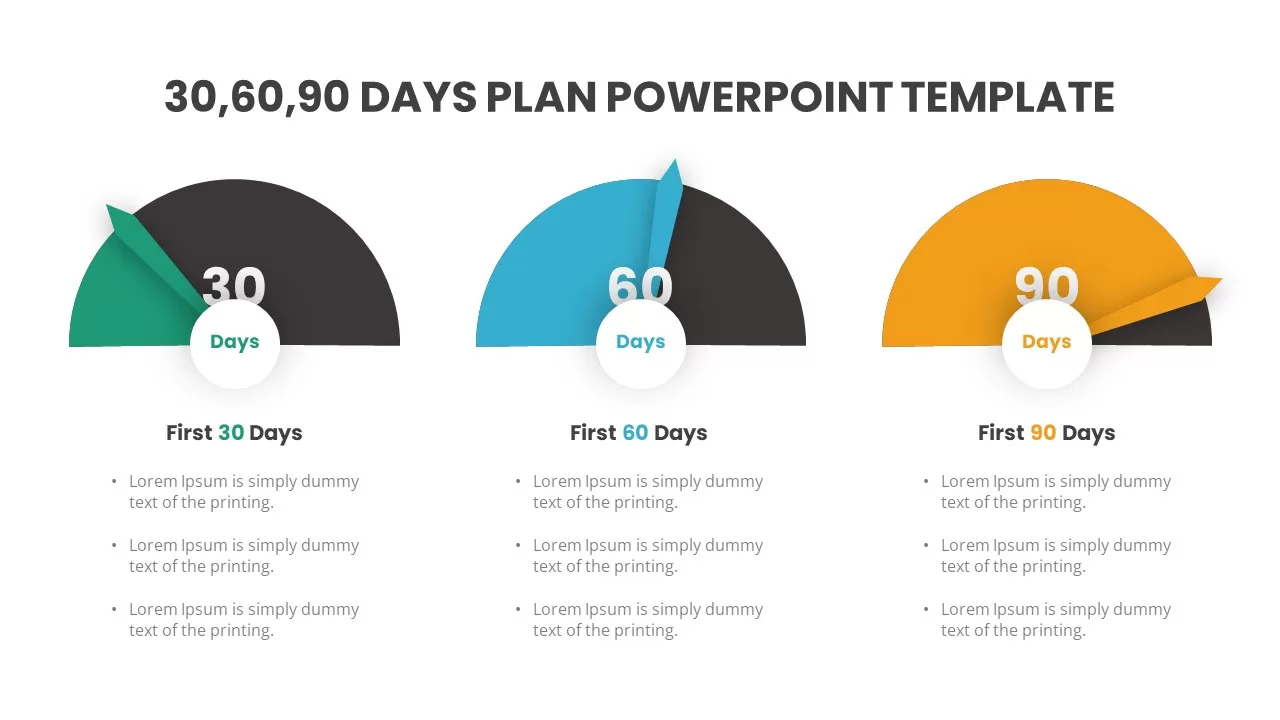
Gauge-Style 30-60-90 Day Plan Infographic Template for PowerPoint & Google Slides
Timeline
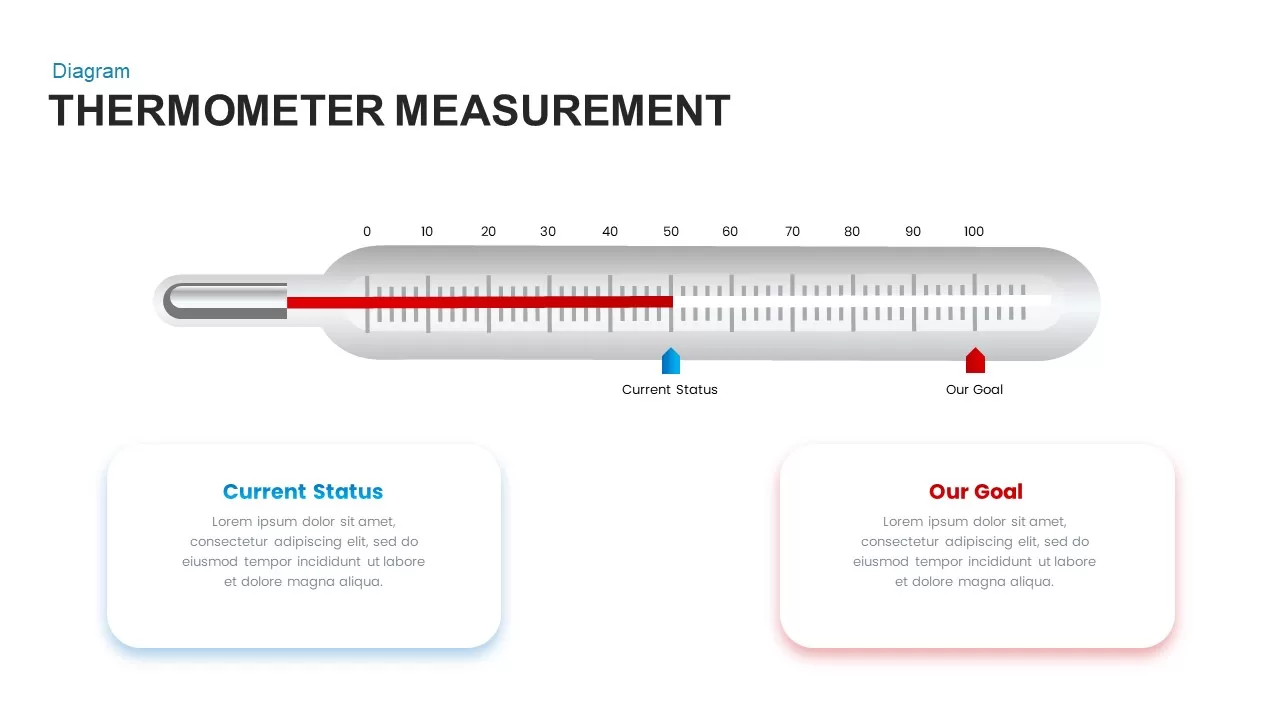
Thermometer Gauge Progress Measurement Template for PowerPoint & Google Slides
Comparison
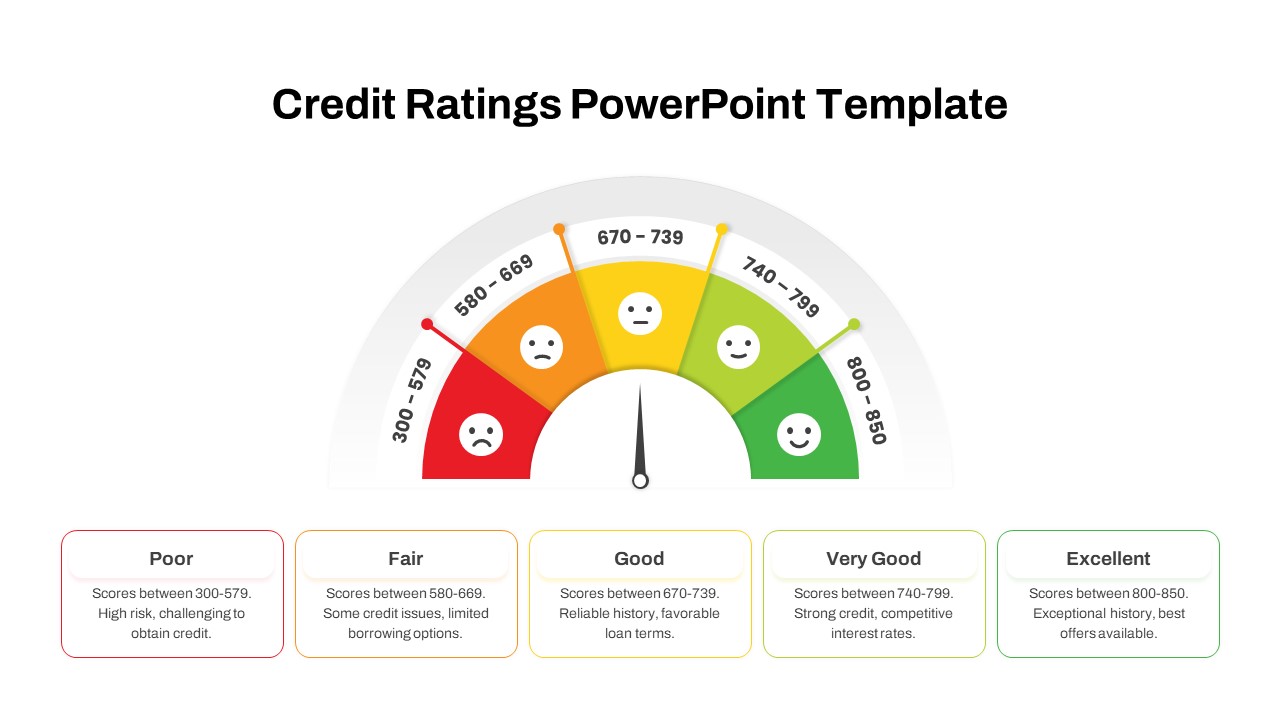
Credit Ratings Gauge Infographic Template for PowerPoint & Google Slides
Circular
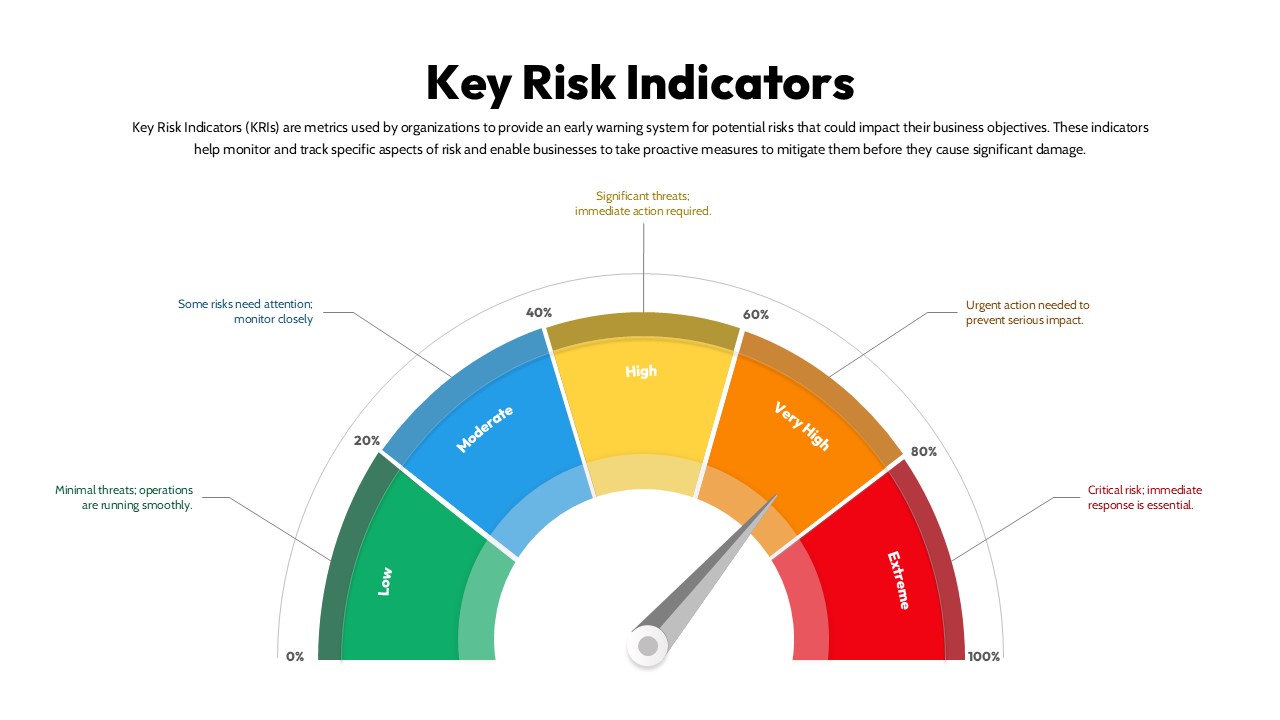
Key Risk Indicators (KRI) Gauge Template for PowerPoint & Google Slides
Risk Management

Sales Performance Dashboard template for PowerPoint & Google Slides
Business Report
Monthly Sales Performance Dashboard Template for PowerPoint & Google Slides
Charts

Growth Arrow for Progress & Growth template for PowerPoint & Google Slides
Arrow
Sales Growth Comparison Chart & Table Template for PowerPoint & Google Slides
Bar/Column
Line Graph Analysis template for PowerPoint & Google Slides
Charts
Multi-Series Curved Line Graph Analytics Template for PowerPoint & Google Slides
Comparison Chart
Line Chart Analysis template for PowerPoint & Google Slides
Charts
Combination Bar and Line Chart Template for PowerPoint & Google Slides
Bar/Column
Editable Multi-Series Peak Line Chart Template for PowerPoint & Google Slides
Comparison Chart
Arrow Line Chart Template for PowerPoint & Google Slides
Comparison Chart
Data Over Timeline Chart Template for PowerPoint
Charts
Evolution Line Chart with Milestones Template for PowerPoint & Google Slides
Timeline
Multiple Line Chart PowerPoint Template
Comparison Chart
Multi-Series Line Chart with Icons Template for PowerPoint & Google Slides
Comparison Chart
Interactive Jump Line Data Chart Template for PowerPoint & Google Slides
Comparison Chart
Skimming Pricing Strategy Line Chart Template for PowerPoint & Google Slides
Business Strategy
Dynamic Financial Analysis Line Chart Template for PowerPoint & Google Slides
Finance

Creative Clothing Line Presentation Template for PowerPoint & Google Slides
Pitch Deck
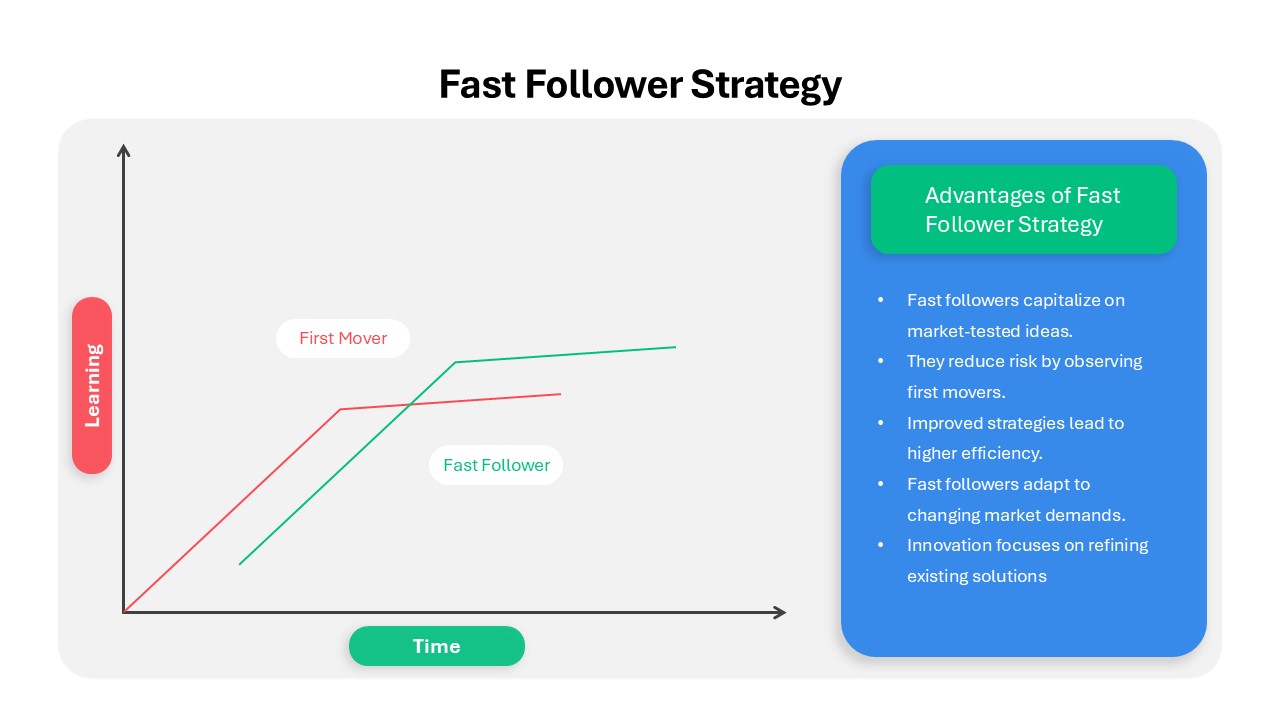
Fast Follower Strategy Line Graph Template for PowerPoint & Google Slides
Comparison Chart
3Ps Triple Bottom Line Venn Diagram Template for PowerPoint & Google Slides
Circular
4 People Racing to Finish Line Template for PowerPoint & Google Slides
Accomplishment
Curved Line Graph for PowerPoint & Google Slides
Timeline
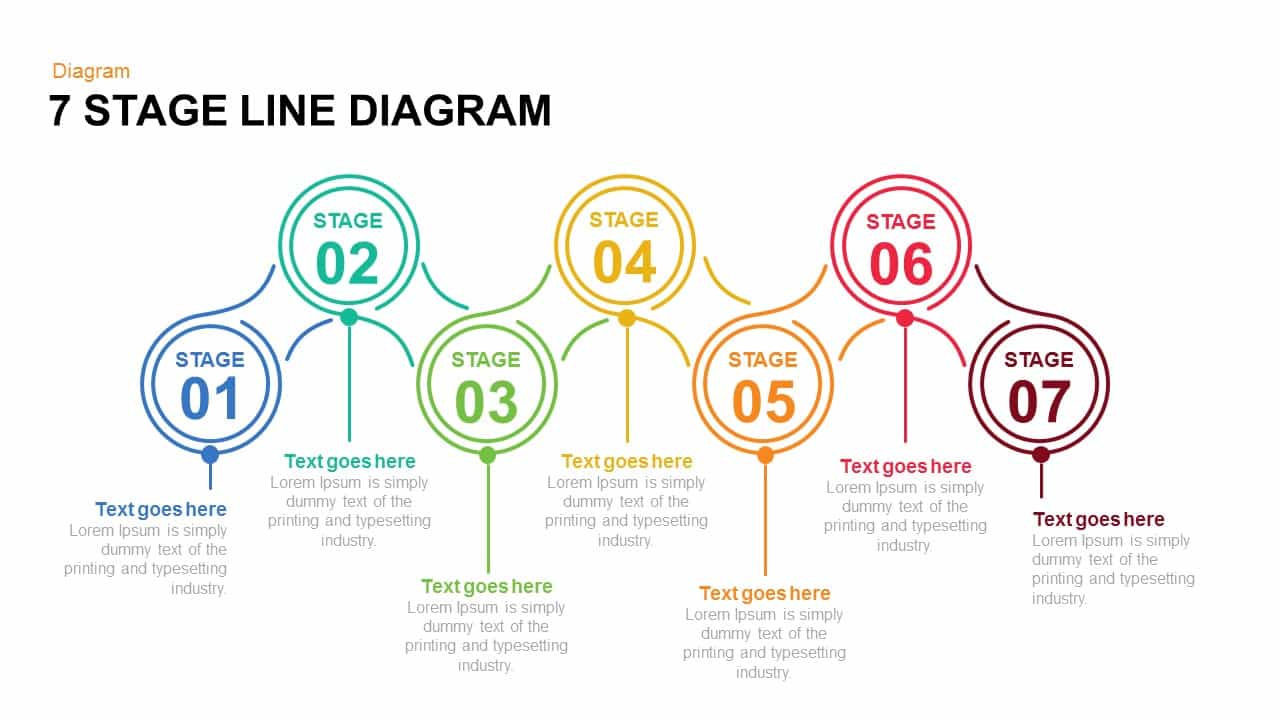
7 and 6 Stage Line Diagram Overview for PowerPoint & Google Slides
Infographics
Five and Six Step Line Linear Stage Diagram for PowerPoint & Google Slides
Infographics
3D Line Chart for PowerPoint & Google Slides
Charts
Asia Map with KPI Metrics and Legend Template for PowerPoint & Google Slides
World Maps
Professional Team Collage & KPI Slide Template for PowerPoint & Google Slides
Business
Circular Image Gallery & KPI Metrics Template for PowerPoint & Google Slides
Pie/Donut
Statistics Infographic & KPI Bar Chart Template for PowerPoint & Google Slides
Bar/Column
Monthly Recurring Revenue KPI Bar Chart Template for PowerPoint & Google Slides
Bar/Column
Free Balanced Scorecard Template PowerPoint and Google Slides
Employee Performance
Free
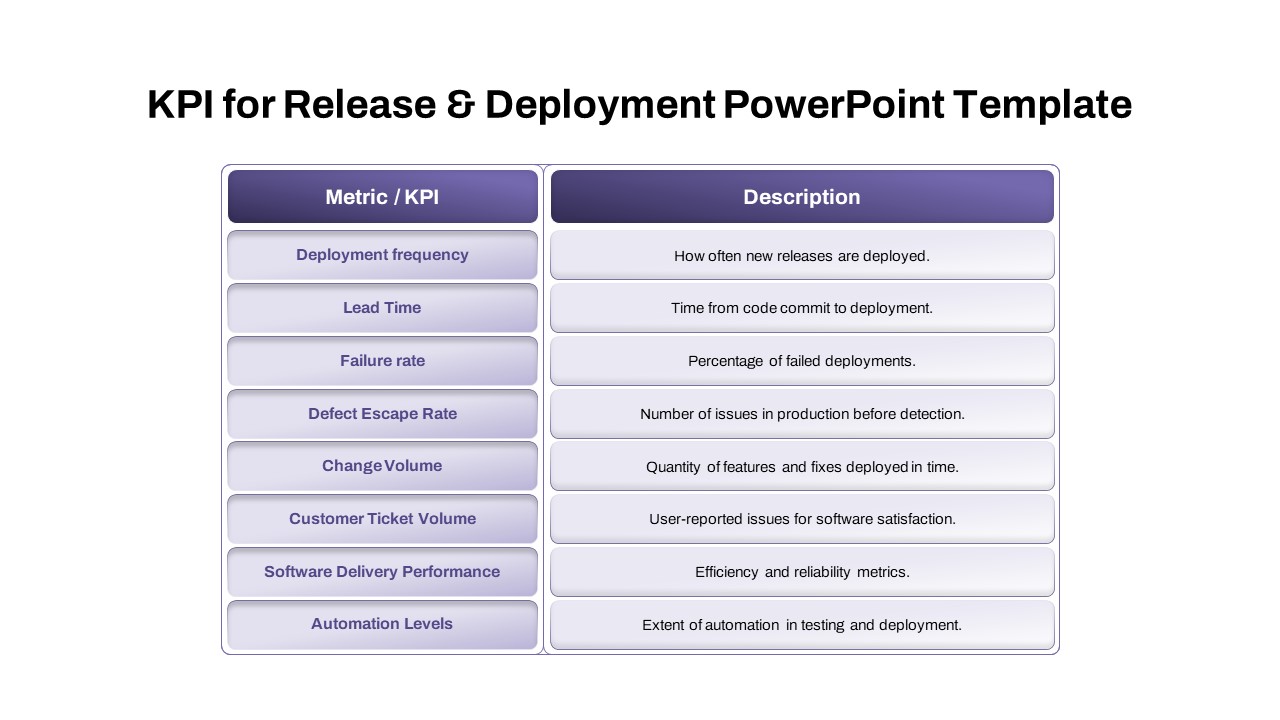
Comprehensive Release & Deployment KPI Template for PowerPoint & Google Slides
Software Development
Three Segment Donut Chart KPI Infographic Template for PowerPoint & Google Slides
Pie/Donut
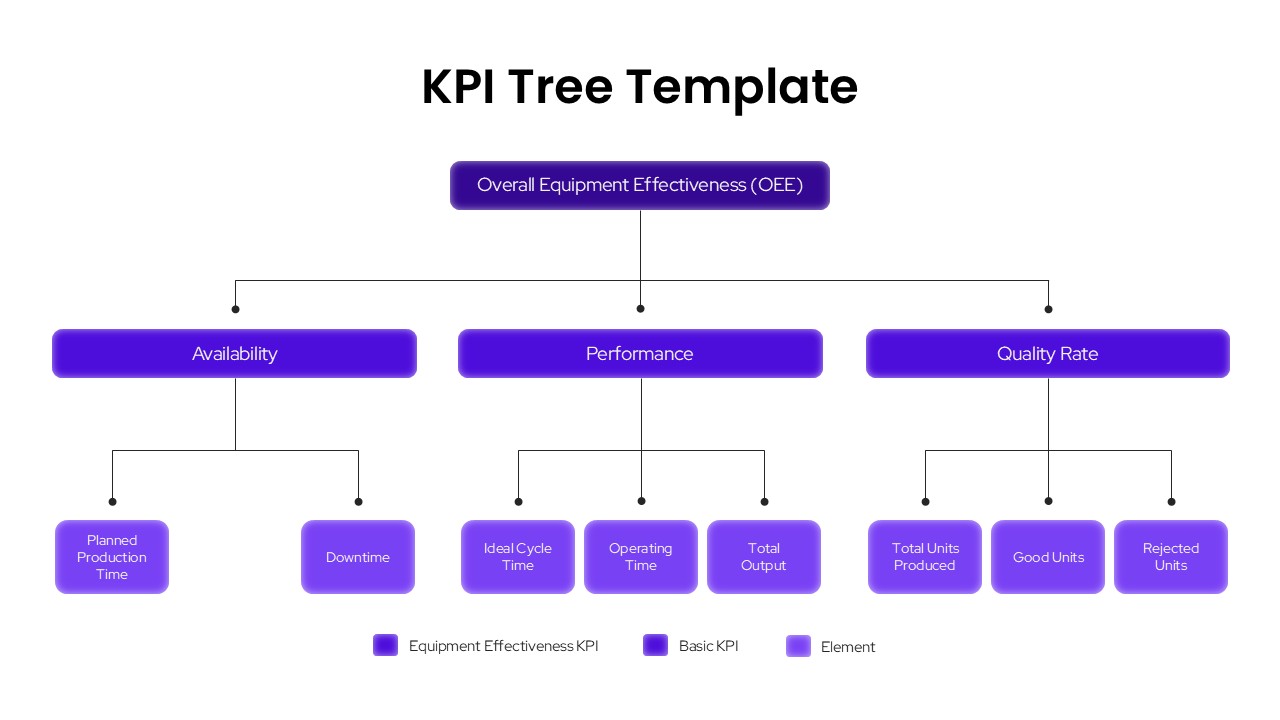
KPI Tree OEE Breakdown Template for PowerPoint & Google Slides Presentations
Infographics
Year in Review KPI Highlights Slide for PowerPoint & Google Slides
Business Report
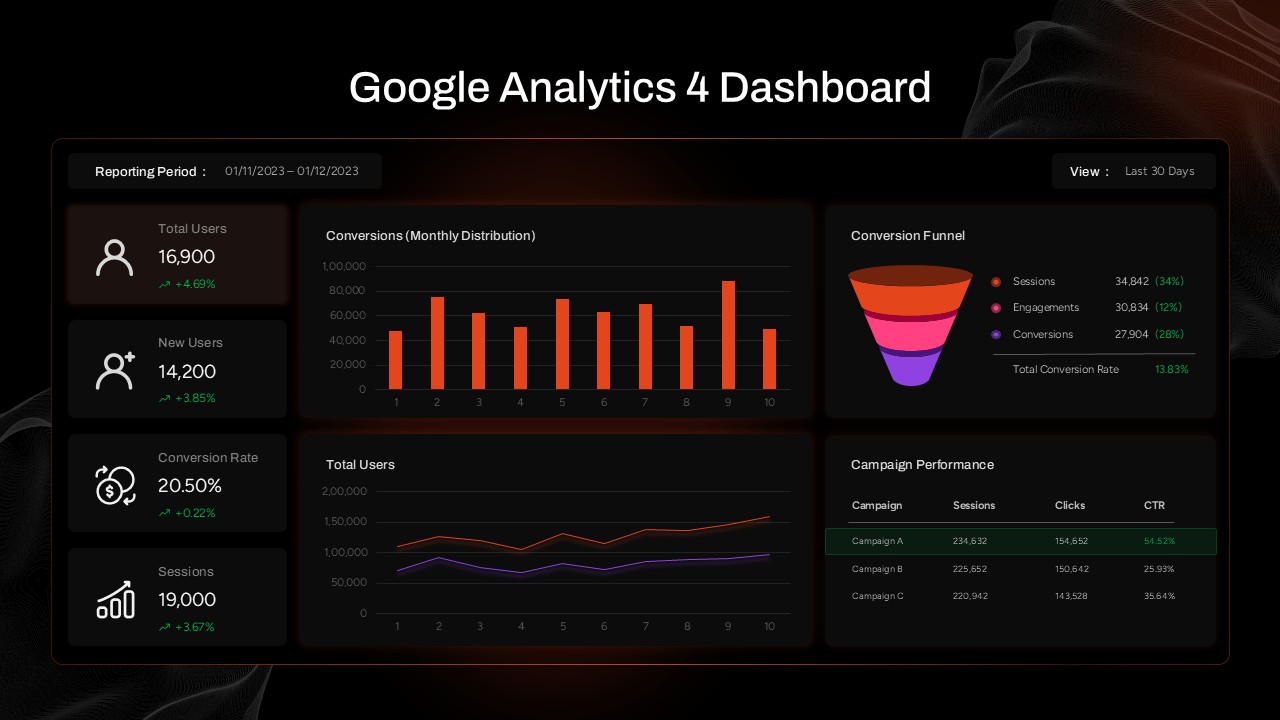
Google Analytics 4 (GA4) Dashboard Template for PowerPoint & Google Slides
Digital Marketing
Data-Driven Line Chart Diagram Template for PowerPoint
Comparison Chart
E-commerce Analytics Dashboard Template for PowerPoint & Google Slides
Bar/Column
Data Analytics Dashboard Design template for PowerPoint & Google Slides
Bar/Column
Business Dashboard Analytics & KPIs Template for PowerPoint & Google Slides
Bar/Column
Team Efficiency Metaphor Template for PowerPoint and Keynote
Business Report
Website Performance Dashboard template for PowerPoint & Google Slides
Charts
Social Media Performance Dashboard Template for PowerPoint & Google Slides
Bar/Column
Net Promoter Score PowerPoint Template
Customer Experience
Project Status Report PowerPoint Template
Project Status
Bull and Bear Stock Market Dashboard Template for PowerPoint & Google Slides
Infographics
Heat Map Infographic Template For Risk Assessment and Priority Analysis
Comparison Chart
Project Status Dashboard Template for PowerPoint & Google Slides
Project Status
Weekly Status Report Dashboard Template for PowerPoint & Google Slides
HR
Free Metro UI Dashboard Infographic Template for PowerPoint & Google Slides
Business Report
Free
Website Performance Monitoring Dashboard Template for PowerPoint & Google Slides
Business Report
One Pager Annual Report Template
Business Report
Social Media Statistics 2023 Dashboard Template for PowerPoint & Google Slides
Comparison
Mastodon Metrics Infographic Dashboard Template for PowerPoint & Google Slides
Business Report
Freight Logistics Dashboard Infographic Template for PowerPoint & Google Slides
Comparison Chart
Quarterly Financial Summary Dashboard Template for PowerPoint & Google Slides
Business Report
Quarterly Business Review Dashboard Template for PowerPoint & Google Slides
Pitch Deck
Project Progress Dashboard Pie Charts Template for PowerPoint & Google Slides
Project
Budget Forecast Dashboard & Donut Charts Template for PowerPoint & Google Slides
Pie/Donut
Inventory Management Dashboard Template for PowerPoint & Google Slides
Process
Digital Marketing KPIs Dashboard Dark Template for PowerPoint & Google Slides
Business Report
Employee Performance Metrics Dashboard Template for PowerPoint & Google Slides
Employee Performance
Project Tracking Dashboard Table Template for PowerPoint & Google Slides
Project Status
Action Items Management Dashboard Table Template for PowerPoint & Google Slides
Project Status
Customer Interview Insights Dashboard Template for PowerPoint & Google Slides
Customer Experience
Project Status Dashboard Report Template for PowerPoint & Google Slides
Project Status
Project Status Update Dashboard Table Template for PowerPoint & Google Slides
Project Status
Cohort Analysis Retention Dashboard Template for PowerPoint & Google Slides
Comparison Chart
Task Completion Rate Dashboard Template for PowerPoint & Google Slides
Business
Project Status Dashboard with RAG Legend Template for PowerPoint & Google Slides
Project Status
End of Year Review Dashboard Template for PowerPoint & Google Slides
Business Report
Construction Project Dashboard Template for PowerPoint & Google Slides
Project
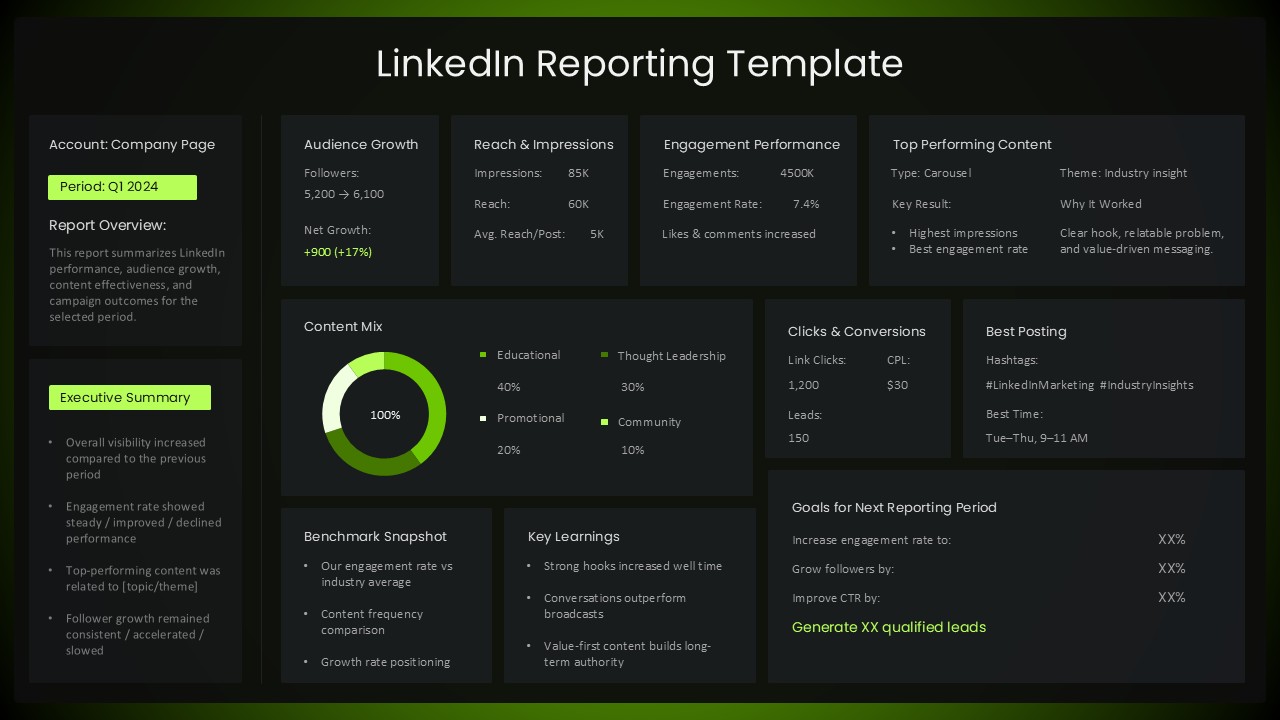
LinkedIn Performance Reporting Dashboard Template for PowerPoint & Google Slides
Digital Marketing
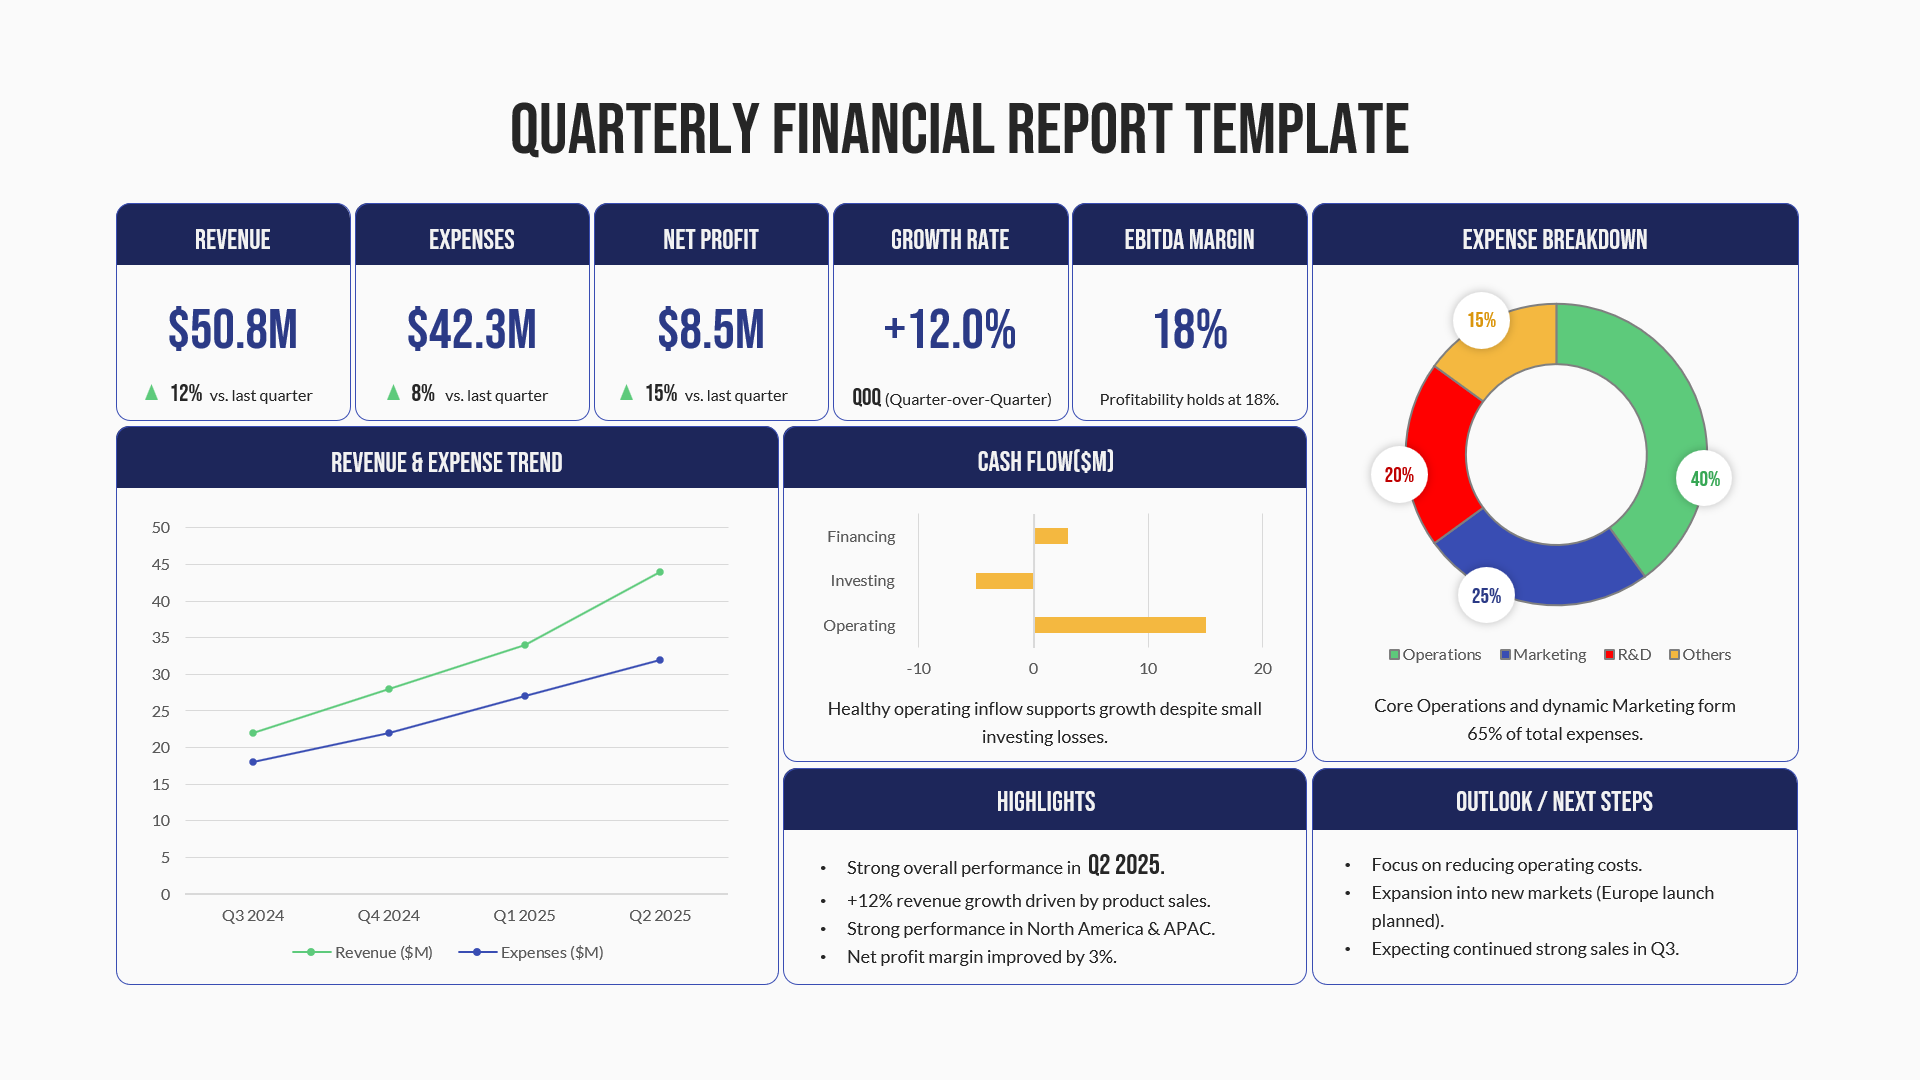
Quarterly Financial Report Dashboard Template for PowerPoint & Google Slides
Finance
Web Analytics Dashboard Template for PowerPoint & Google Slides Presentations
Business