Interactive Jump Line Data Chart Template for PowerPoint & Google Slides

Description
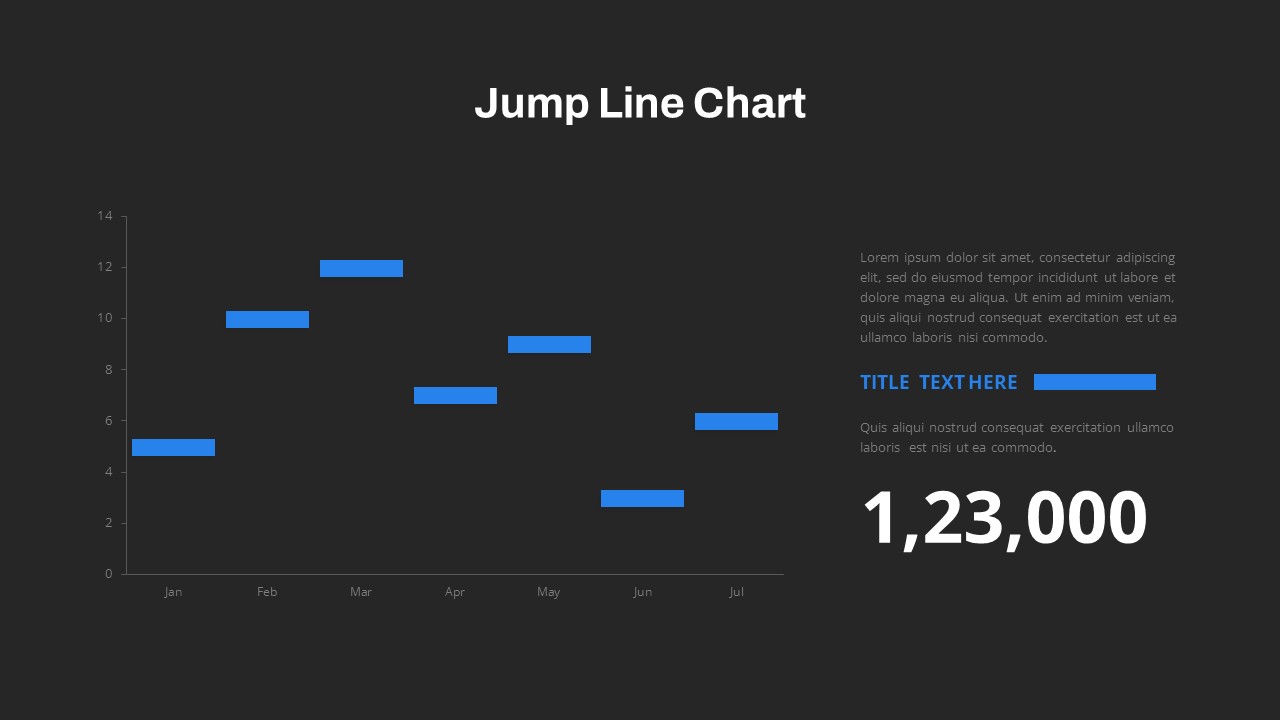
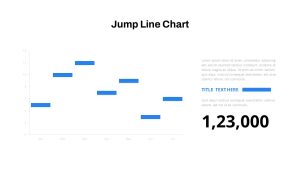
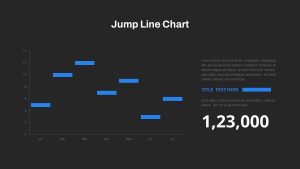
Leverage this dynamic jump line chart slide to present discrete monthly data points with clarity and precision. The design features a minimalist white background with floating blue horizontal bars aligned to a vertical axis labeling values from 0 to 14 and a horizontal axis denoting months from January to July. Each bar represents a data point for a specific month, creating a “jump line” effect that highlights fluctuations over time. On the right side, the layout includes a concise header placeholder, a subheading and descriptive text area in light gray, plus a prominent numeric indicator in bold black for key metrics. This structure balances visual data representation with contextual narrative, ensuring that audiences can both see trends at a glance and read accompanying analysis.
Optimized for both PowerPoint and Google Slides, this slide leverages editable master elements, fully customizable fonts, and straightforward color schemes. Simply replace the bar positions with your own values, adjust the header text and numeric figure, and modify subtext to match your message. The uncluttered layout and generous whitespace focus attention on your data narrative, while the consistent use of color branding enhances visual cohesion across your deck.
Whether you’re reporting sales trends, tracking operational metrics, or illustrating performance benchmarks, this jump line chart slide delivers a clear, modern aesthetic that scales seamlessly across devices and screen resolutions. Use it as a standalone overview slide or integrate it within a larger dashboard to drive data-driven discussions, compare monthly results, and highlight key performance indicators with maximum impact.
The template supports quick editing of data series, header text, and numeric highlights, integrating seamlessly into existing decks without compromising visual quality.
Who is it for
Data analysts, financial controllers, and marketing teams can leverage this slide to visualize monthly performance fluctuations. Project managers and operations leaders will appreciate the clear representation of key metrics, while executive teams and consultants can use the prominent numeric indicator to drive strategic discussions.
Other Uses
Beyond sales and revenue reporting, repurpose the layout for budget variance comparisons, resource allocation reviews, and quality assurance metrics. Adapt the floating bar format to display survey results, website traffic spikes, or production volume changes. The clean design also works for educational data plotting, research findings, and investor update snapshots.
Login to download this file

Item ID
SB03888
Related Templates

Data Over Time Line Chart template for PowerPoint & Google Slides
Charts

Data-Driven Line Chart Diagram Template for PowerPoint
Comparison Chart
Interactive US Population Data Map Slide Template for PowerPoint & Google Slides
World Maps
Interactive Product Comparison Bar Chart Template for PowerPoint & Google Slides
Bar/Column
Interactive Project Gantt Chart Timeline Template for PowerPoint & Google Slides
Gantt Chart
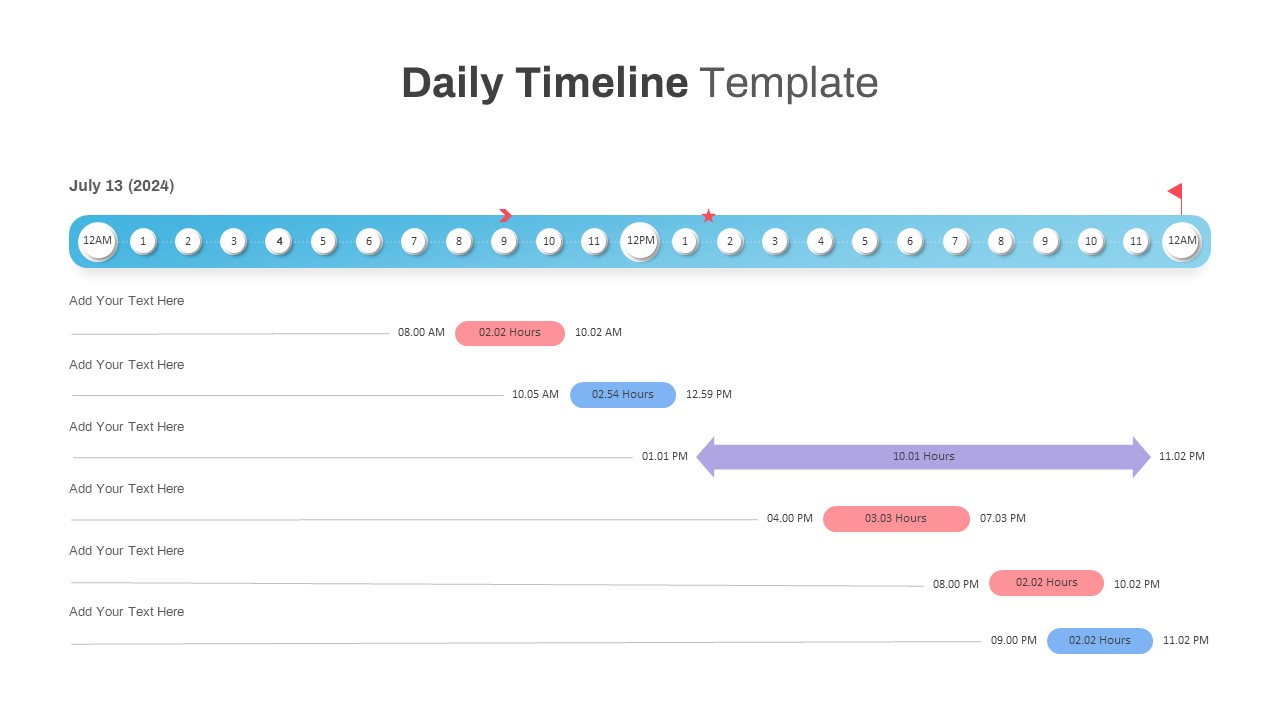
Interactive Daily Timeline Schedule Chart Template for PowerPoint & Google Slides
Timeline

Line Chart Analysis template for PowerPoint & Google Slides
Charts
Application Revenue Line Chart KPI Template for PowerPoint & Google Slides
Revenue
Combination Bar and Line Chart Template for PowerPoint & Google Slides
Bar/Column
Editable Multi-Series Peak Line Chart Template for PowerPoint & Google Slides
Comparison Chart
Arrow Line Chart Template for PowerPoint & Google Slides
Comparison Chart
Growth Curve Line Chart Visualization Template for PowerPoint & Google Slides
Charts
Evolution Line Chart with Milestones Template for PowerPoint & Google Slides
Timeline
Multiple Line Chart Comparison Template for PowerPoint & Google Slides
Comparison Chart
Multi-Series Line Chart with Icons Template for PowerPoint & Google Slides
Comparison Chart
Skimming Pricing Strategy Line Chart Template for PowerPoint & Google Slides
Business Strategy
Dynamic Financial Analysis Line Chart Template for PowerPoint & Google Slides
Finance
3D Line Chart for PowerPoint & Google Slides
Charts
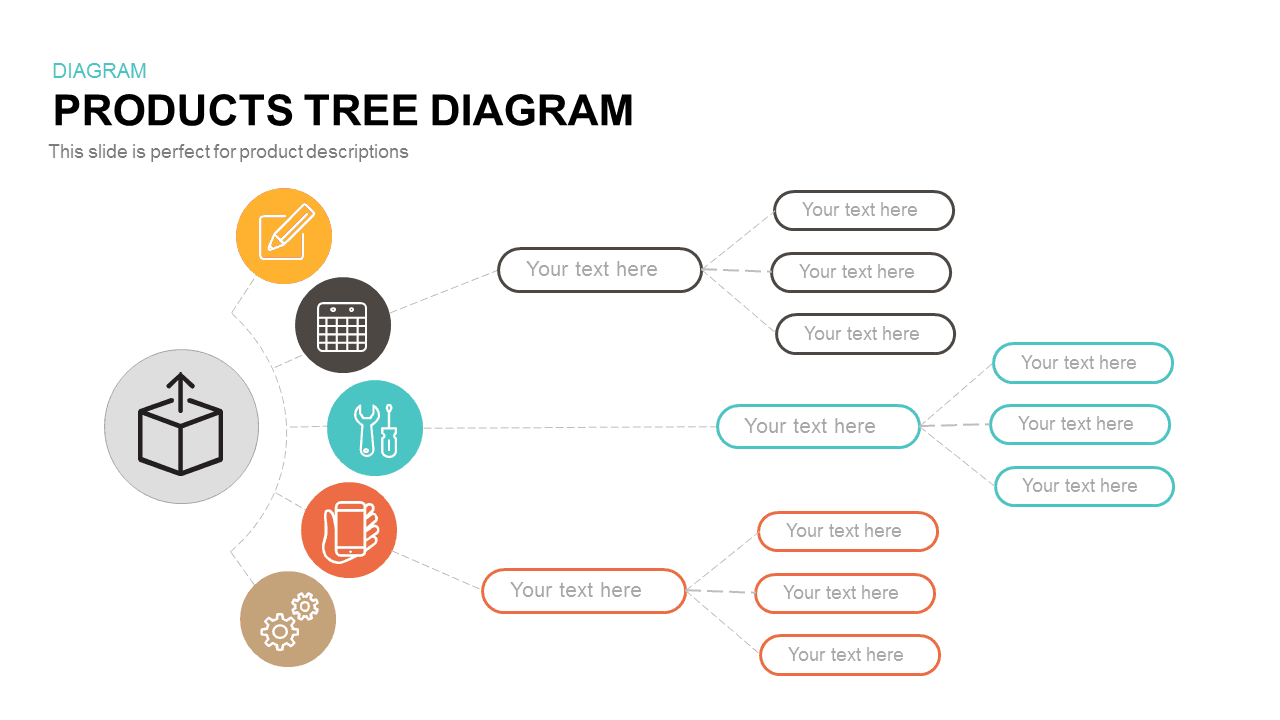
Interactive Products Tree Diagram template for PowerPoint & Google Slides
Org Chart
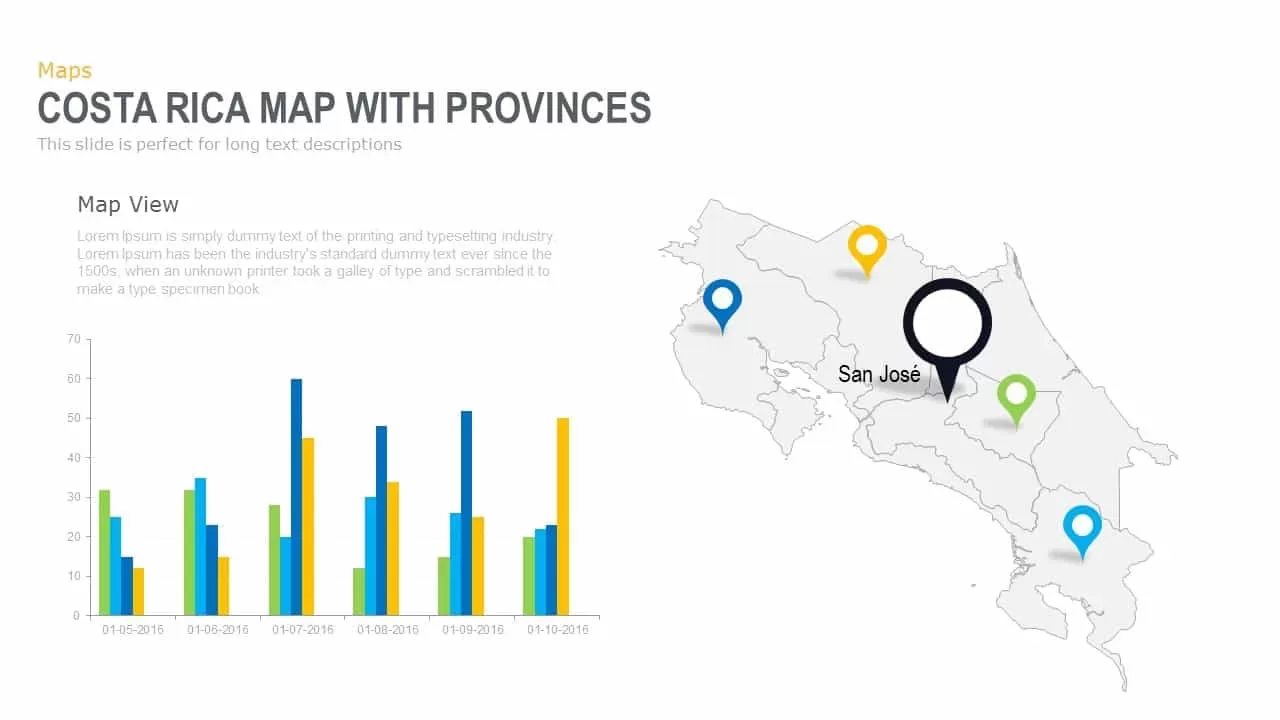
Interactive Costa Rica Province Map Template for PowerPoint & Google Slides
World Maps
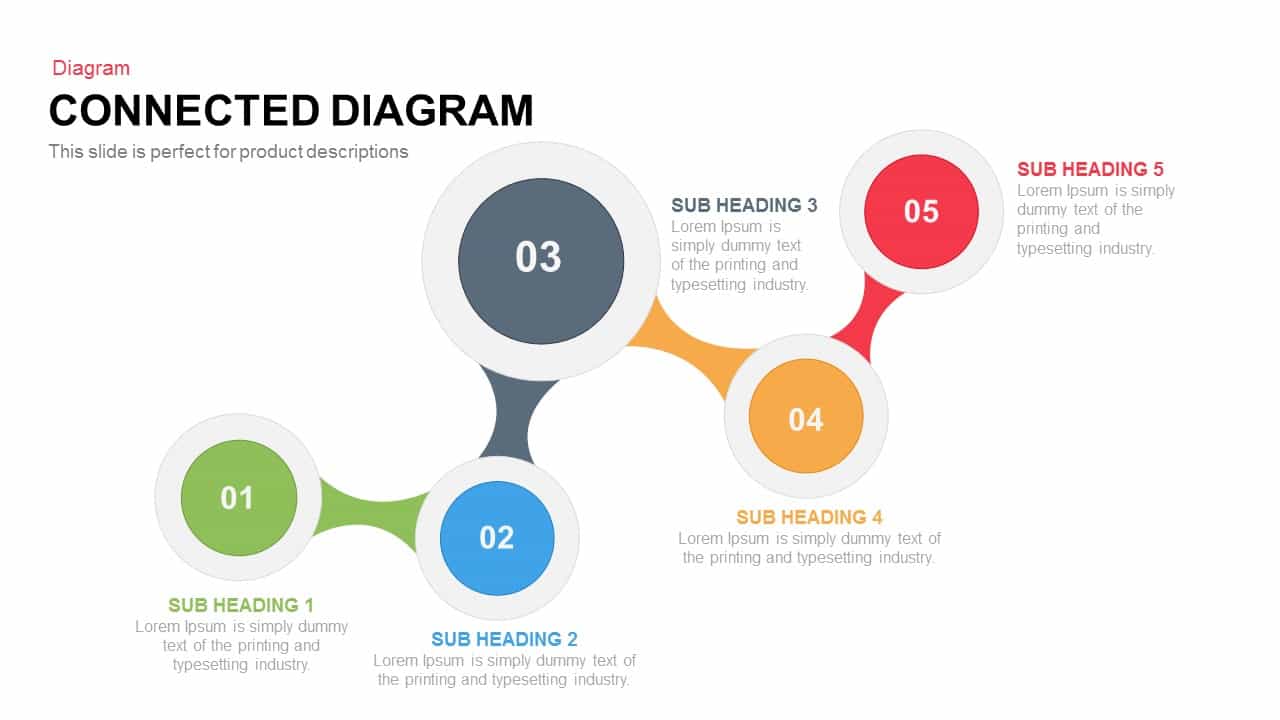
Interactive Connected Network Diagram Template for PowerPoint & Google Slides
Process
Interactive Pricing Plan Comparison Template for PowerPoint & Google Slides
Comparison

Interactive Gap Analysis Puzzle Diagram Template for PowerPoint & Google Slides
Gap

Interactive RACI Responsibility Matrix Template for PowerPoint & Google Slides
Project
Interactive 3D Puzzle SWOT Analysis Slide Template for PowerPoint & Google Slides
SWOT

Interactive Empathy Map Diagram Template for PowerPoint & Google Slides
Process
OKR PowerPoint Template
Process
Free Interactive Online Course Presentation Template for PowerPoint & Google Slides
Pitch Deck
Free
Interactive Bank ATM Use Case Diagram Template for PowerPoint & Google Slides
Software Development
Interactive Benchmarking Gauge Dashboard Template for PowerPoint & Google Slides
Pie/Donut
Heat Map Template for Presentations
Comparison Chart
Interactive Heat Map Template for PowerPoint & Google Slides
Bar/Column
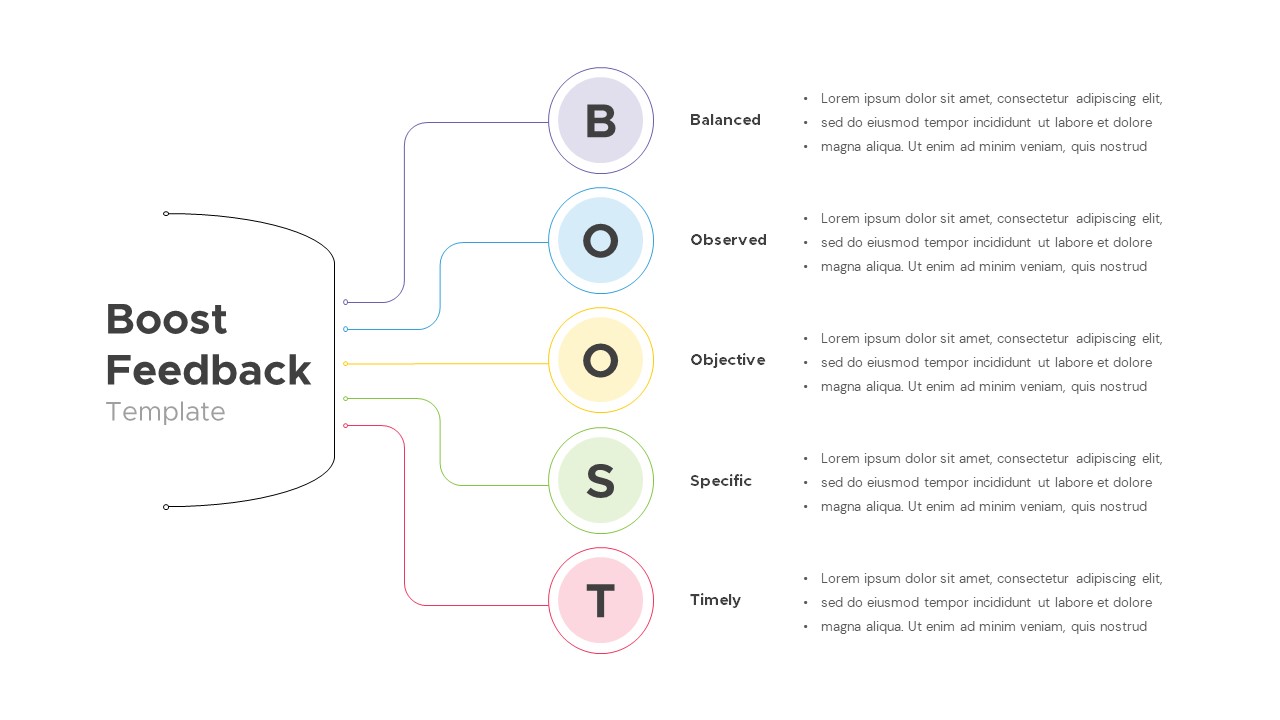
Interactive Boost Feedback Model Diagram Template for PowerPoint & Google Slides
Process

Free Animated Trivia PowerPoint Template
Graphics
Free
Two Truths And A Lie Free PowerPoint Template
Decks
Free
Free Spin the Wheel Interactive Game Template
Decks
Free
Interactive Slide Zoom & Transition Template for PowerPoint & Google Slides
Decks
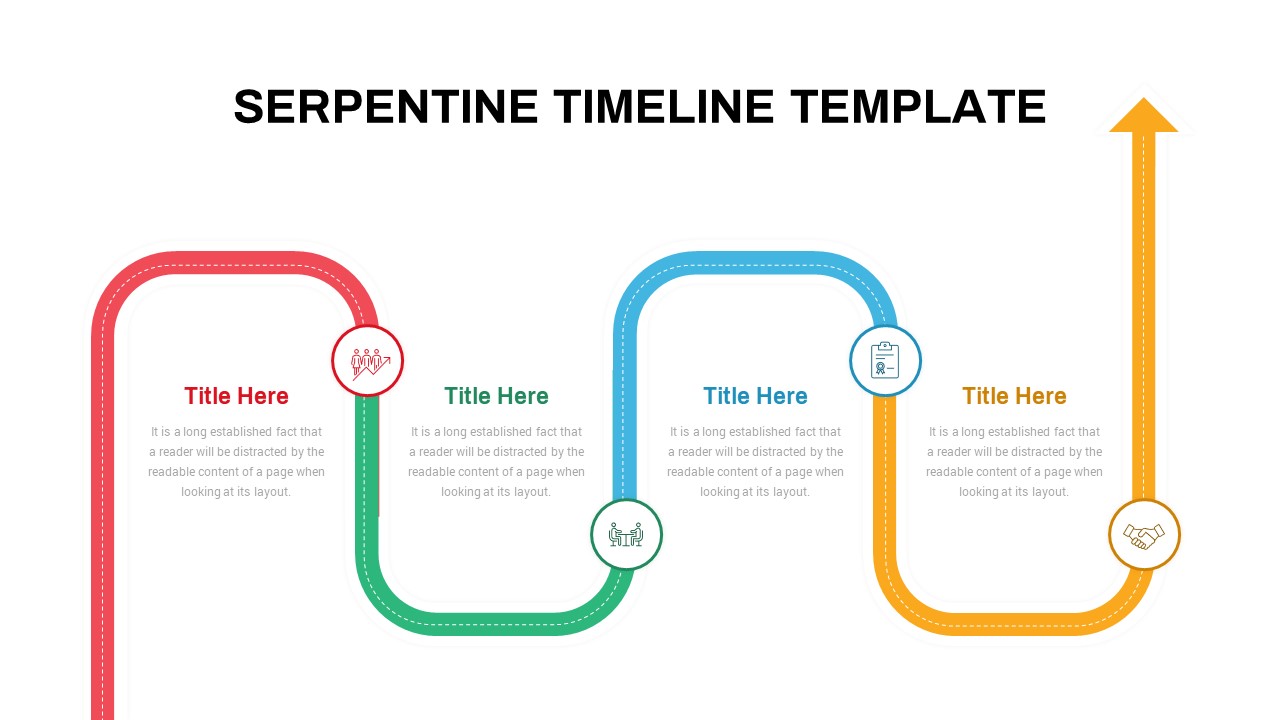
Interactive Serpentine Timeline Diagram Template for PowerPoint & Google Slides
Timeline
Interactive Milestone Timeline Template for PowerPoint & Google Slides
Timeline
Interactive Multi-Use Cost Comparison Template for PowerPoint & Google Slides
Comparison
Free Animated Quiz PowerPoint Template
Pitch Deck
Free
PowerPoint Quiz with Timer Presentation Template
Pitch Deck
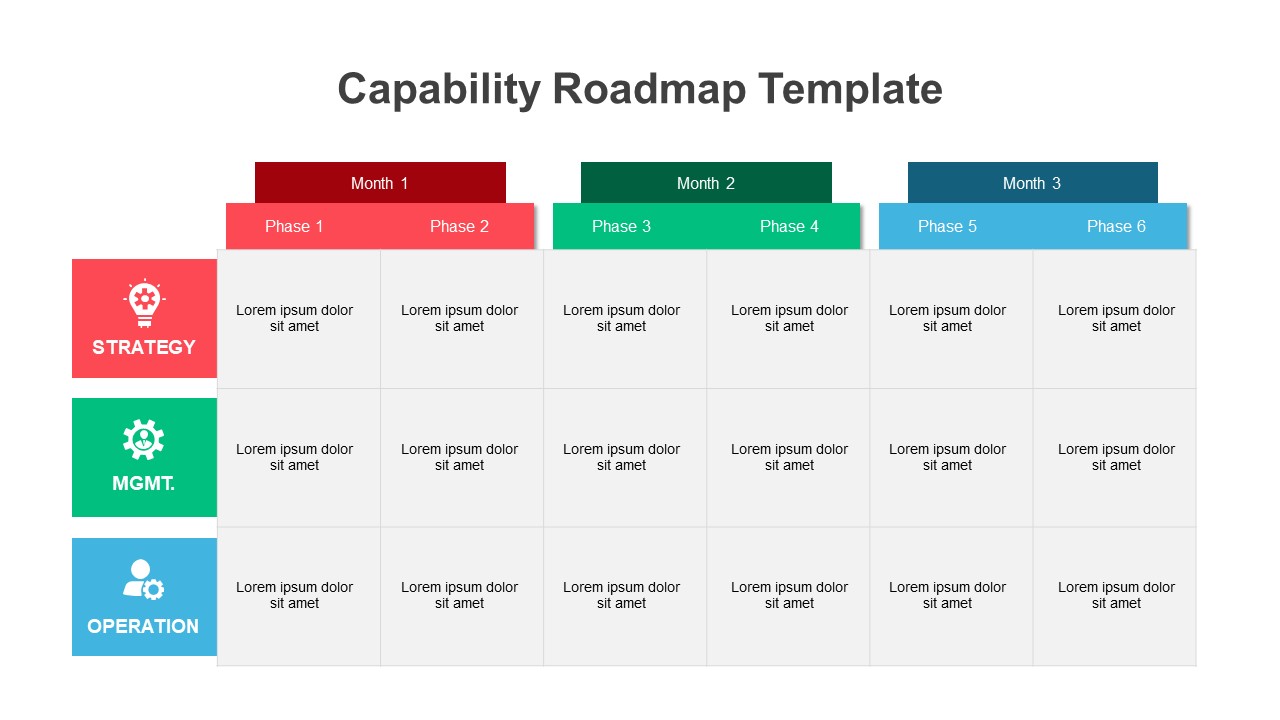
Capability Roadmap PowerPoint Template & Google Slide
Roadmap
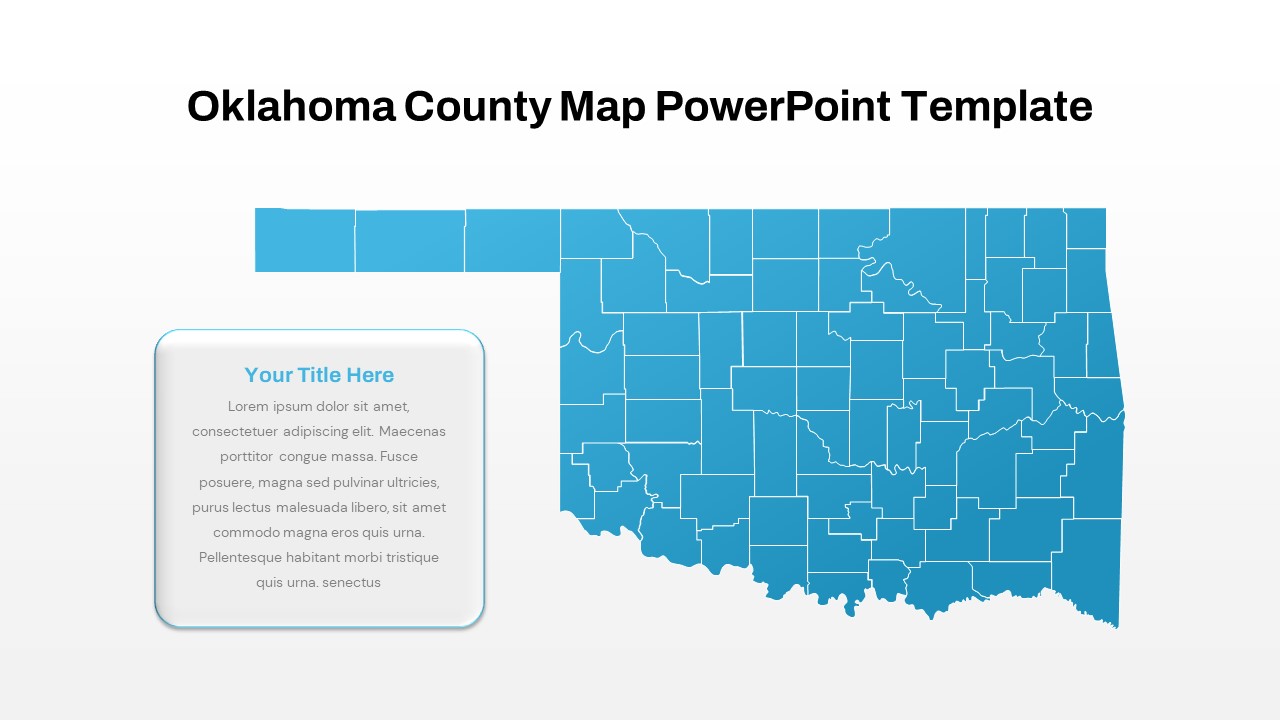
Interactive Oklahoma County Map Template for PowerPoint & Google Slides
World Maps
Interactive Quiz with Game Rules Template for PowerPoint & Google Slides
Graphics
Free
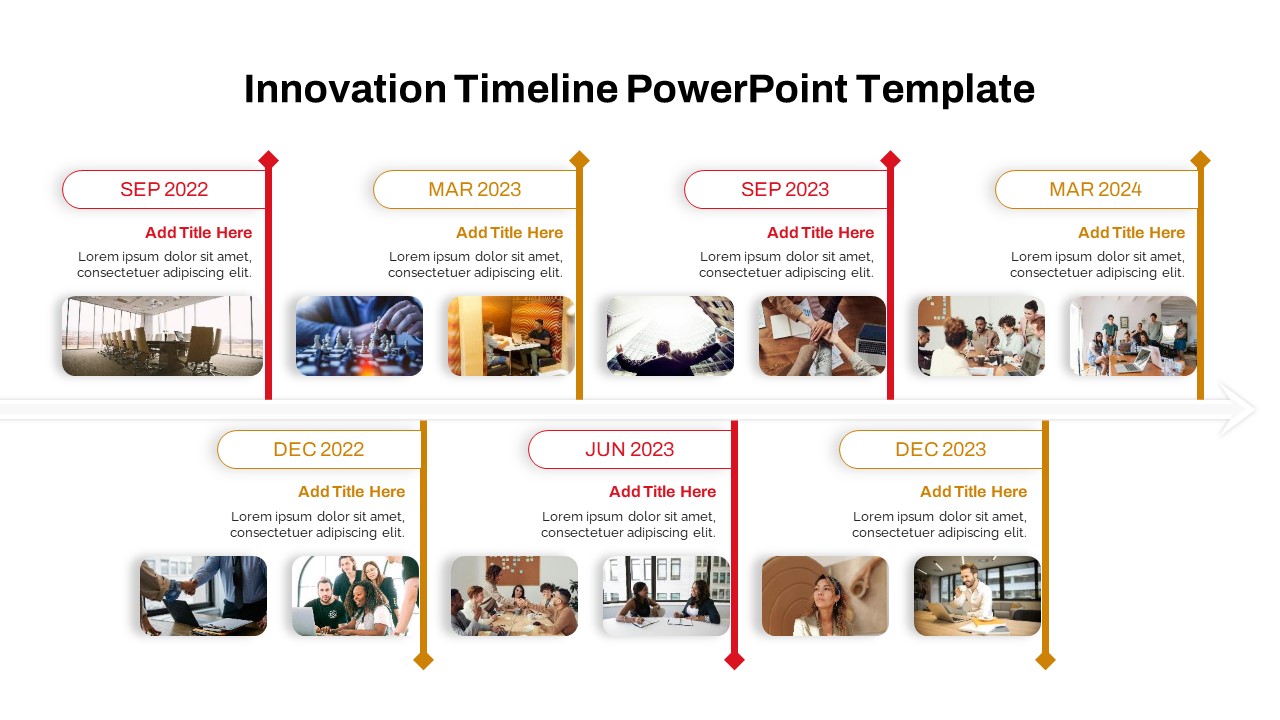
Interactive Innovation Timeline Roadmap Template for PowerPoint & Google Slides
Timeline
Free Interactive Flashcards Q&A Deck Template for PowerPoint & Google Slides
Free
Free
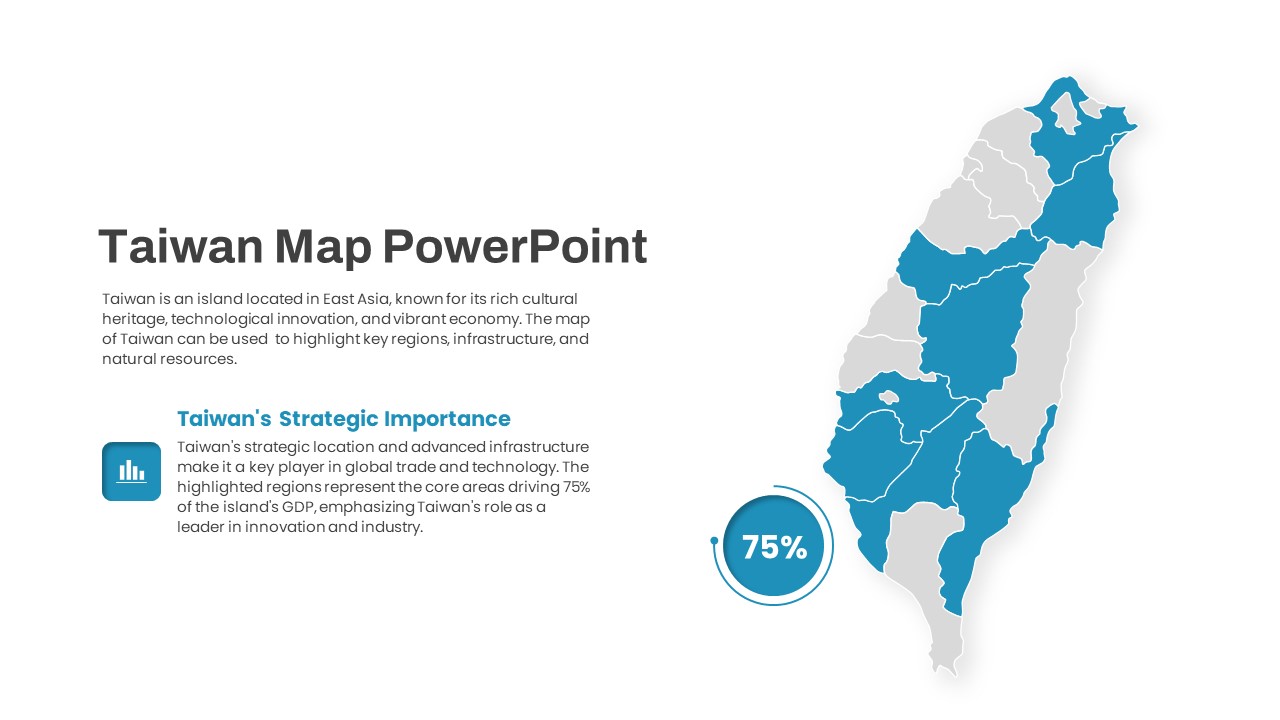
Interactive Taiwan Map Highlight Template for PowerPoint & Google Slides
World Maps

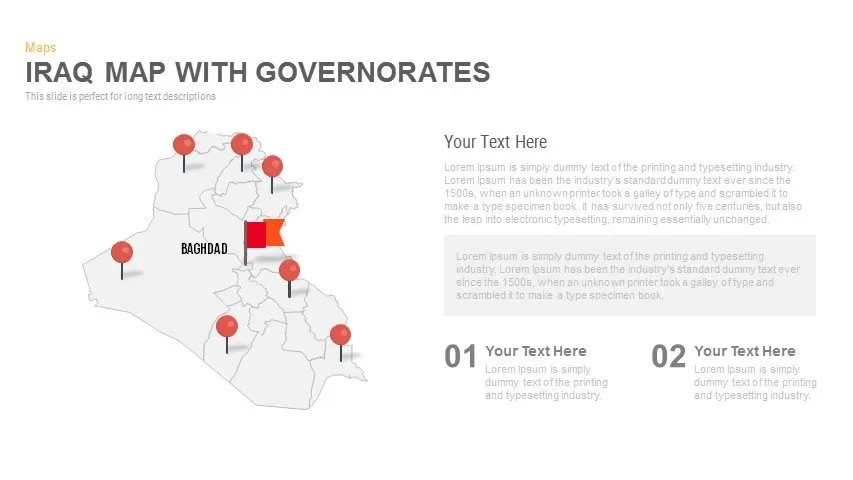
Interactive Iraq Map with Governorates Slide Pack for PowerPoint & Google Slides
World Maps
Free Interactive Notebook for PowerPoint & Google Slides
Business
Free
Line Graph Analysis template for PowerPoint & Google Slides
Charts
Multi-Series Curved Line Graph Analytics Template for PowerPoint & Google Slides
Comparison Chart
Sales Growth Dashboard: KPI Gauge & Line Template for PowerPoint & Google Slides
Revenue
Creative Clothing Line Presentation Template for PowerPoint & Google Slides
Pitch Deck
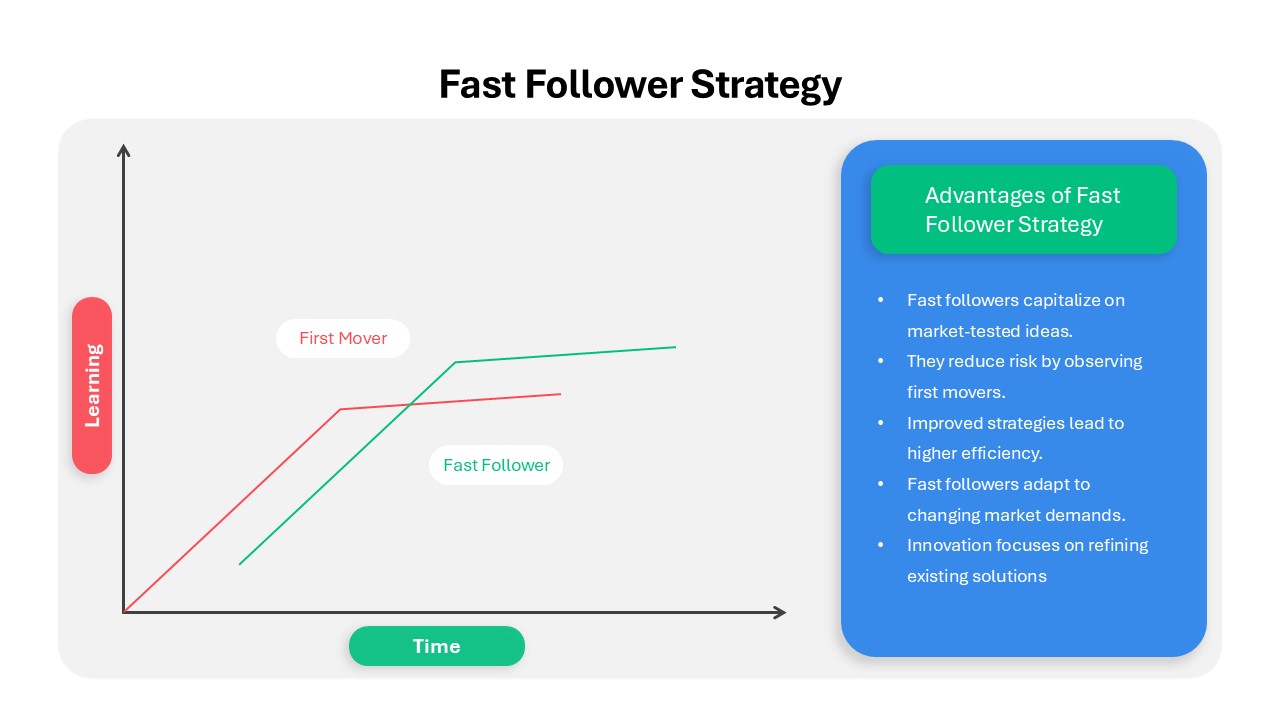
Fast Follower Strategy Line Graph Template for PowerPoint & Google Slides
Comparison Chart
3Ps Triple Bottom Line Venn Diagram Template for PowerPoint & Google Slides
Circular
4 People Racing to Finish Line Template for PowerPoint & Google Slides
Accomplishment
Curved Line Graph for PowerPoint & Google Slides
Timeline
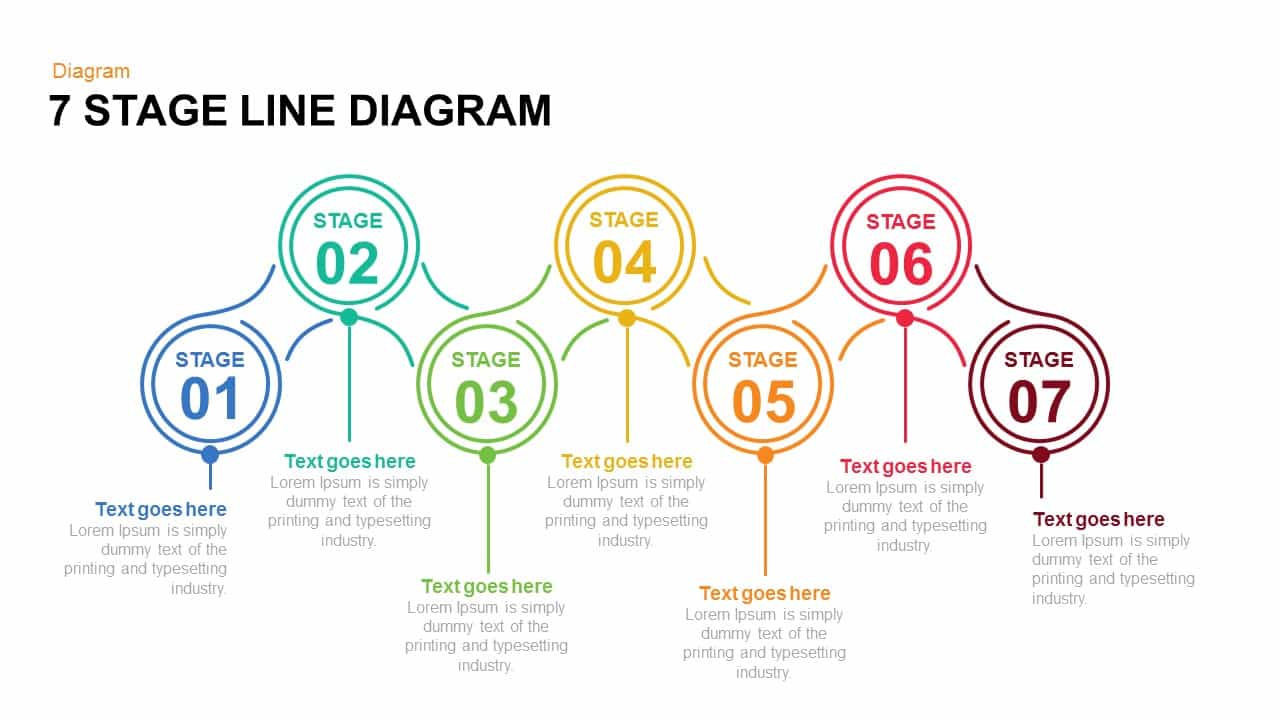
7 and 6 Stage Line Diagram Overview for PowerPoint & Google Slides
Infographics
Five and Six Step Line Linear Stage Diagram for PowerPoint & Google Slides
Infographics
Mobile Data Analysis Chart template for PowerPoint & Google Slides
Charts
Circle Chart Data template for PowerPoint & Google Slides
Pie/Donut
Creative Data Analysis Bar Chart template for PowerPoint & Google Slides
Bar/Column
3D Bar Chart Data Infographics Template for PowerPoint & Google Slides
Bar/Column
Pencil Bar Chart Data Analysis Template for PowerPoint & Google Slides
Bar/Column
3D Cone Chart Data Visualization template for PowerPoint & Google Slides
Bar/Column
Tornado Chart Data Comparison Slide Template for PowerPoint & Google Slides
Bar/Column
Donut Chart Data Breakdown template for PowerPoint & Google Slides
Pie/Donut
Waffle Chart Data Visualization Template for PowerPoint & Google Slides
Comparison Chart
Free Stacked Column Chart Data Visualization Template for PowerPoint & Google Slides
Bar/Column
Free
Simple Bar Chart Data Visualization Template for PowerPoint & Google Slides
Bar/Column
XY Bubble Chart Data Visualization Template for PowerPoint & Google Slides
Comparison Chart
Simple Area Chart Data Trends Analysis Template for PowerPoint & Google Slides
Comparison Chart
Waterfall Chart Data Visualization Template for PowerPoint & Google Slides
Comparison Chart
Multipurpose Spline Chart Data Trend Template for PowerPoint & Google Slides
Bar/Column
Segmented Scatter Chart Data Visualization Template for PowerPoint & Google Slides
Business Strategy
Data Analysis Bar Chart with Insights Template for PowerPoint & Google Slides
Bar/Column
Free
Bar Data Chart Slide for PowerPoint & Google Slides
Bar/Column
Weekly Data Chart Slide for PowerPoint & Google Slides
Comparison Chart

3D Column Chart with Data Table for PowerPoint & Google Slides
Bar/Column

Cone Data Chart for PowerPoint & Google Slides
Charts
Clustered Column Chart Data Analysis Template for PowerPoint
Bar/Column
Creative data chart Analytics Presentation Template
Charts
Data Science PowerPoint Presentation Template for PowerPoint & Google Slides
Pitch Deck
Data Center PowerPoint Template for PowerPoint & Google Slides
Information Technology
Data Analytics Dashboard Design template for PowerPoint & Google Slides
Bar/Column
Gear Pie Diagram Data Visualization Template for PowerPoint & Google Slides
Pie/Donut
Leaf Infographic Data Visualization Template for PowerPoint & Google Slides
Infographics
DIKW Data to Wisdom Pyramid Model Template for PowerPoint & Google Slides
Pyramid
KPI Dashboard Data Visualization Template for PowerPoint & Google Slides
Bar/Column
North America Data Map Callouts Template for PowerPoint & Google Slides
World Maps
UK Counties Map Data Visualization Template for PowerPoint & Google Slides
World Maps
Syria Regional Data Map Infographic Template for PowerPoint & Google Slides
World Maps
Data Privacy template for PowerPoint & Google Slides
Information Technology
Data Protection Strategies template for PowerPoint & Google Slides
Information Technology
Comprehensive Data & AI Capability Model Template for PowerPoint & Google Slides
AI
AI and Data Ecosystem Map Template for PowerPoint & Google Slides
AI
Data Protection & Encryption in the Cloud Overview template for PowerPoint & Google Slides
Cloud Computing
Customer Data Platform Workflow Diagram Template for PowerPoint & Google Slides
Information Technology
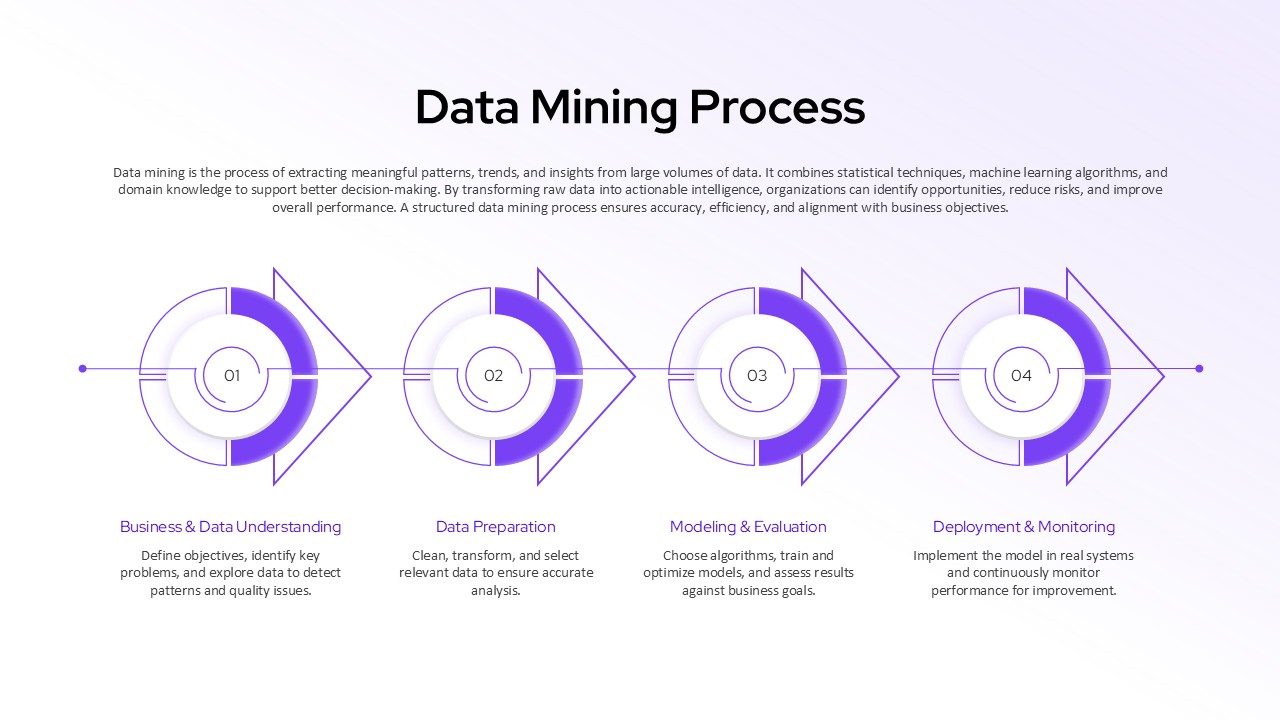
Data Mining Process Diagram Template for PowerPoint & Google Slides Presentation
Manufacturing