X Y Bubble Chart PowerPoint Template


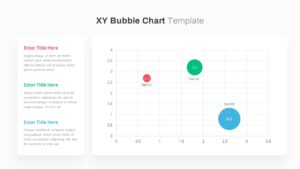
XY Bubble Chart PowerPoint Template presents one of the most used data analysis tools in PowerPoint. It is widely utilized for statistical slideshows because it can precisely represent complex information. This bubble chart is suitable for various topics, ranging from simple candy sales data to complex financial reports in the business world.
Resembling scatter plots, the bubble chart enables users to examine the relationship between three numeric variables. Each bubble on the chart corresponds to a single data point, with the size and position of the dots indicating the values of the variables being analyzed. This visually engaging representation aids in better comprehension and analysis of the data, making it an invaluable asset for professionals in various fields.
Three key benefits of XY Bubble Chart PowerPoint Template
Visualizing relationships: The XY Bubble chart template enables you to identify and analyze the relationship between variables immediately. The X and Y axes represent two independent variables, while the size of the bubbles represents a third dependent variable. This helps to understand correlations, patterns, and trends in the data more convincingly.
Communicating magnitude: By using the size of the bubbles, the XY bubble chart for PowerPoint provides a visual representation of the magnitude or value of the third variable. Larger bubbles indicate higher values, while smaller bubbles indicate lower values. This enables quick and easy comparisons between data points.
Enhancing storytelling: The visual nature of the XY bubble chart PowerPoint template makes it effective for storytelling and presenting data-driven insights to others. It provides a compelling and engaging way to communicate complex information, making it easier for the audience to grasp and understand the relationships and trends within the data.
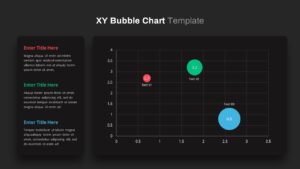
The bubble chart template for PowerPoint has two background color options to choose from. The editable powerpoint template offers full customizations of data with easy-to-read textual descriptions on the left-hand side. The users can impress the audience with this catchy bubble chart PowerPoint.
Login to download this file

Item ID
SB03644
Related Templates

Bubble Chart template for PowerPoint & Google Slides
Charts
Bubble Chart Scatter, Diagram & Matrix Template for PowerPoint & Google Slides
Comparison Chart
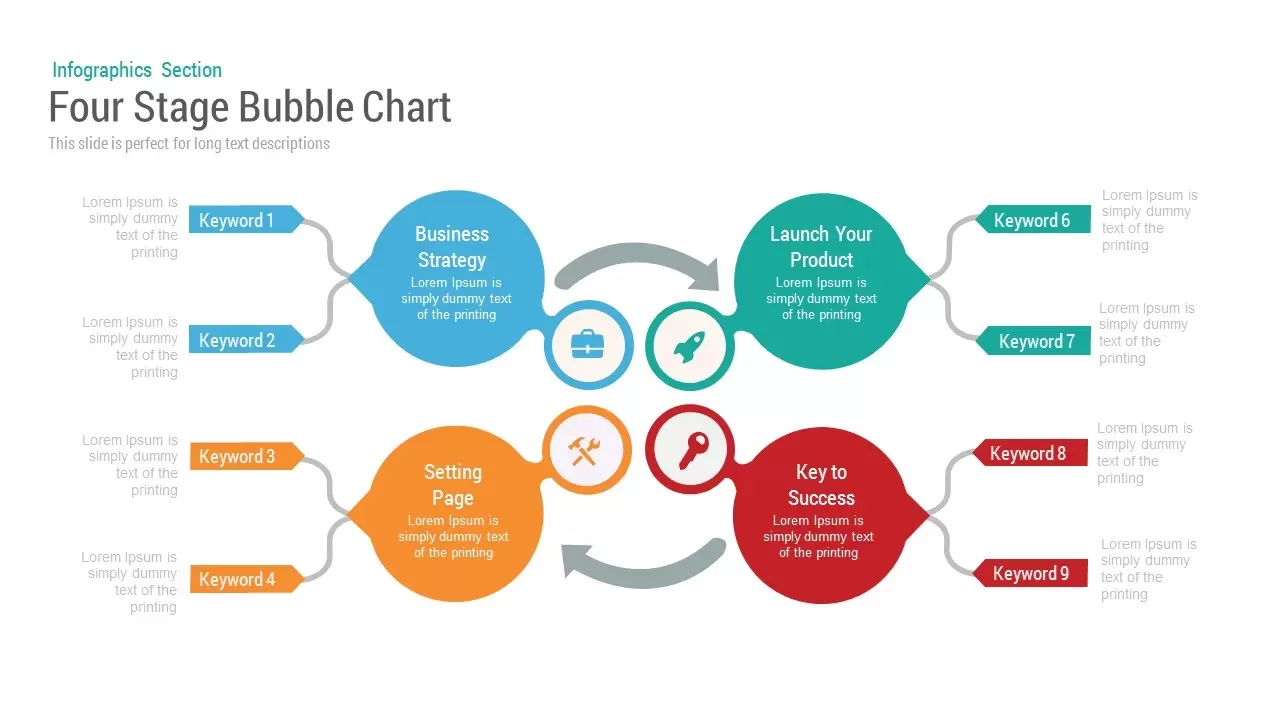
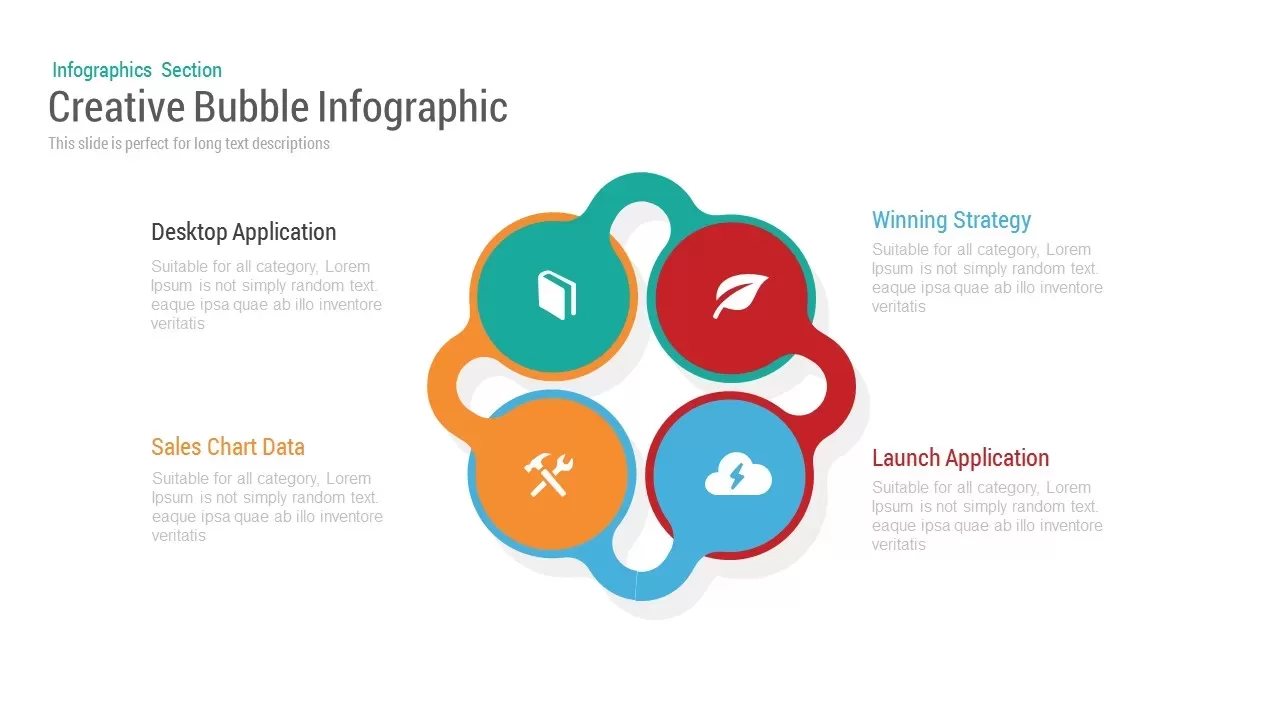
Bubble Infographic template for PowerPoint & Google Slides
Circular
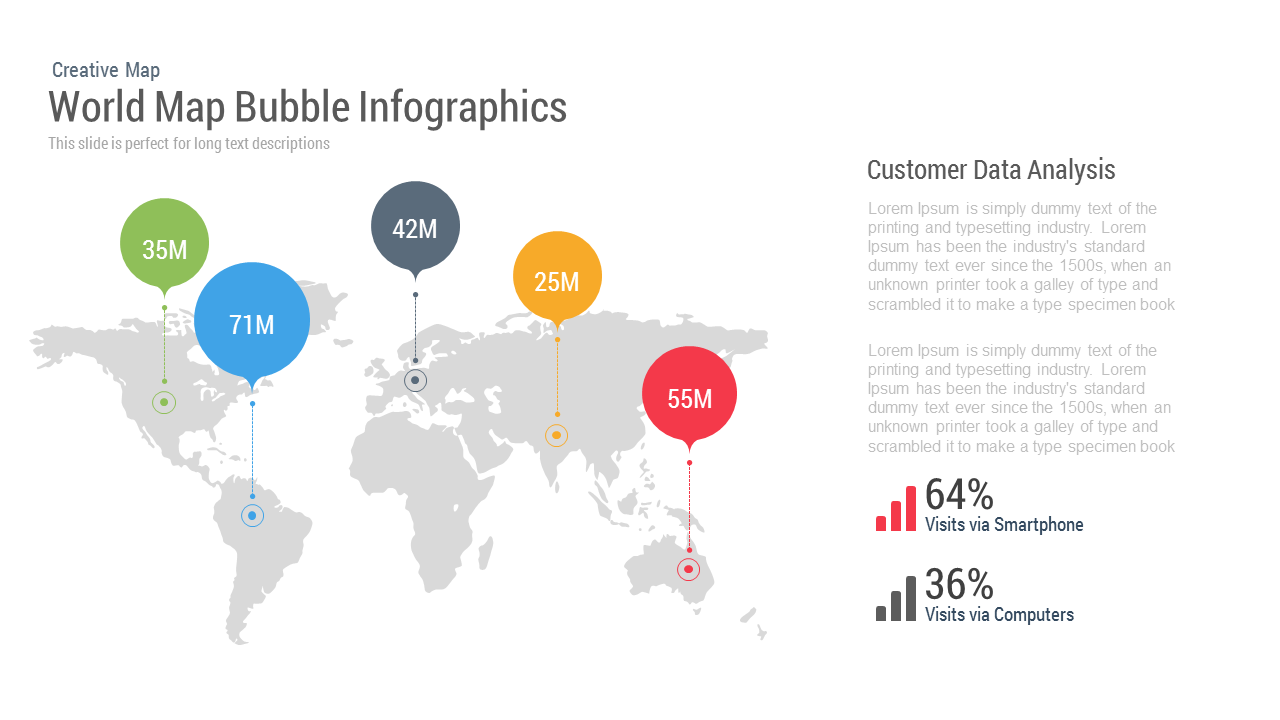
World Map Bubble template for PowerPoint & Google Slides
World Maps
Bubble Head Metrics Infographic Template for PowerPoint & Google Slides
Circular
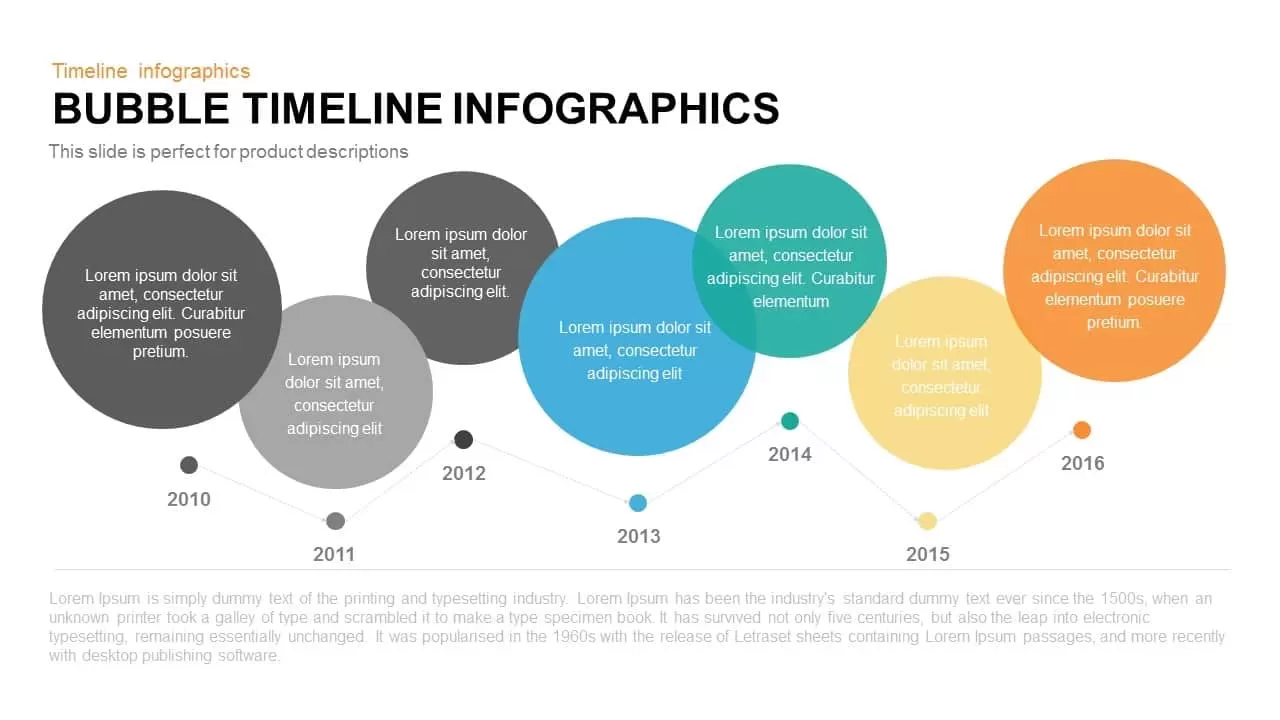
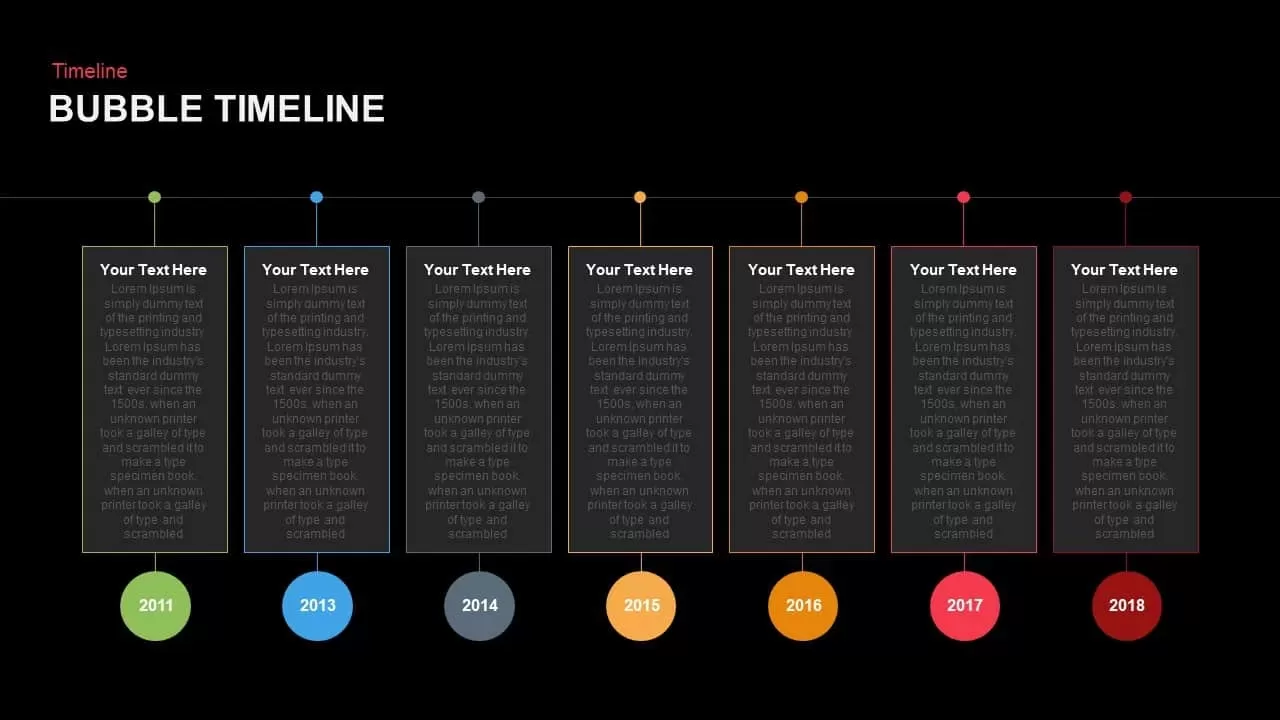
Bubble Timeline Infographics PowerPoint Template and Keynote
Business
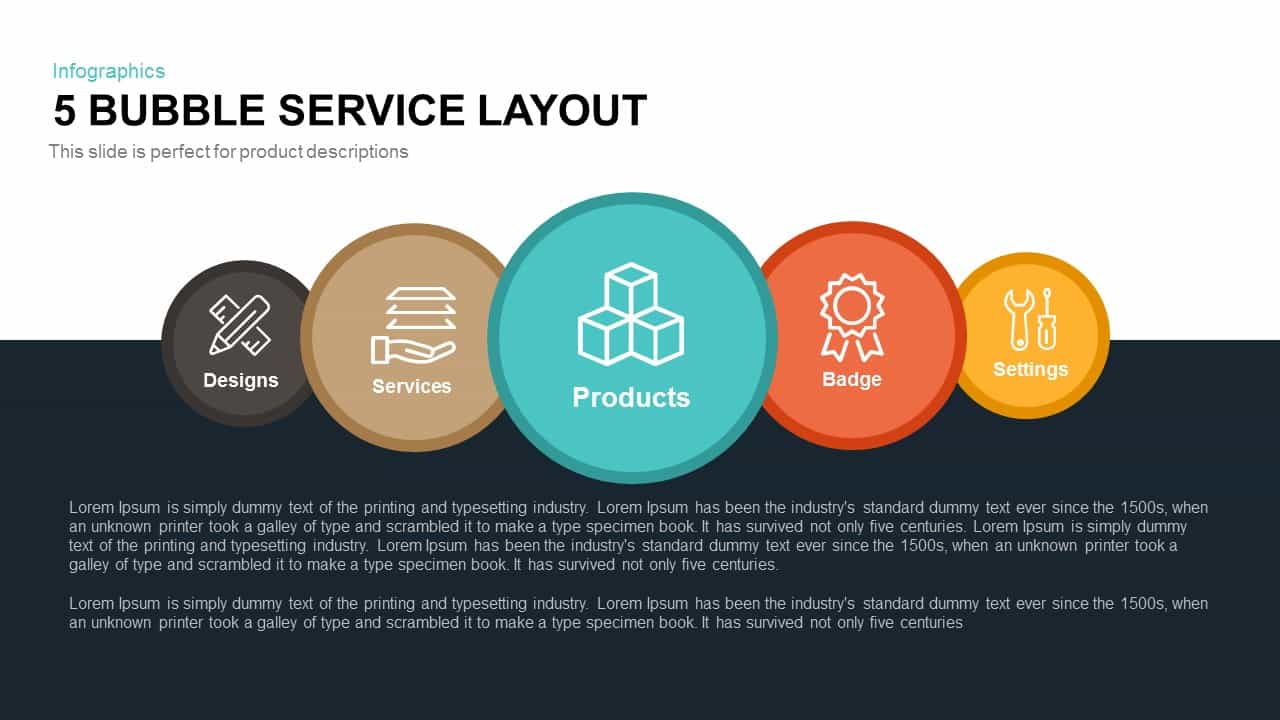
5 Bubble Service Layout Diagram Template for PowerPoint & Google Slides
Process
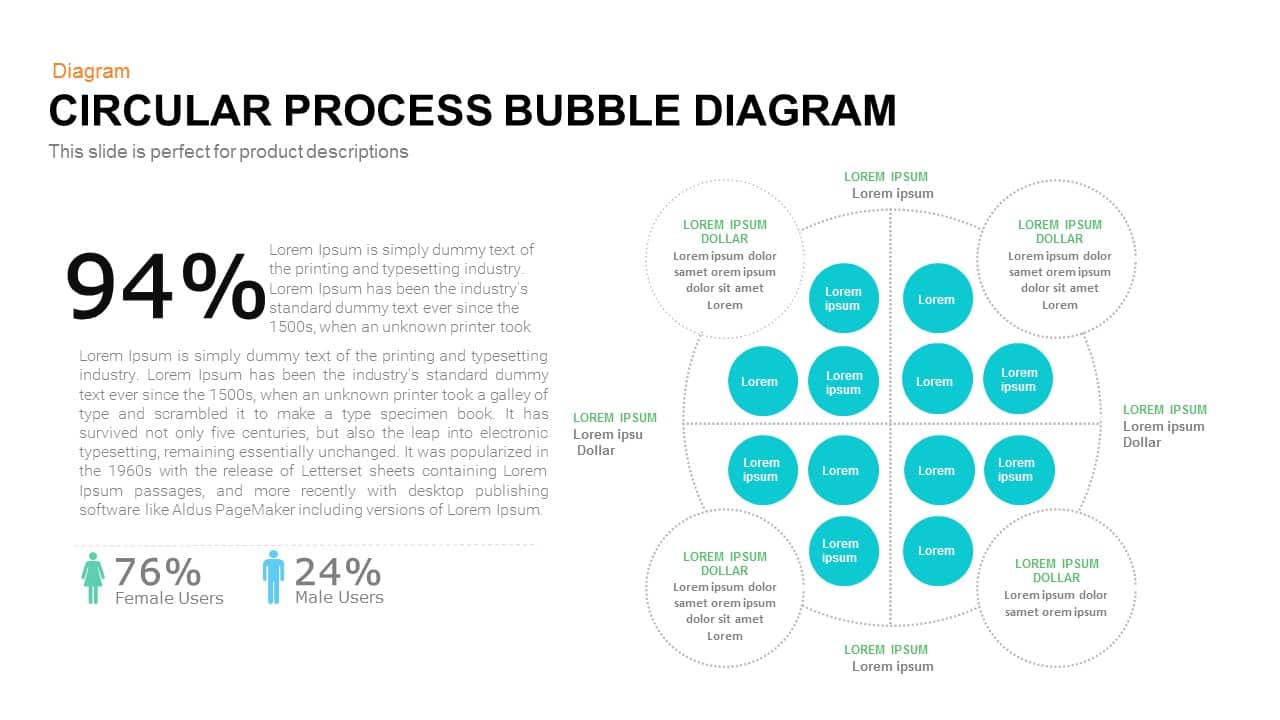
Circular Process Bubble Diagram PowerPoint and Google Slide template
Process

Editable Six-Step Bubble Process Diagram Template for PowerPoint & Google Slides
Process
Free Six Stage Bubble Process Diagram template for PowerPoint & Google Slides
Process
Free
Modern Bubble Timeline Infographic Template for PowerPoint & Google Slides
Timeline
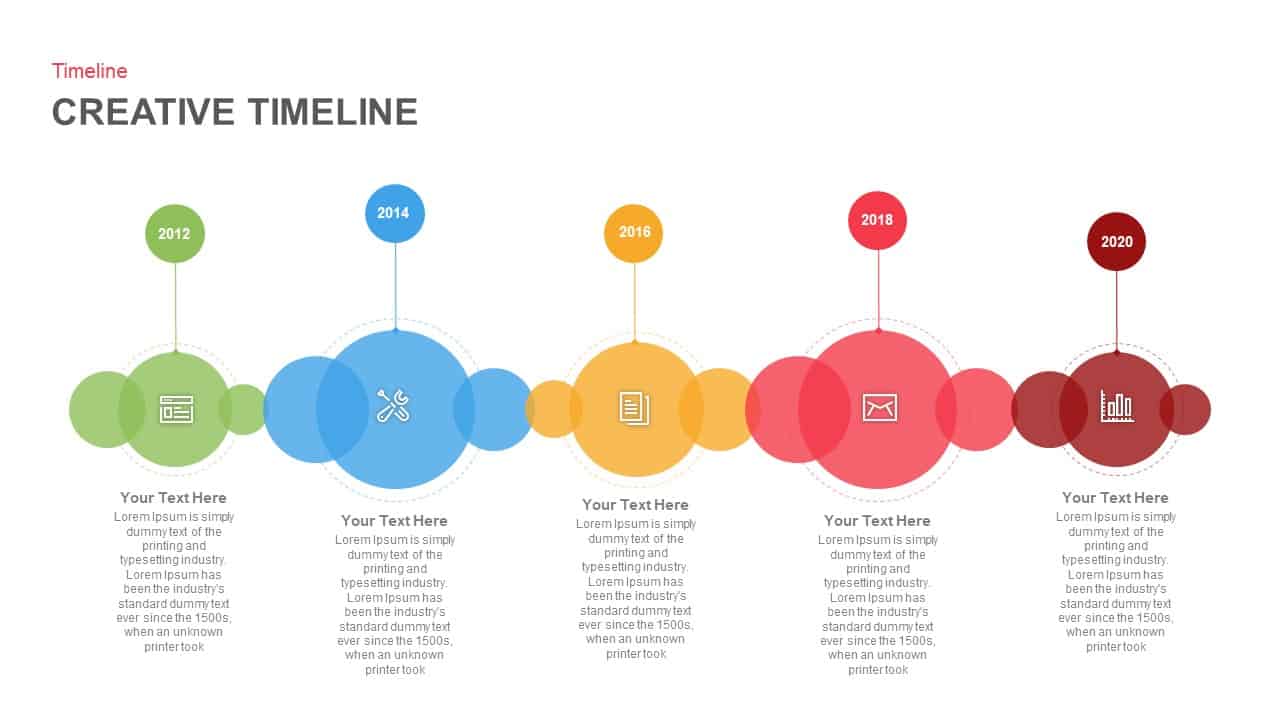
Creative Bubble Timeline Infographic Template for PowerPoint & Google Slides
Timeline
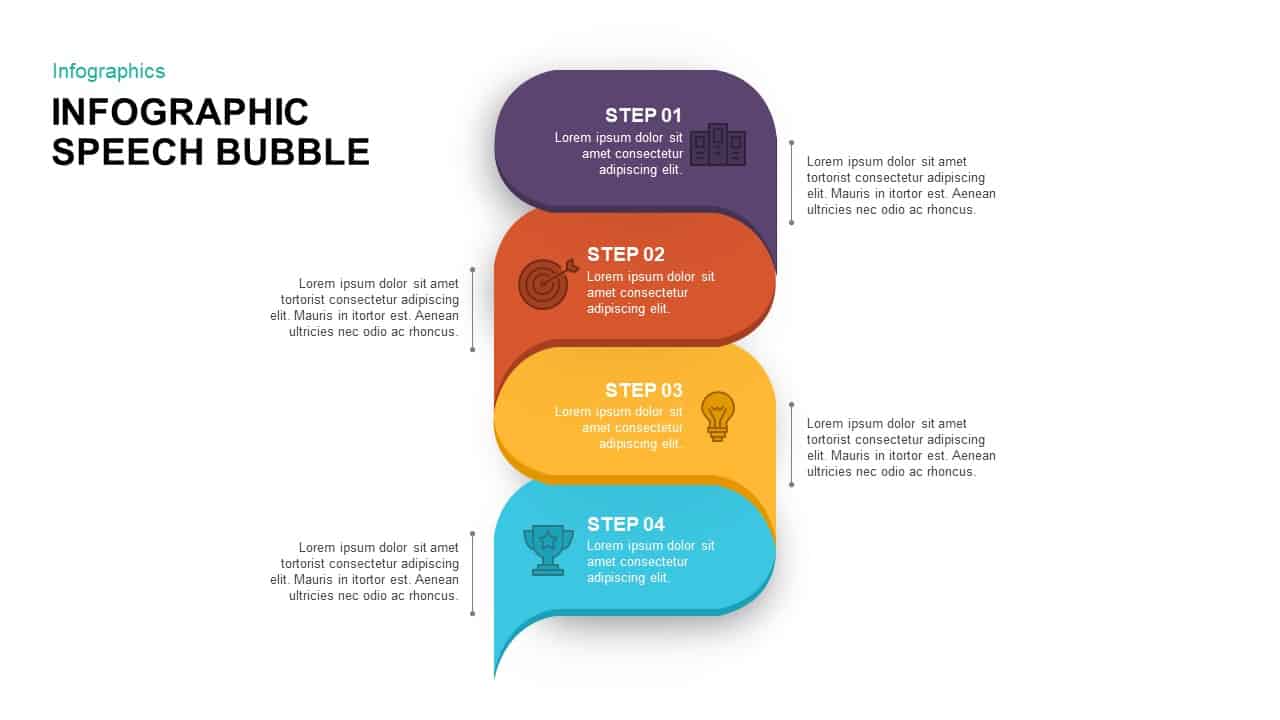
Four-Step Speech Bubble Diagram Template for PowerPoint & Google Slides
Process
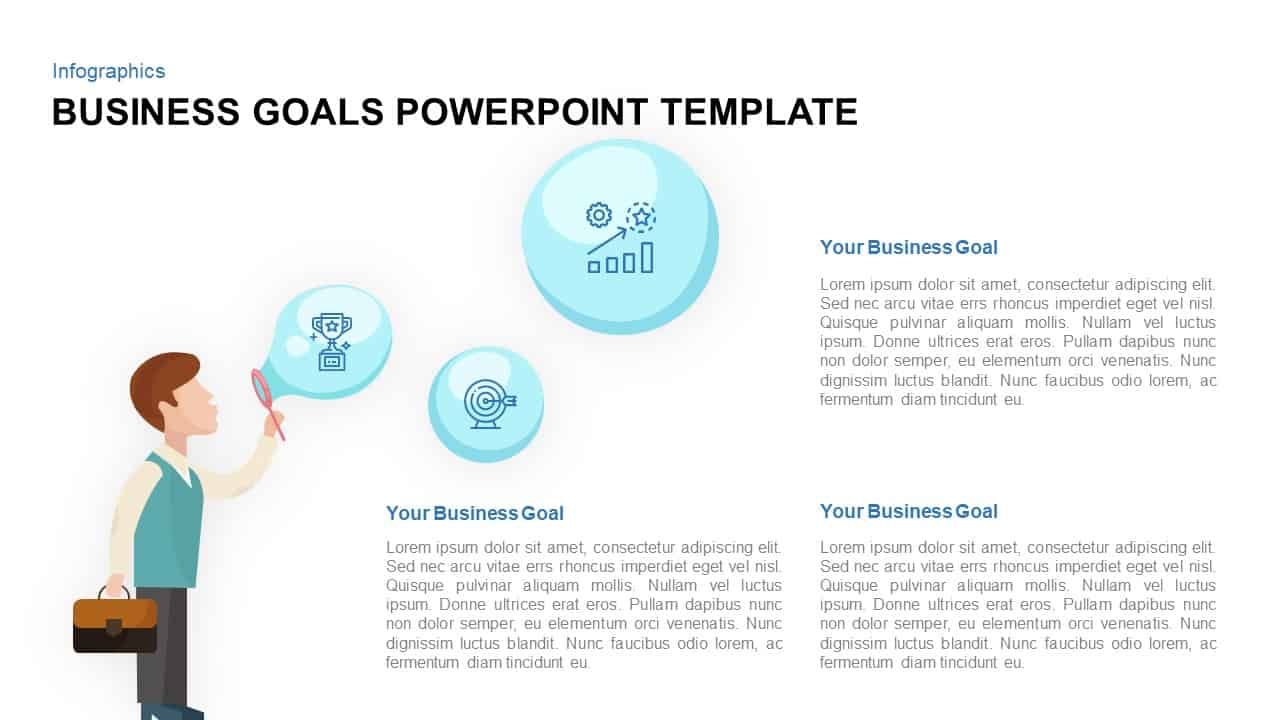
Business Goals Bubble Infographic Template for PowerPoint & Google Slides
Infographics
Bubble Photo Collage Template for PowerPoint & Google Slides
Graphics
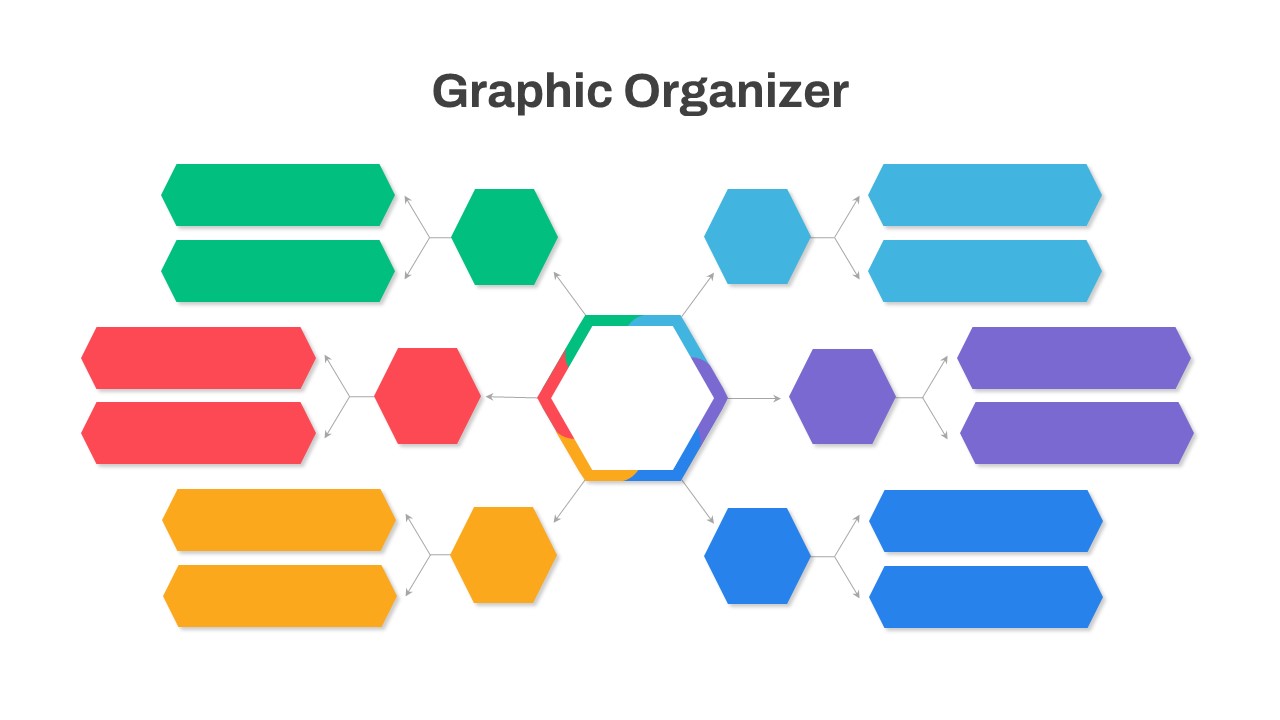
Graphic Organizer & Double Bubble Map Template for PowerPoint & Google Slides
Maps
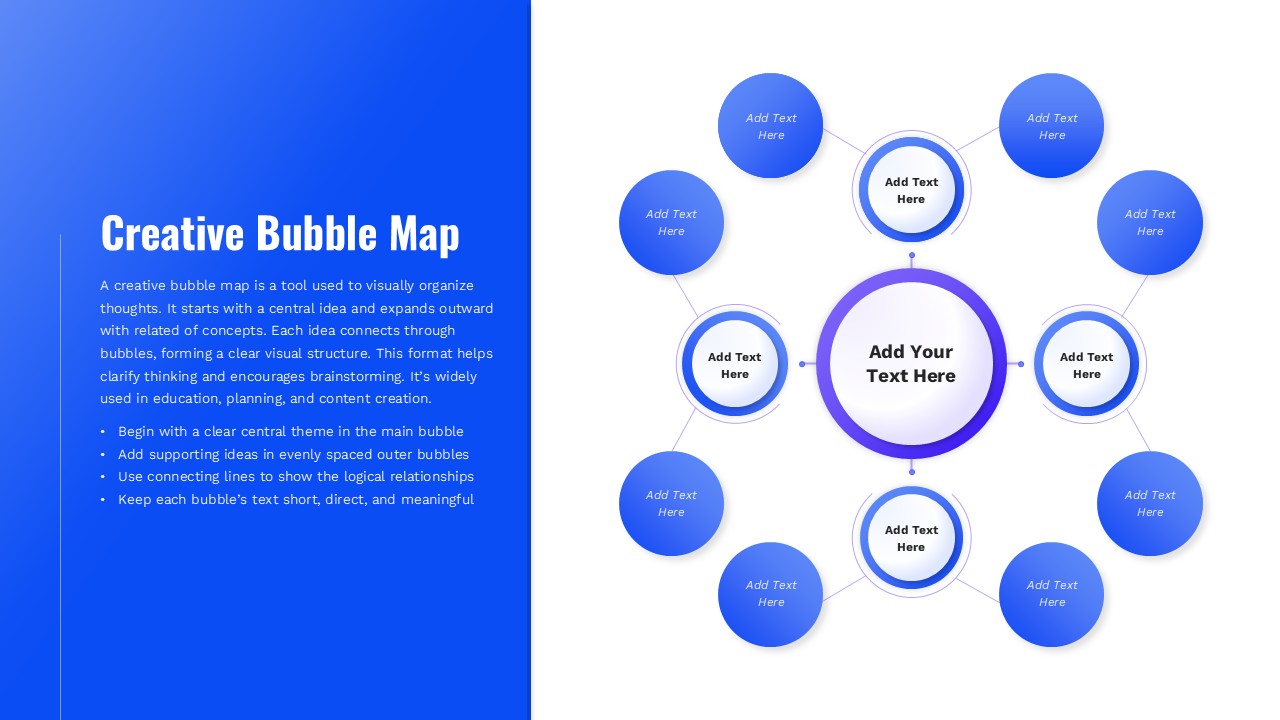
Creative Bubble Mind Map Template for PowerPoint & Google Slides
Mind Maps