Multi-Variation Thermometer Chart Template for PowerPoint & Google Slides


Description
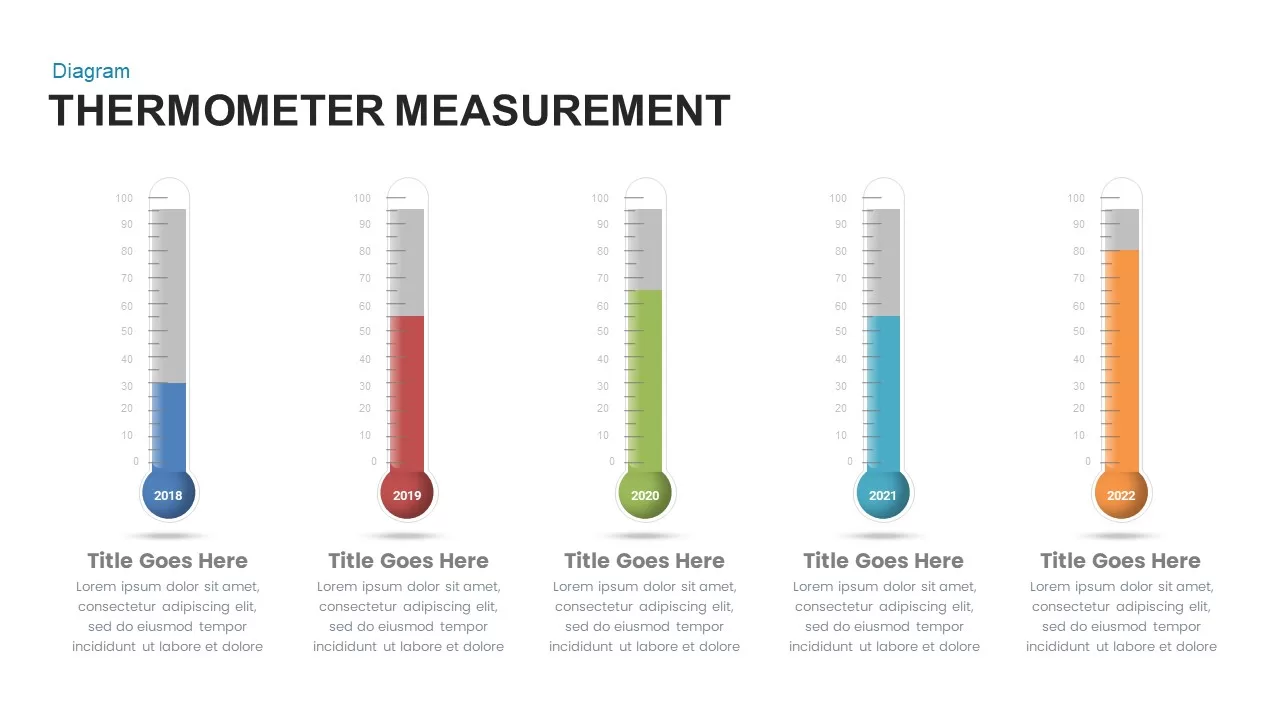
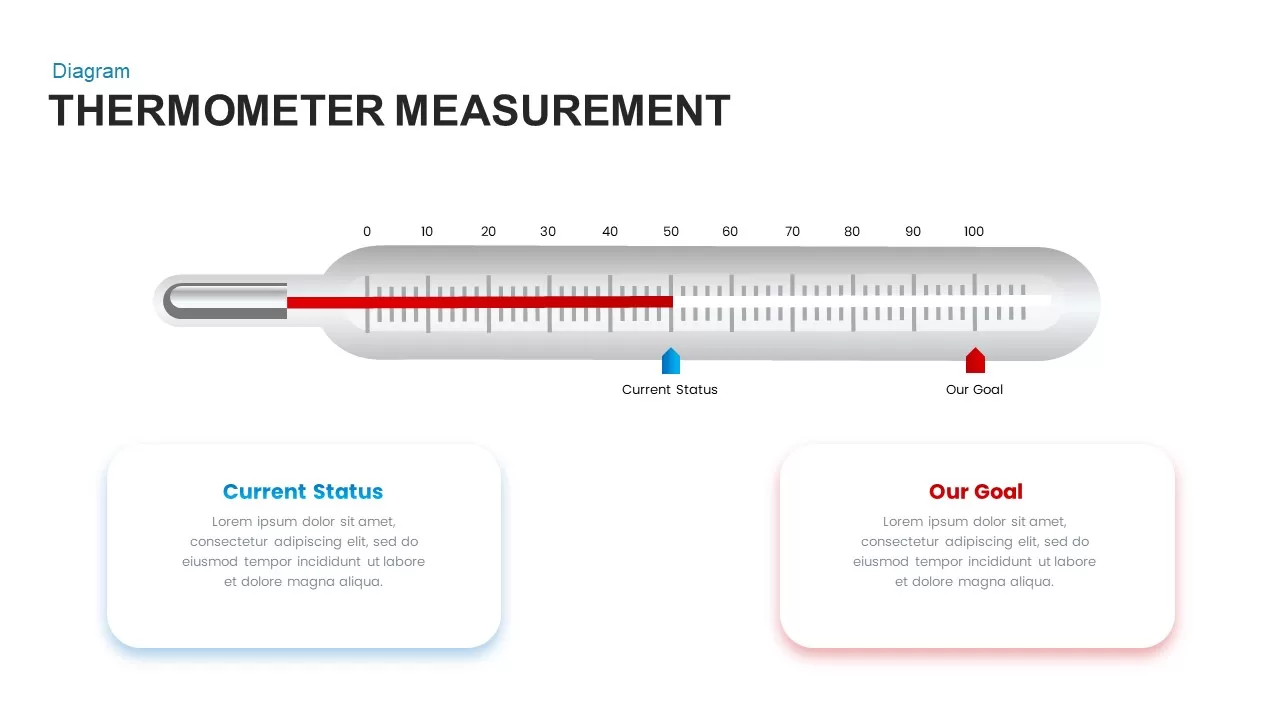
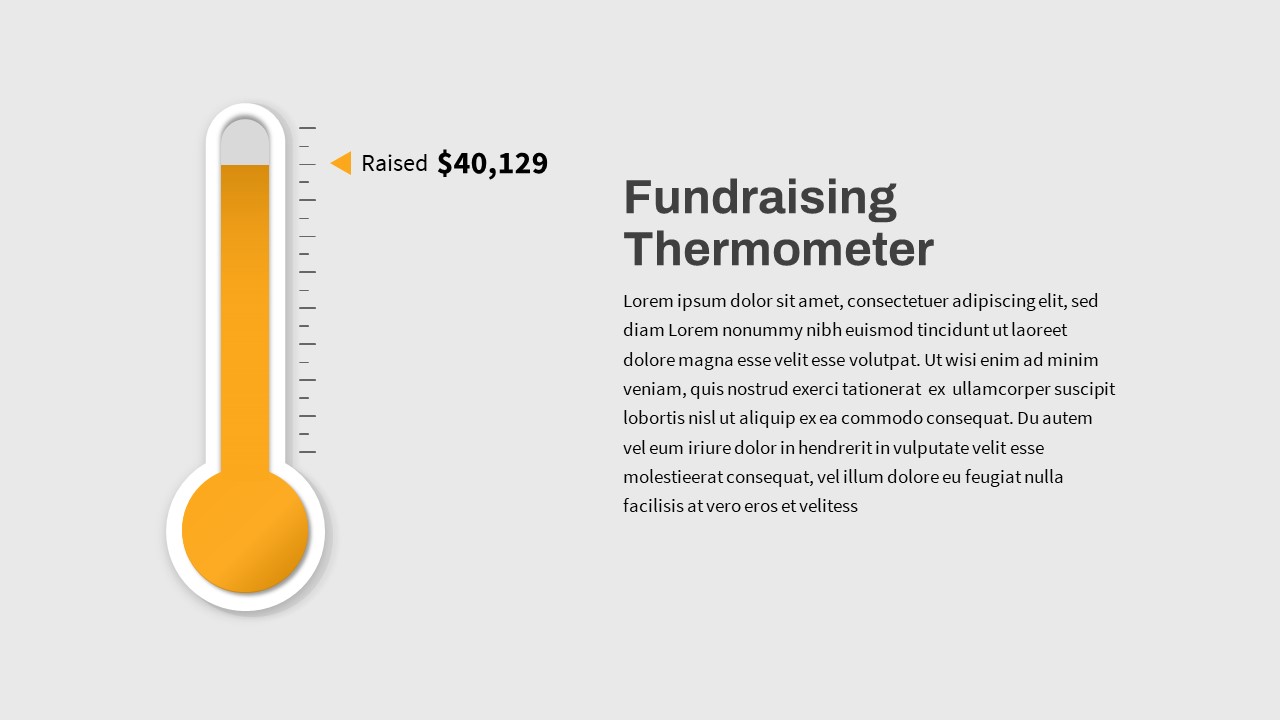
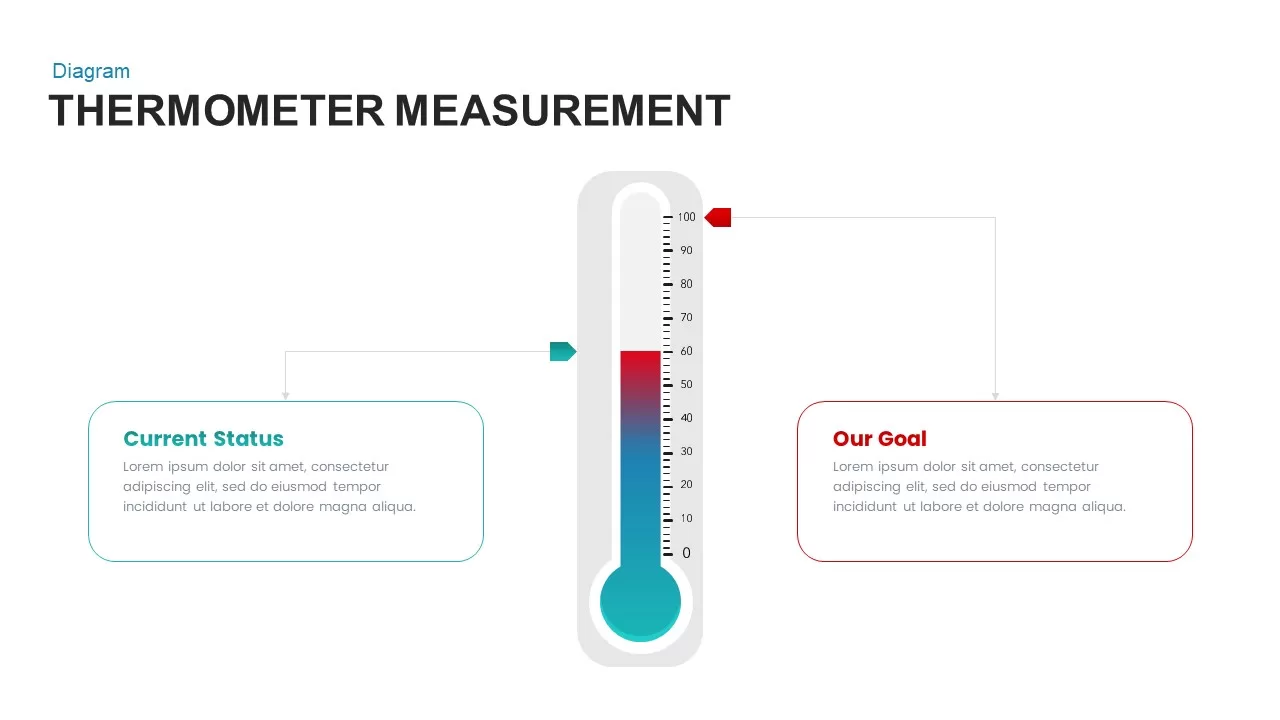
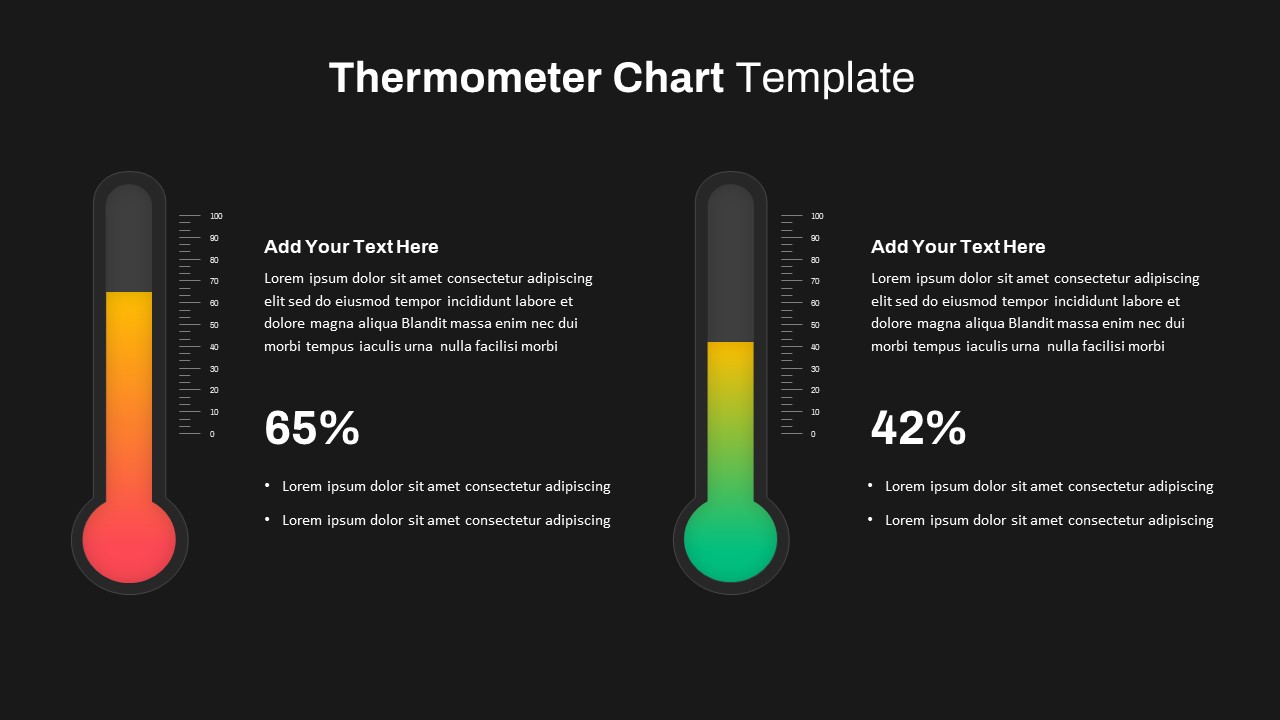
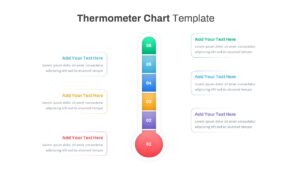
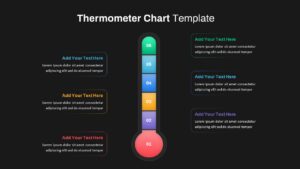
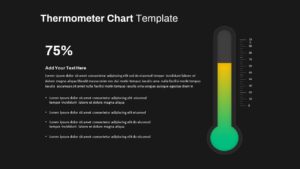
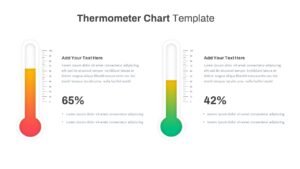
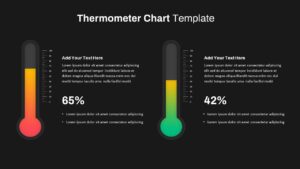
Leverage this multi-variation thermometer chart template pack to visualize progress, performance metrics, and goal attainment across three flexible slide layouts, including a six-level segmented thermometer, a full-range gradient fill design, and a comparative dual-thermometer slide. The vertical thermometer shapes feature vector-based graphics arranged in clean outlines with subtle drop shadows. The segmented variant is divided into six numbered bands from red at the base through purple, orange, blue, cyan, to green at the top, enabling audiences to track discrete milestones. The single gradient slide displays a continuous fill up to any percentage with corresponding scale markings and a prominent numeric label, while the dual layout offers side-by-side thermometers for comparative KPI analysis. Each slide provides editable text zones for titles, descriptive paragraphs, percentage indicators, and bullet insights without overcrowding the layout. Built on master slides for both PowerPoint and Google Slides, this asset supports rapid customization: resize shapes without quality loss, swap color schemes, modify fonts, or update data points in seconds. A crisp white background and modern sans-serif typography deliver a distraction-free aesthetic that adapts to corporate or creative branding contexts. Integrated alignment guides and intuitive placeholder controls streamline slide creation under tight deadlines. The high-resolution vector elements maintain pixel-perfect clarity across displays, printed reports, and virtual presentations. Whether you are showcasing fundraising thermometers, sales targets, project status, or departmental comparisons, this versatile template pack empowers presenters to tell clear, data-driven stories. Numbered and unnumbered fill options guide audience focus, enhance comprehension, and reduce interpretation errors, making complex metric reporting simple, engaging, and persuasive.
Who is it for
Marketing managers, sales leaders, project managers, financial analysts, and nonprofit fundraisers will benefit from this template when presenting progress trackers, KPI overviews, or comparative performance analyses.
Other Uses
Repurpose this slide set for budget utilization reports, compliance tracking, training milestones, customer satisfaction dashboards, or employee performance reviews. Duplicate, recolor, or relabel thermometers to suit any measurement-based narrative.
Login to download this file

Item ID
SB03776
Related Templates

Multi-Variation Circular Chart Diagram Template for PowerPoint & Google Slides
Circular
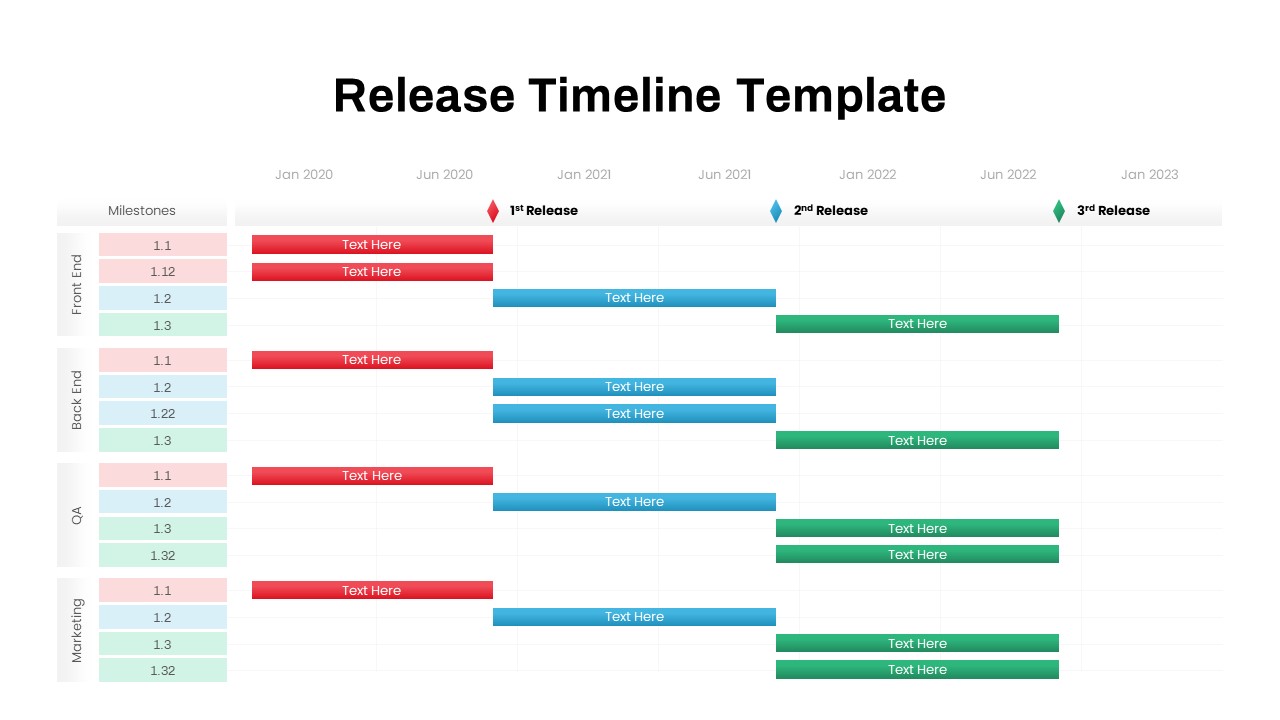
Multi-Team Multi-Phase Release Timeline Template for PowerPoint & Google Slides
Timeline
Thermometer Measurement Timeline Diagram Template for PowerPoint & Google Slides
Timeline
Thermometer Gauge Progress Measurement Template for PowerPoint & Google Slides
Comparison
Dynamic Fundraising Thermometer Slide Template for PowerPoint & Google Slides
Revenue
Thermometer Measurement Diagram for PowerPoint & Google Slides
Business
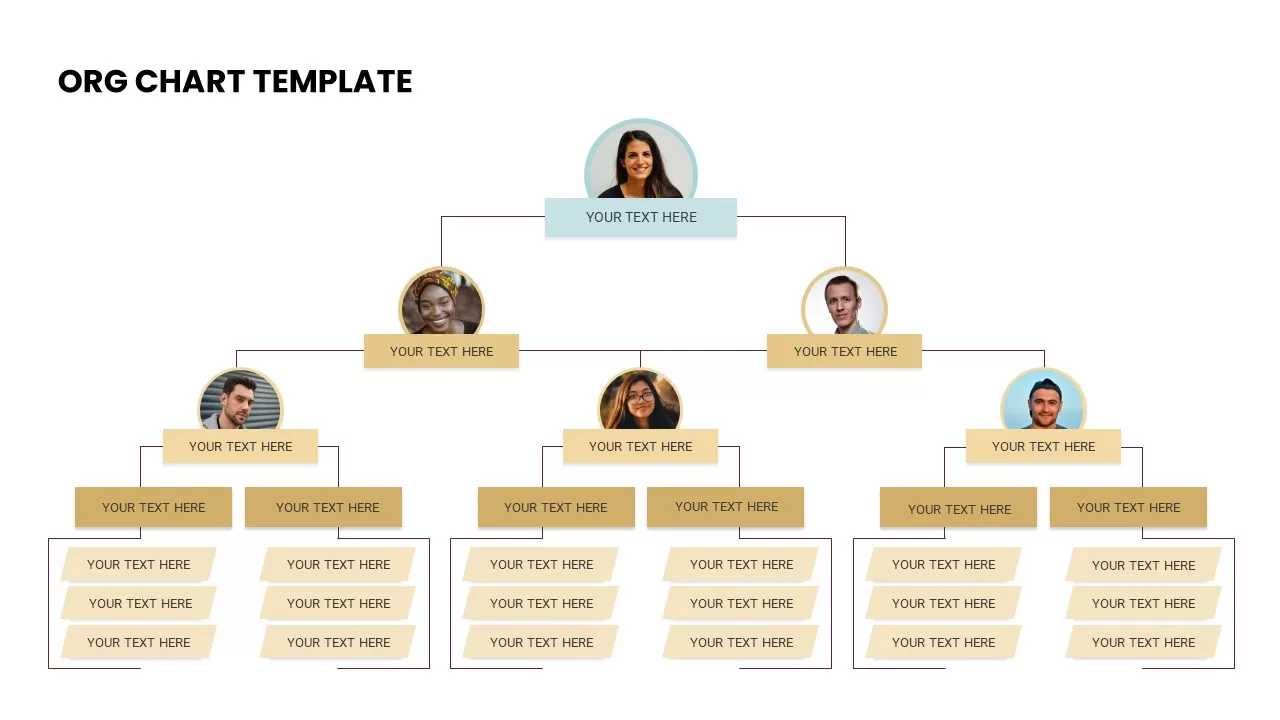
Horizontal Multi-Level Hierarchy Chart template for PowerPoint & Google Slides
Org Chart
Free Circular Multi-Step Flow Chart Diagram Template for PowerPoint & Google Slides
Flow Charts
Free
Multi-Series Stacked Bar Chart Template for PowerPoint & Google Slides
Bar/Column
Minimal Multi-Year Column Chart Template for PowerPoint & Google Slides
Bar/Column
Editable Multi-Series Peak Line Chart Template for PowerPoint & Google Slides
Comparison Chart
Multi-Series Line Chart with Icons Template for PowerPoint & Google Slides
Comparison Chart
Multi-Series Vertical Dot Chart Template for PowerPoint & Google Slides
Comparison Chart
Multi-Style Clock Chart Diagram Template for PowerPoint & Google Slides
Circular
Modern Multi-Color Polar Chart Diagram Template for PowerPoint & Google Slides
Charts
Multi-Level Wheel Chart Diagram template for PowerPoint & Google Slides
Pie/Donut
Multi-Level Colorful Pyramid Chart Template for PowerPoint & Google Slides
Pyramid
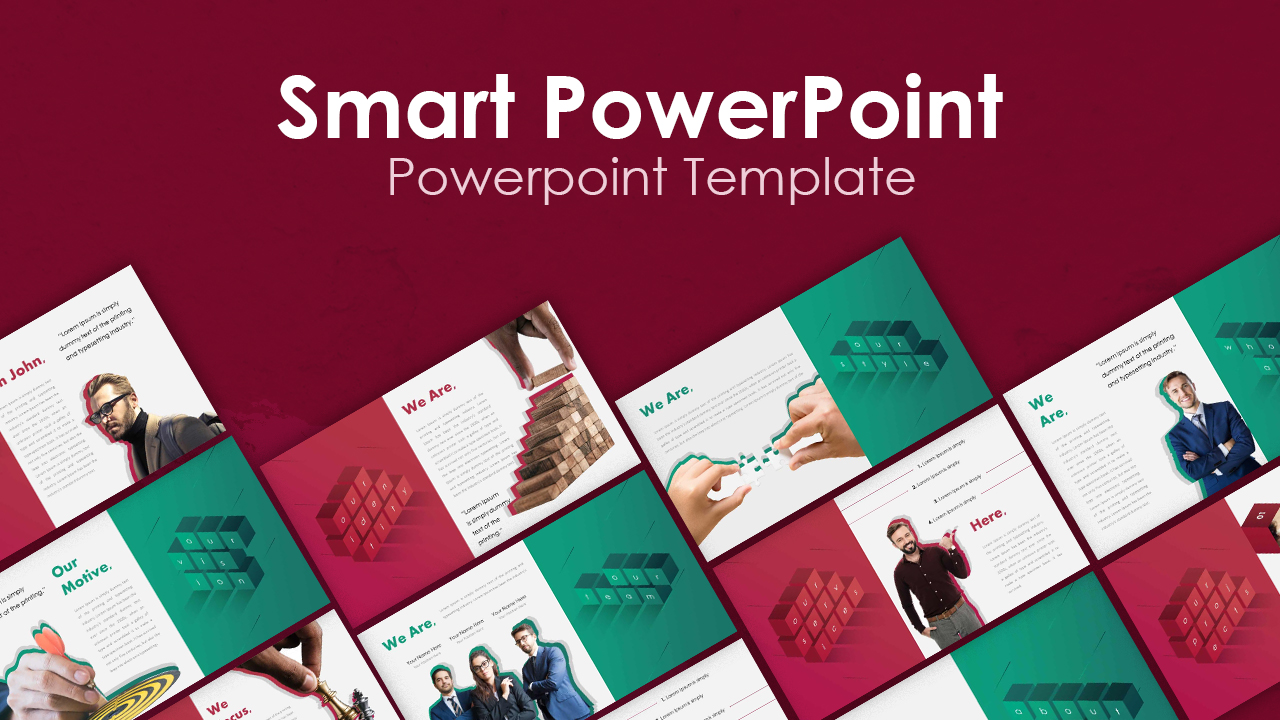
Smart Multi-Purpose PowerPoint Template for PowerPoint & Google Slides
Company Profile
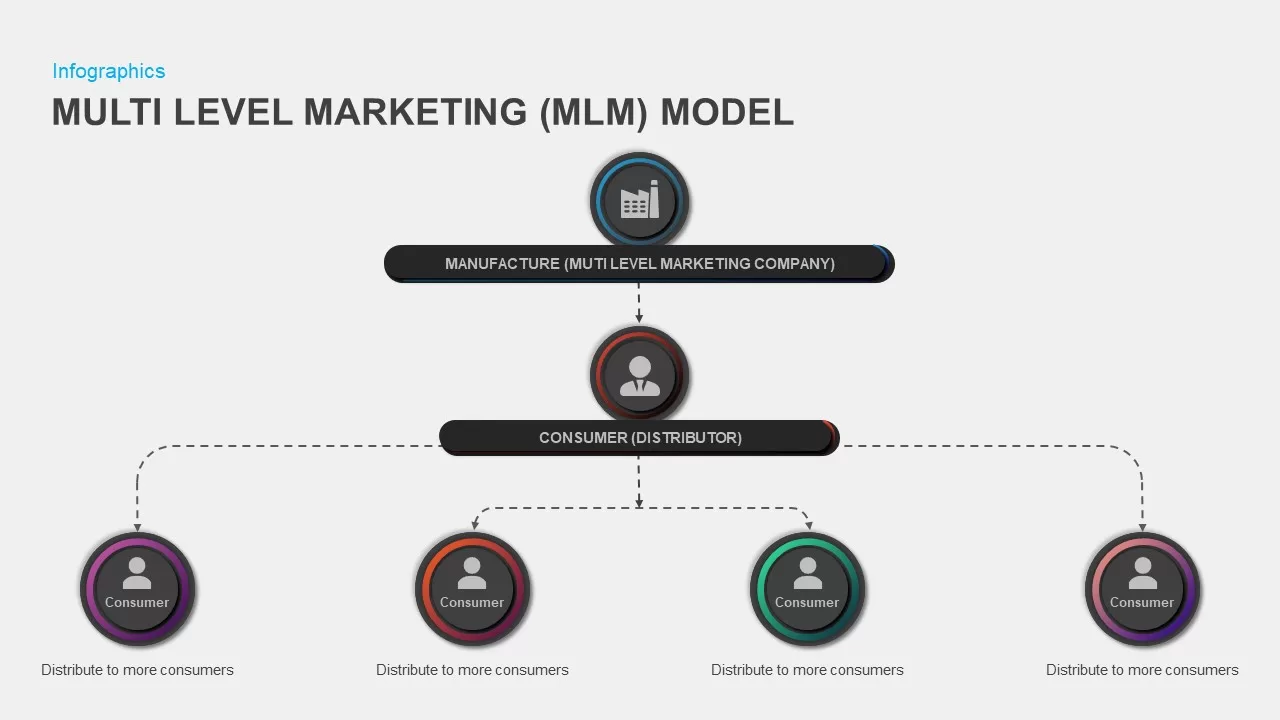
Multi-Level Marketing PowerPoint Template for PowerPoint & Google Slides
Business Models
Multi-Series Curved Line Graph Analytics Template for PowerPoint & Google Slides
Comparison Chart
Multi-Segment Circle Split Diagram template for PowerPoint & Google Slides
Circular

Simple Multi-Branch Mind Map Template for PowerPoint & Google Slides
Mind Maps
Multi-layout Circle Spoke Diagram Template for PowerPoint & Google Slides
Circular
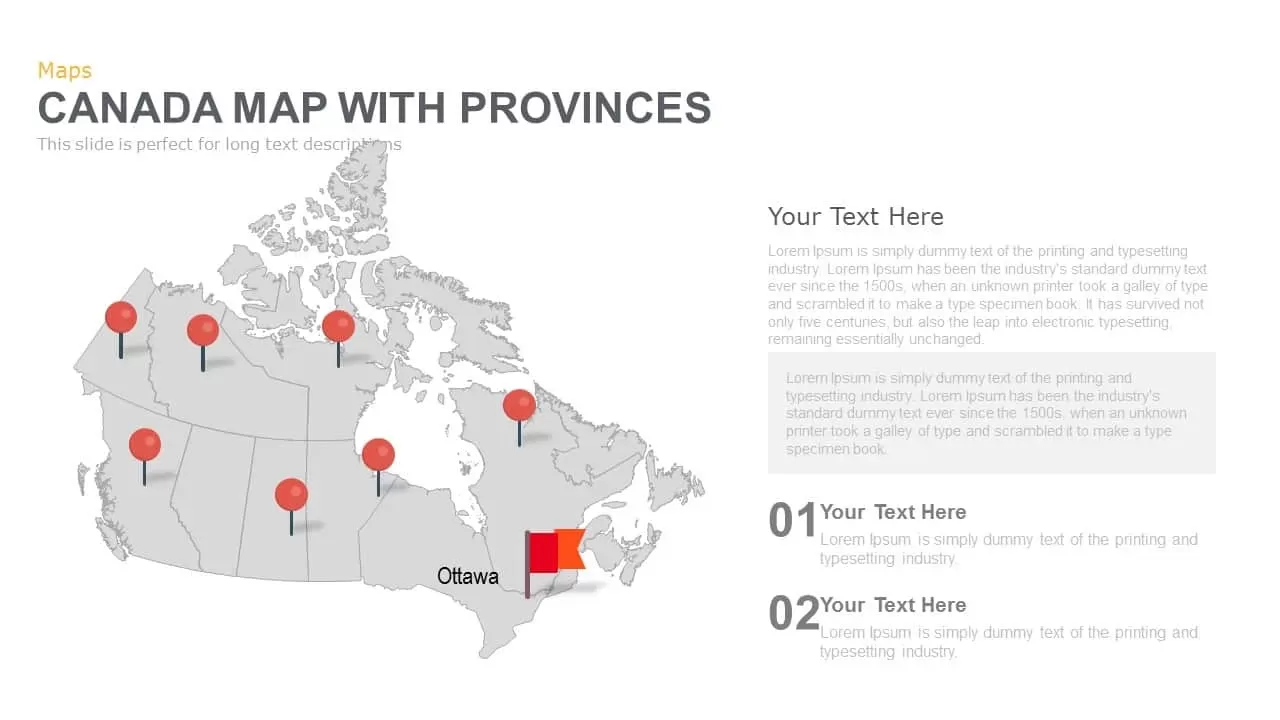
Canada Provinces Map Multi-Layout Template for PowerPoint & Google Slides
World Maps
Multi-Stage Timeline Infographics Template for PowerPoint & Google Slides
Timeline
Modern Multi-Section Circle Diagram Template for PowerPoint & Google Slides
Circular
Multi-Organ Human Body Infographic Template for PowerPoint & Google Slides
Comparison
Multi-Color Eight-Step Ribbon Diagram Template for PowerPoint & Google Slides
Process
Multi-Style Presentation Agenda Template for PowerPoint & Google Slides
Agenda
Multi-Year Timeline Infographic Template for PowerPoint & Google Slides
Timeline

Multi-Cluster Mind Map Infographic Template for PowerPoint & Google Slides
Mind Maps
Multi-Style Project Life Cycle Diagram Template for PowerPoint & Google Slides
Process
Multi-Functional Presentation Template for PowerPoint & Google Slides
Pitch Deck
Multi-Purpose Corporate Infographic Template for PowerPoint & Google Slides
Company Profile
Free
Multi-Color Enneagram Circular Diagram Template for PowerPoint & Google Slides
Circular
Multi-Item Agenda Hub-and-Spoke Diagram Template for PowerPoint & Google Slides
Agenda
Doodle Multi Presentation Template for PowerPoint & Google Slides
Company Profile

Free Timeline Infographic Template
Timeline
Free
Free Multi-Level Roadmap Infographic Template for PowerPoint & Google Slides
Roadmap
Free
Multi-Step Infographic Process Layout Template for PowerPoint & Google Slides
Process
Multi-Style Flow Infographic Slide template for PowerPoint & Google Slides
Process
Multi-Color Five-Step Curved Arrow Template for PowerPoint & Google Slides
Process
Automotive Infographic Multi-Layout Template for PowerPoint & Google Slides
Comparison
Animated Multi-Gear Cluster Infographic Template for PowerPoint & Google Slides
Process
January to December 12 Month Timeline PowerPoint Template
Timeline
Multi-Color Milestone Timeline Layout Template for PowerPoint & Google Slides
Timeline
Event Timeline Template for PowerPoint & Google Slides
Timeline
Delivery Timeline Multi-Row Template for PowerPoint & Google Slides
Timeline
Interactive Multi-Use Cost Comparison Template for PowerPoint & Google Slides
Comparison
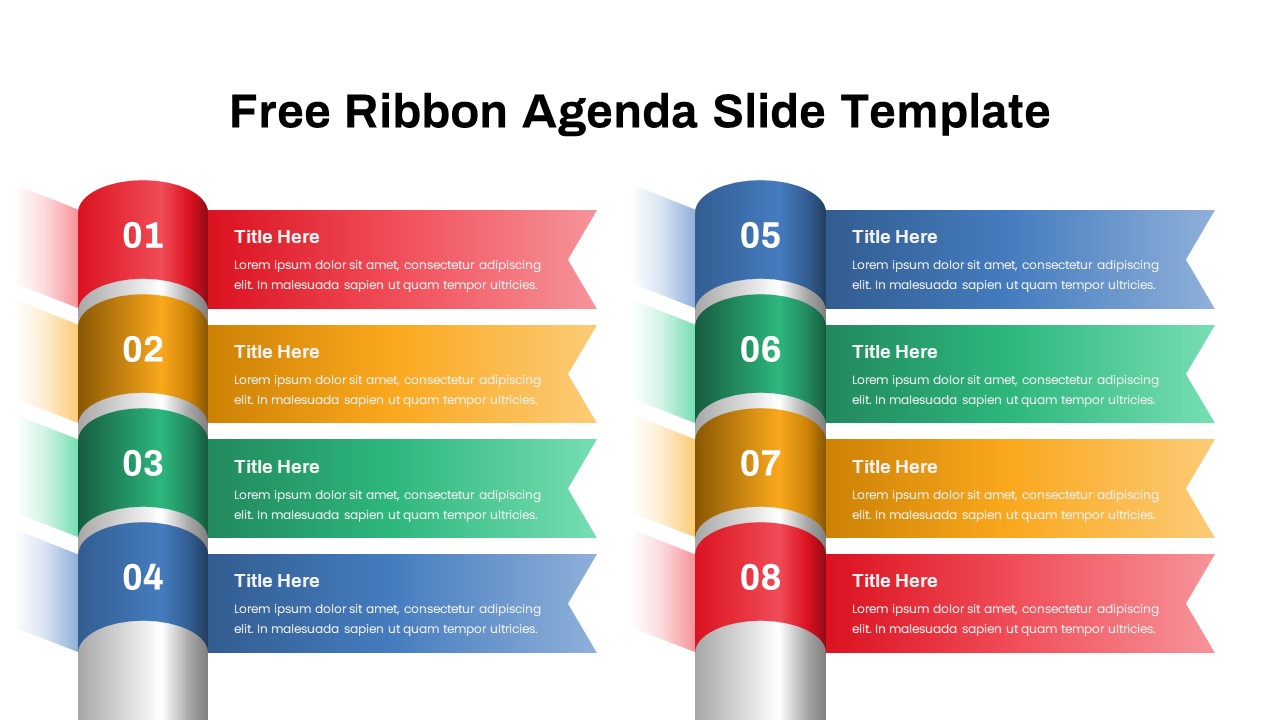
Free Editable Multi-Step Ribbon Agenda Slide Template for PowerPoint & Google Slides
Agenda
Free
Multi-Phase Research Roadmap Infographic Template for PowerPoint & Google Slides
Roadmap
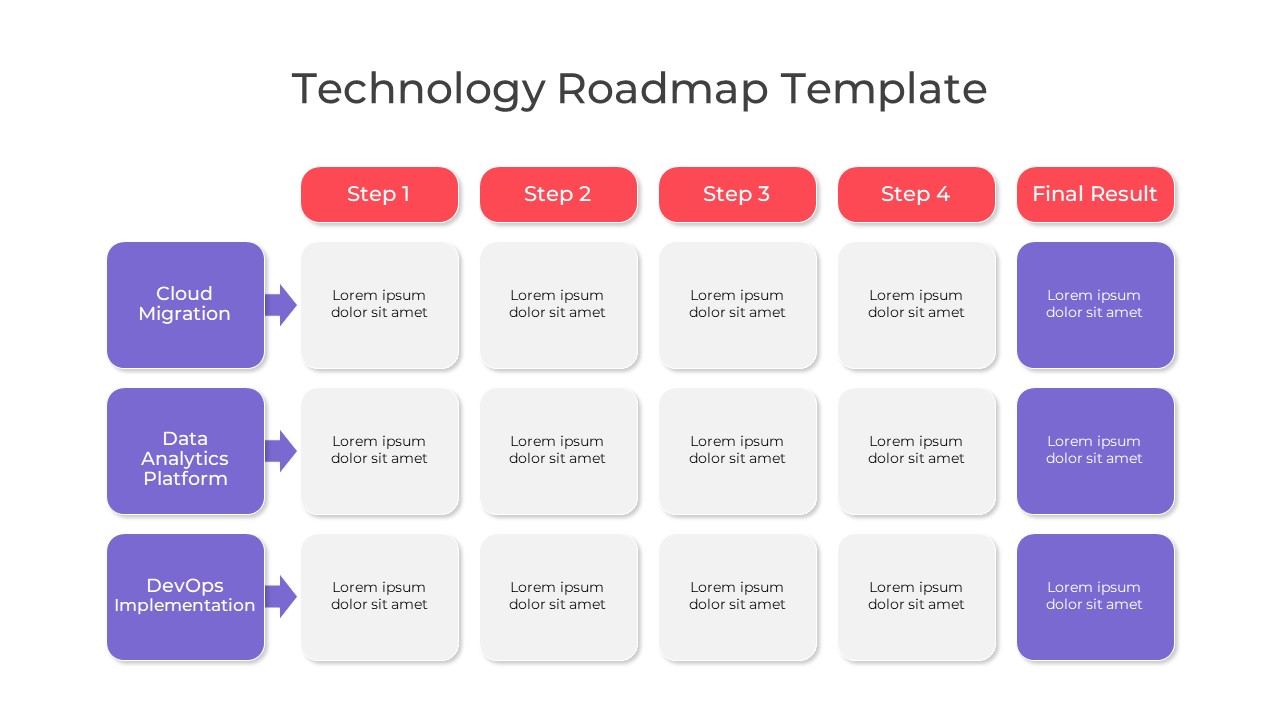
Multi-Color Technology Roadmap Template Pack for PowerPoint & Google Slides
Roadmap
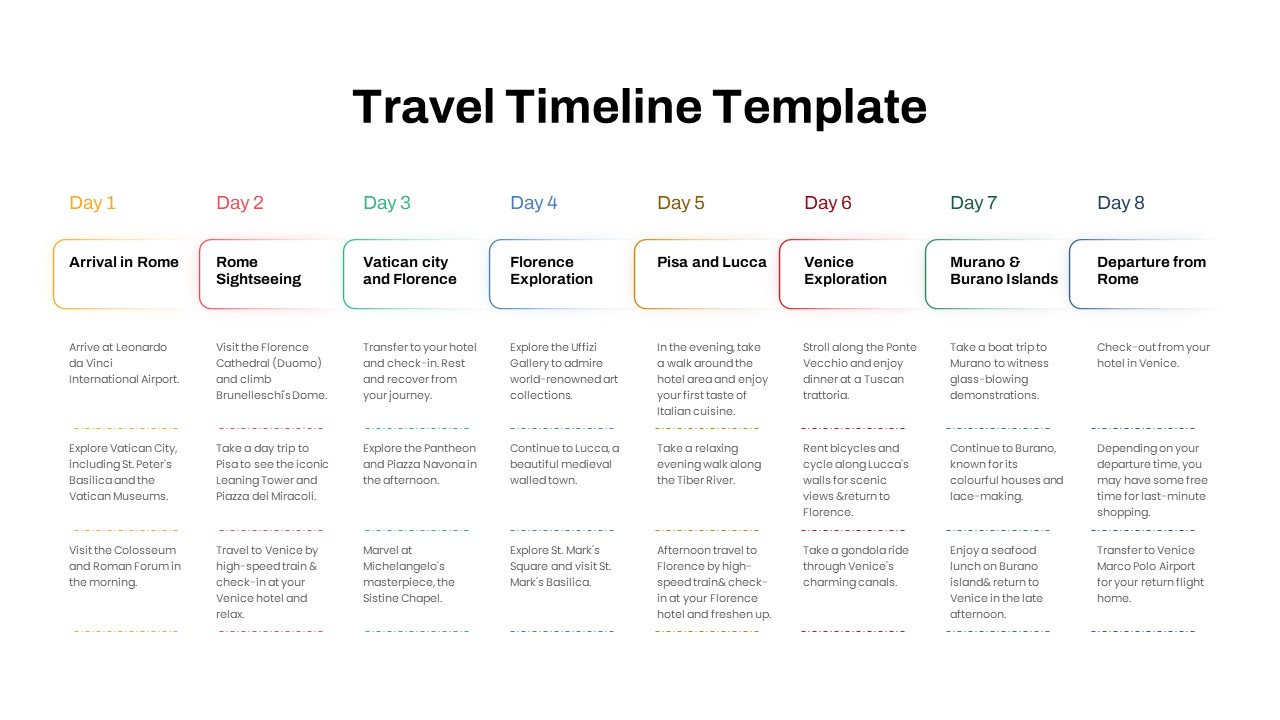
Free Elegant Multi-Day Travel Timeline Template for PowerPoint & Google Slides
Timeline
Free
Free Multi-Step Funnel Infographic Slide Pack Template for PowerPoint & Google Slides
Funnel
Free
Free Table Of Contents PowerPoint Slides Template
Agenda
Free
Colorful Multi-Branch Mind Map Slide Template for PowerPoint & Google Slides
Mind Maps
Multi-color Curved Timeline Roadmap Template for PowerPoint & Google Slides
Timeline
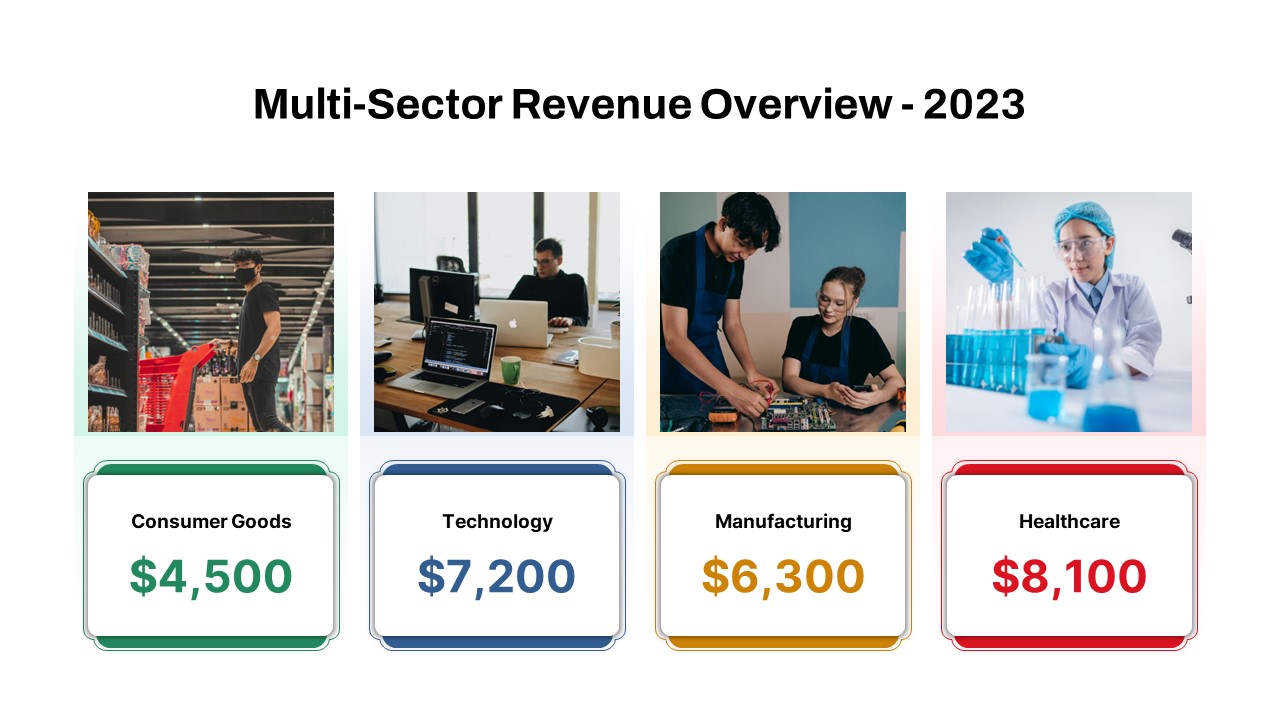
Multi-Sector Revenue Breakdown Cards Template for PowerPoint & Google Slides
Comparison
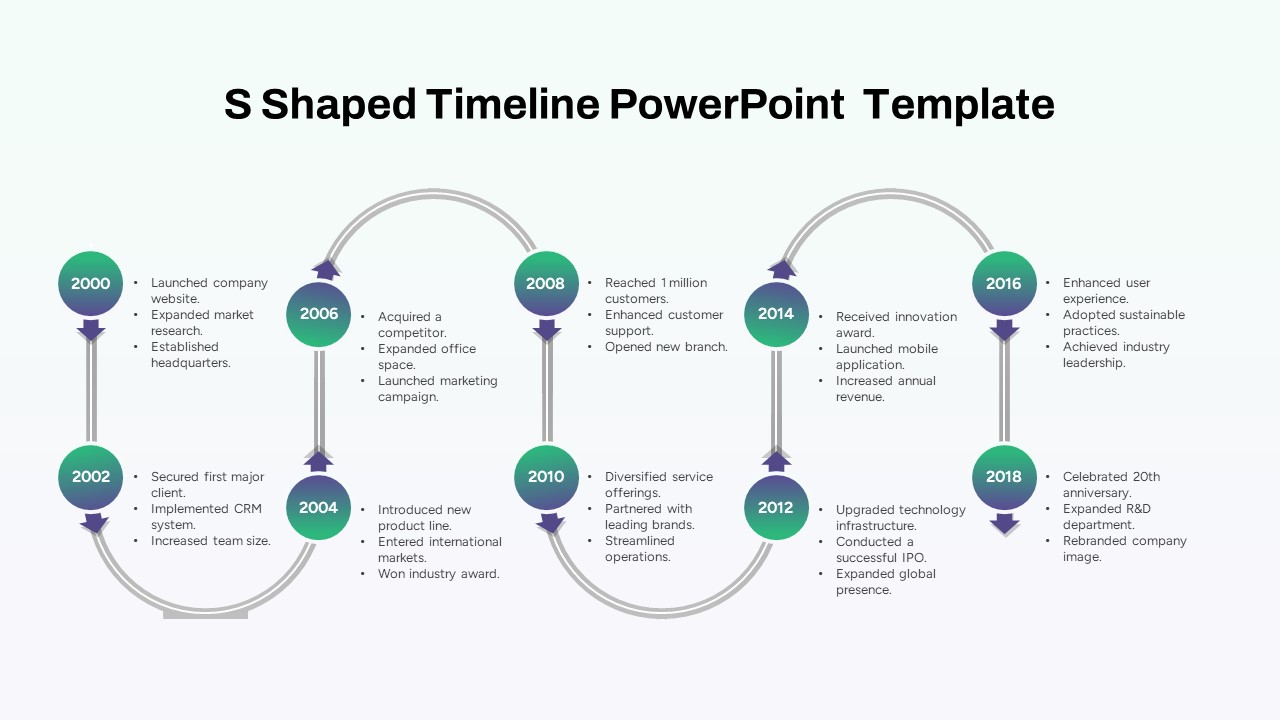
Multi-Year S-Shaped Roadmap Timeline Template for PowerPoint & Google Slides
Timeline
Multi-Style Board of Directors Profile Template for PowerPoint & Google Slides
Our Team
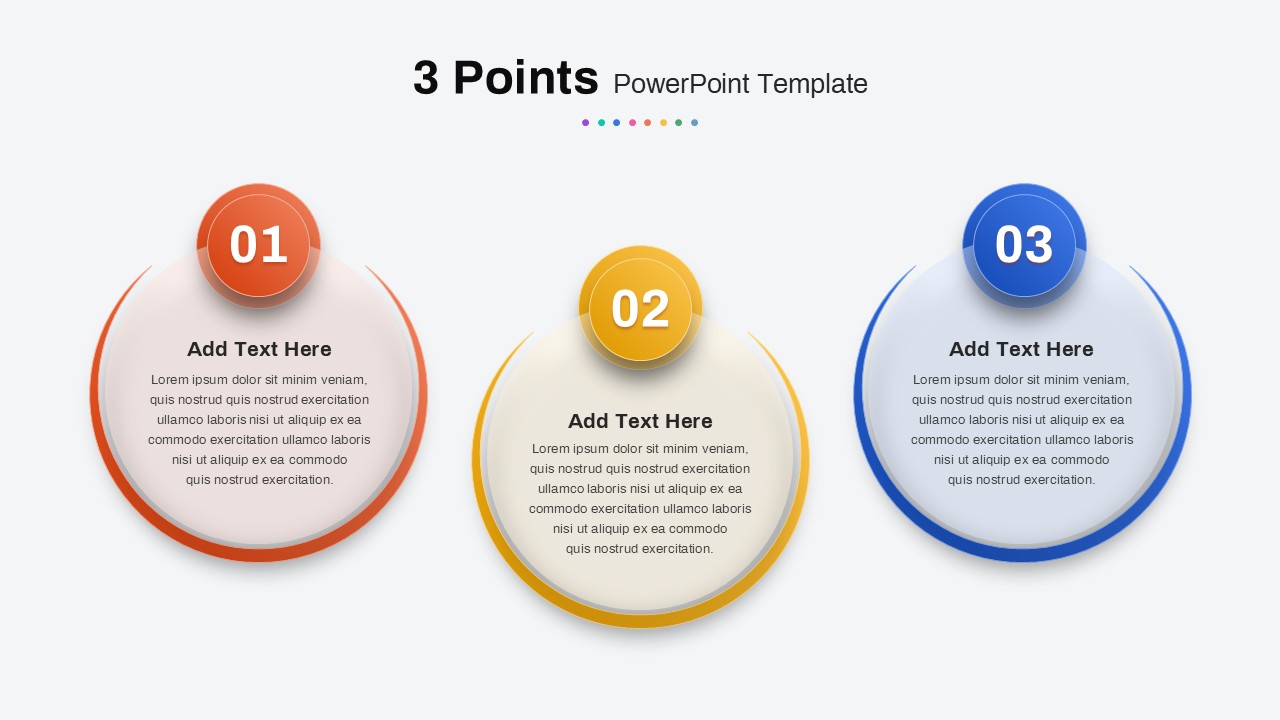
Multi-Point Diagram Presentation Template for PowerPoint & Google Slides
Process
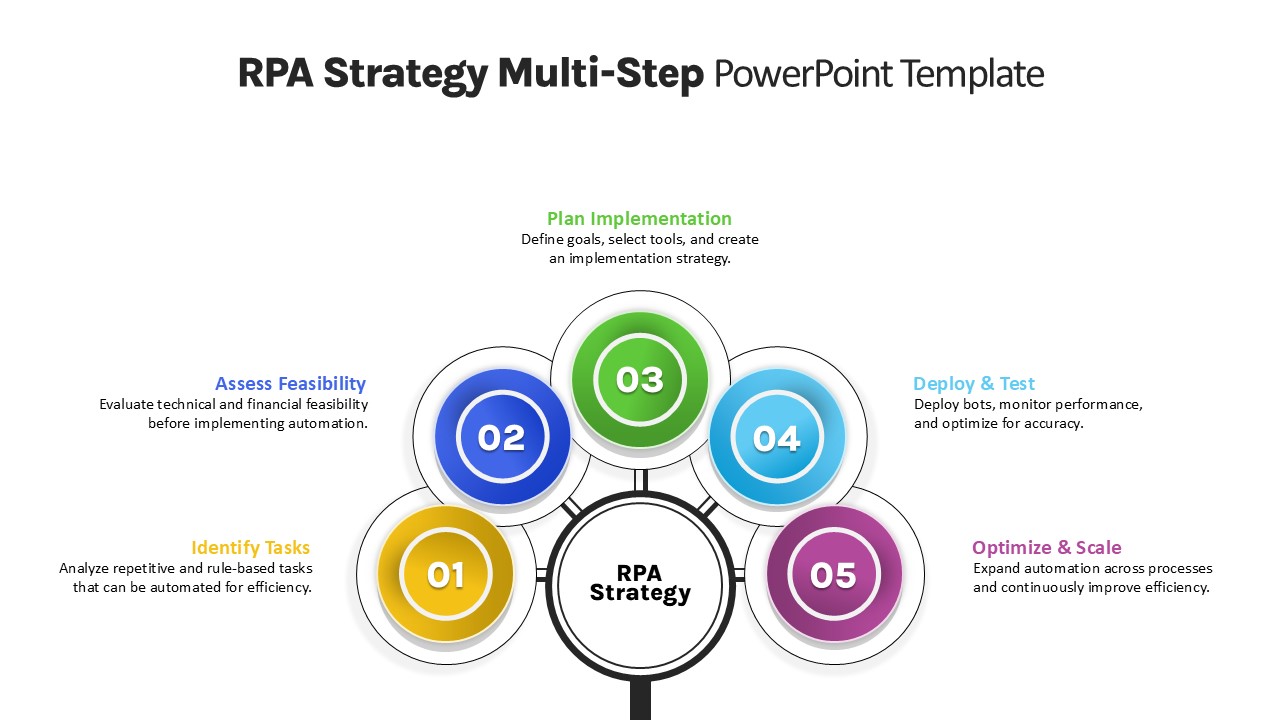
RPA Strategy Multi-Step Diagram Template for PowerPoint & Google Slides
Process
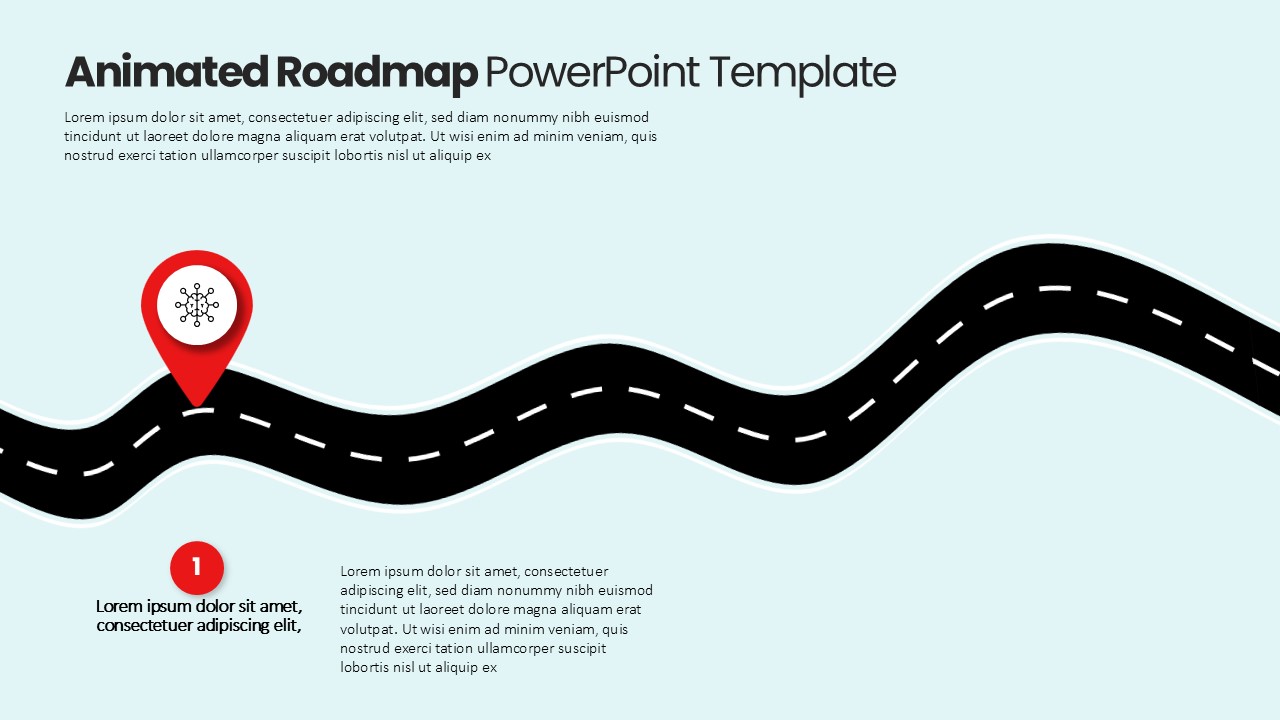
Animated Multi-Milestone Roadmap Template for PowerPoint & Google Slides
Roadmap
Multi-Column Table Presentation Template for PowerPoint & Google Slides
Table
Six-Row Multi-Column Table Presentation Template for PowerPoint & Google Slides
Table
Multi Color SWOT Analysis Quadrant Template for PowerPoint & Google Slides
SWOT
Quad Chart Infographic Pack of 8 Slides Template for PowerPoint & Google Slides
Comparison Chart
Free Professional Gantt Chart Pack – 4 Slides Template for PowerPoint & Google Slides
Gantt Chart
Free
Circle Strategy Creative Chart for PowerPoint
Business Strategy
Four Square Chart template for PowerPoint & Google Slides
Charts
Creative SWOT Chart template for PowerPoint & Google Slides
SWOT
Donut Chart template for PowerPoint & Google Slides
Pie/Donut
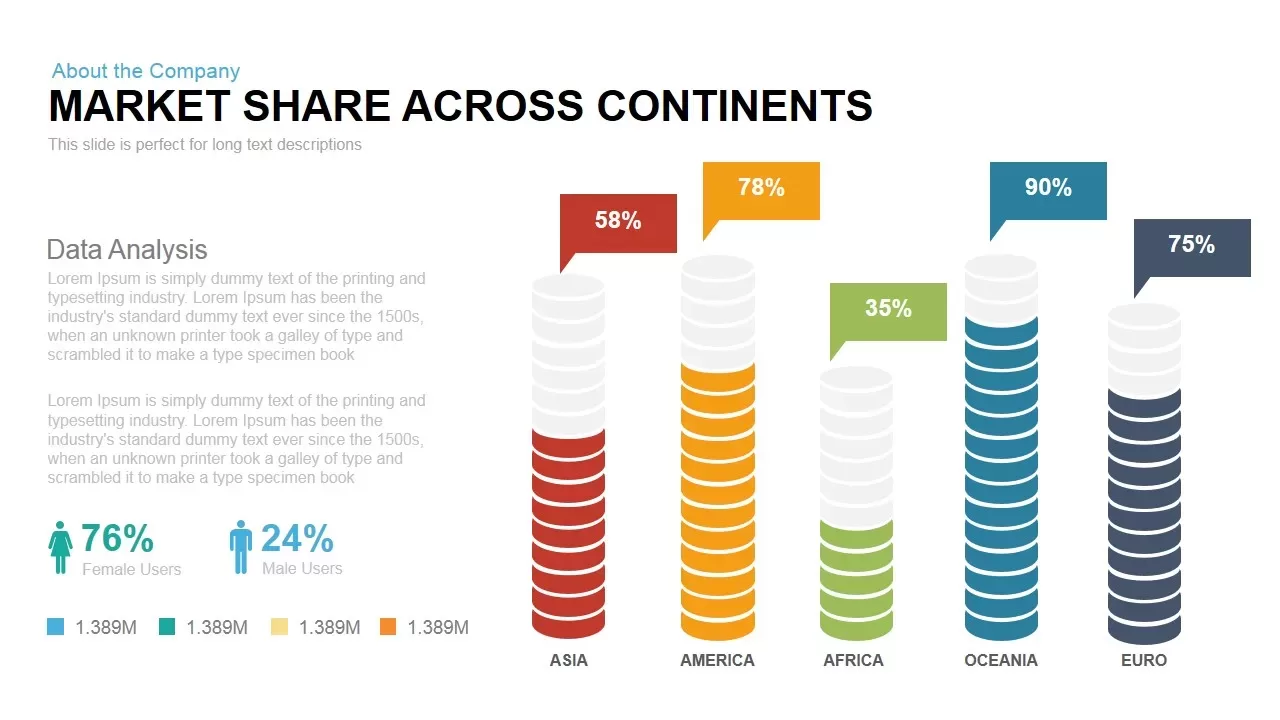
Global Market Share Cylinder Chart Template for PowerPoint & Google Slides
Bar/Column
Creative Dynamic Gantt Chart Timeline Template for PowerPoint & Google Slides
Timeline
Pencil Bar Chart Data Analysis Template for PowerPoint & Google Slides
Bar/Column
Corporate Org Chart template for PowerPoint & Google Slides
Org Chart

Fully Editable Gantt Chart Timeline template for PowerPoint & Google Slides
Gantt Chart
Five-Stage People Infographic Chart template for PowerPoint & Google Slides
Process
Interactive Product Comparison Bar Chart Template for PowerPoint & Google Slides
Bar/Column
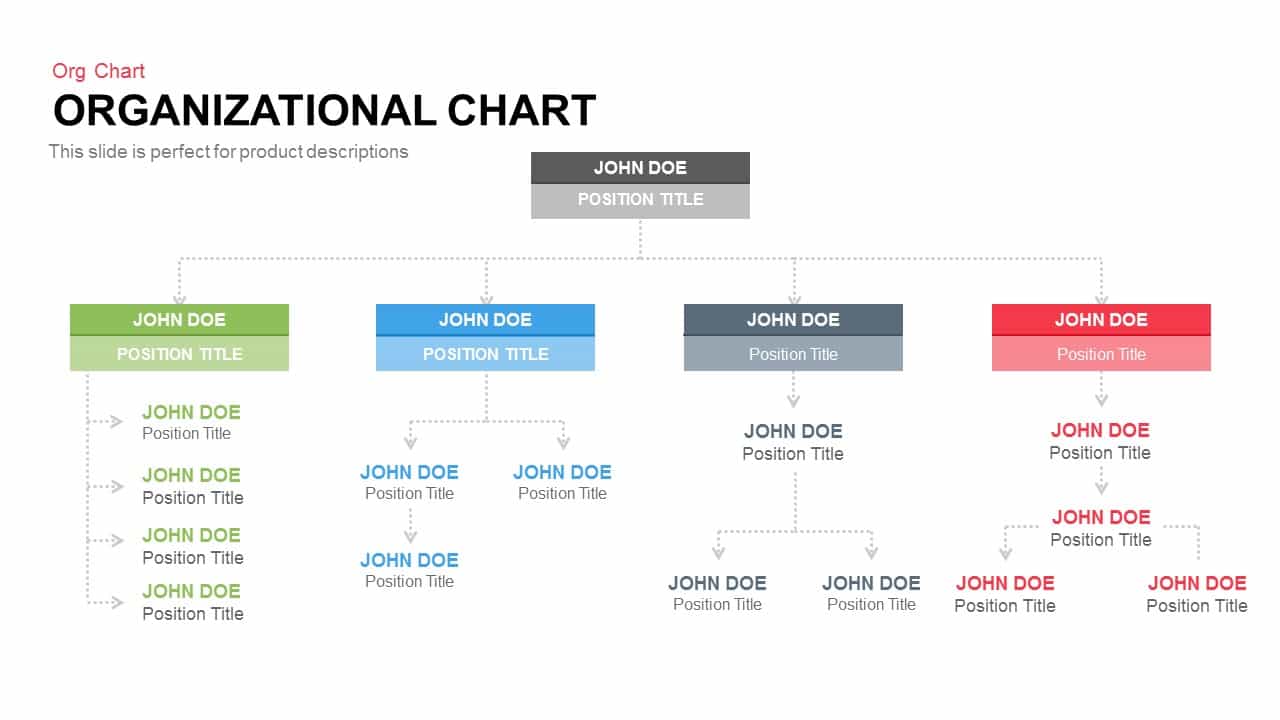
Organizational Chart Structure template for PowerPoint & Google Slides
Org Chart

Application Revenue Line Chart KPI Template for PowerPoint & Google Slides
Revenue
Tornado Chart Data Comparison Slide Template for PowerPoint & Google Slides
Bar/Column
Circular Org Chart in PowerPoint & Google Slides
Org Chart
Vertical Split Flow Chart Diagram Template for PowerPoint & Google Slides
Flow Charts
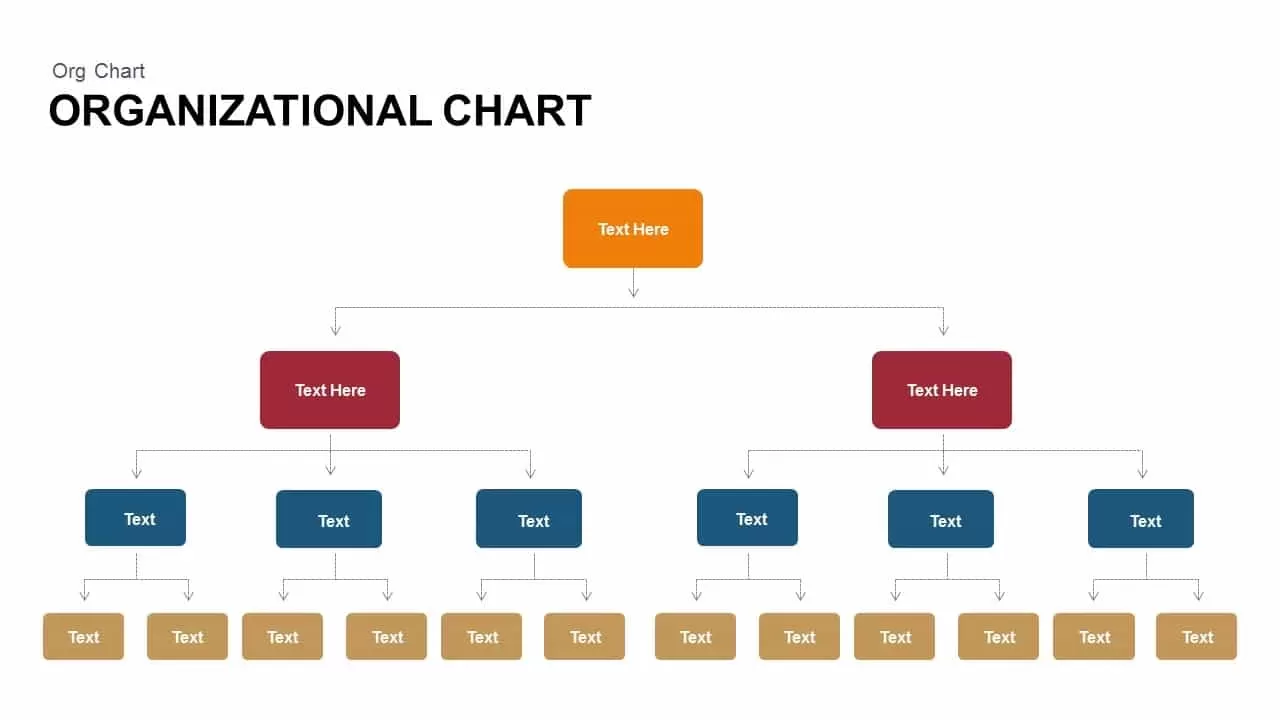
Org Chart Structure template for PowerPoint & Google Slides
Org Chart
Interactive Project Gantt Chart Timeline Template for PowerPoint & Google Slides
Gantt Chart
Dynamic Benchmarking Comparison Chart Template for PowerPoint & Google Slides
Comparison Chart
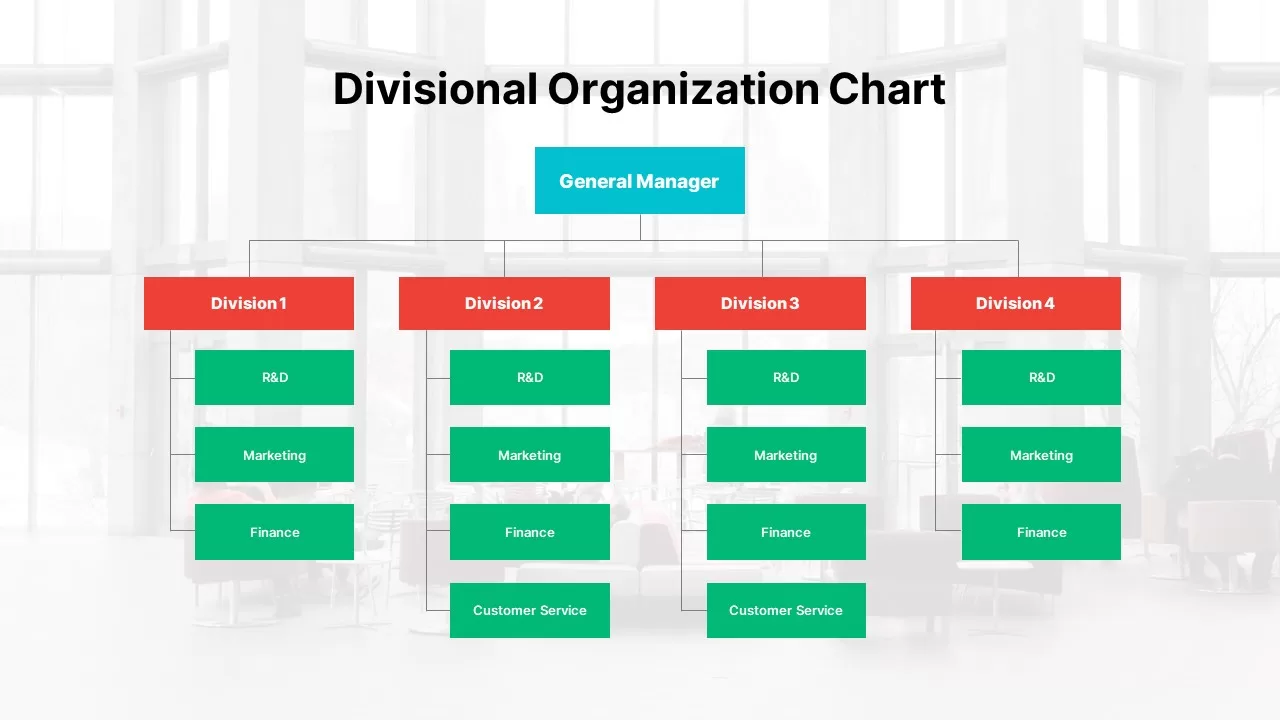
Modern Divisional Organization Chart Template for PowerPoint & Google Slides
Org Chart
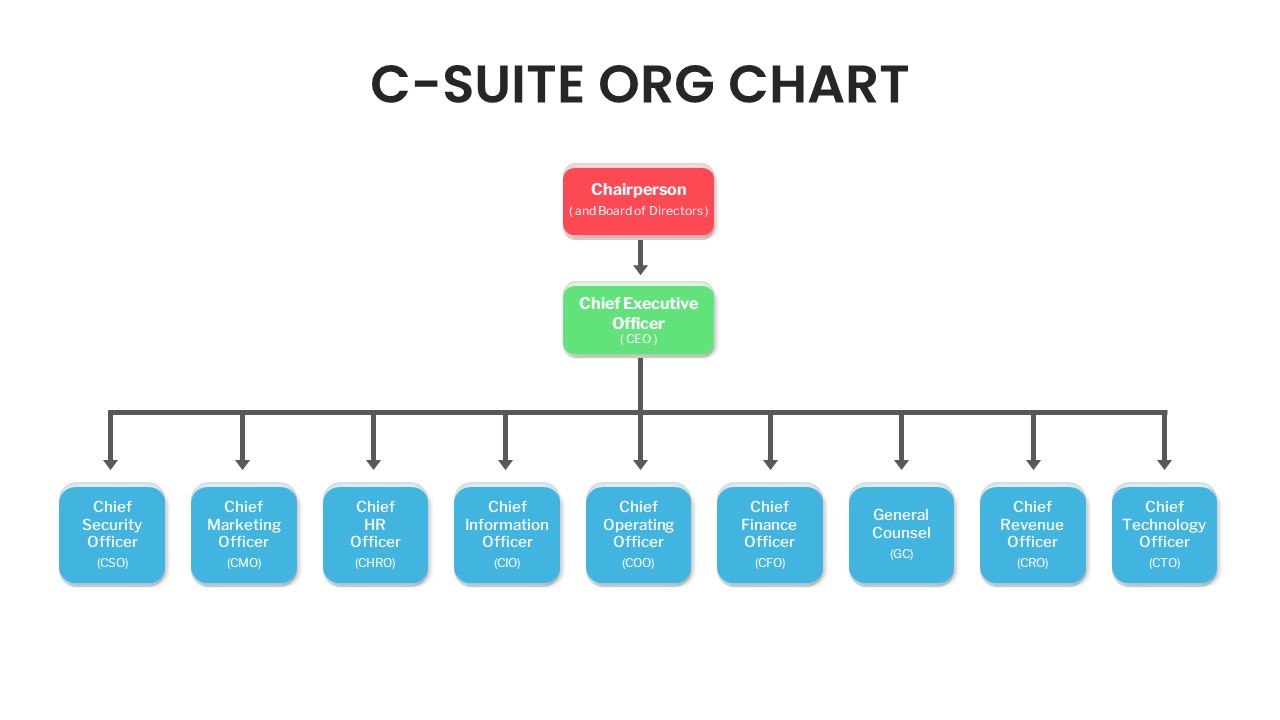
C-Suite Executive Org Chart Diagram Template for PowerPoint & Google Slides
Org Chart
Timeline Comparison Slide PowerPoint Template
Comparison Chart
Grouped Column Chart Comparison Template for PowerPoint & Google Slides
Bar/Column
Multiple Line Chart Comparison Template for PowerPoint & Google Slides
Comparison Chart
Five-Phase and Three-Phase Phases Chart Template for PowerPoint & Google Slides
Charts
Excel-Driven Gradient Timeline Chart Template for PowerPoint & Google Slides
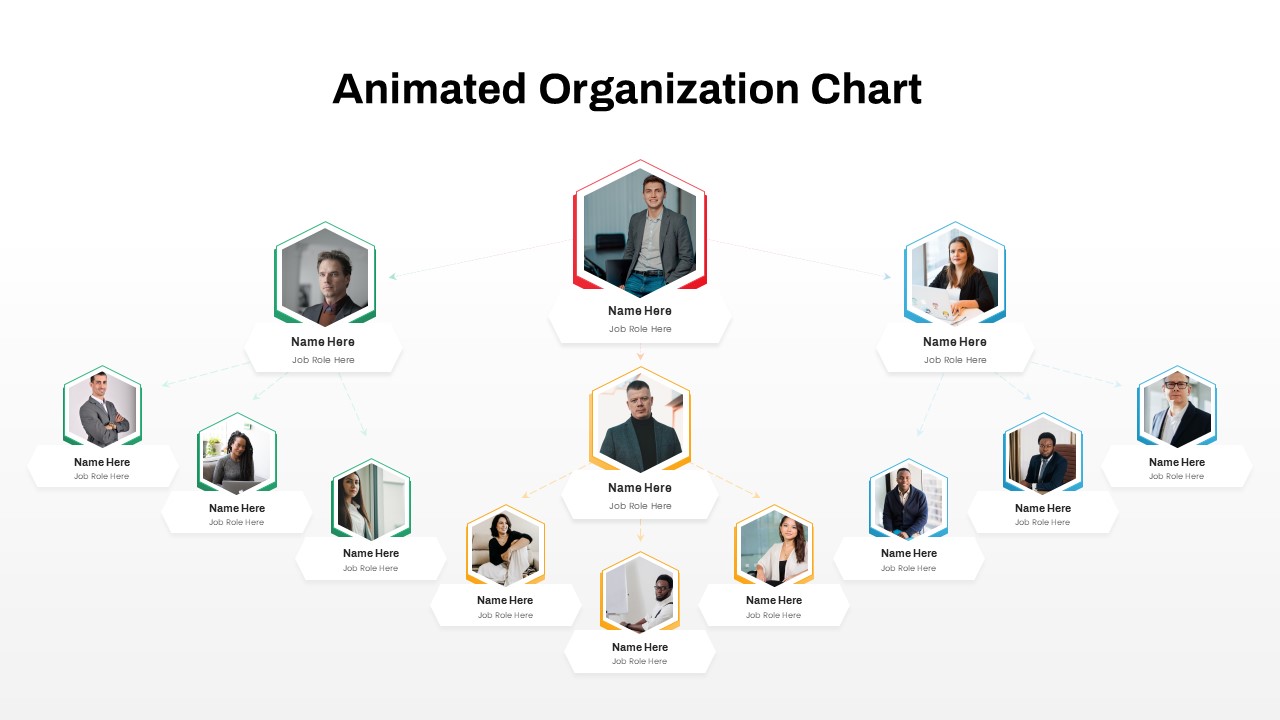
Animated Hexagon Org Chart Diagram Template for PowerPoint & Google Slides
Org Chart
Multipurpose Spline Chart Data Trend Template for PowerPoint & Google Slides
Bar/Column
Professional HR Organization Chart Template for PowerPoint & Google Slides
Org Chart
Bubble Chart Scatter, Diagram & Matrix Template for PowerPoint & Google Slides
Comparison Chart
Two-Option Bar Chart Comparison Table Template for PowerPoint & Google Slides
Comparison
Quarterly Gantt Chart with Today Marker Template for PowerPoint & Google Slides
Gantt Chart