Bass Diffusion Model Curve for Adoption Template for PowerPoint & Google Slides
Description
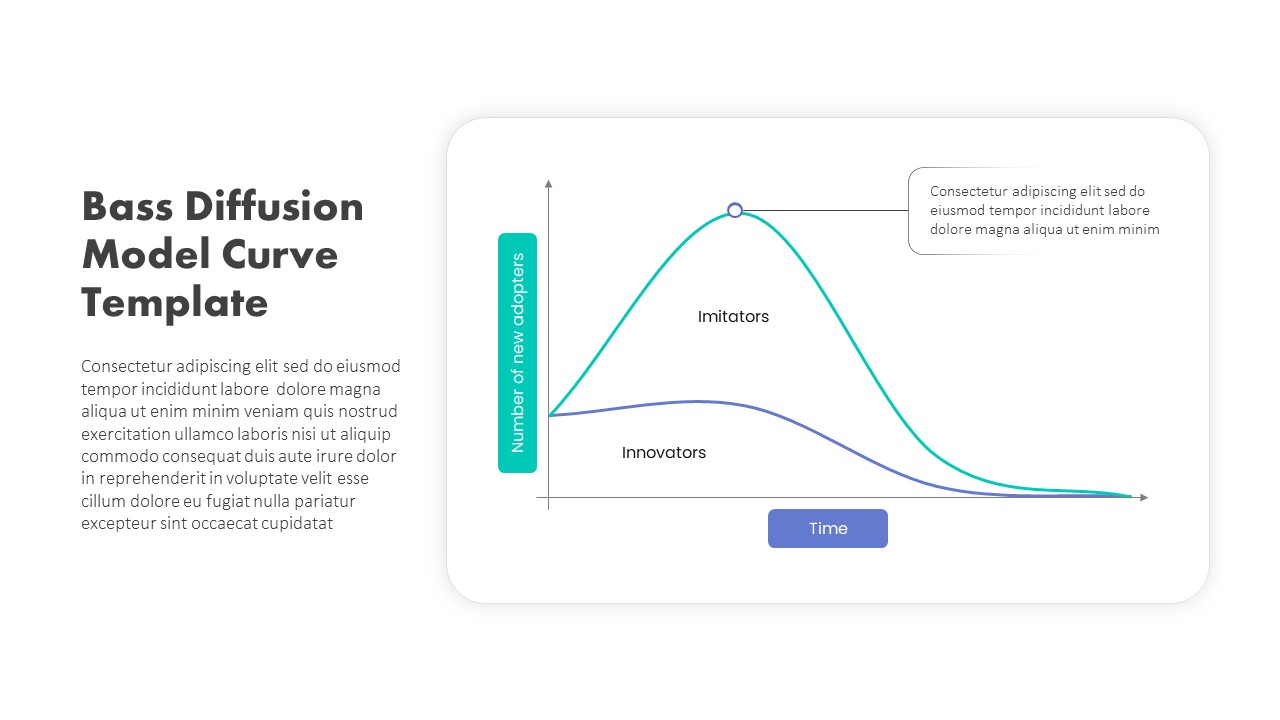
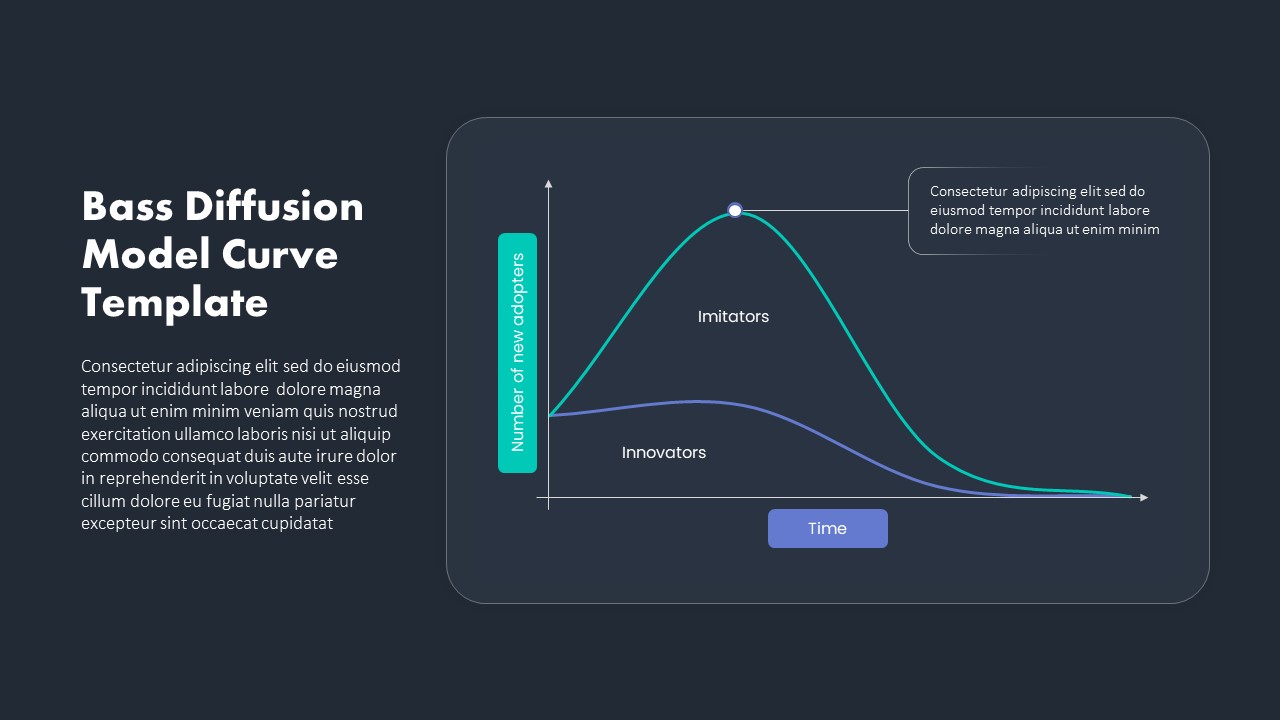
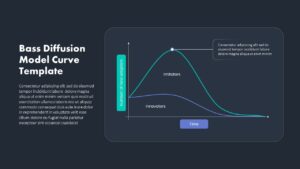
Harness the Bass Diffusion Model with this professionally designed slide that visualizes the rate of adoption by innovators and imitators over time. A bold peak marks the imitators’ tipping point while a subtle curve tracks early innovators, allowing audiences to quickly grasp diffusion dynamics at a glance. The chart features a clean white canvas, rounded container edges, and customizable axes labels (“Number of new adopters” and “Time”) in modern sans-serif typography. Distinct hues—turquoise for imitators and deep blue for innovators—ensure clear contrast, while a sleek callout box highlights critical data points or project milestones. Ample left-hand space accommodates a descriptive headline and supporting text block, enabling you to frame your narrative and provide context. Fully editable chart elements, intuitive placeholders, and master slide compatibility let you adapt color schemes, adjust data points, or insert custom icons and annotations in seconds.
Engineered for seamless integration into PowerPoint and Google Slides, this slide balances data-driven storytelling with a minimalist aesthetic. Rounded corners, subtle drop shadows, and consistent grid alignment deliver a polished, professional look that aligns with corporate branding or startup visuals. Whether mapping product launch trajectories, comparing market segments, or forecasting technology adoption, this asset streamlines preparation and enhances audience engagement.
Built on a flexible grid system, the slide ensures consistent spacing, alignment, and visual hierarchy across your presentation. Placeholder legend and axis labels can be repositioned or removed entirely, offering maximum flexibility for custom layouts. High-contrast color palettes and vector-based shapes guarantee crisp rendering at any screen resolution or print size. Access built-in animation triggers for progressive reveals, helping to guide audience focus through step-by-step diffusion analysis. Use the accompanying master slide library to maintain brand guidelines, incorporate your company logo, and standardize fonts across all diagrams.
Who is it for
Product managers, marketing teams, innovation strategists, business analysts, startup founders, and technology consultants will find this slide invaluable for illustrating adoption curves, driving data-driven discussions, and supporting strategic decisions around product rollouts and market entry plans.
Other Uses
Beyond product launch presentations, repurpose this slide for technology diffusion studies, user adoption forecasts, policy implementation timelines, change management workshops, investor pitch metrics, sales training modules, and academic lectures on marketing science.
Login to download this file

Item ID
SB03417
Related Templates

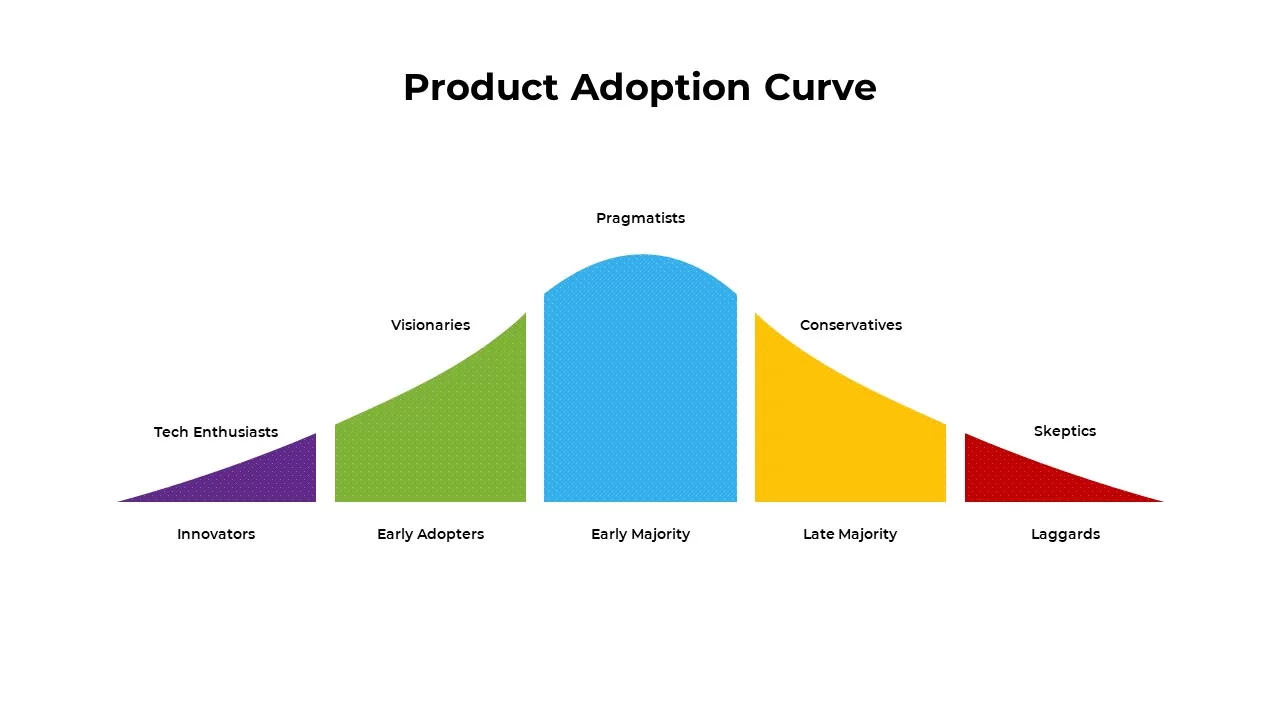
Product Adoption Curve Template for PowerPoint & Google Slides
Process
Gartner Hype Cycle Adoption Curve Diagram Template for PowerPoint & Google Slides
Infographics
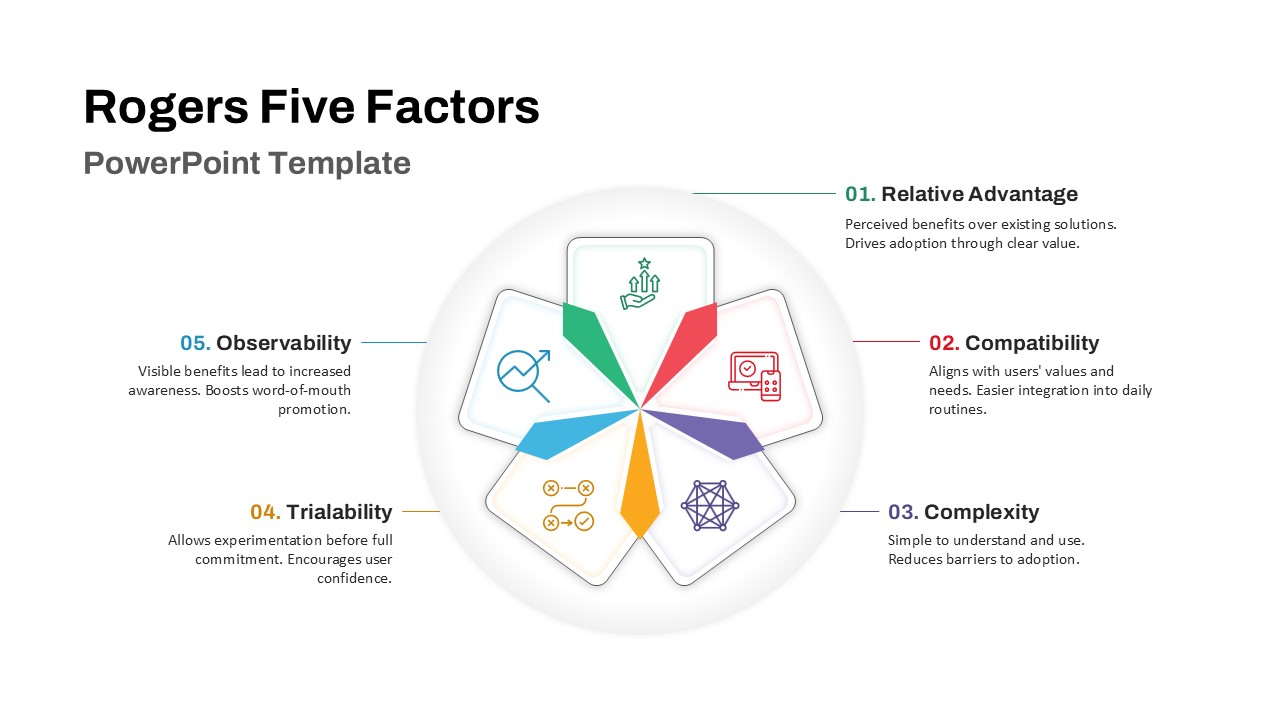
Rogers Five Factors Diffusion Innovation Template for PowerPoint & Google Slides
Process
Greiner’s Growth Model Curve template for PowerPoint & Google Slides
Infographics
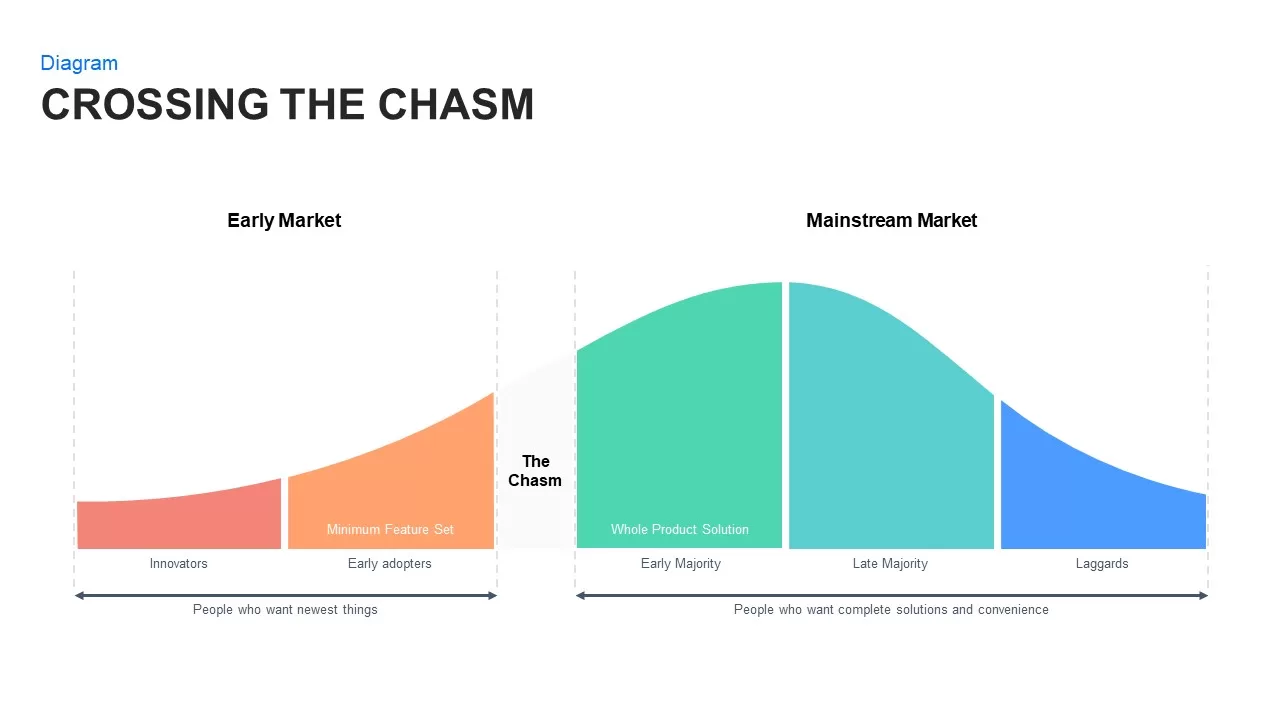
Crossing the Chasm: Technology Adoption Lifecycle template for PowerPoint & Google Slides
Business Strategy
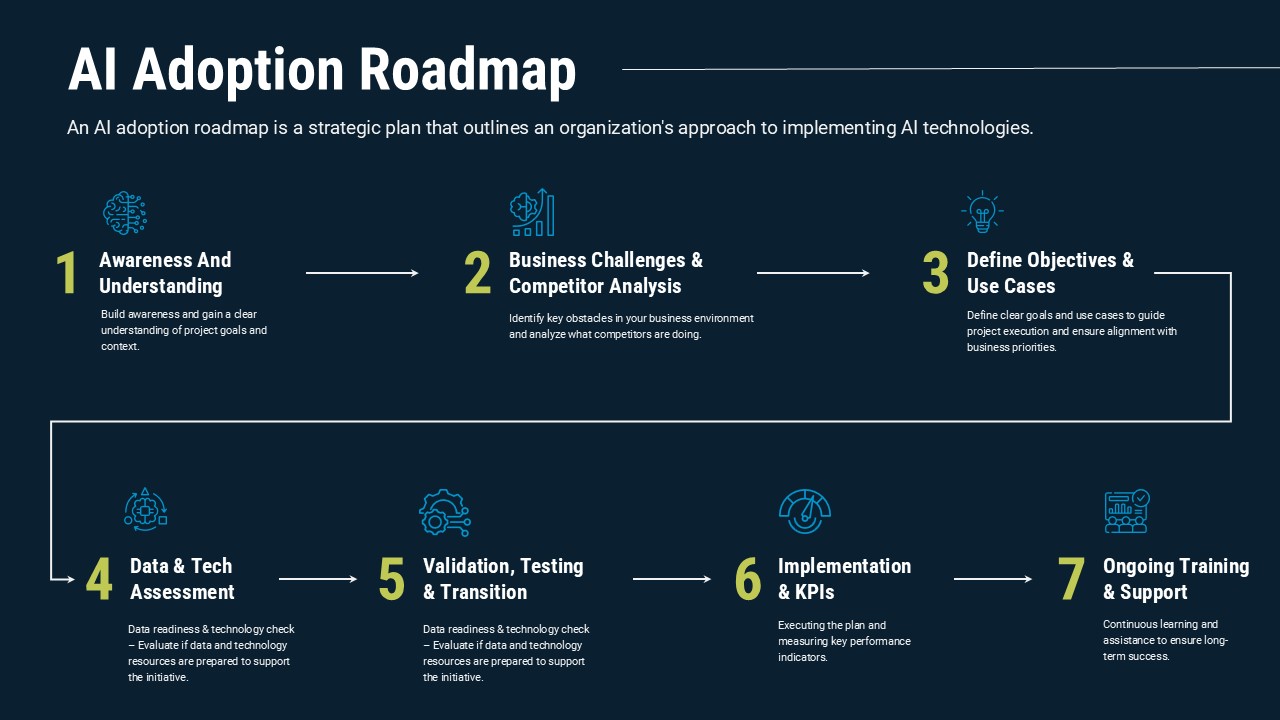
AI Adoption Roadmap template for PowerPoint & Google Slides
Technology
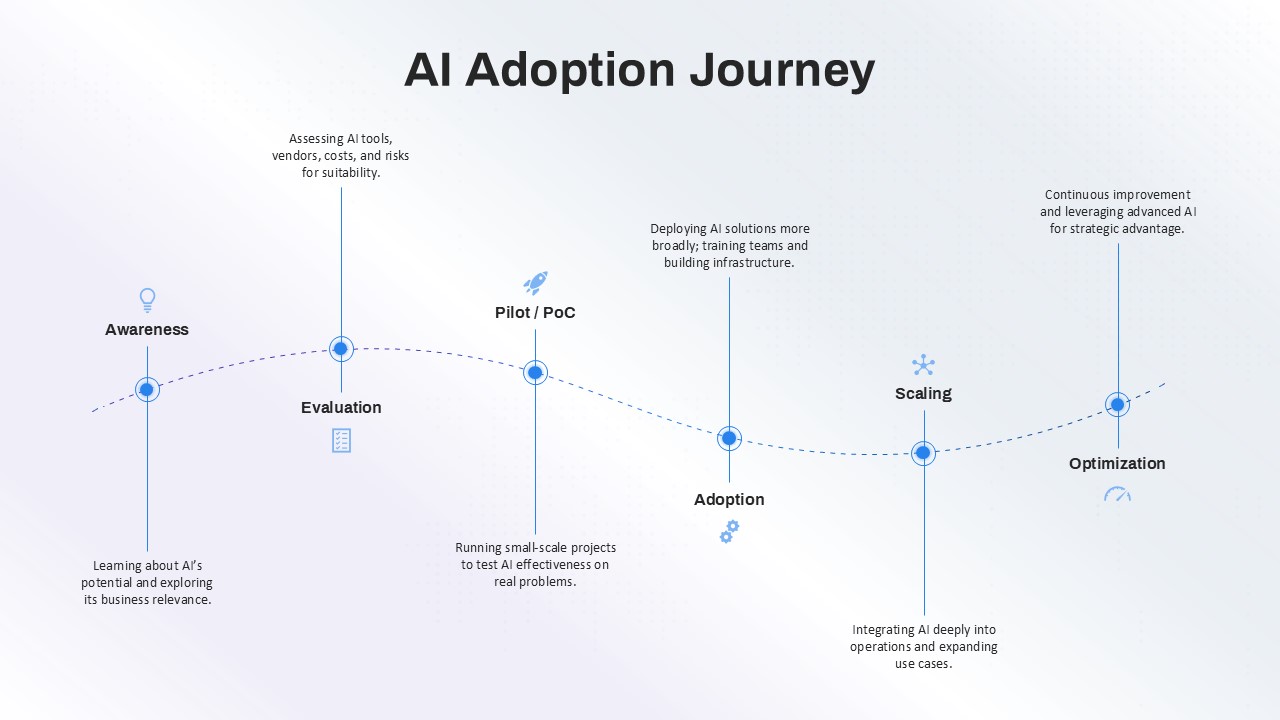
AI Adoption Journey template for PowerPoint & Google Slides
AI
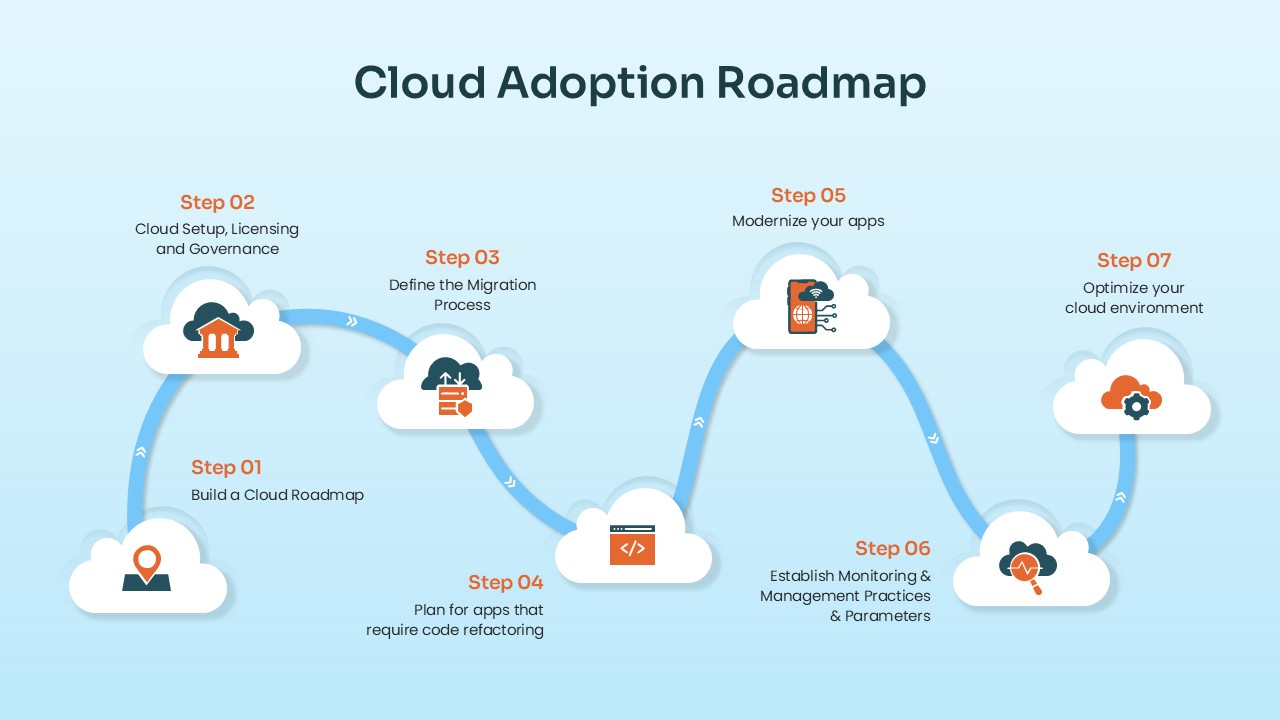
Cloud Adoption Roadmap Steps template for PowerPoint & Google Slides
Cloud Computing
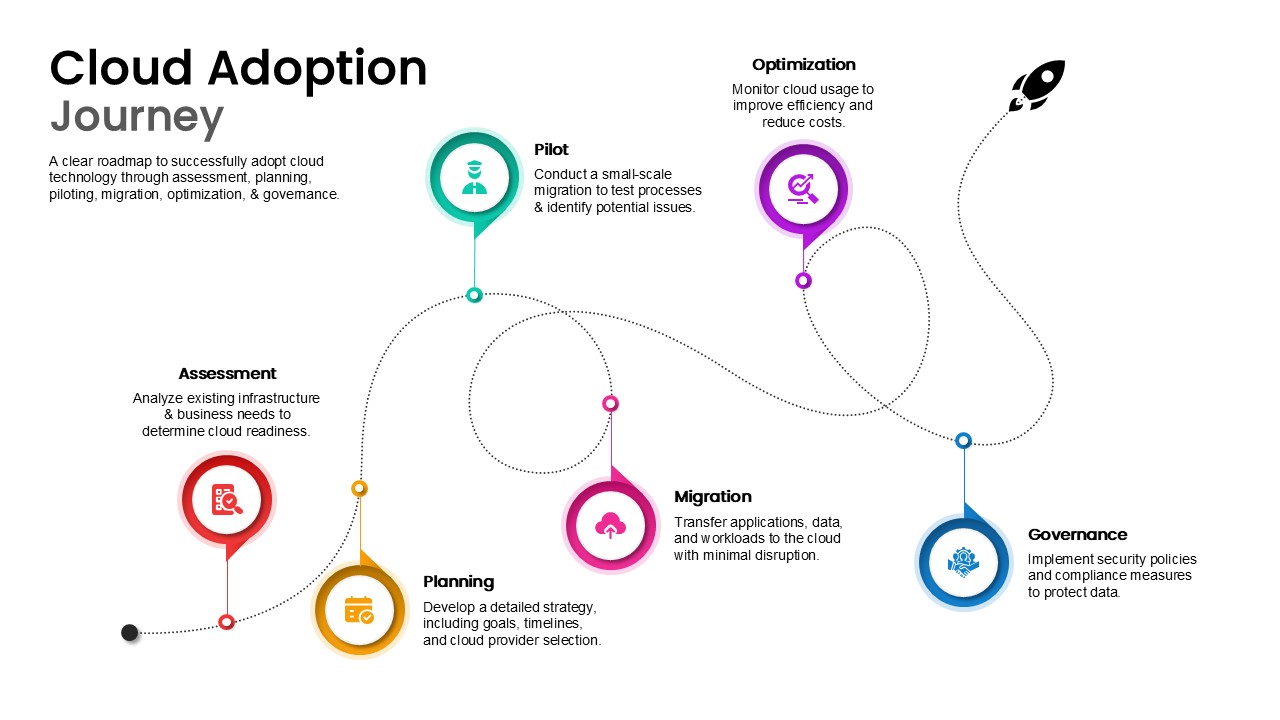
Cloud Adoption Journey Roadmap Template for PowerPoint & Google Slides
Cloud Computing
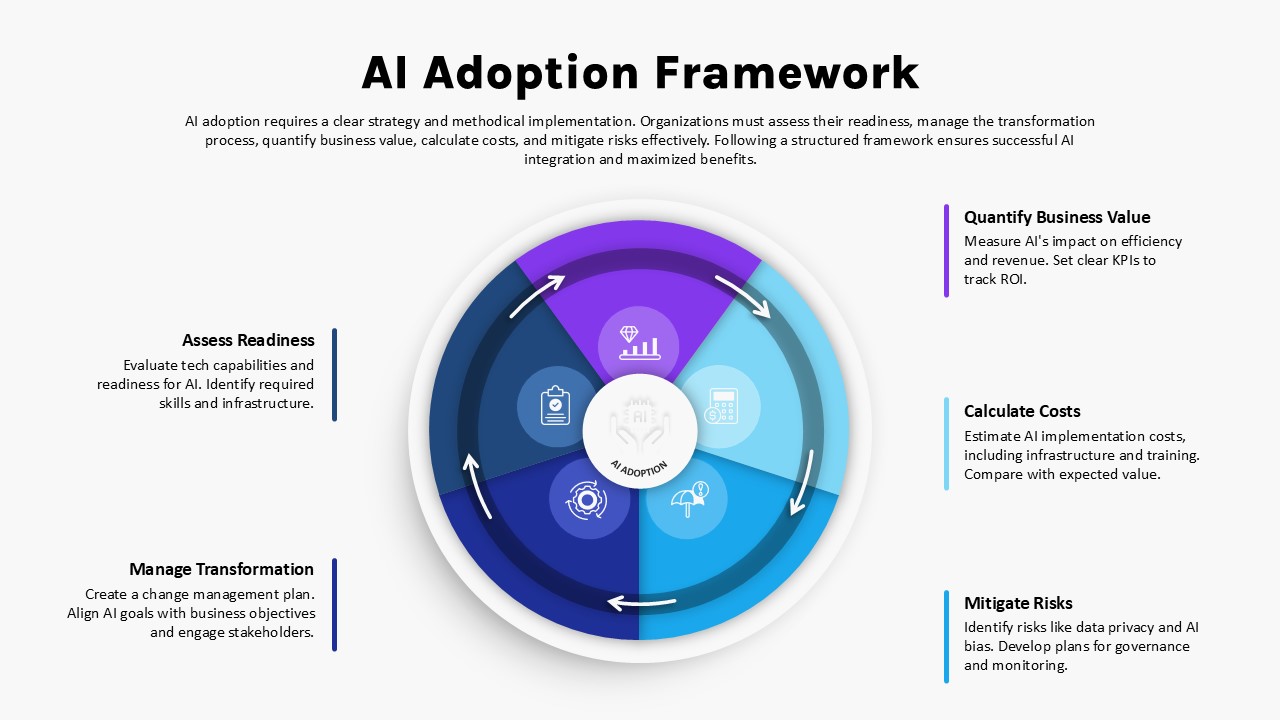
AI Adoption Framework Circular Diagram Template for PowerPoint & Google Slides
AI
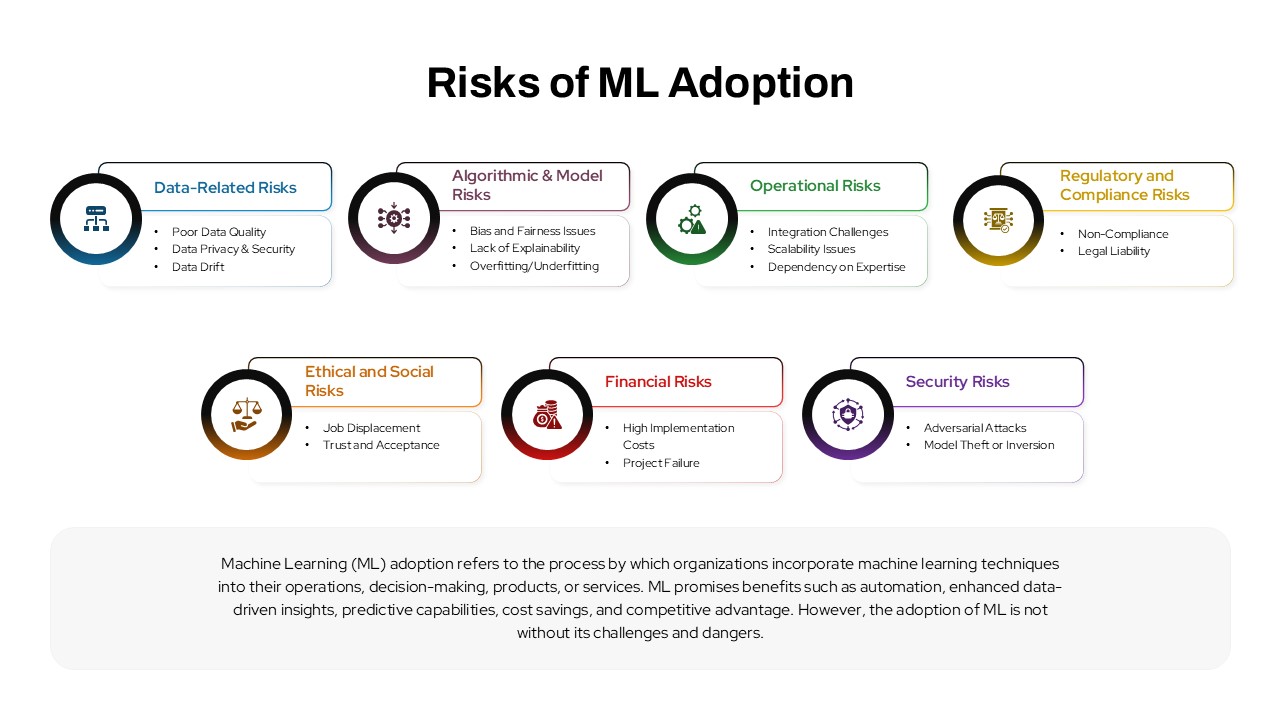
Risks of ML Adoption template for PowerPoint & Google Slides
Information Technology
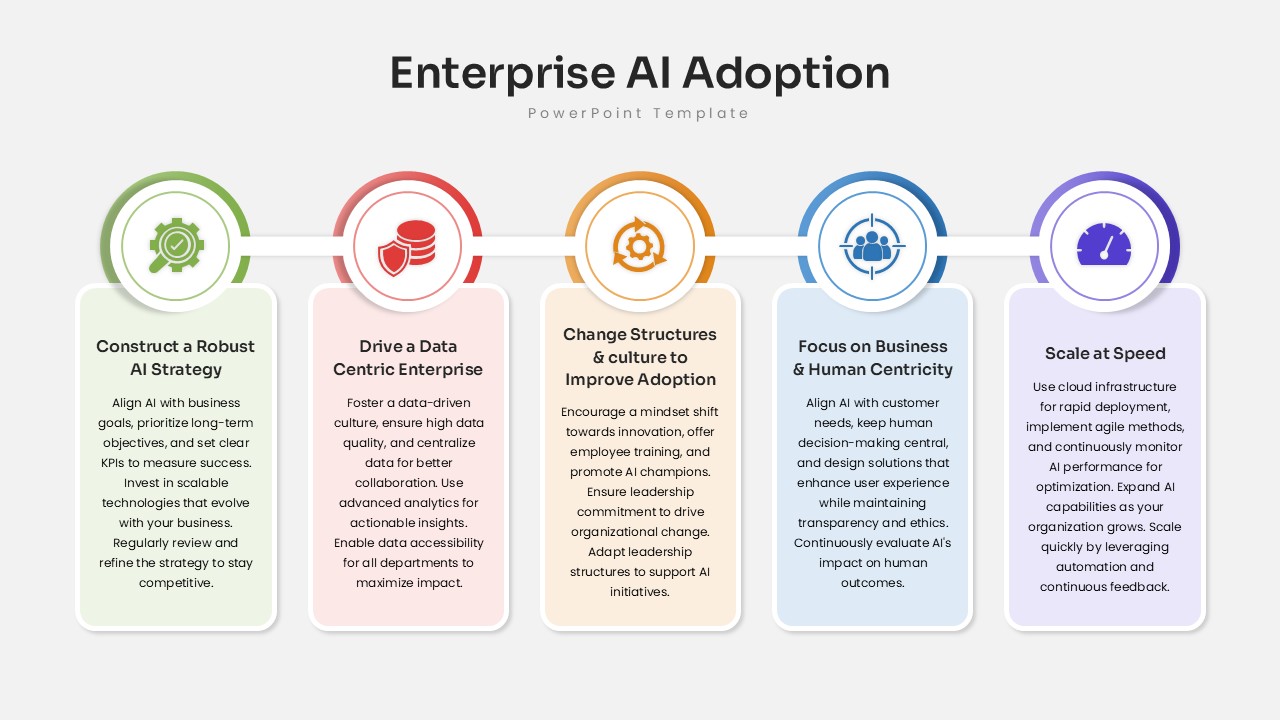
Enterprise AI Adoption Framework Template for PowerPoint & Google Slides
AI
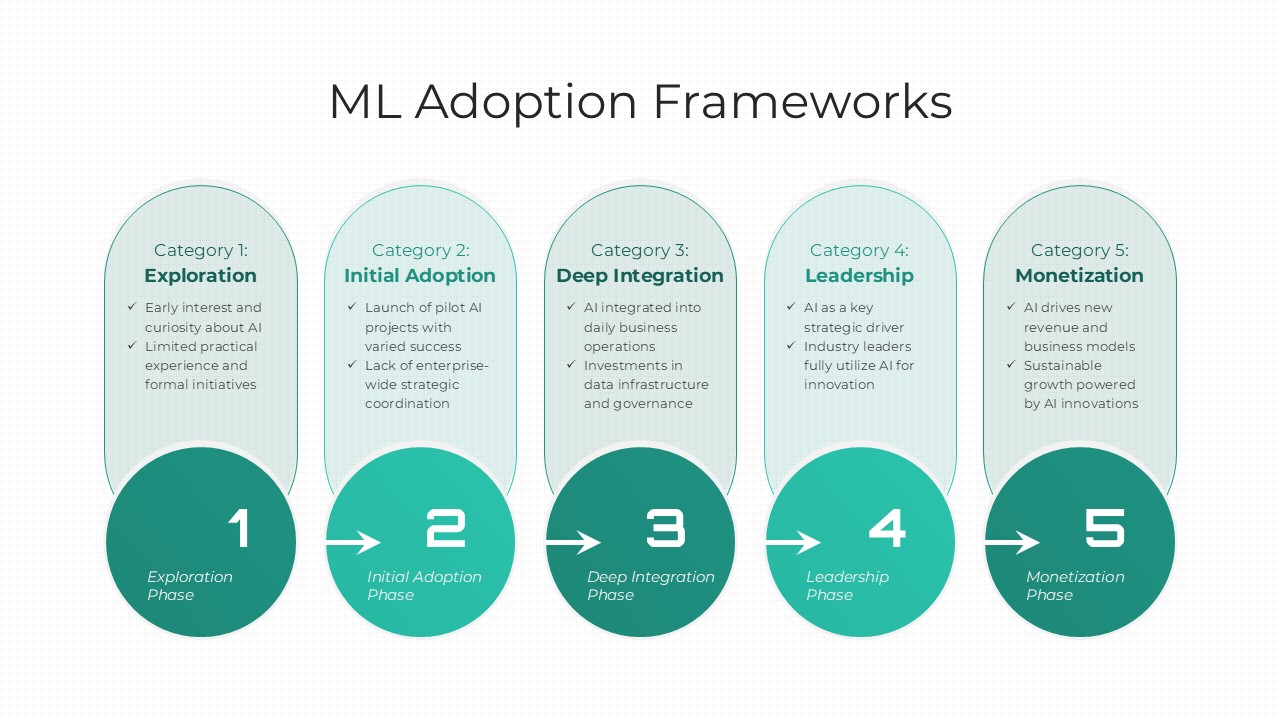
ML Adoption Framework template for PowerPoint & Google Slides
Technology
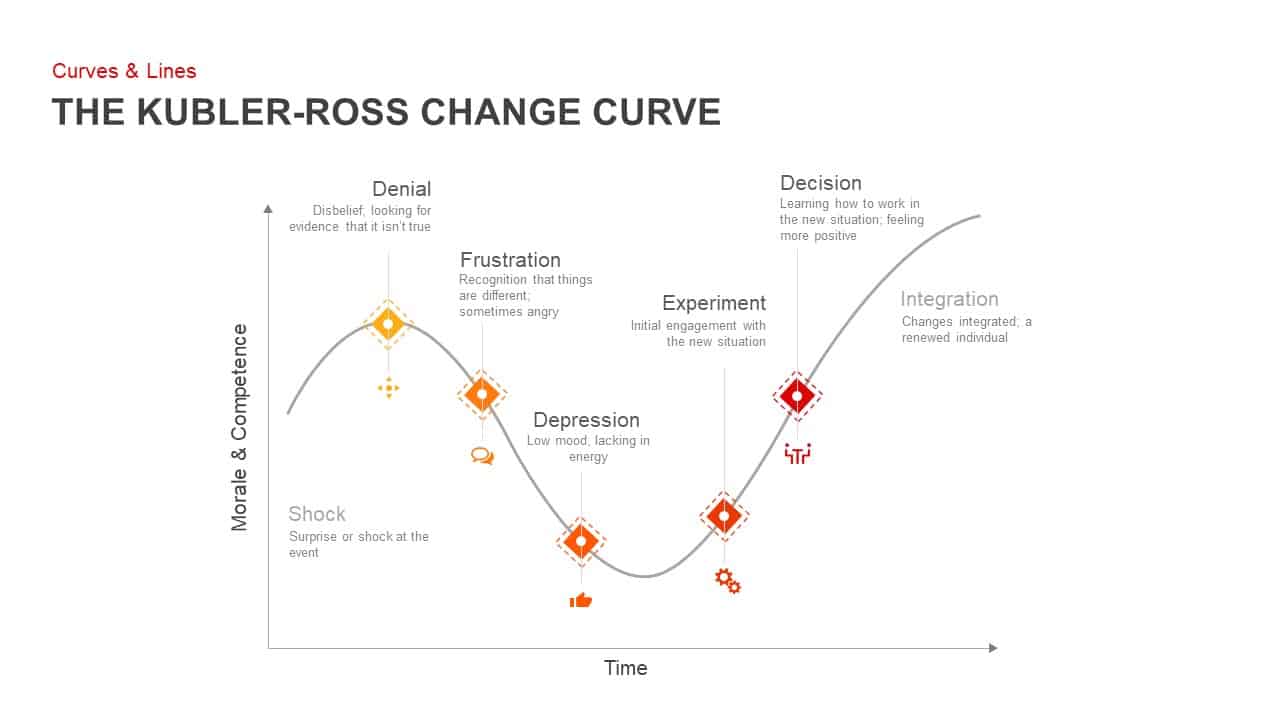
Kubler-Ross Change Curve Diagram Template for PowerPoint & Google Slides
Timeline
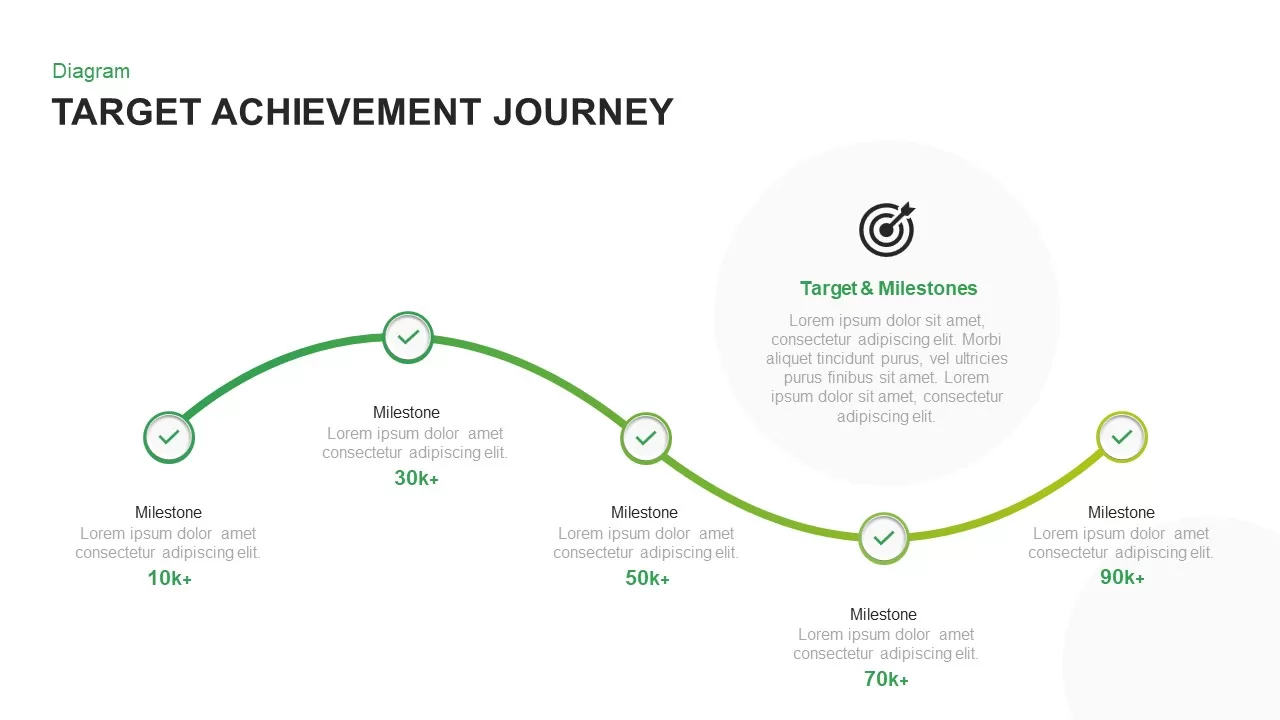
Target Achievement Milestone Curve Template for PowerPoint & Google Slides
Roadmap

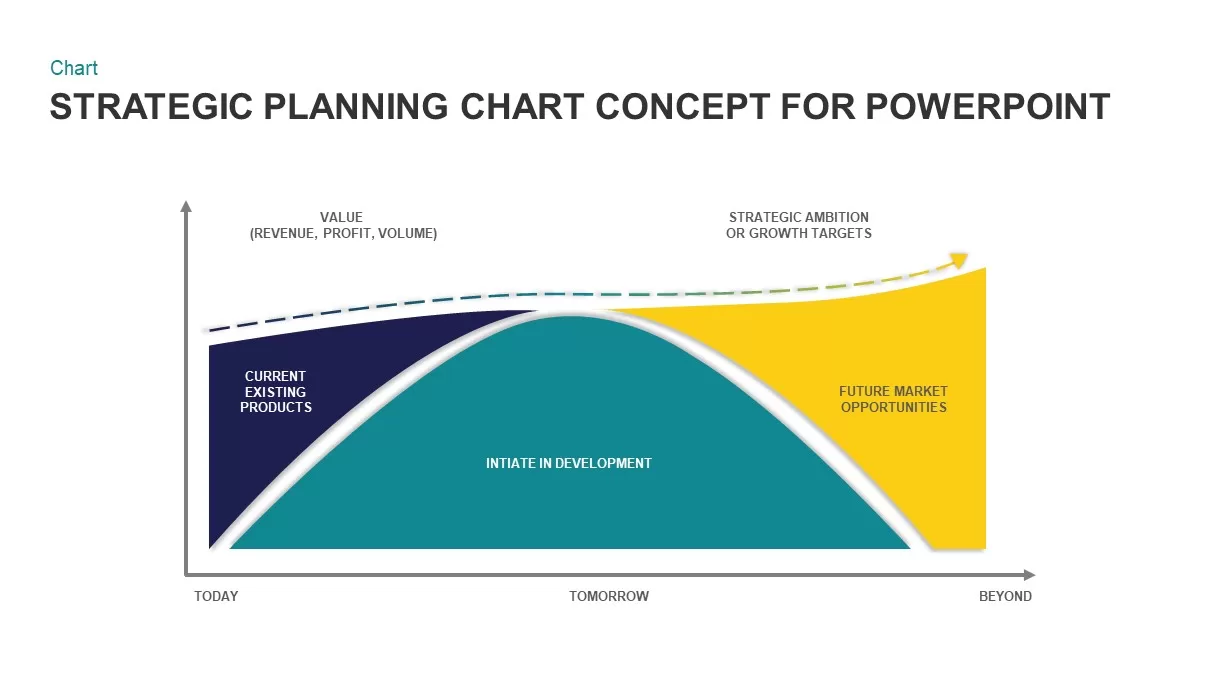
Strategic Planning Curve Diagram Template for PowerPoint & Google Slides
Charts
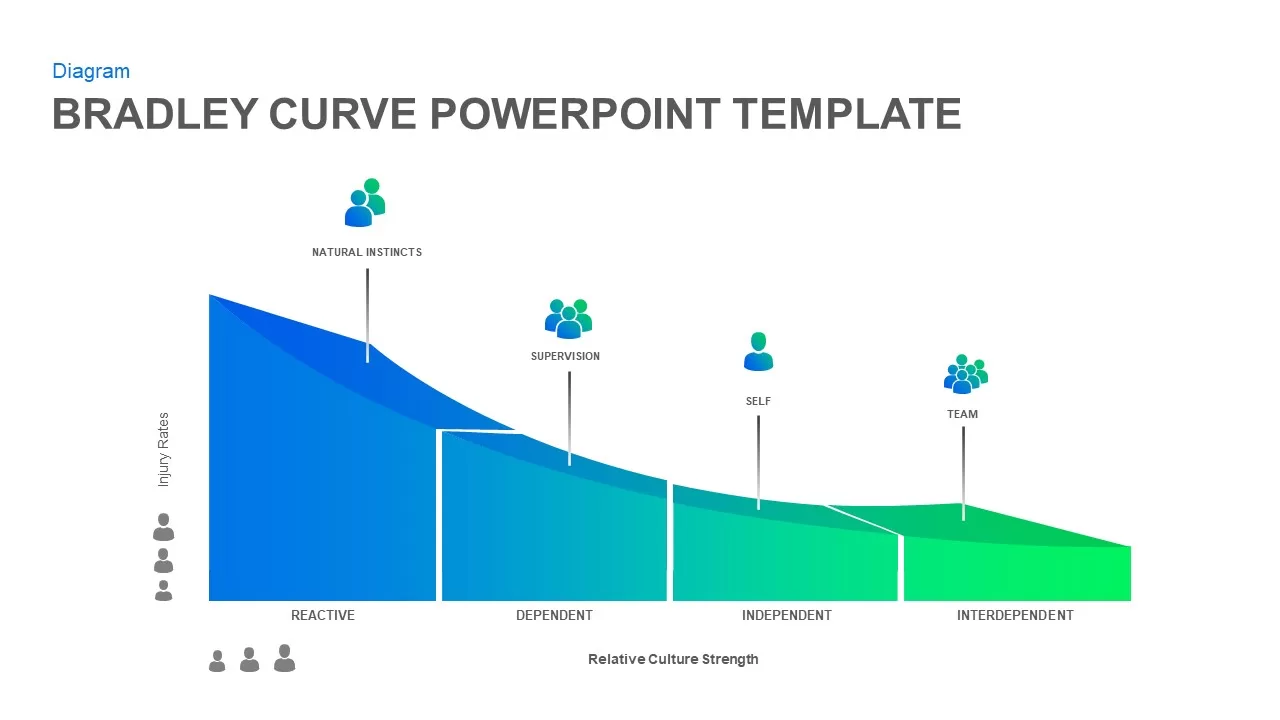
Bradley Curve Infographic Template for PowerPoint & Google Slides
Infographics
Snake Shaped Curve Diagram template for PowerPoint & Google Slides
Business
8-Bell Curve Infographic Slide Template for PowerPoint & Google Slides
Comparison Chart
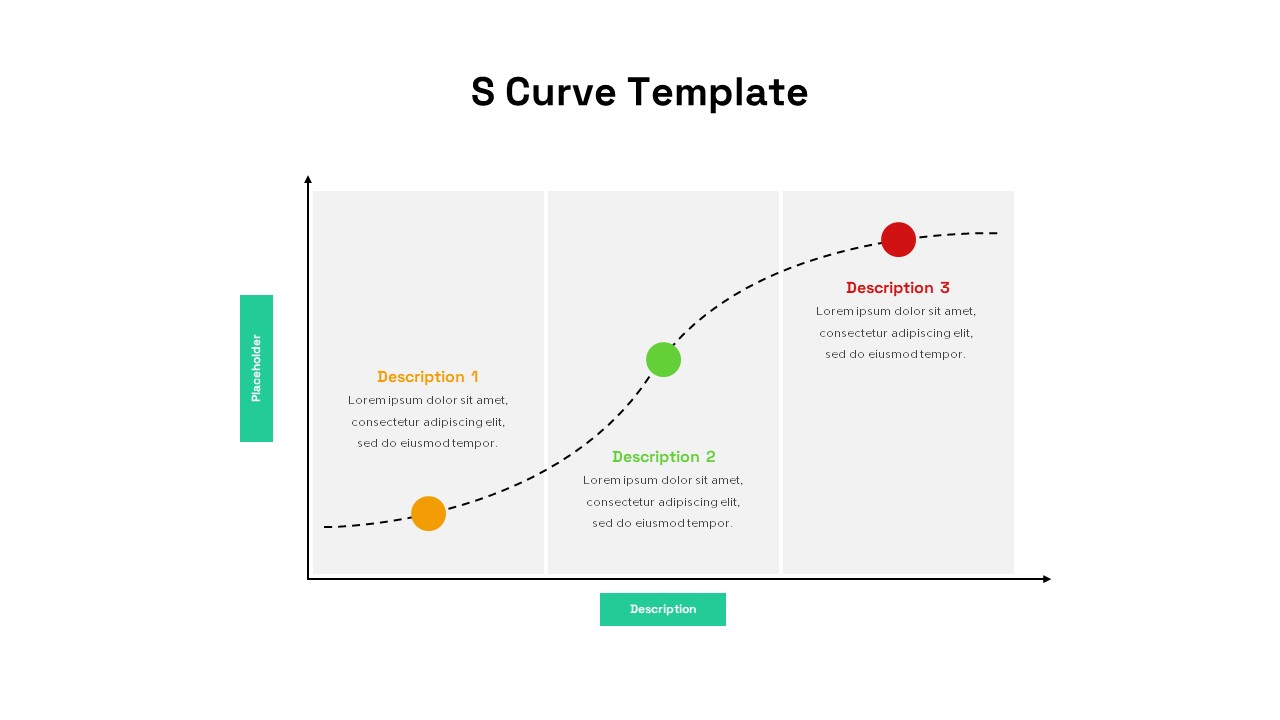
S-Curve Progression Framework Diagram Template for PowerPoint & Google Slides
Charts
Three-Stage S Curve Growth Diagram Template for PowerPoint & Google Slides
Process
Growth Curve Line Chart Visualization Template for PowerPoint & Google Slides
Charts
Experience Curve Analysis Diagram Template for PowerPoint & Google Slides
Business Strategy
Economies of Scale Cost Curve Comparison Template for PowerPoint & Google Slides
Comparison Chart
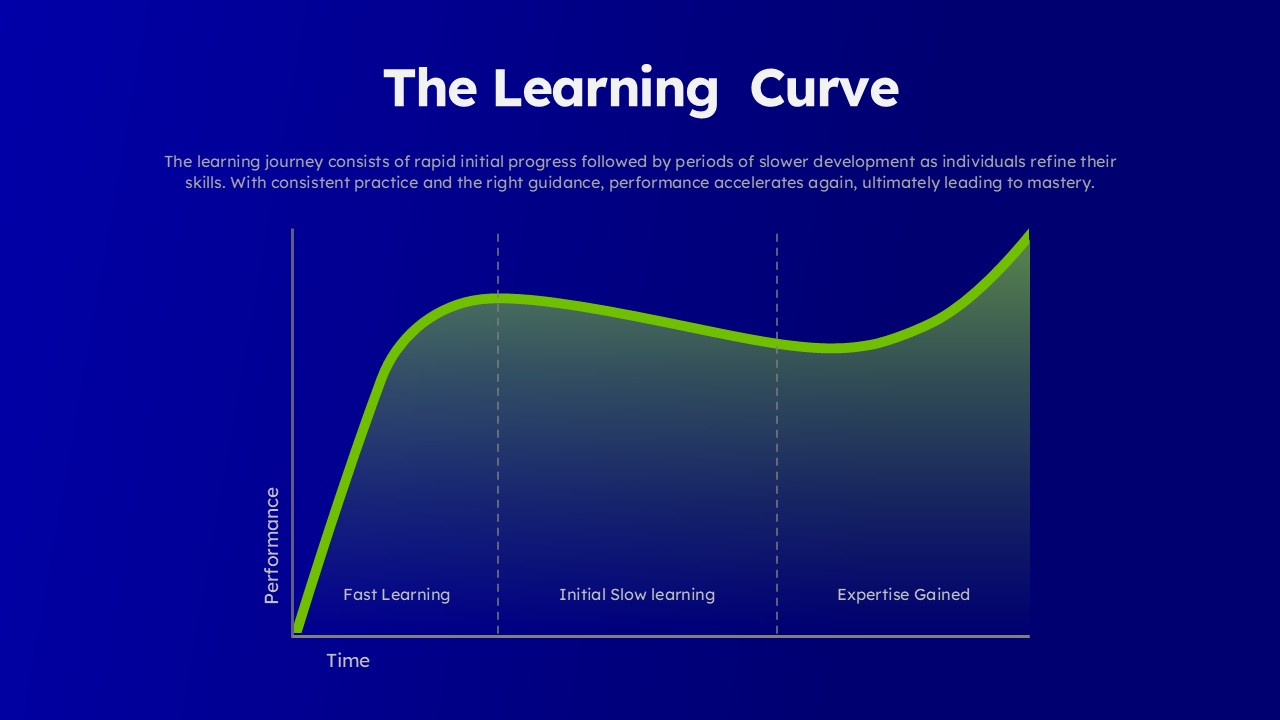
Learning Curve Performance Growth Chart Template for PowerPoint & Google Slides
Employee Performance
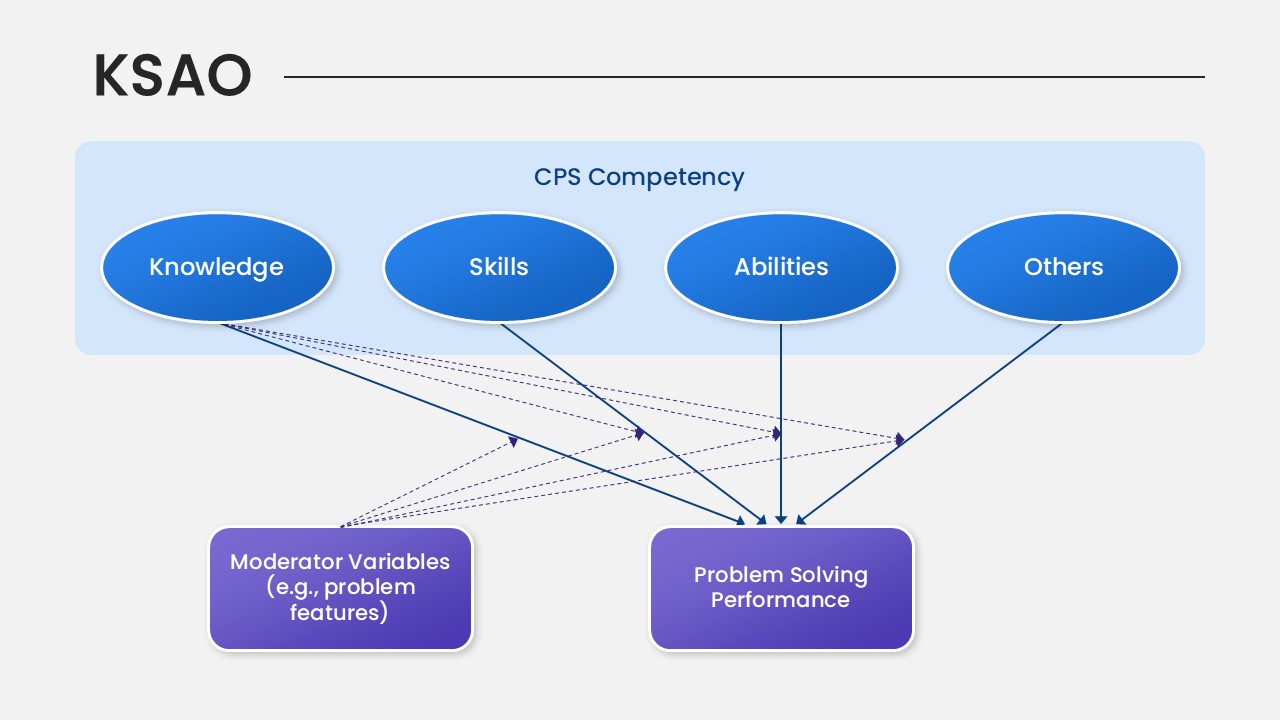
KSAO Model PowerPoint Template for PowerPoint & Google Slides
Business Strategy
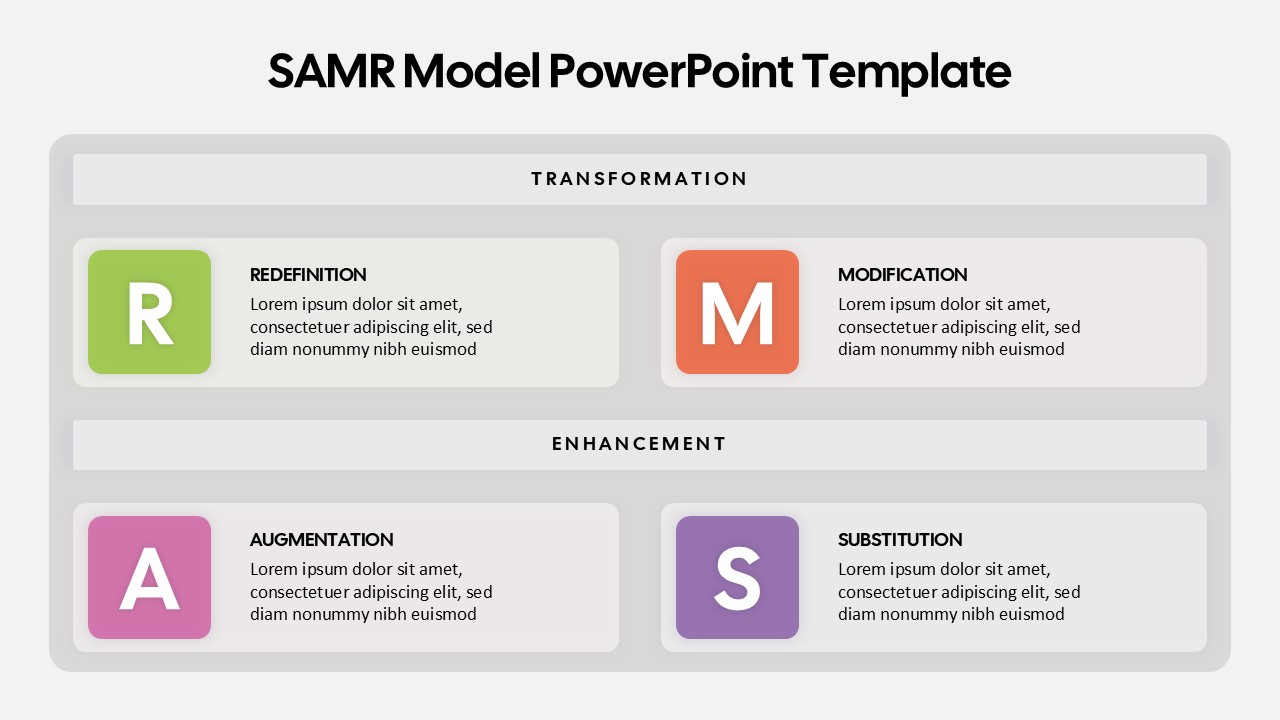
SAMR Model PowerPoint Template for PowerPoint & Google Slides
Business
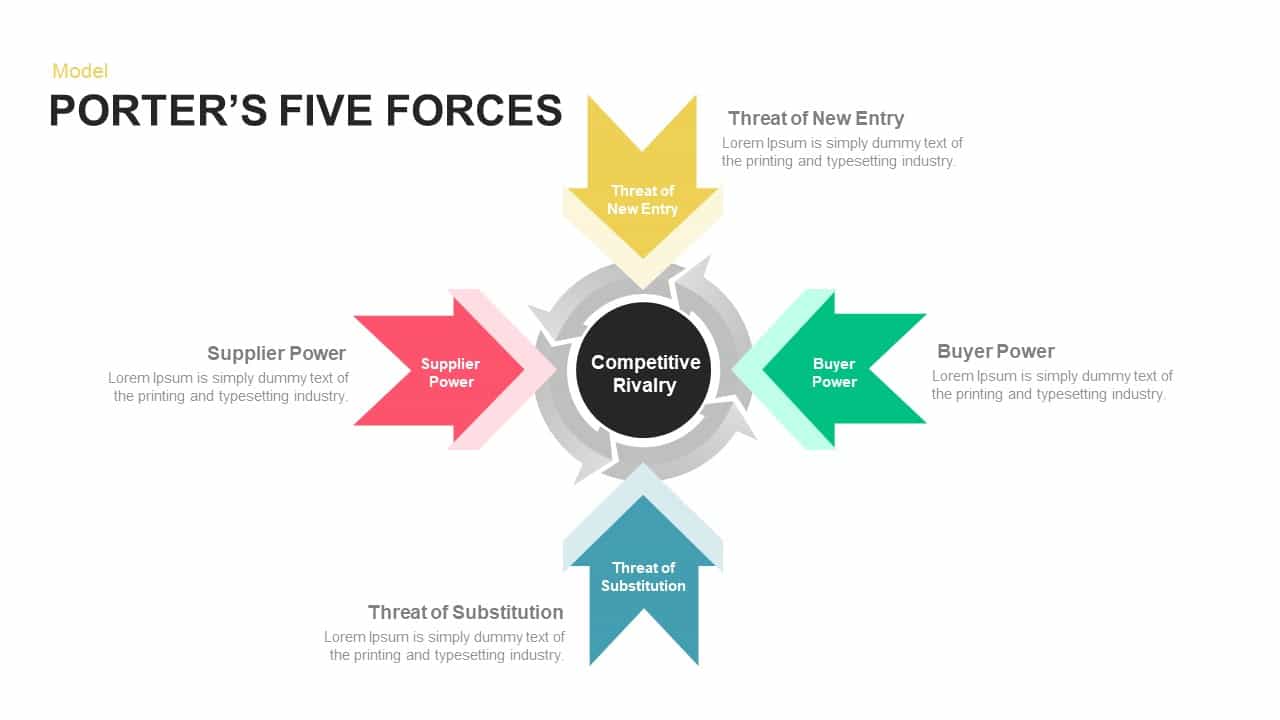
Porter’s Five Forces Model Diagram Template for PowerPoint & Google Slides
Competitor Analysis
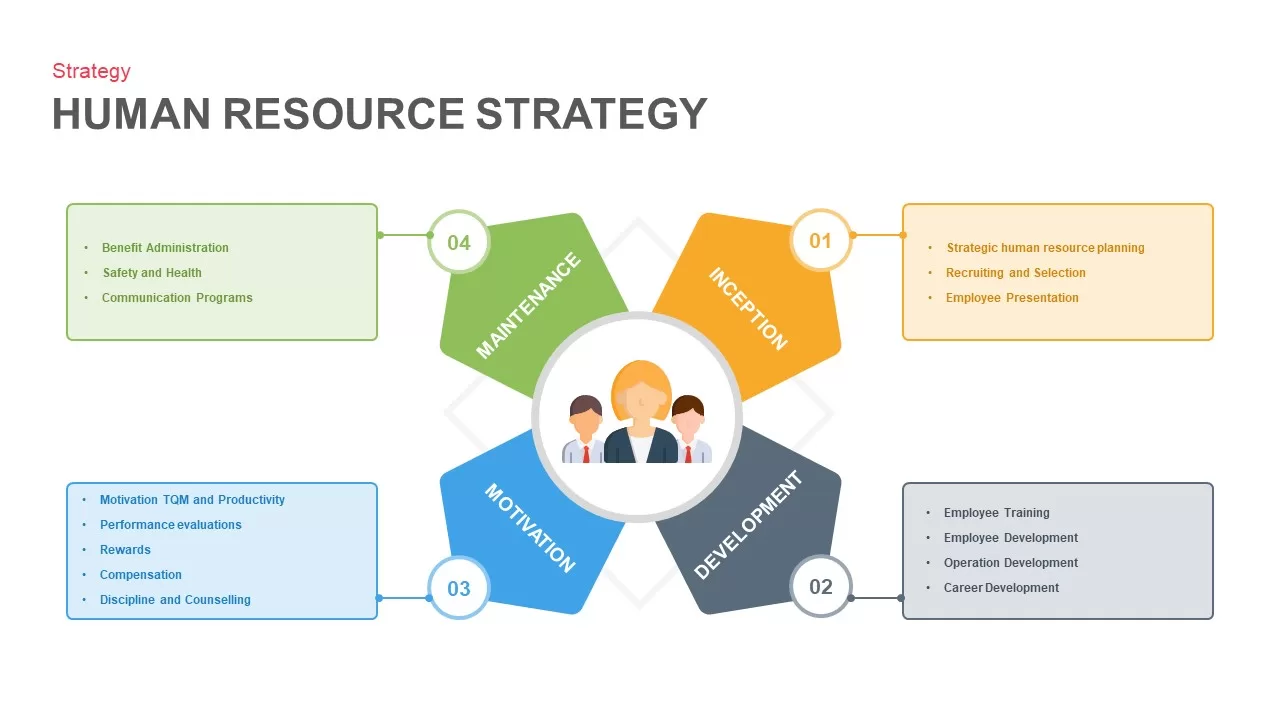
Human Resource Strategy Model Pack Template for PowerPoint & Google Slides
HR

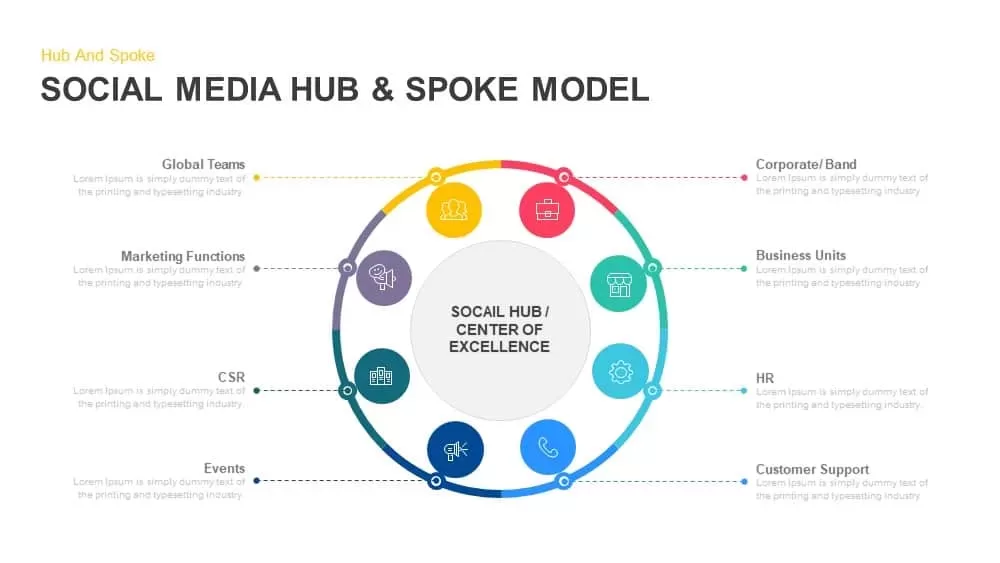
Social Media Hub & Spoke Model Template for PowerPoint & Google Slides
Process
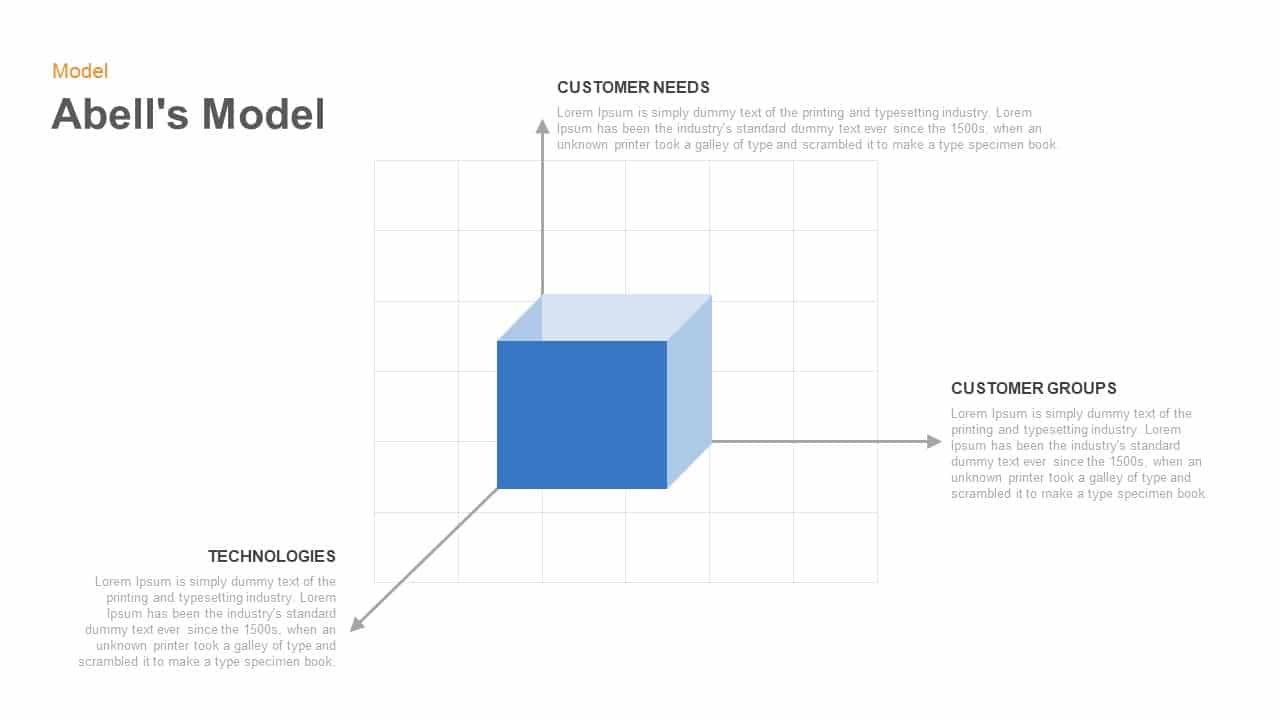
Abell’s 3D Cube Model Diagram Template for PowerPoint & Google Slides
Business Models
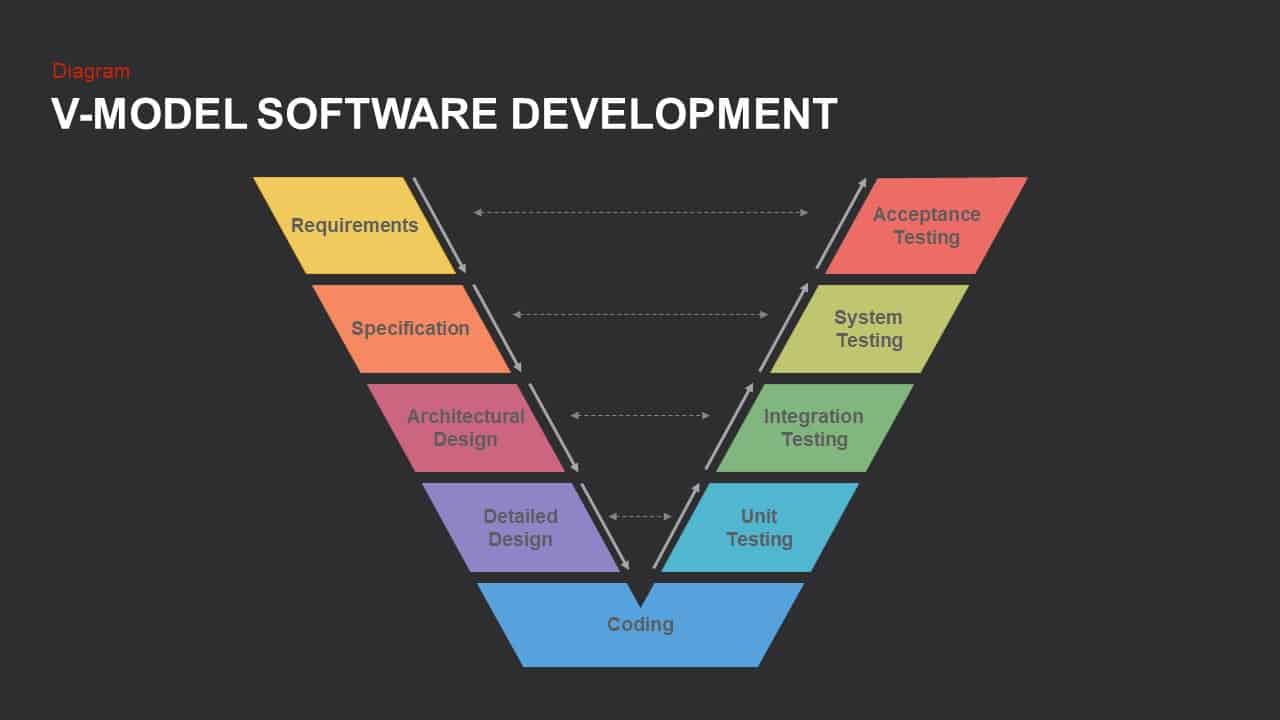
V-Model Software Development Diagram Template for PowerPoint & Google Slides
Software Development
SOAR Strategic Model Card Diagram Template for PowerPoint & Google Slides
Process
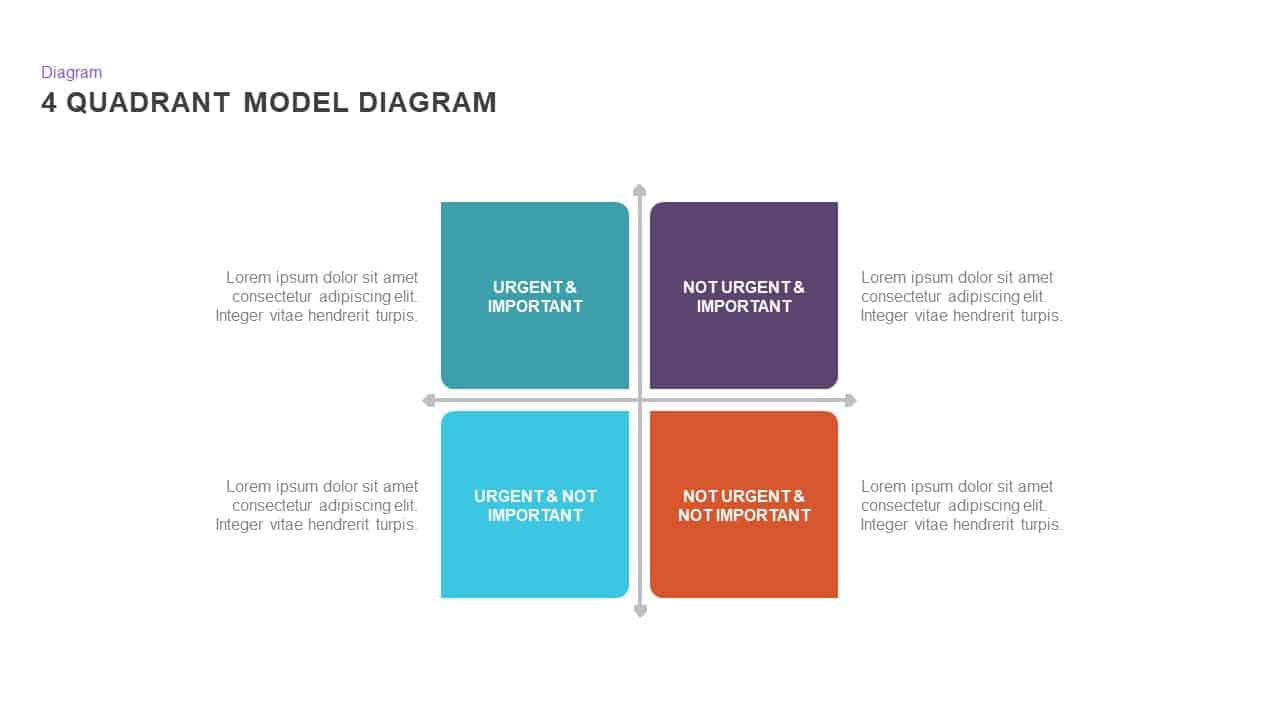
4 Quadrant Model Diagram template for PowerPoint & Google Slides
Process

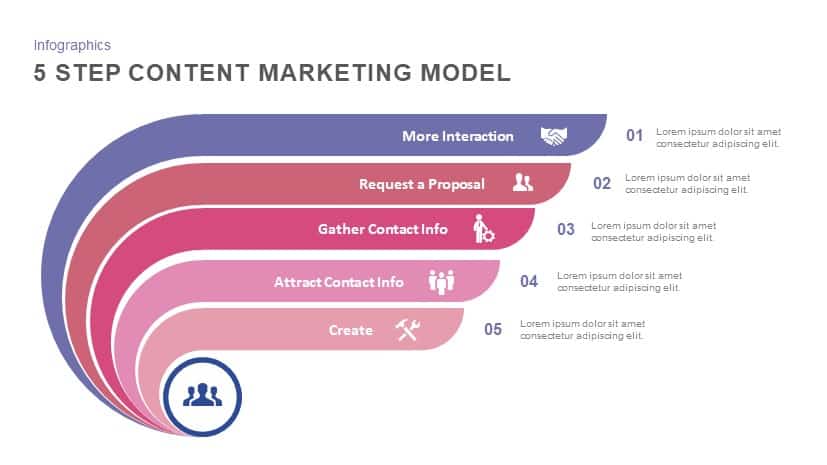
5 Step Content Marketing Model template for PowerPoint & Google Slides
Marketing

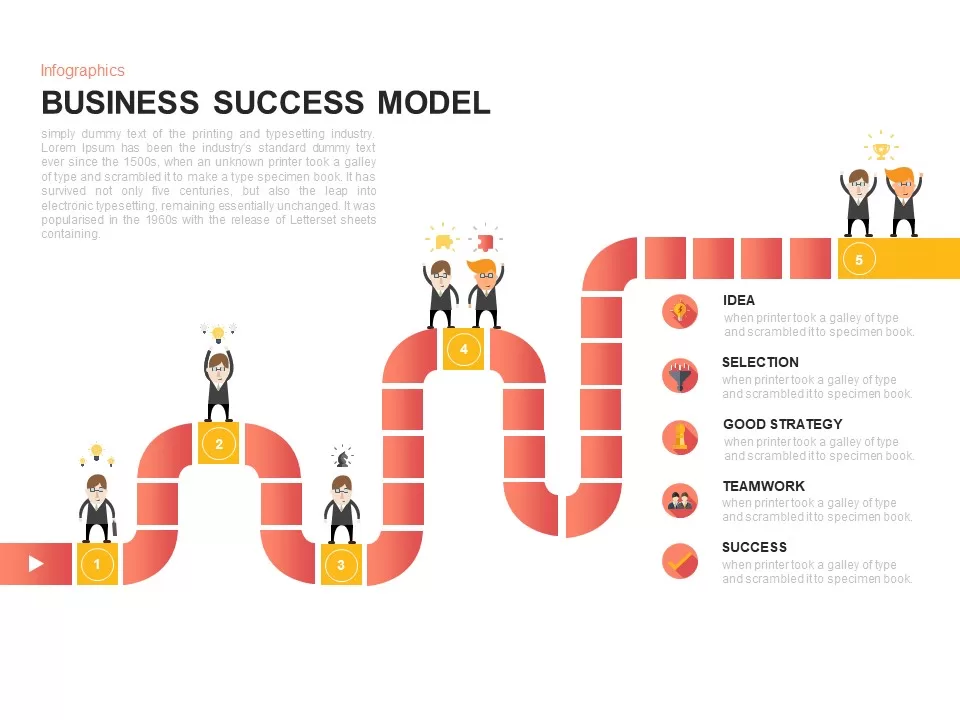
Business Success Model Infographic Template for PowerPoint & Google Slides
Roadmap
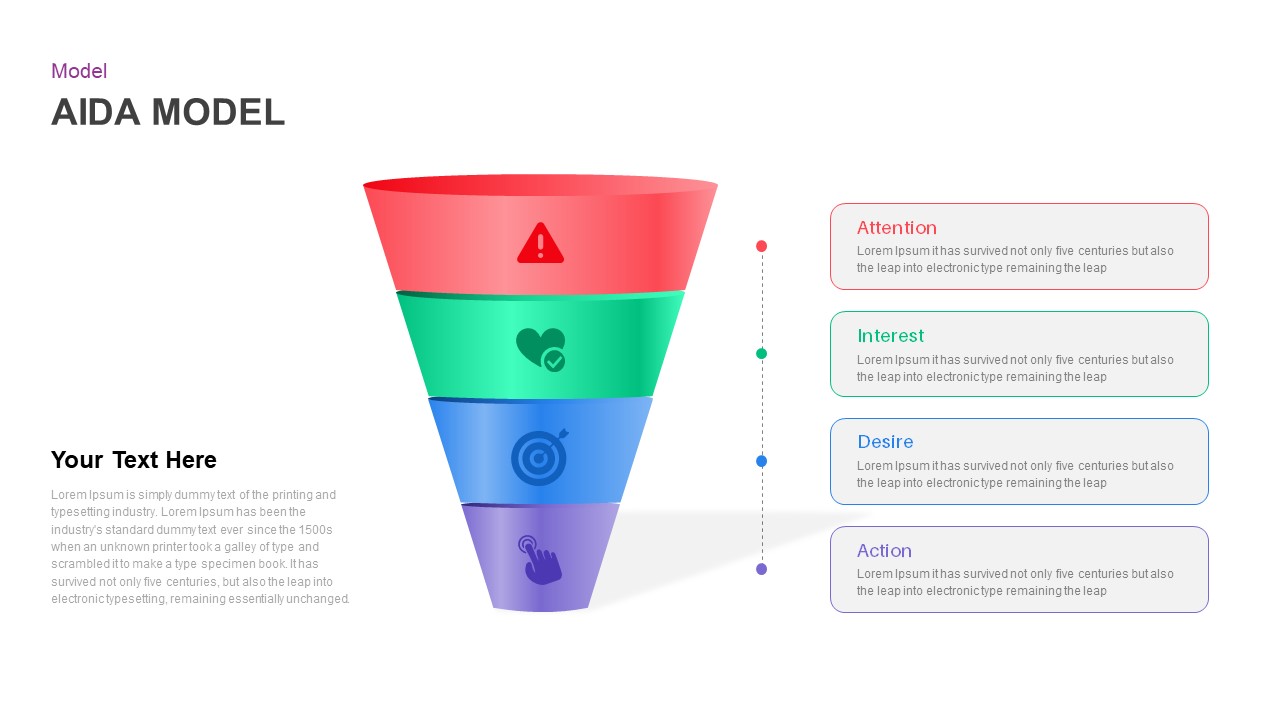
AIDA Marketing Funnel Model Template for PowerPoint & Google Slides
Marketing
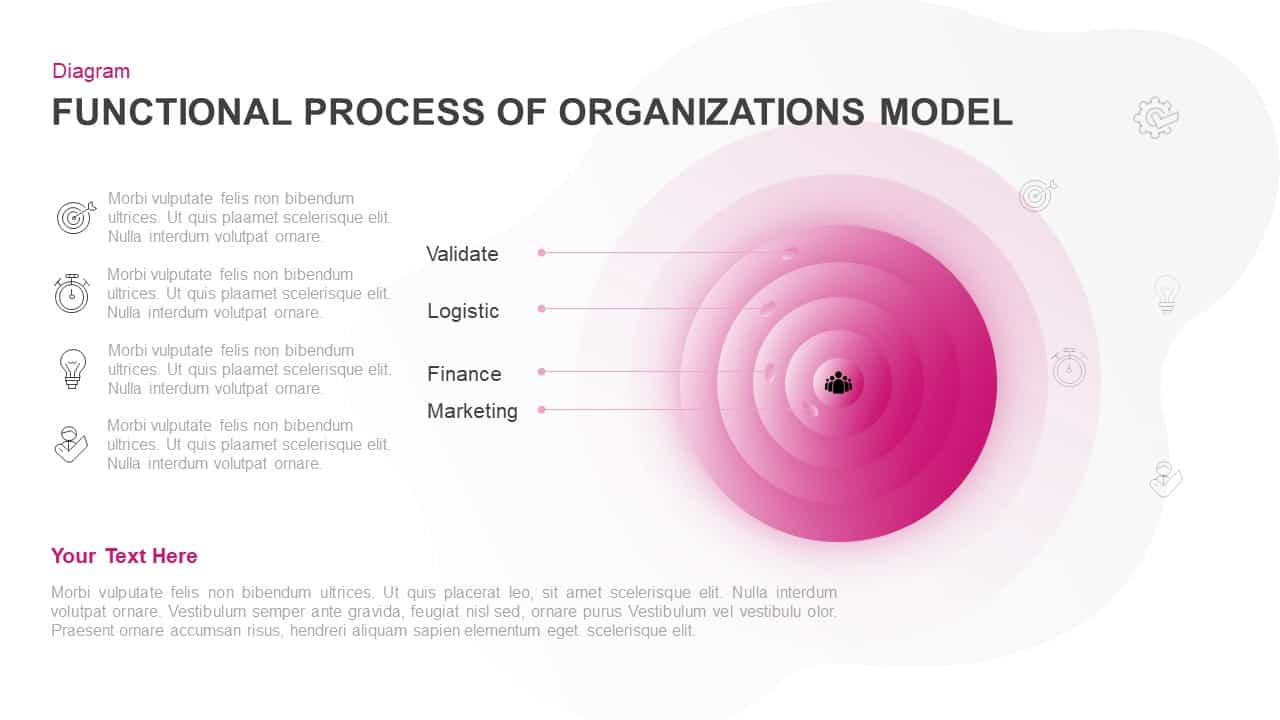
Concentric Functional Process Model Template for PowerPoint & Google Slides
Circular
Greiner Growth Model Six-Phase Diagram Template for PowerPoint & Google Slides
Business Models
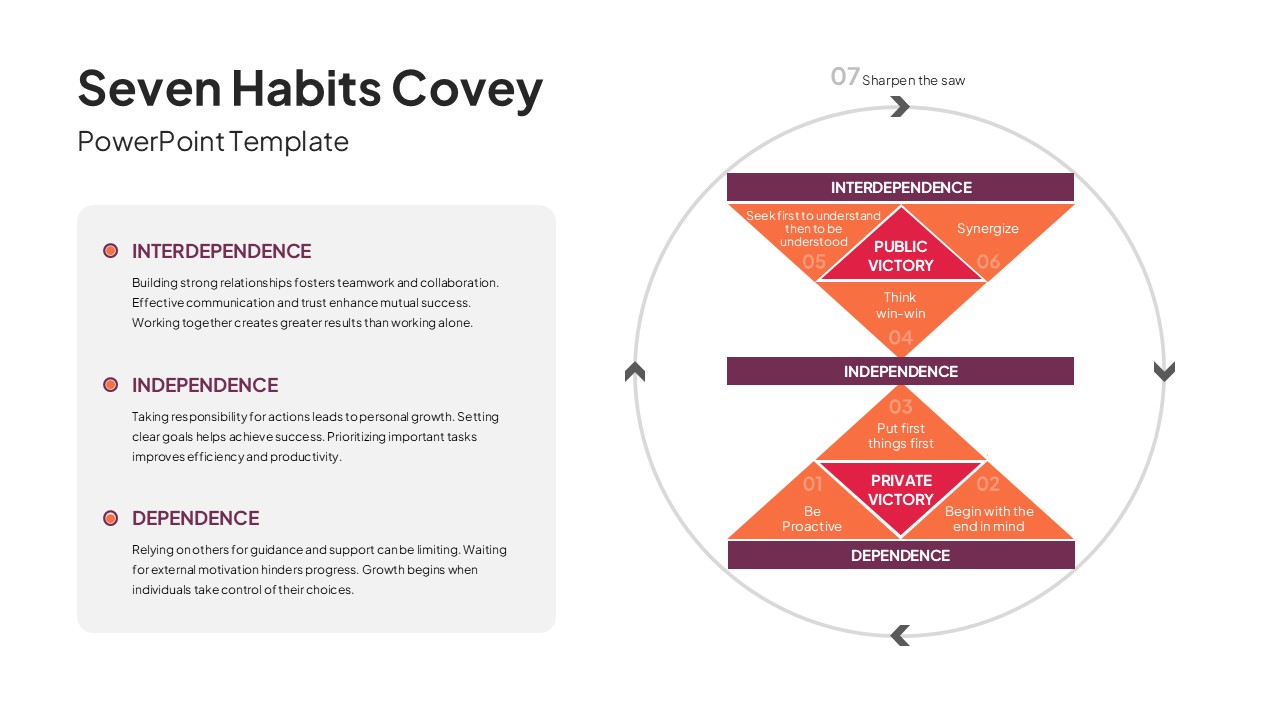
7 Habits of Highly Effective People Covey Model Template for PowerPoint & Google Slides
Leadership
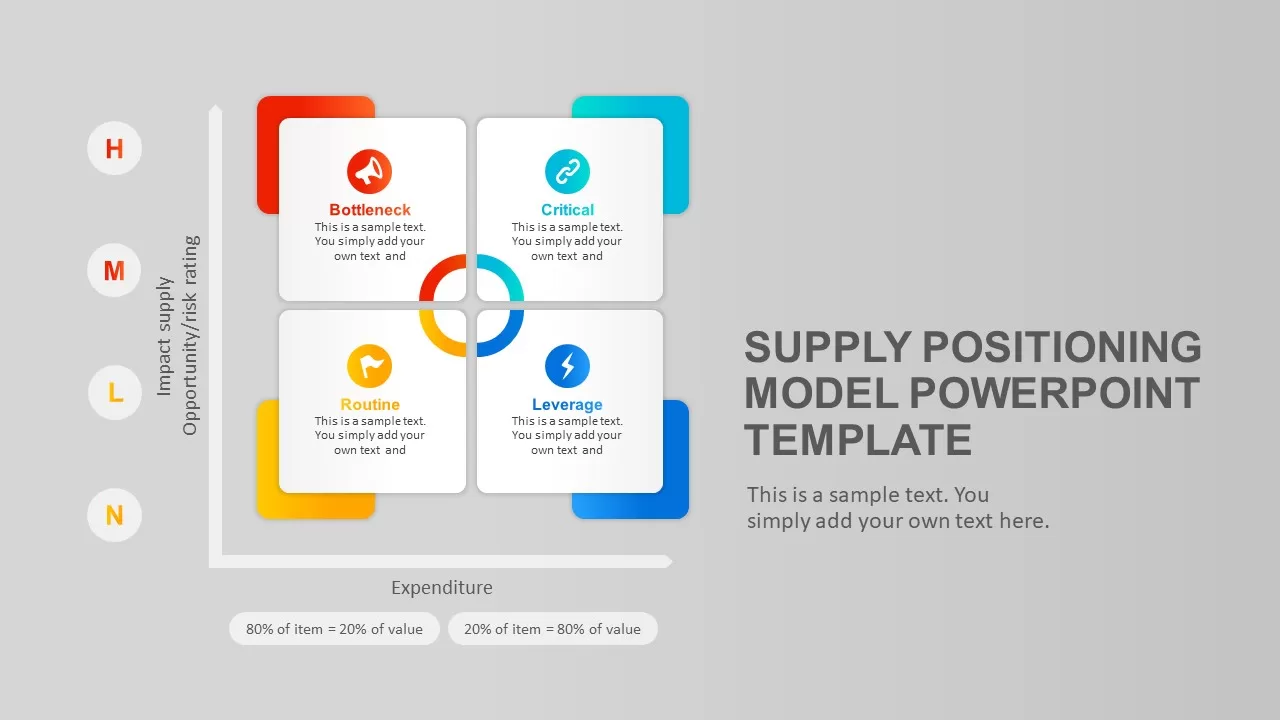
Supply Positioning Model Matrix Template for PowerPoint & Google Slides
Comparison Chart
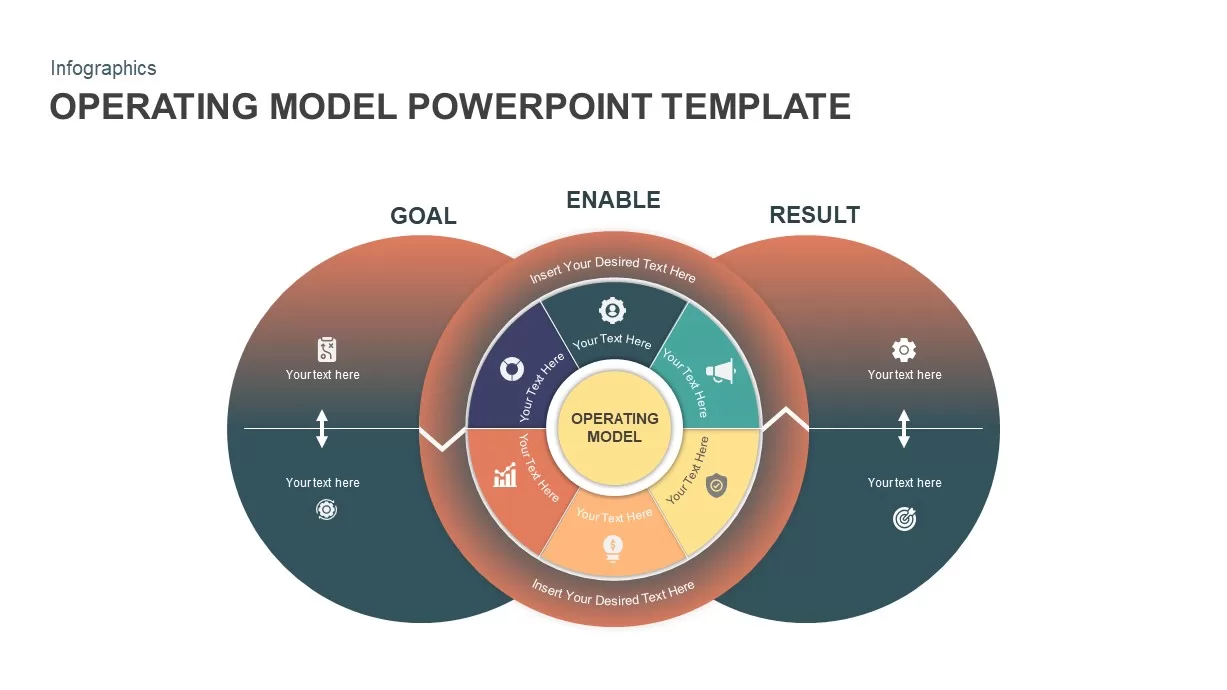
Operating Model Hub-and-Spoke Diagram Template for PowerPoint & Google Slides
Business Models
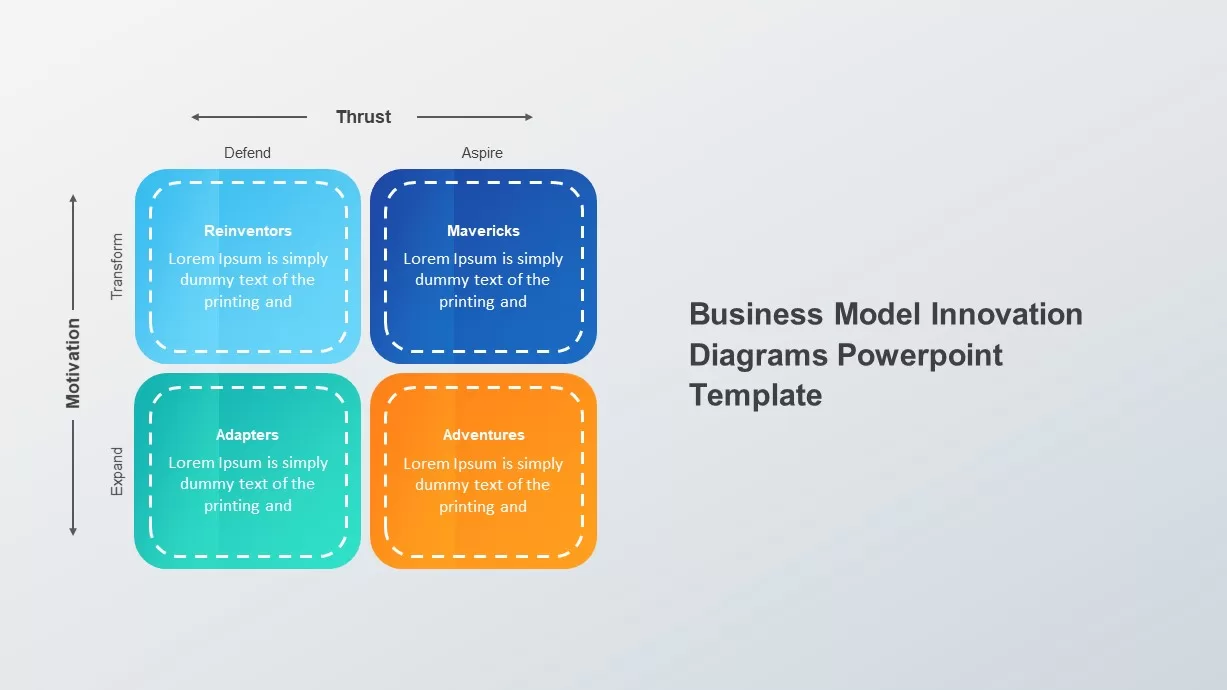
Business Model Innovation Diagrams template for PowerPoint & Google Slides
Process
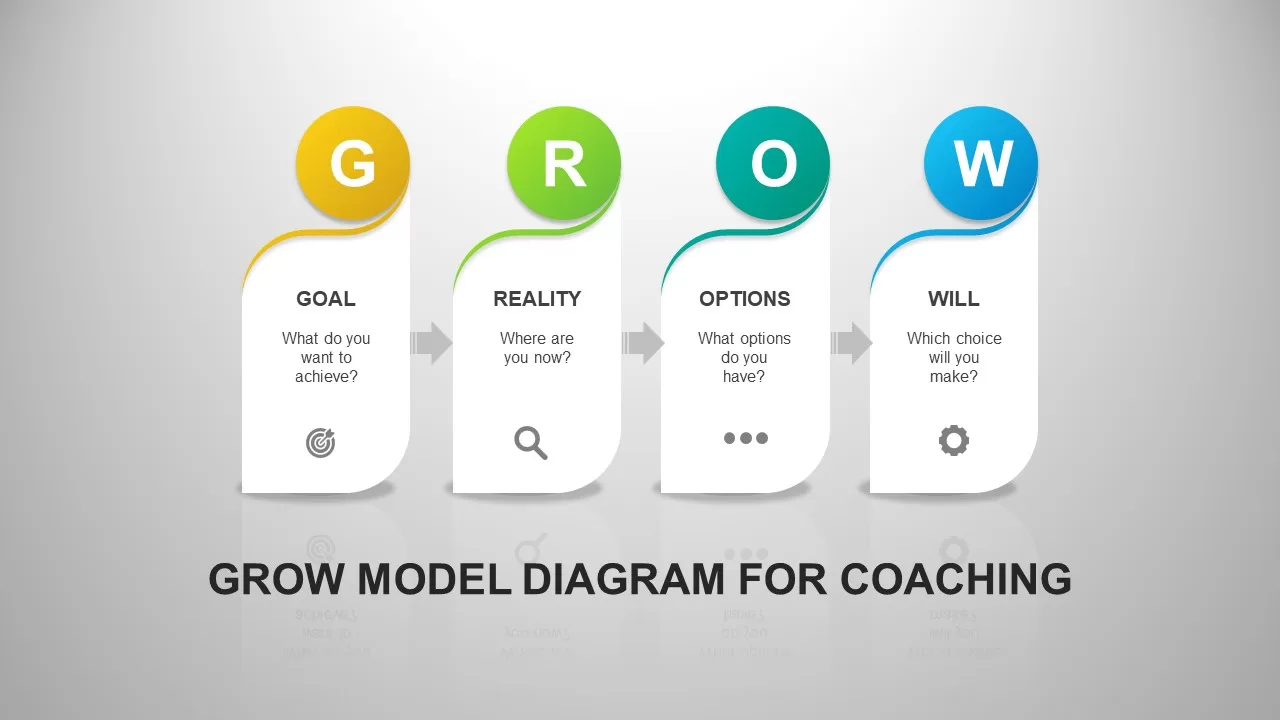
GROW Model Coaching Infographic Template for PowerPoint & Google Slides
Process
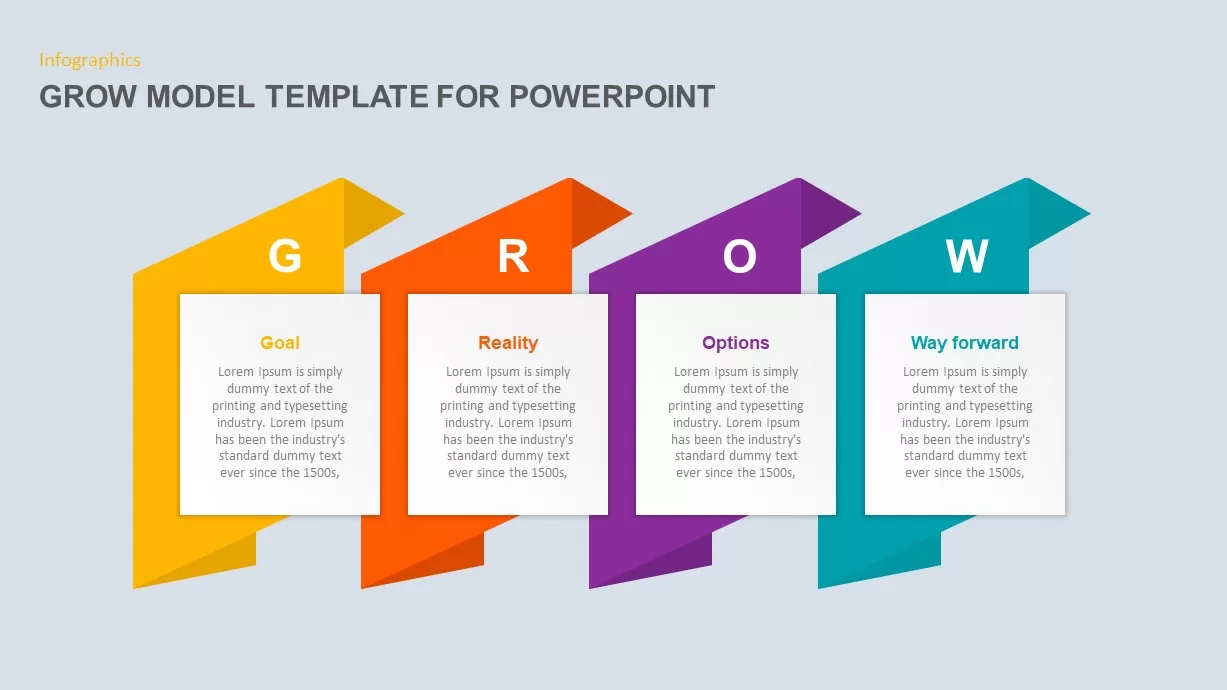
GROW Model Coaching PowerPoint & Google Slides Template for Presentations
Business Strategy
Supply Positioning Model Template for PowerPoint & Google Slides
Business Models
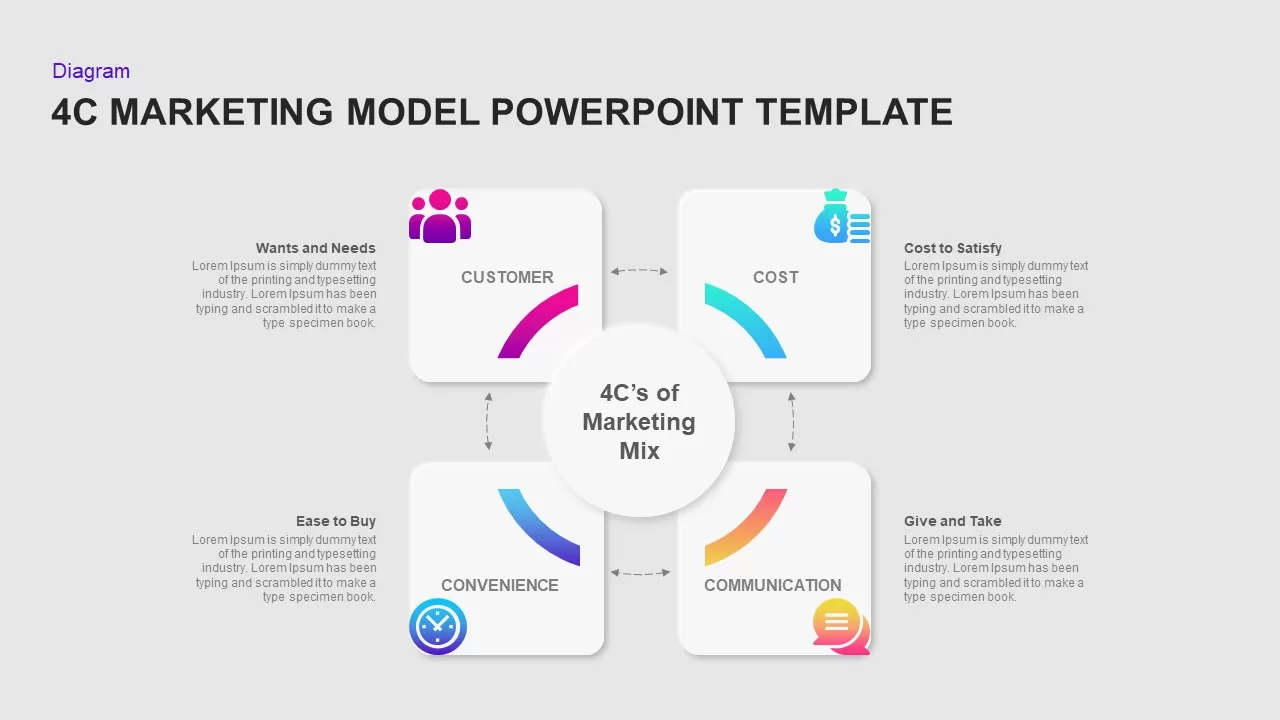
4C Marketing Model Overview Template for PowerPoint & Google Slides
Marketing
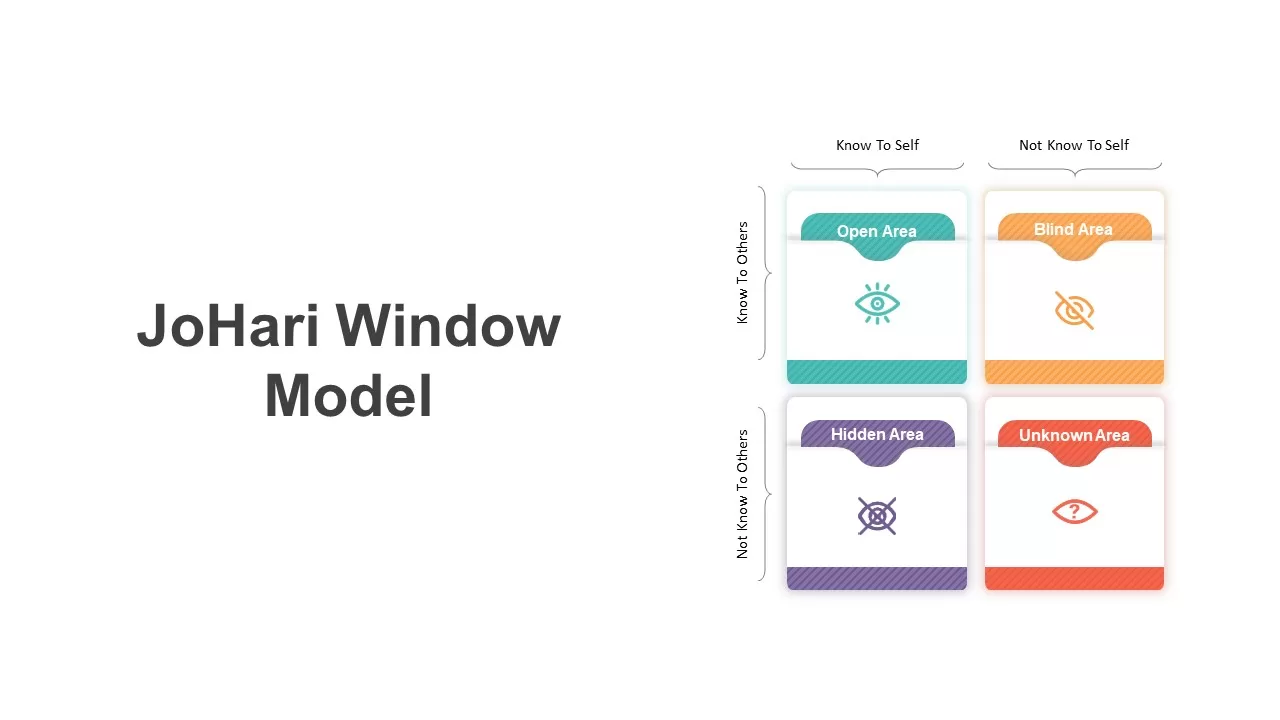
JoHari Window Model Template for PowerPoint & Google Slides
Employee Performance
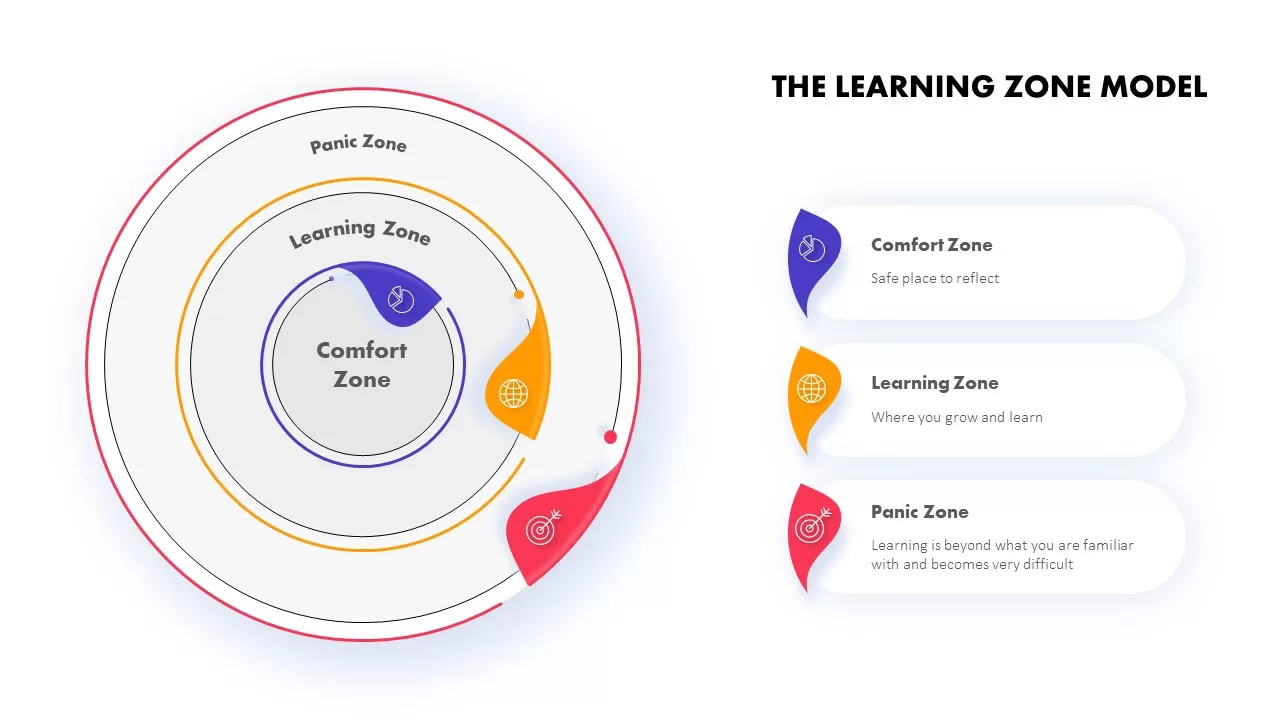
The Learning Zone Model Template for PowerPoint & Google Slides
Process
Lewin’s Change Model Overview Template for PowerPoint & Google Slides
Gap
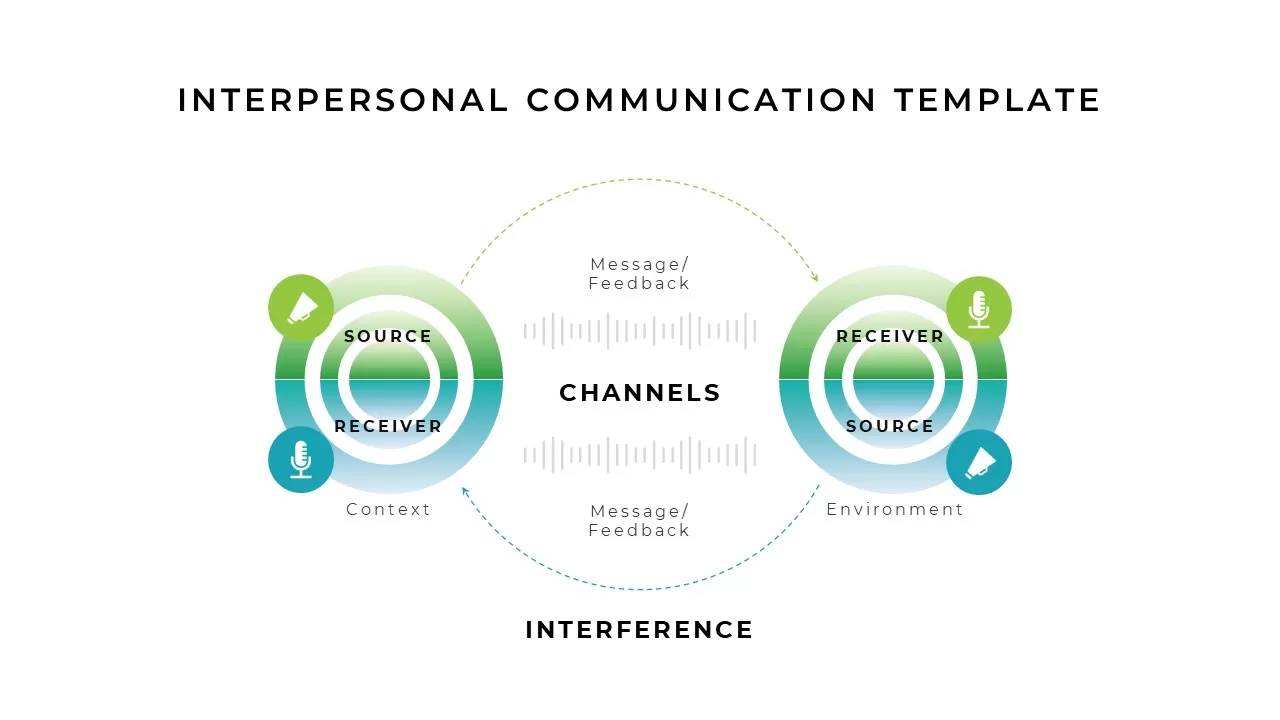
Interpersonal Communication Model Overview template for PowerPoint & Google Slides
Business

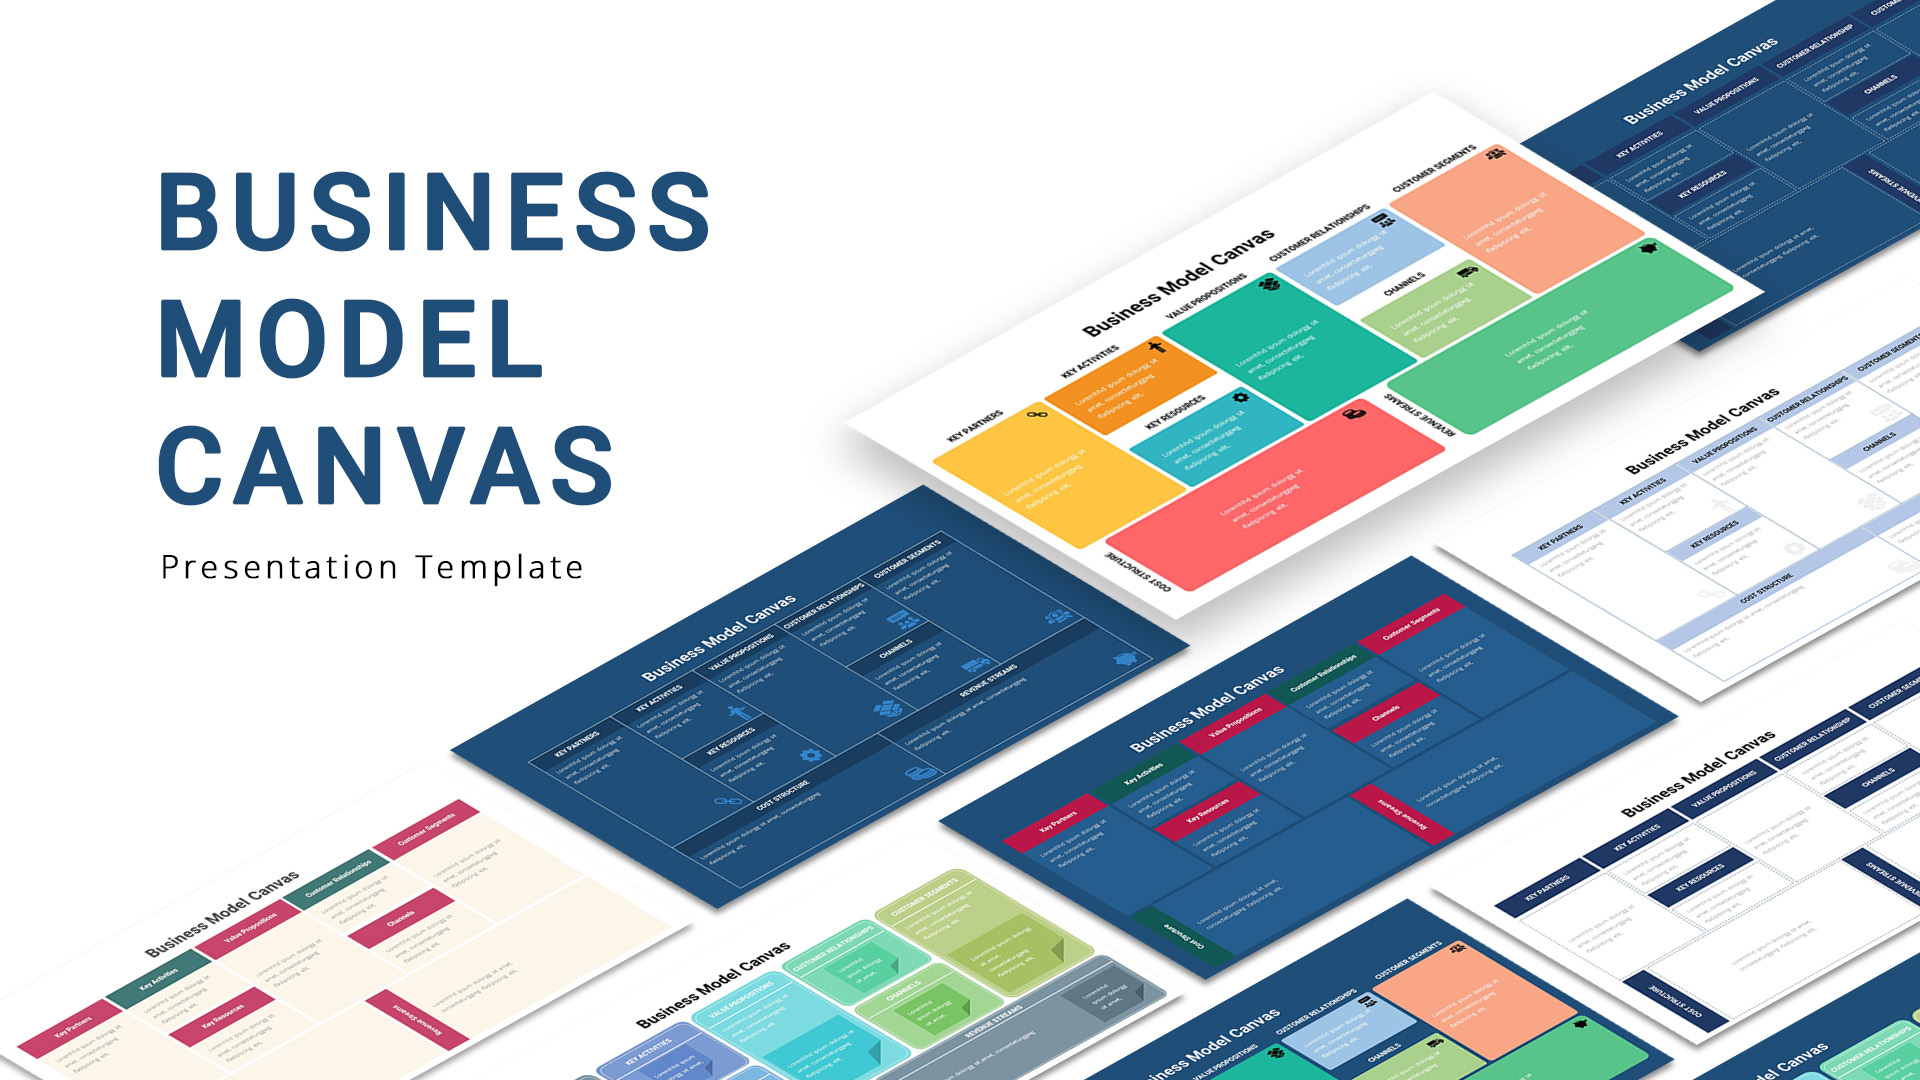
Business Model Canvas Diagram Template for PowerPoint & Google Slides
Business Models
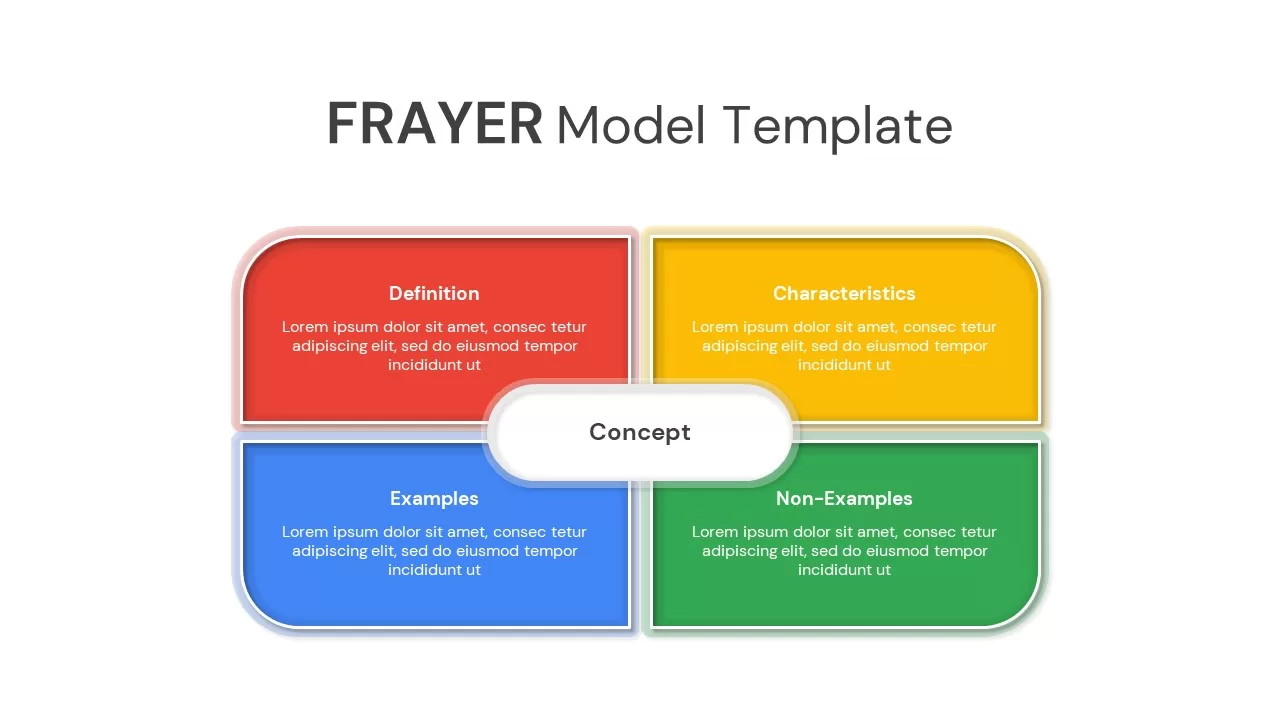
FRAYER Model template for PowerPoint & Google Slides
Infographics
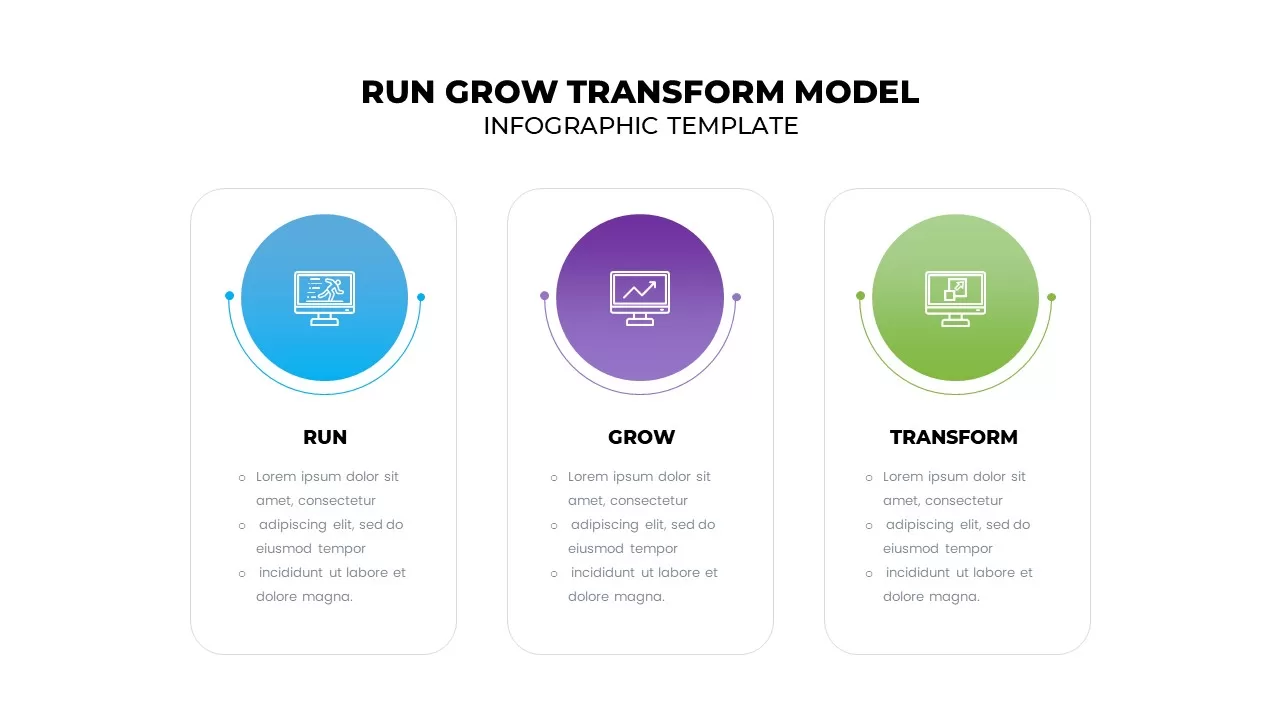
Run Grow Transform Model Infographic Template for PowerPoint & Google Slides
Business
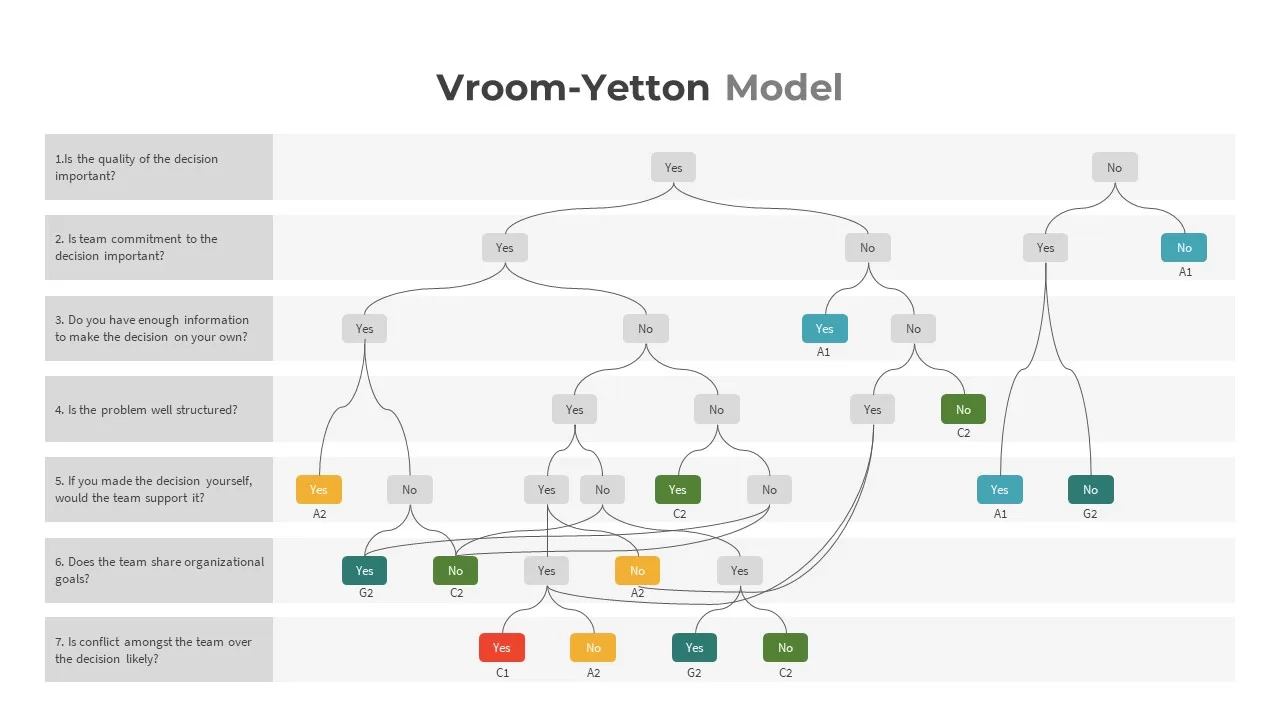
Vroom Yetton Model Template for PowerPoint & Google Slides
Business
DIKW Data to Wisdom Pyramid Model Template for PowerPoint & Google Slides
Pyramid
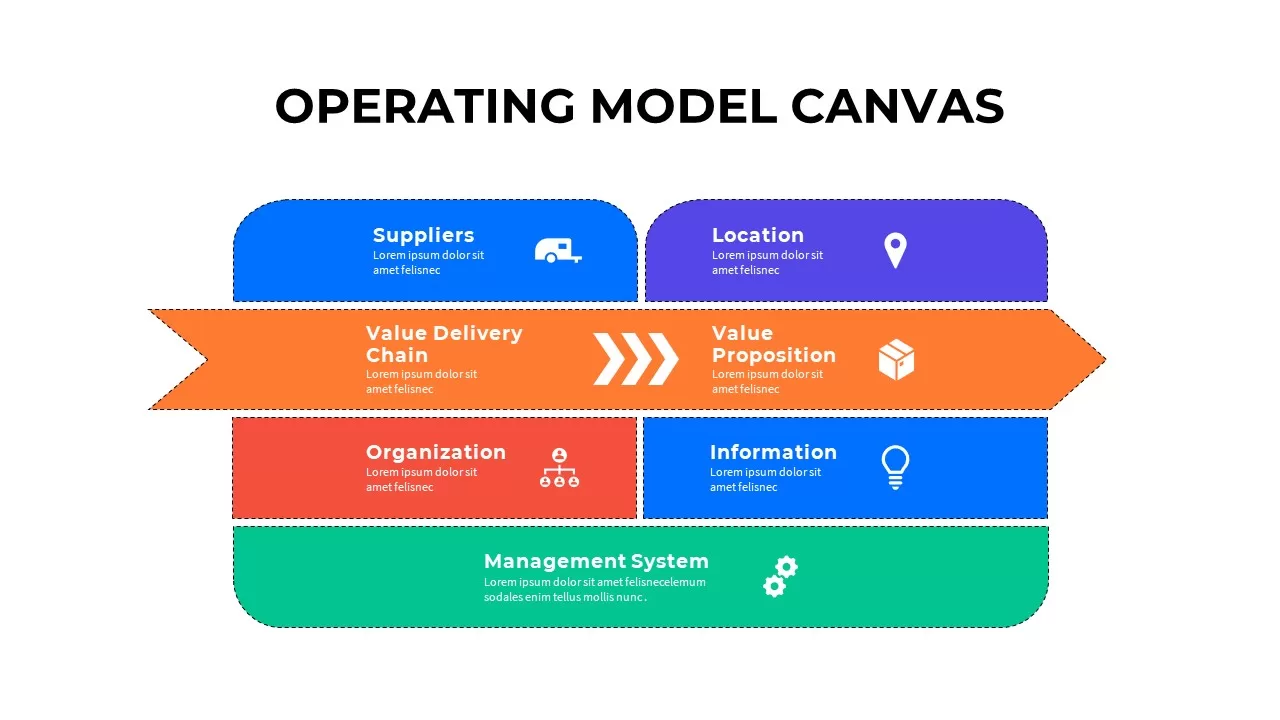
Operating Model Canvas Infographic Template for PowerPoint & Google Slides
Business Models
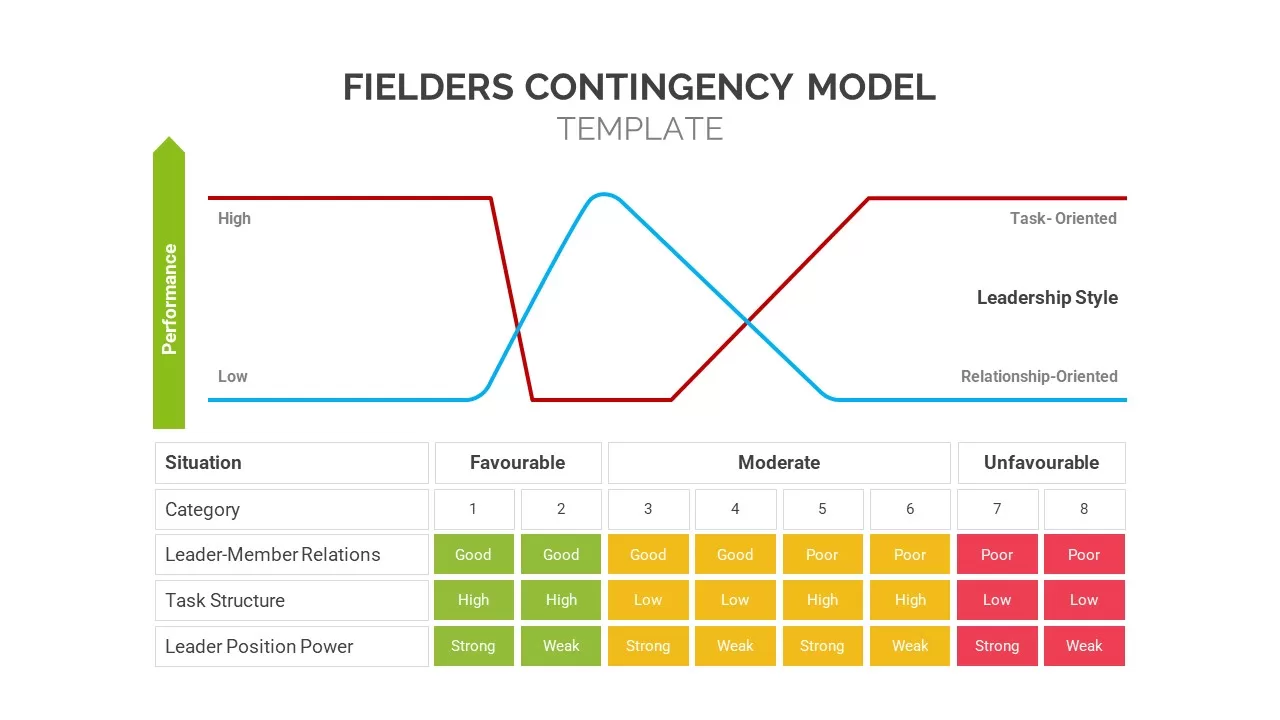
Fiedler’s Contingency Model template for PowerPoint & Google Slides
Business Strategy
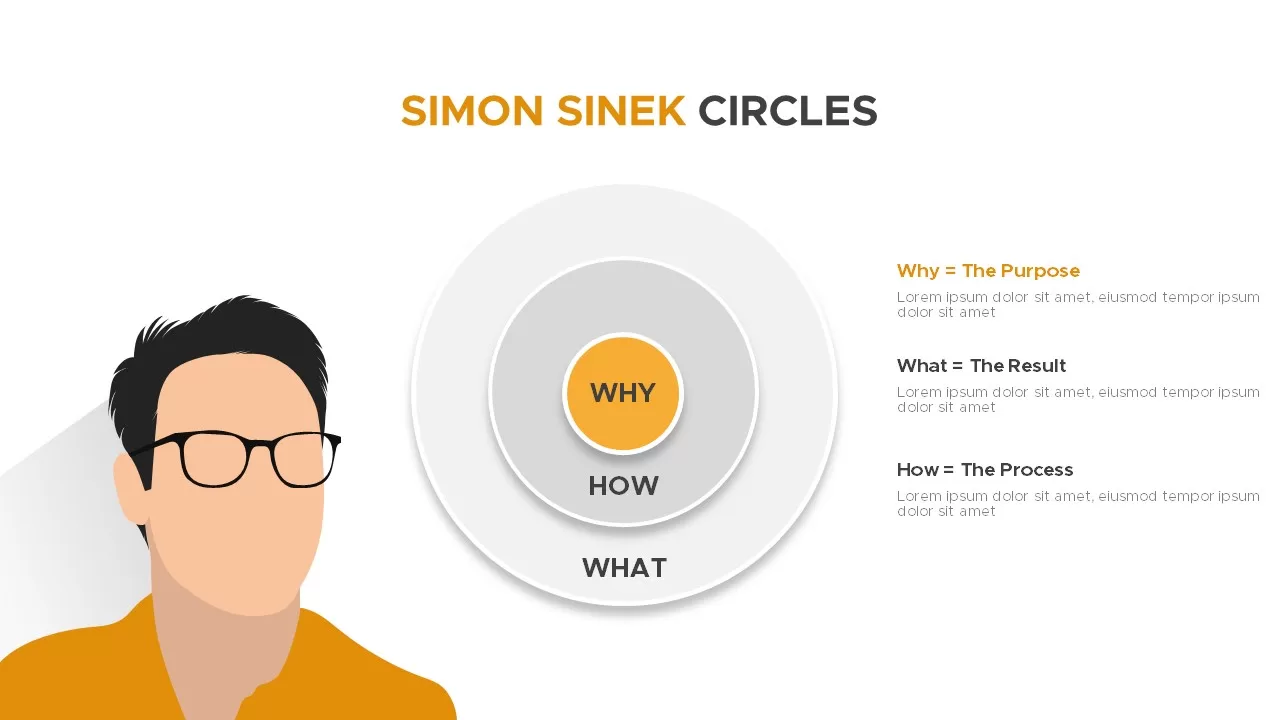
Simon Sinek Circles Model Infographic template for PowerPoint & Google Slides
Business Strategy
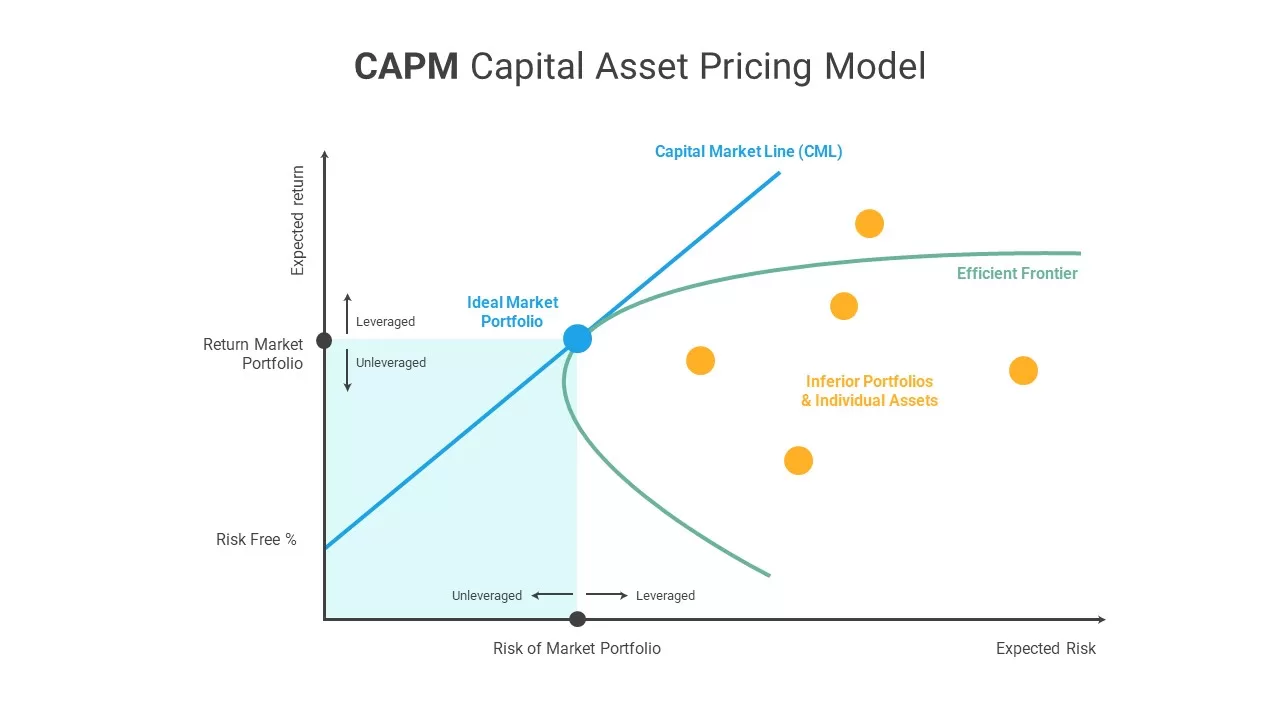
CAPM Capital Asset Pricing Model template for PowerPoint & Google Slides
Finance
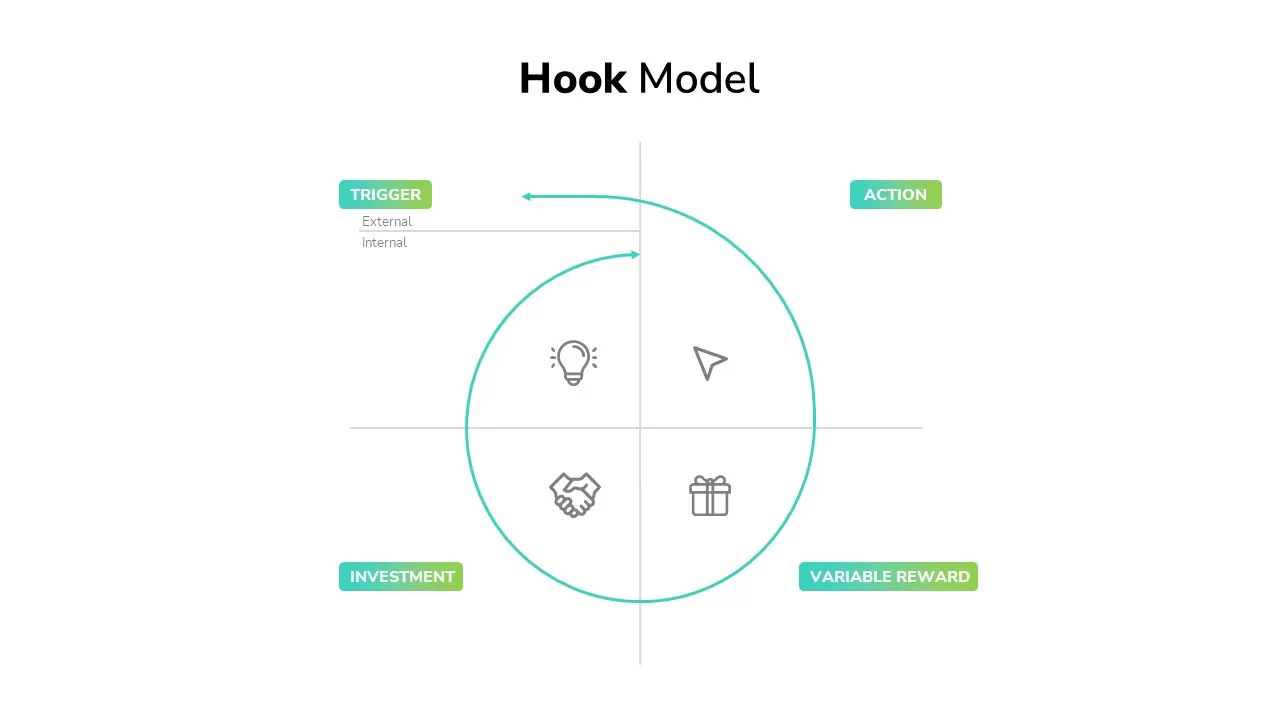
Hook Model Framework Template for PowerPoint & Google Slides
Business Strategy
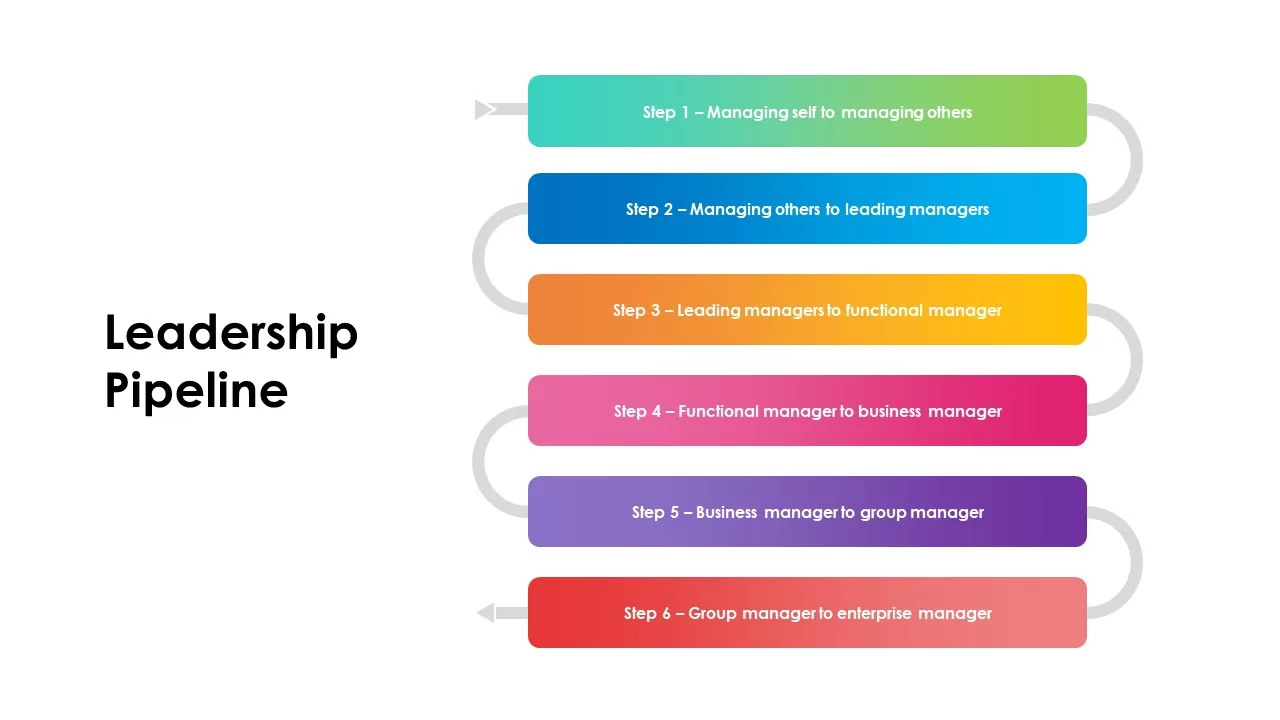
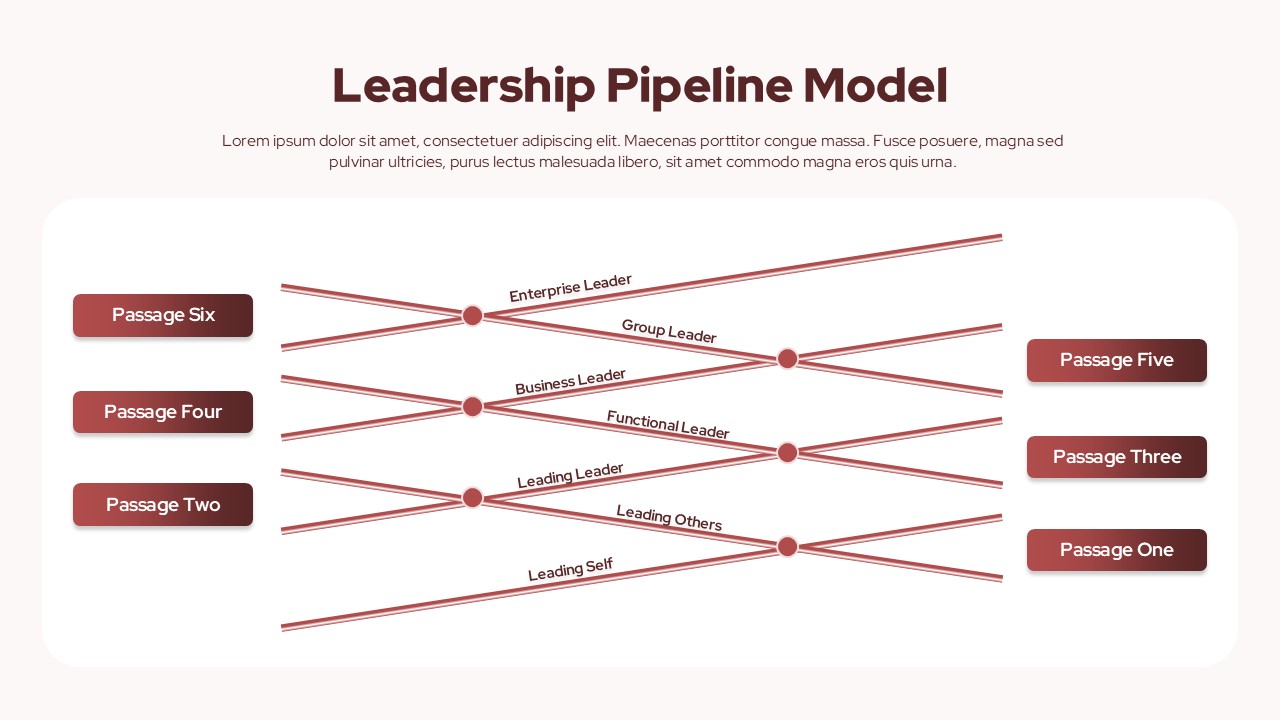
Leadership Pipeline Model Template for PowerPoint & Google Slides
Business Strategy
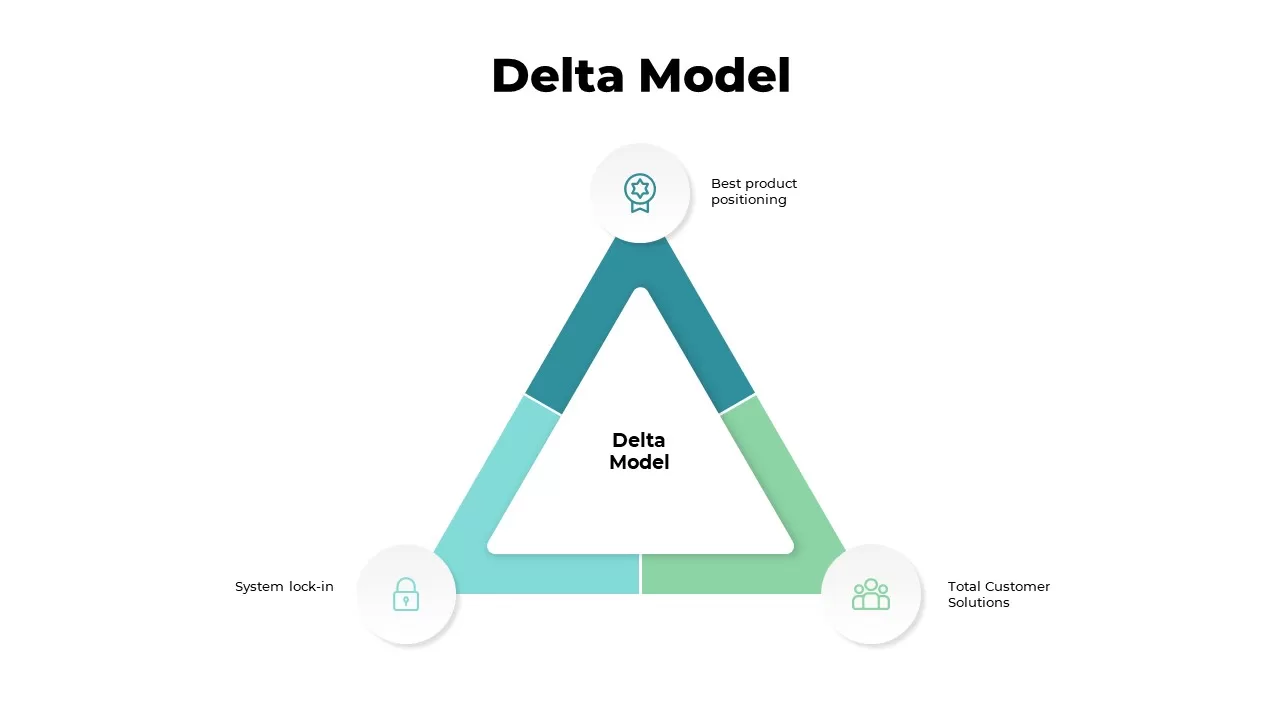
Delta Model Strategic Framework Template for PowerPoint & Google Slides
Business Strategy
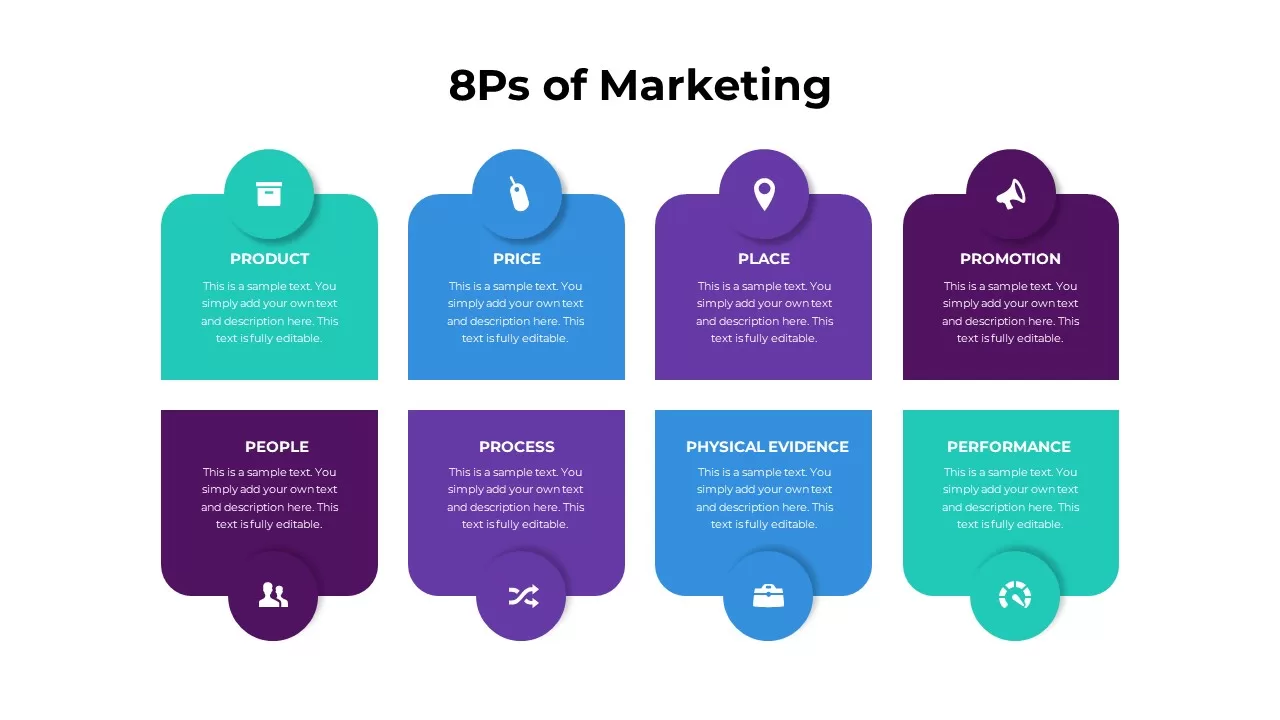
8Ps of Marketing Model Infographic Template for PowerPoint & Google Slides
Marketing
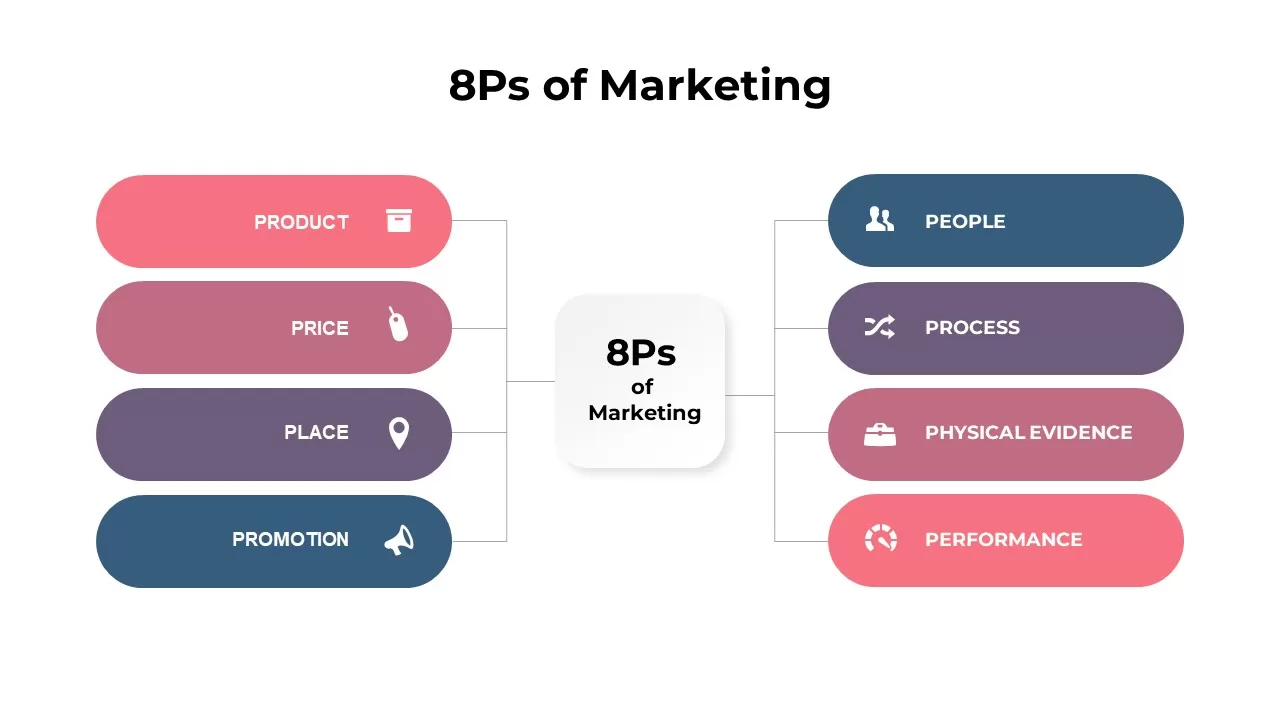
8Ps of Marketing Infographic Model Template for PowerPoint & Google Slides
Comparison
Five-Stage Digital Maturity Model Diagram Template for PowerPoint & Google Slides
Process
Business Strategy House Model Diagram Template for PowerPoint & Google Slides
Business Strategy
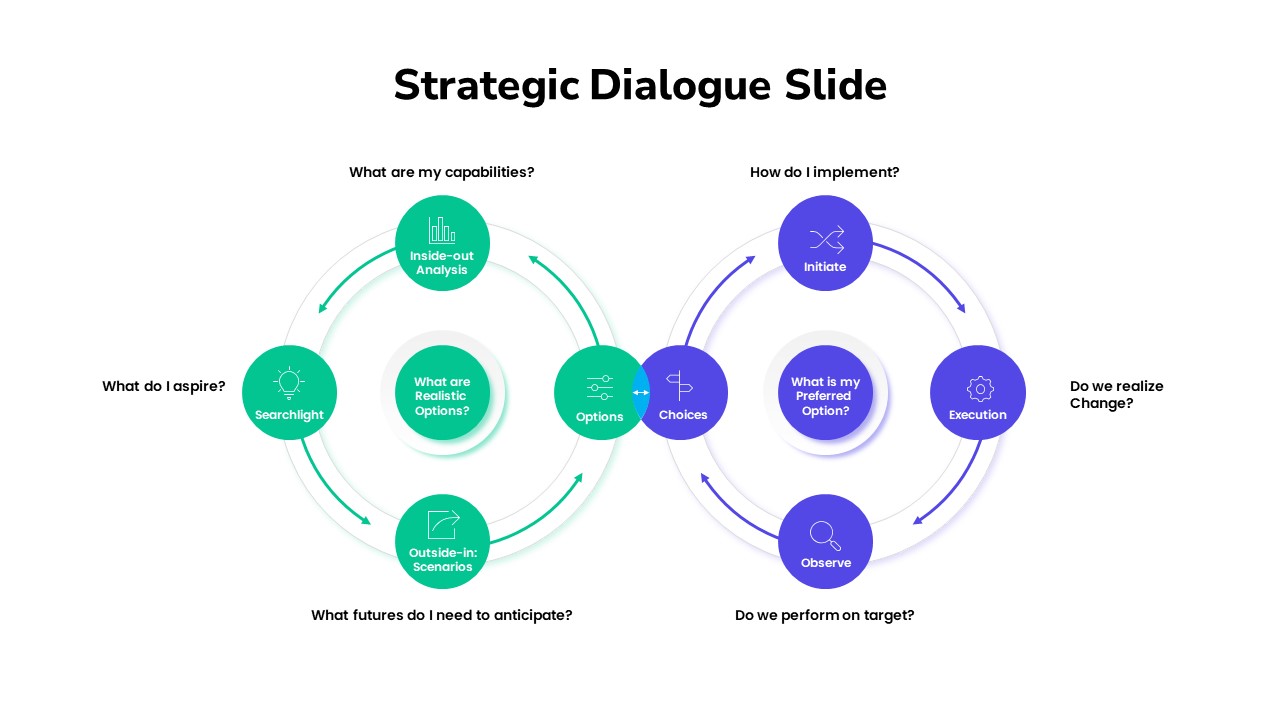
Strategic Dialogue Model Cycle Template for PowerPoint & Google Slides
Circular
Organizational Maturity Model Diagram Template for PowerPoint & Google Slides
Process
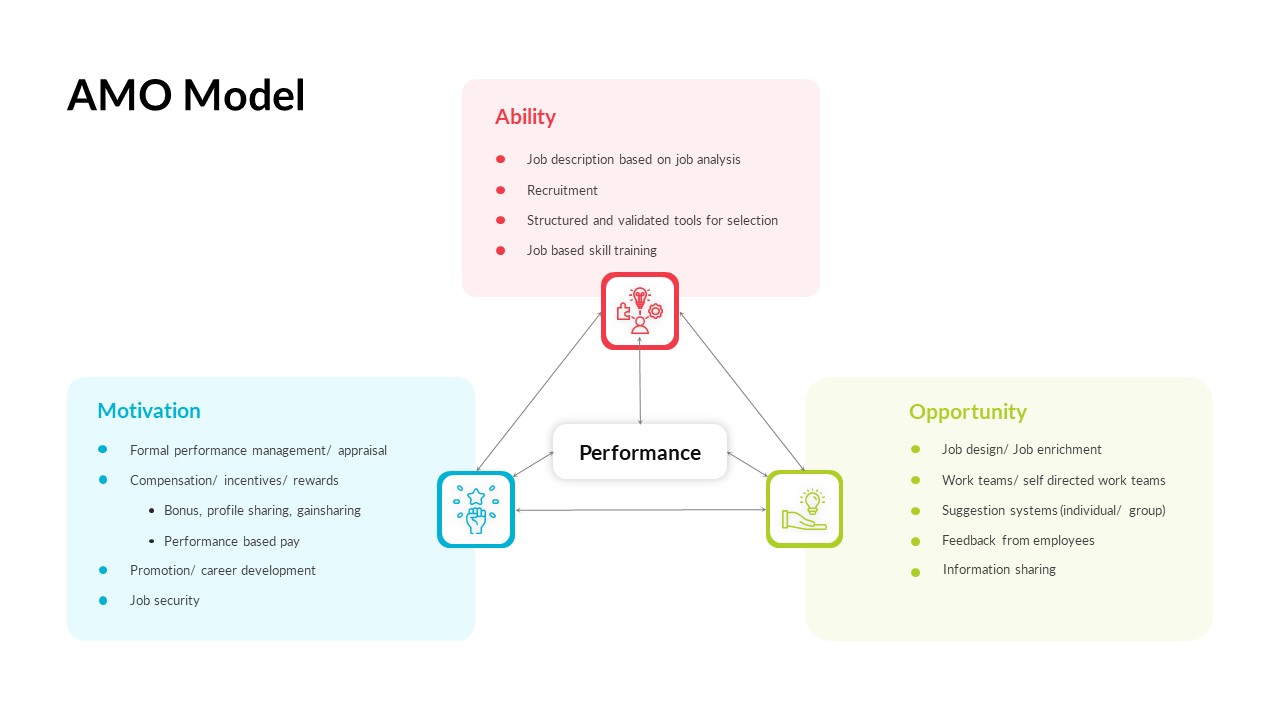
AMO Performance Model Feedback Diagram Template for PowerPoint & Google Slides
Employee Performance
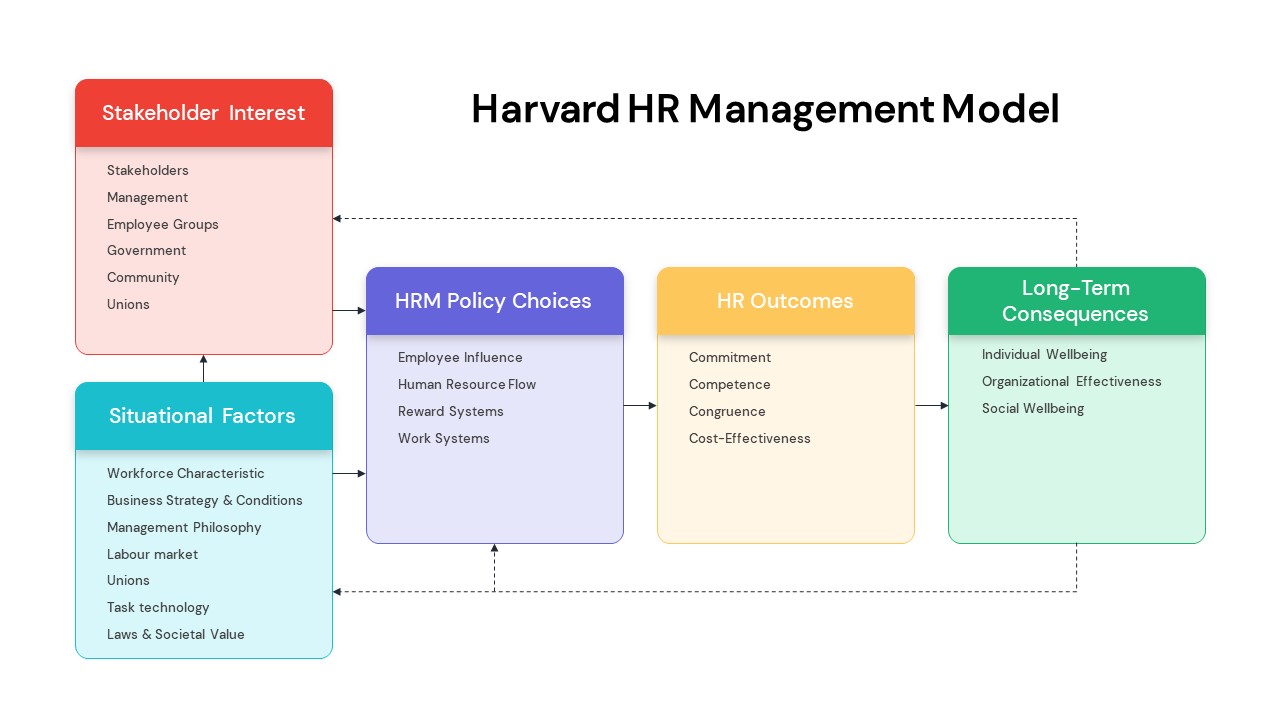
Harvard HR Management Model Diagram Template for PowerPoint & Google Slides
Process
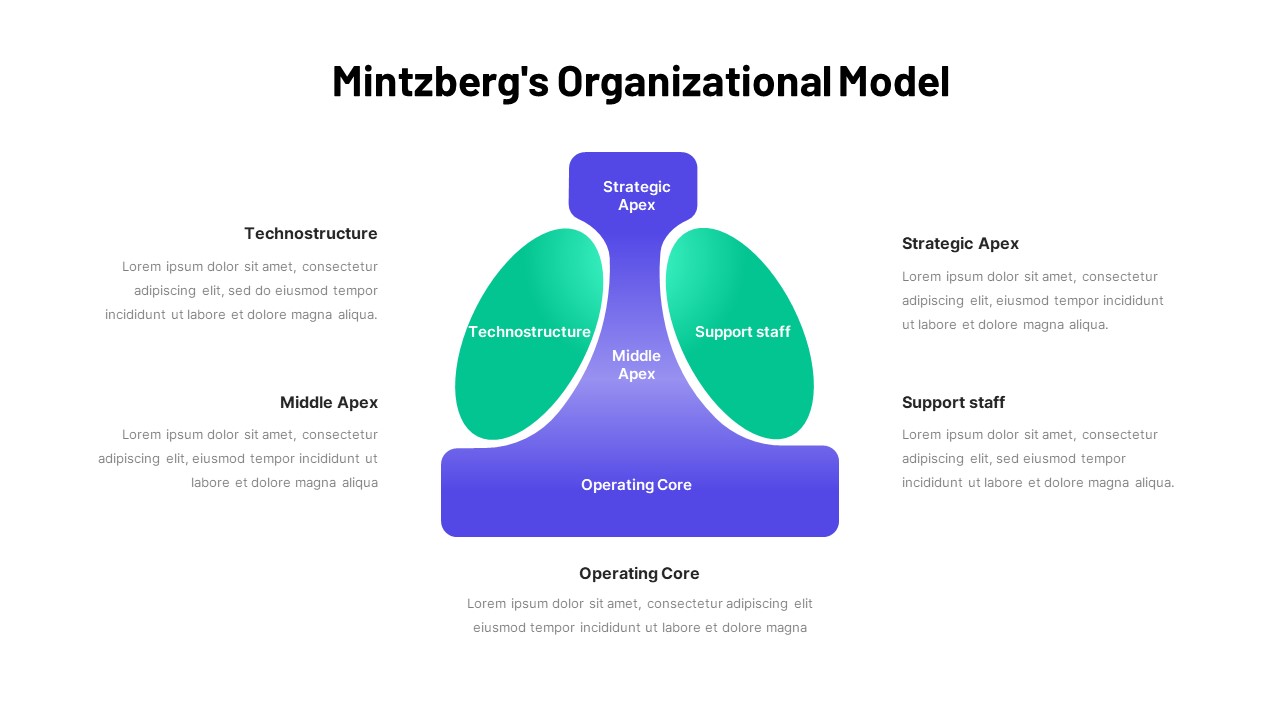
Mintzberg Organizational Model Gradient Template for PowerPoint & Google Slides
Business
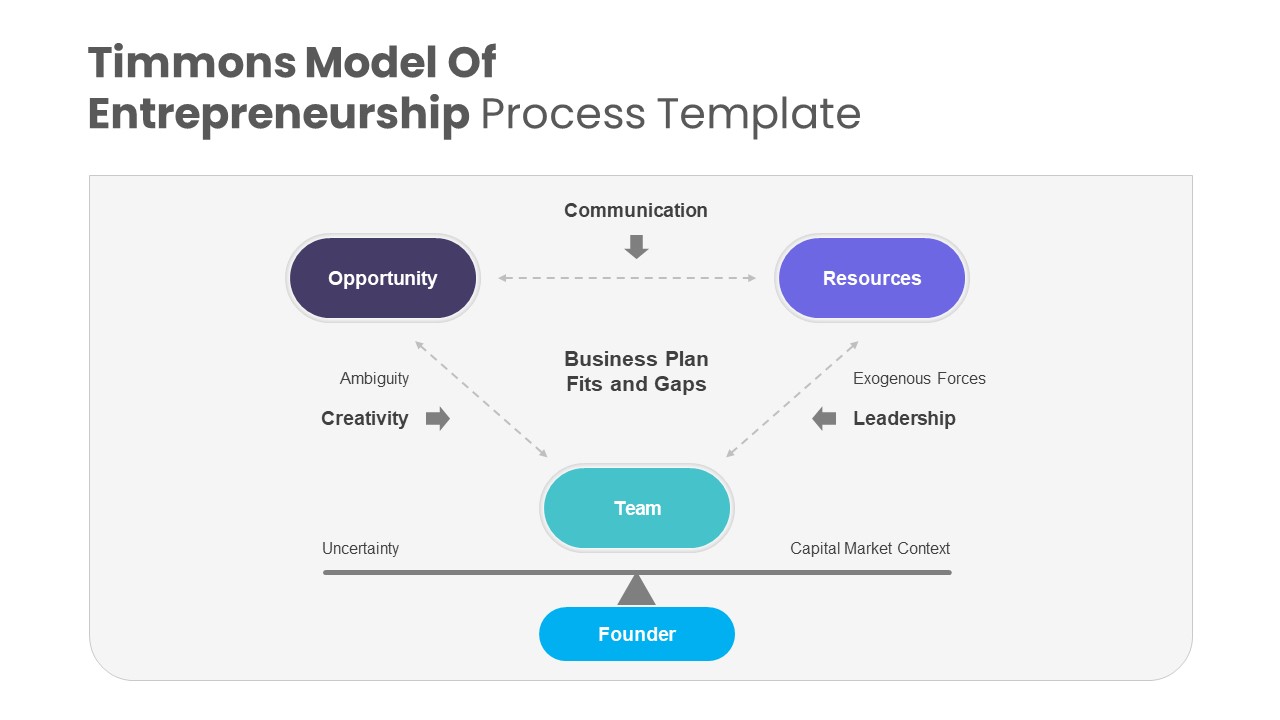
Timmons Model of Entrepreneurship Process Template for PowerPoint & Google Slides
Business Models
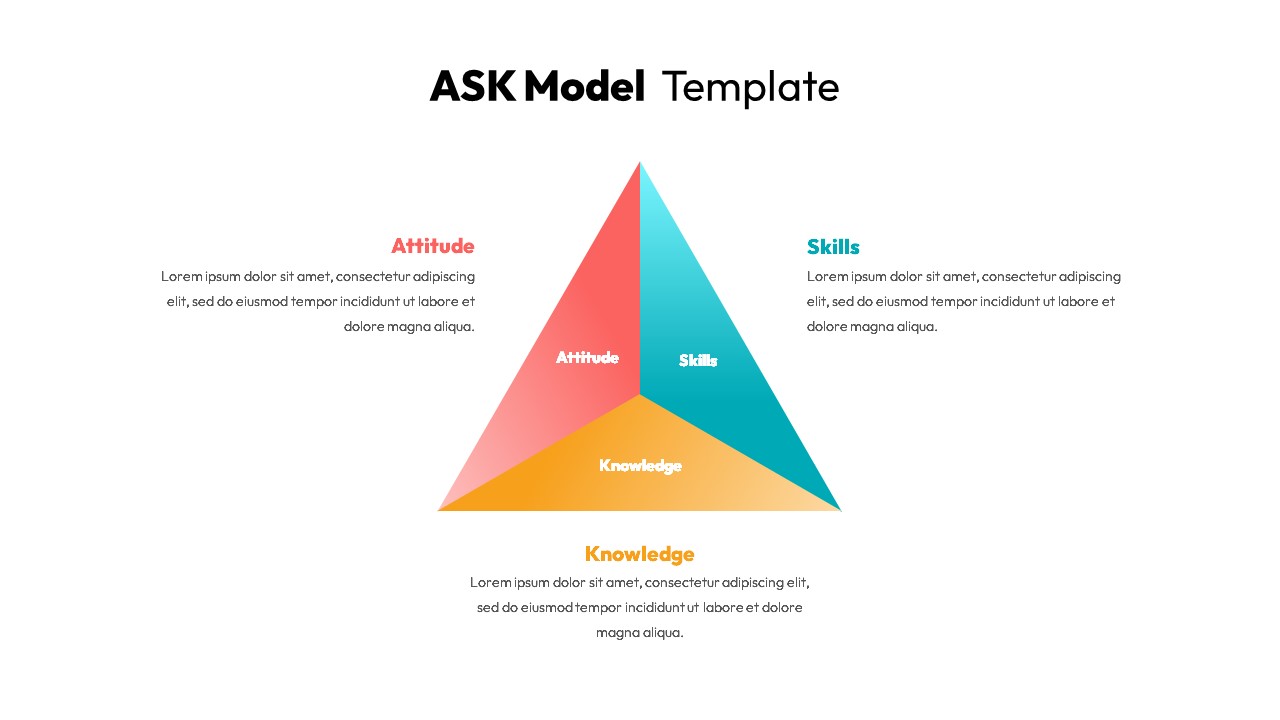
Professional ASK Model Template for PowerPoint & Google Slides
Employee Performance
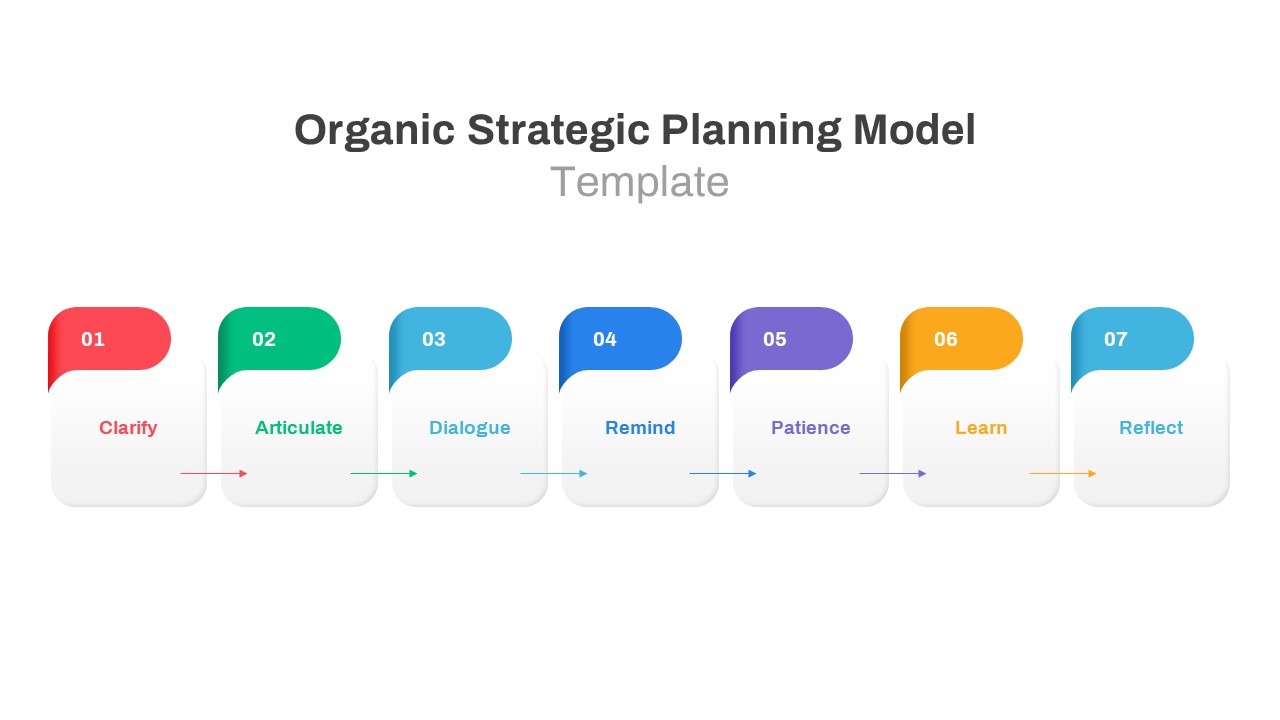
Organic Strategic Planning Model Template for PowerPoint & Google Slides
Business Strategy
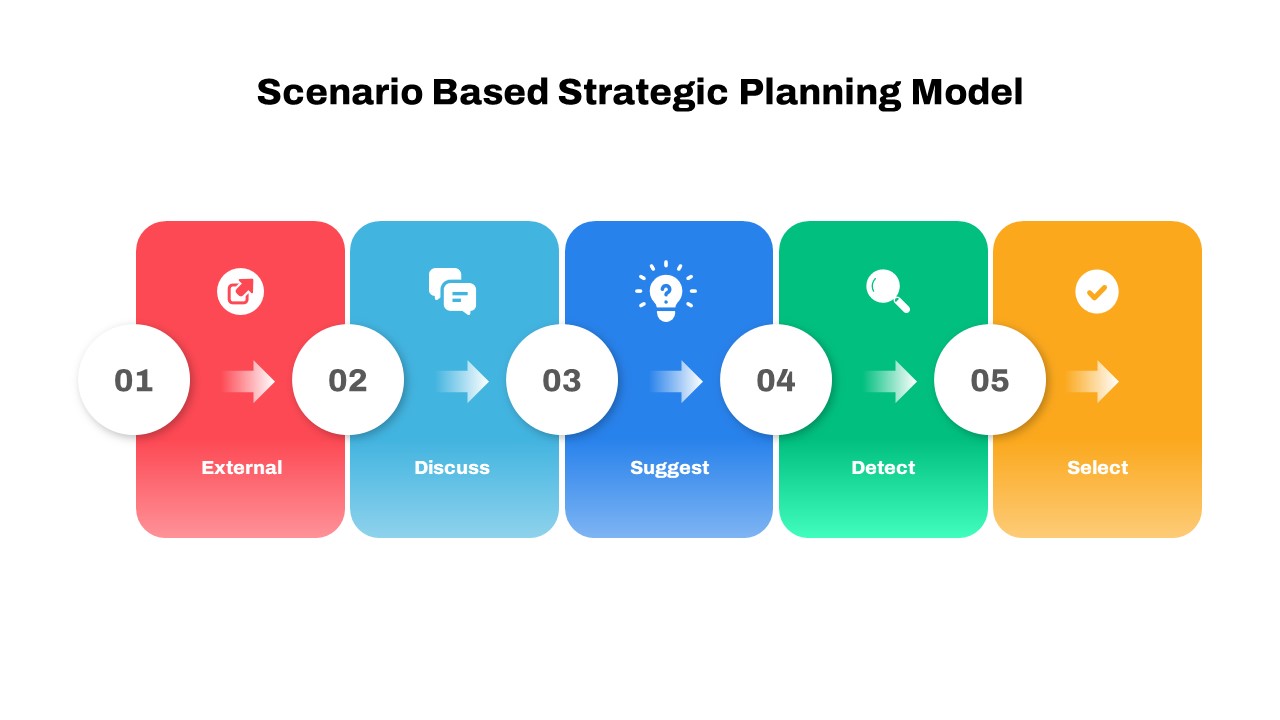
Scenario-Based Strategic Plan Model Template for PowerPoint & Google Slides
Business Plan
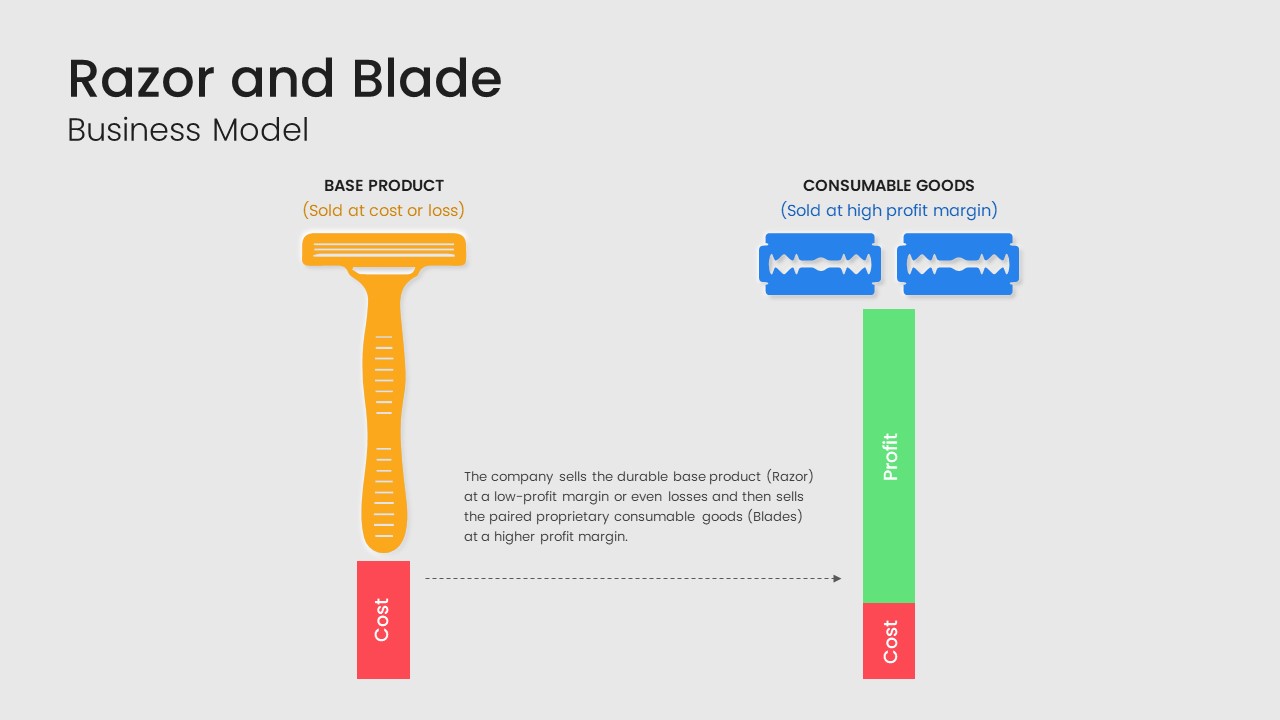
Razor and Blade Business Model Diagram Template for PowerPoint & Google Slides
Business Models
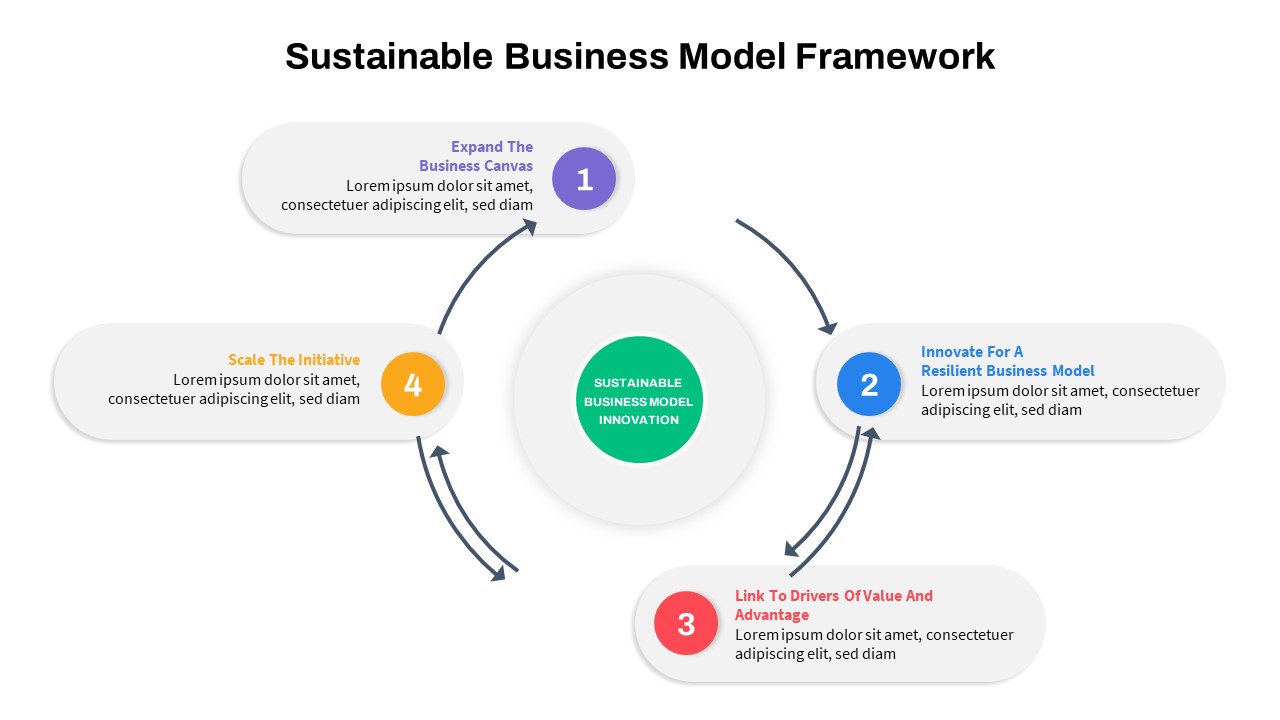
Sustainable Business Model Circular Infographic Template for PowerPoint & Google Slides
Business Strategy
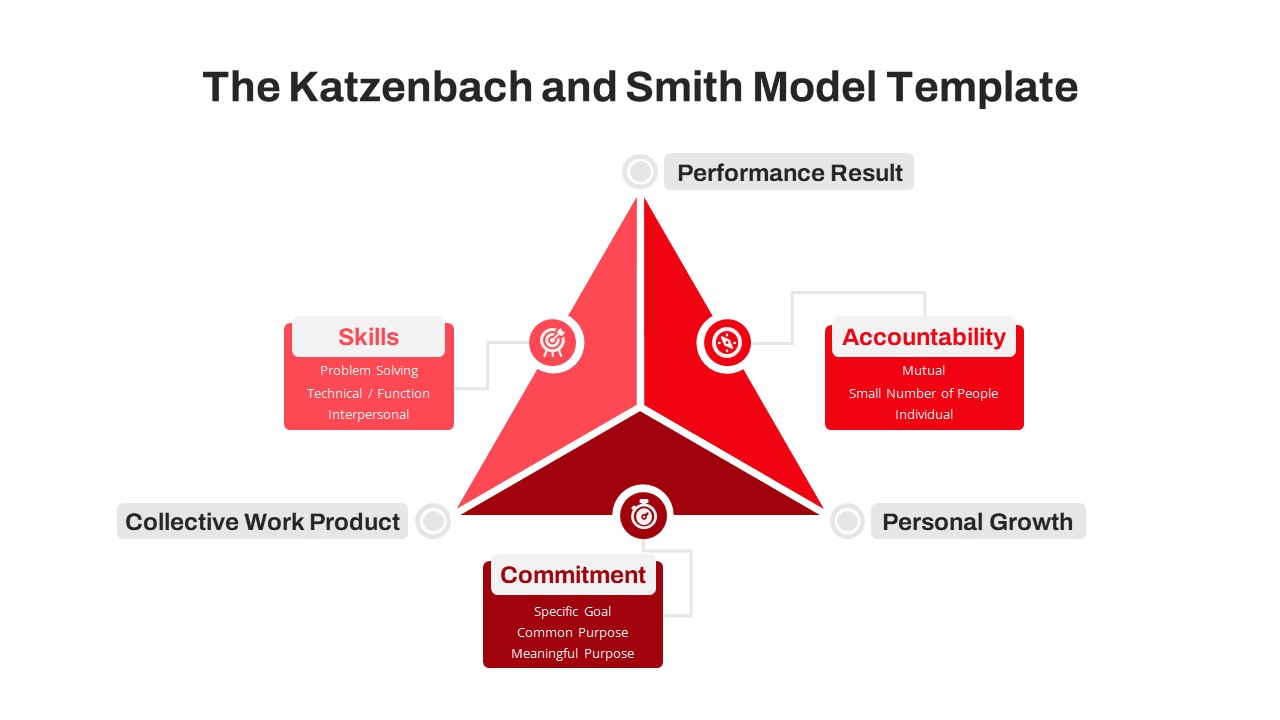
Katzenbach & Smith Model Pyramid Template for PowerPoint & Google Slides
Pyramid
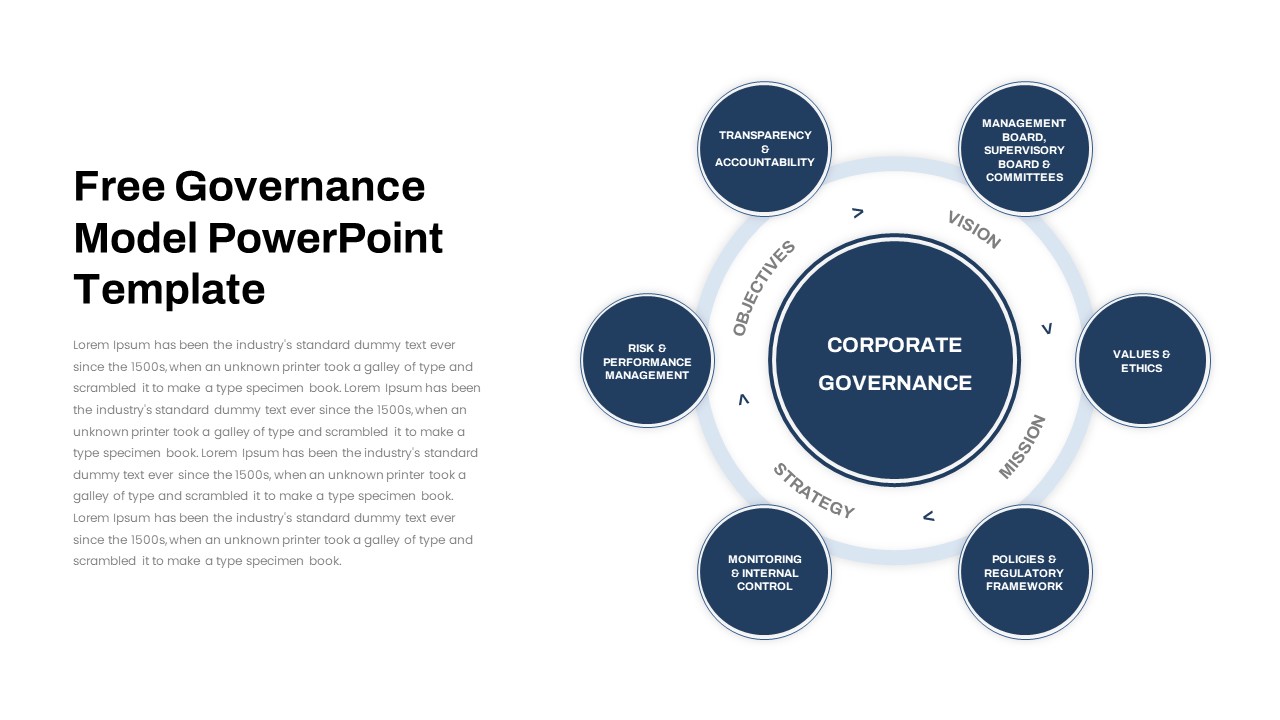
Free Corporate Governance Circular Model Template for PowerPoint & Google Slides
Circular
Free
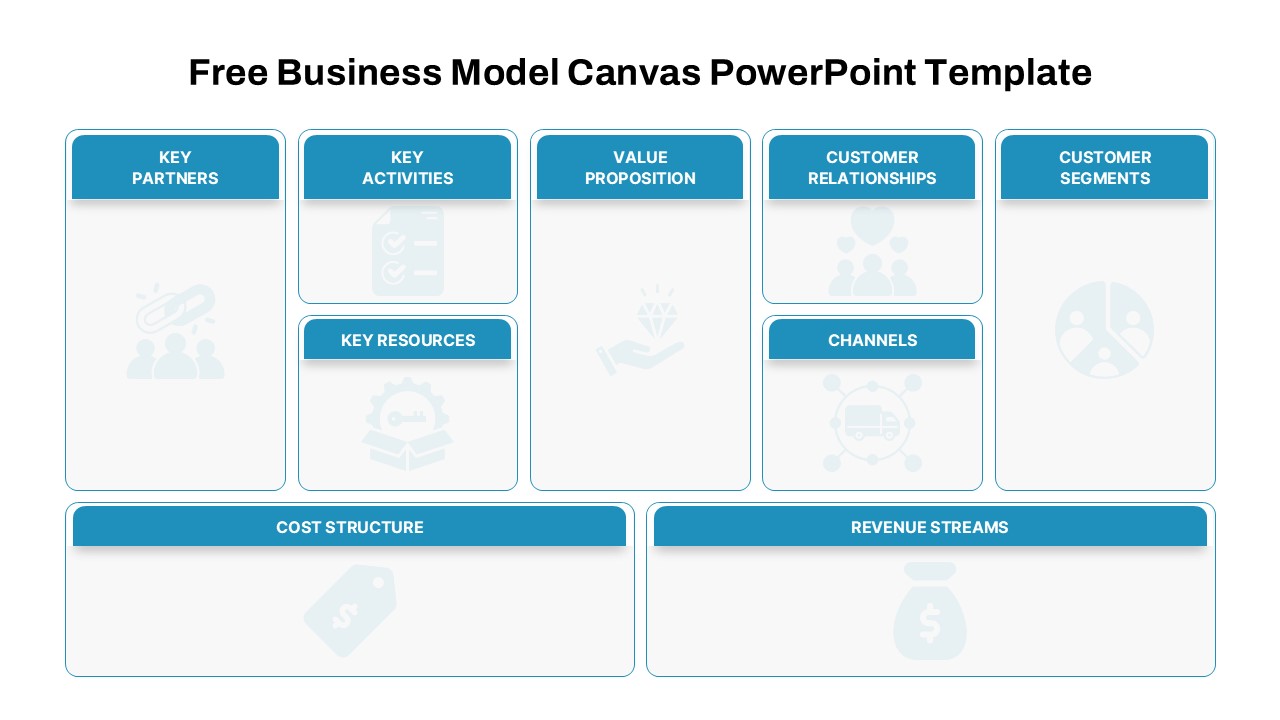
Free Business Model Canvas Diagram Slide Template for PowerPoint & Google Slides
Business Models
Free
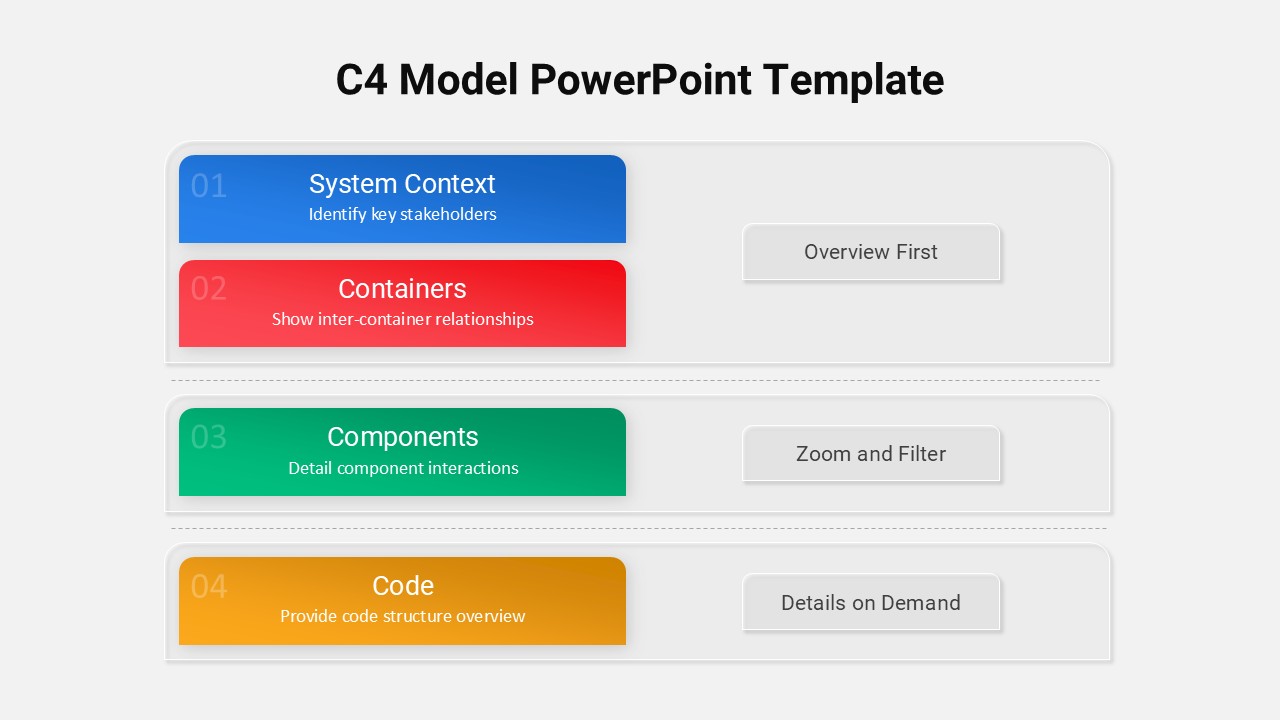
C4 Model Architecture Overview Template for PowerPoint & Google Slides
Software Development
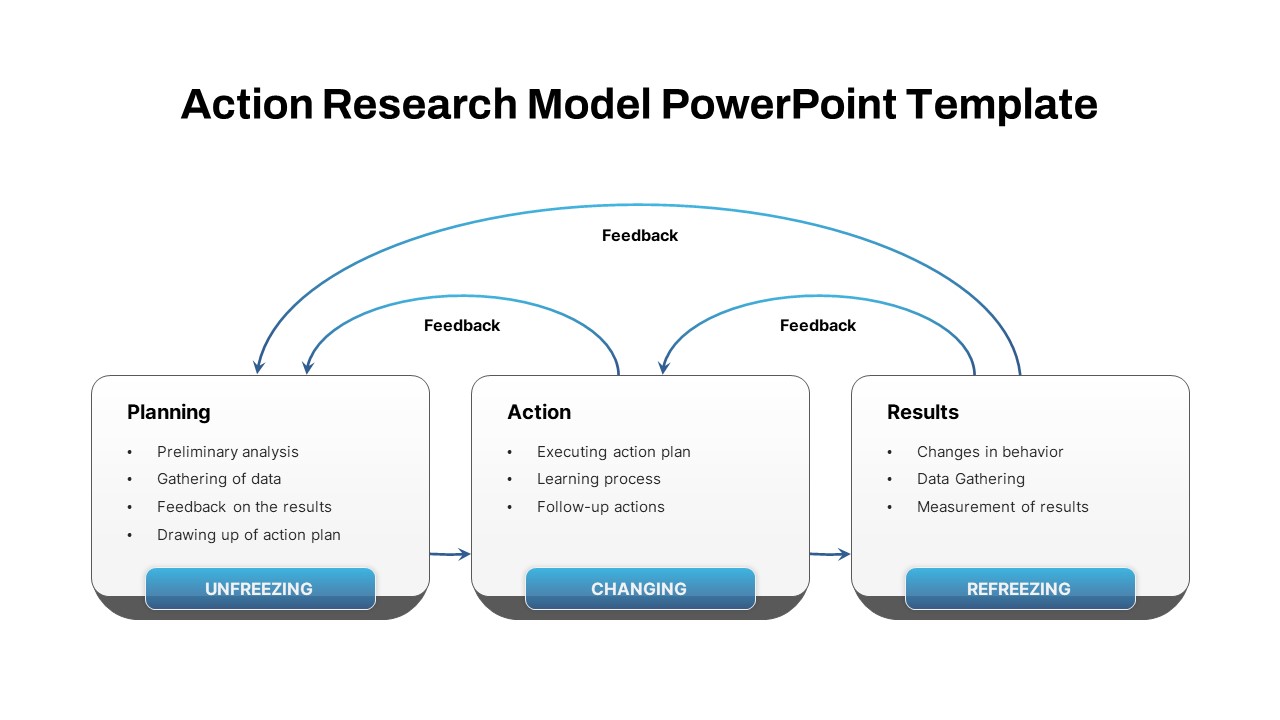
Action Research Feedback Process Model Template for PowerPoint & Google Slides
Process
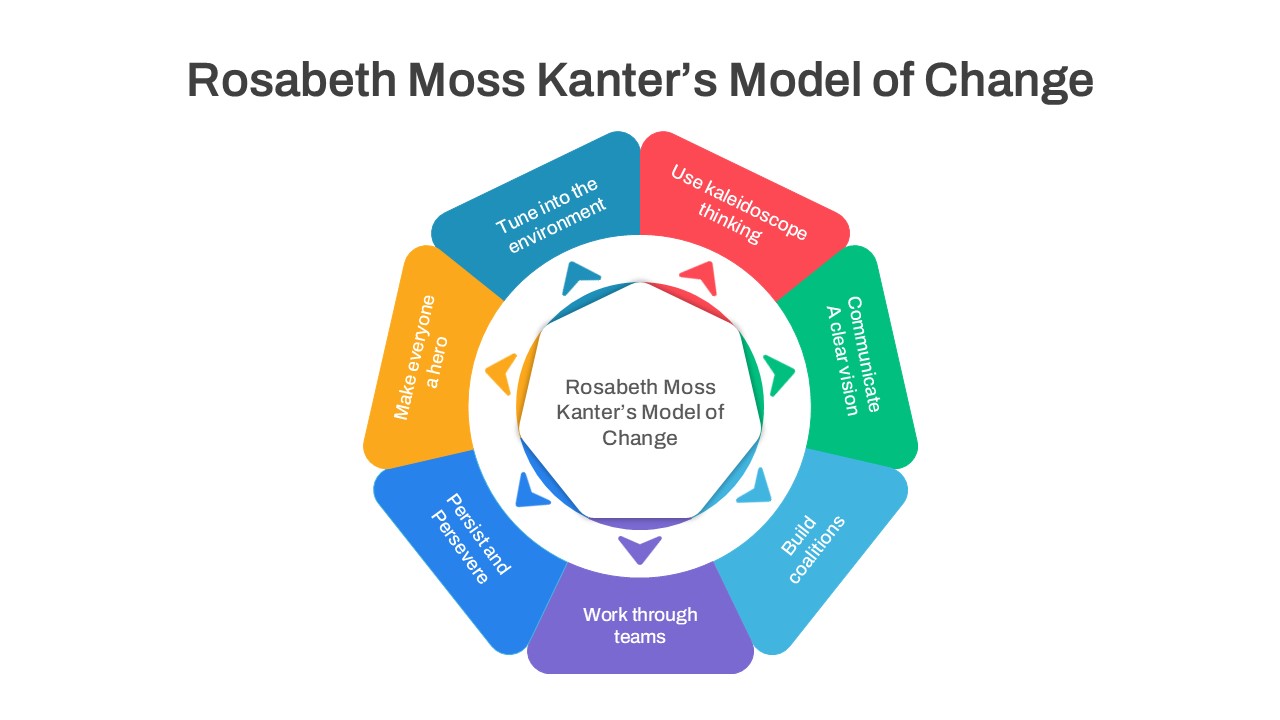
Rosabeth Moss Kanter’s Model of Change Template for PowerPoint & Google Slides
Circular
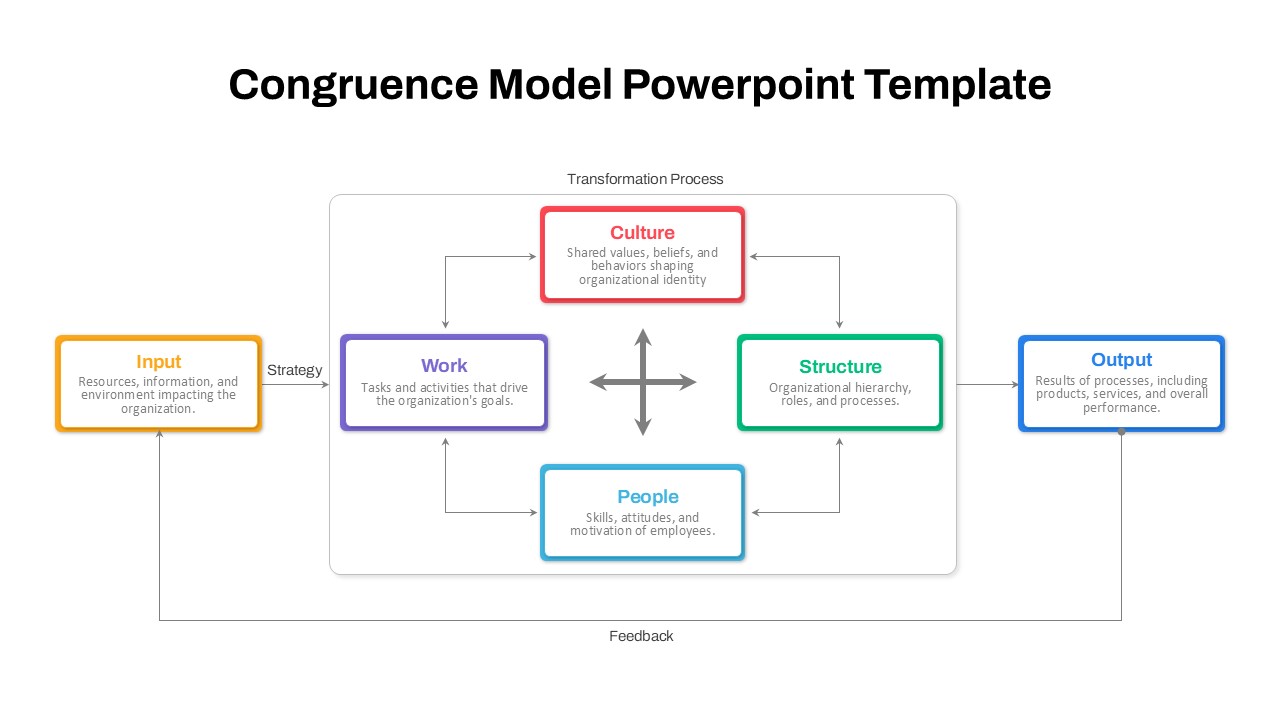
Organizational Congruence Model Diagram Template for PowerPoint & Google Slides
Process
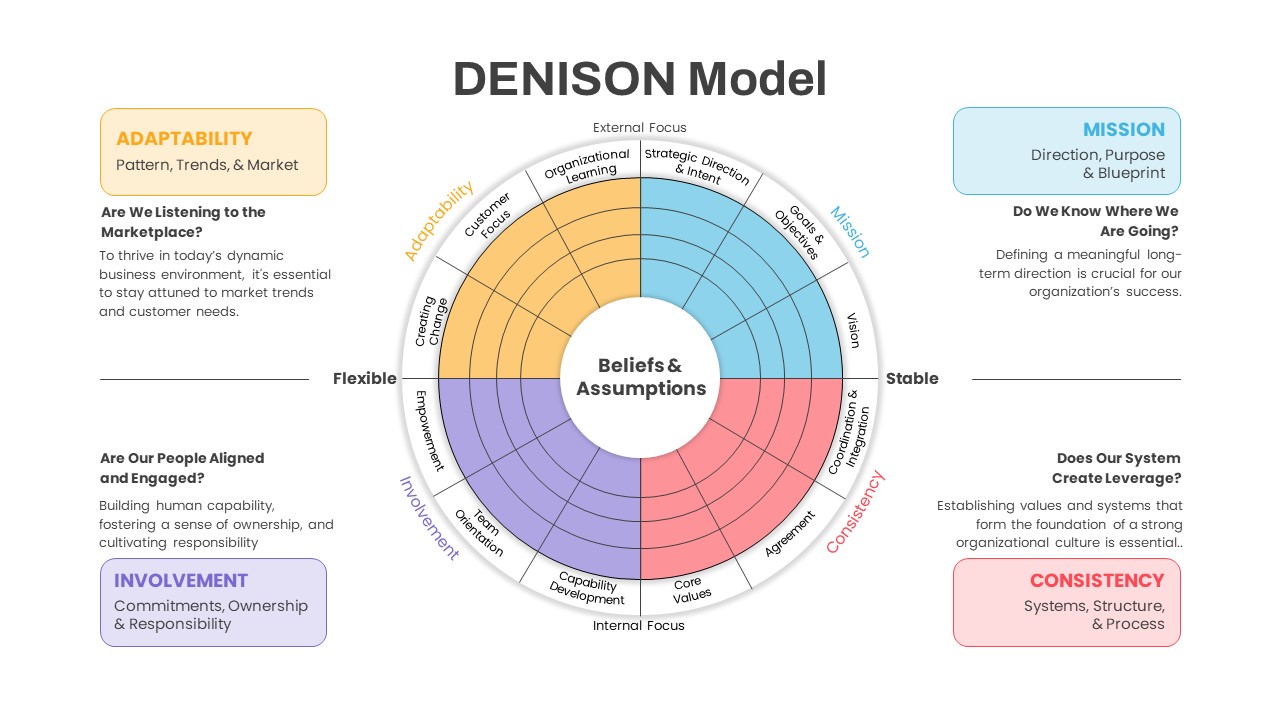
Denison Culture Model Wheel template for PowerPoint & Google Slides
Leadership
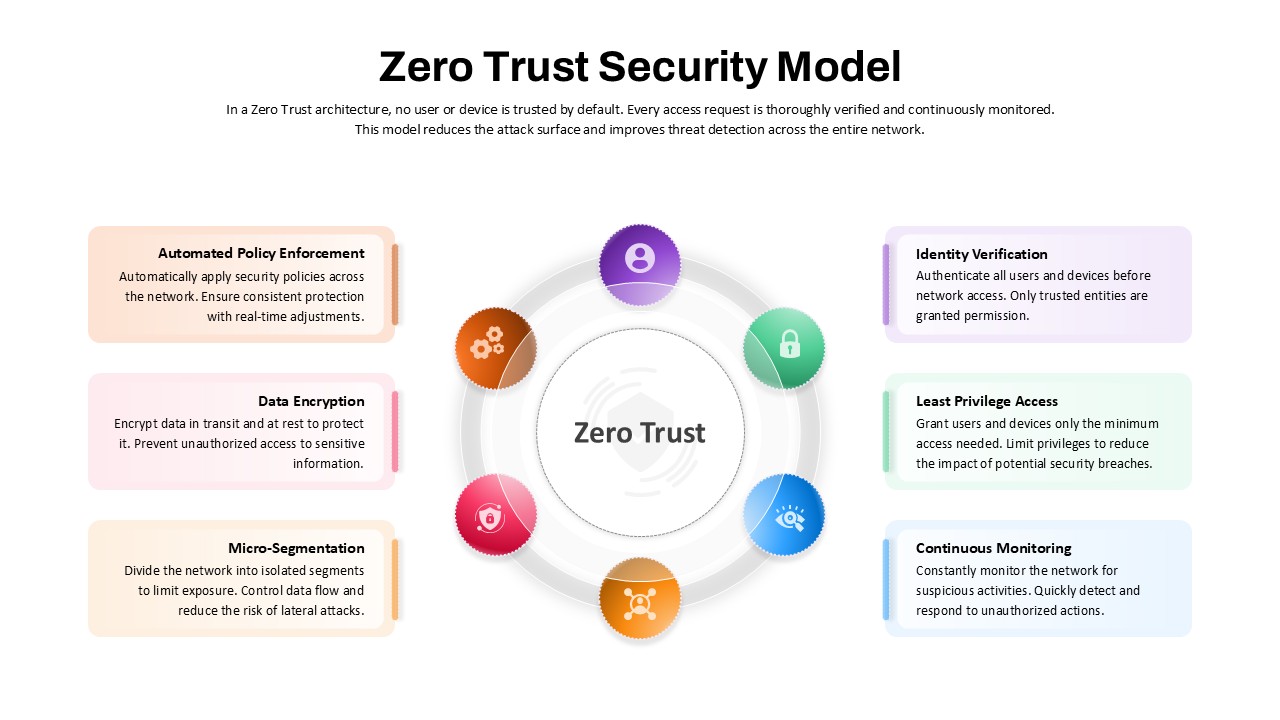
Zero Trust Security Model Overview template for PowerPoint & Google Slides
Infographics
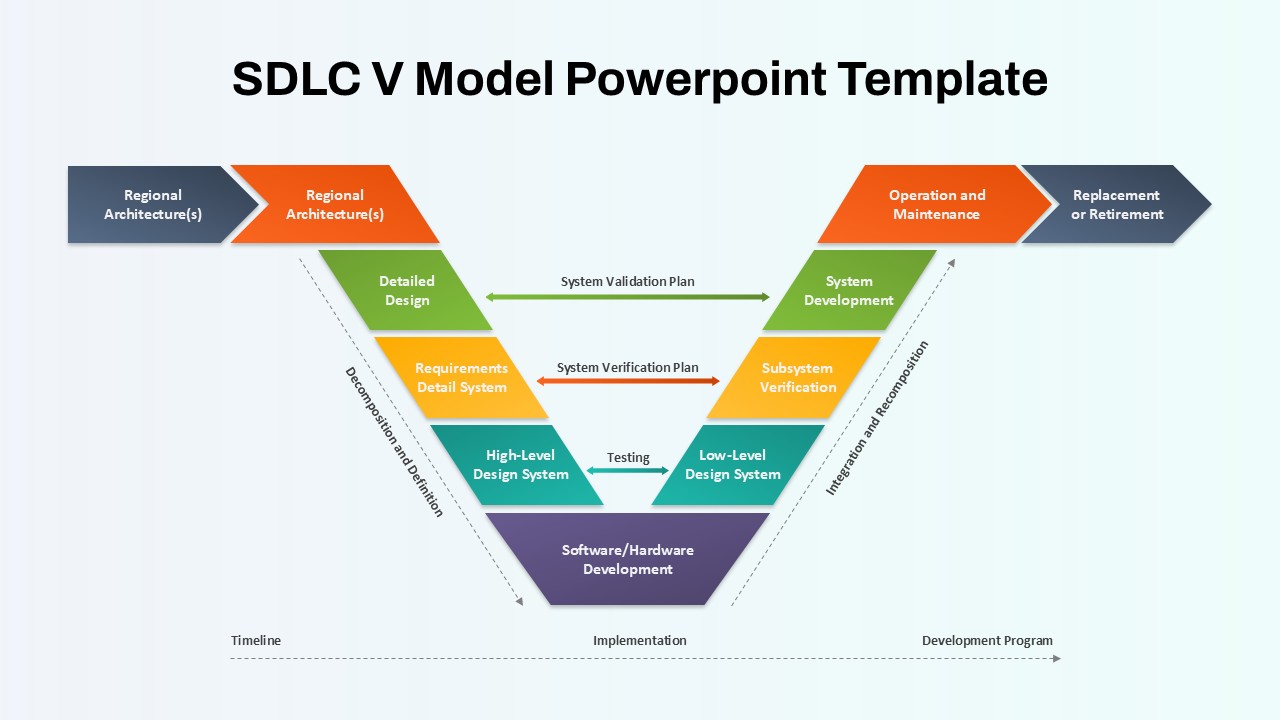
SDLC V Model Lifecycle Diagram Template for PowerPoint & Google Slides
Process
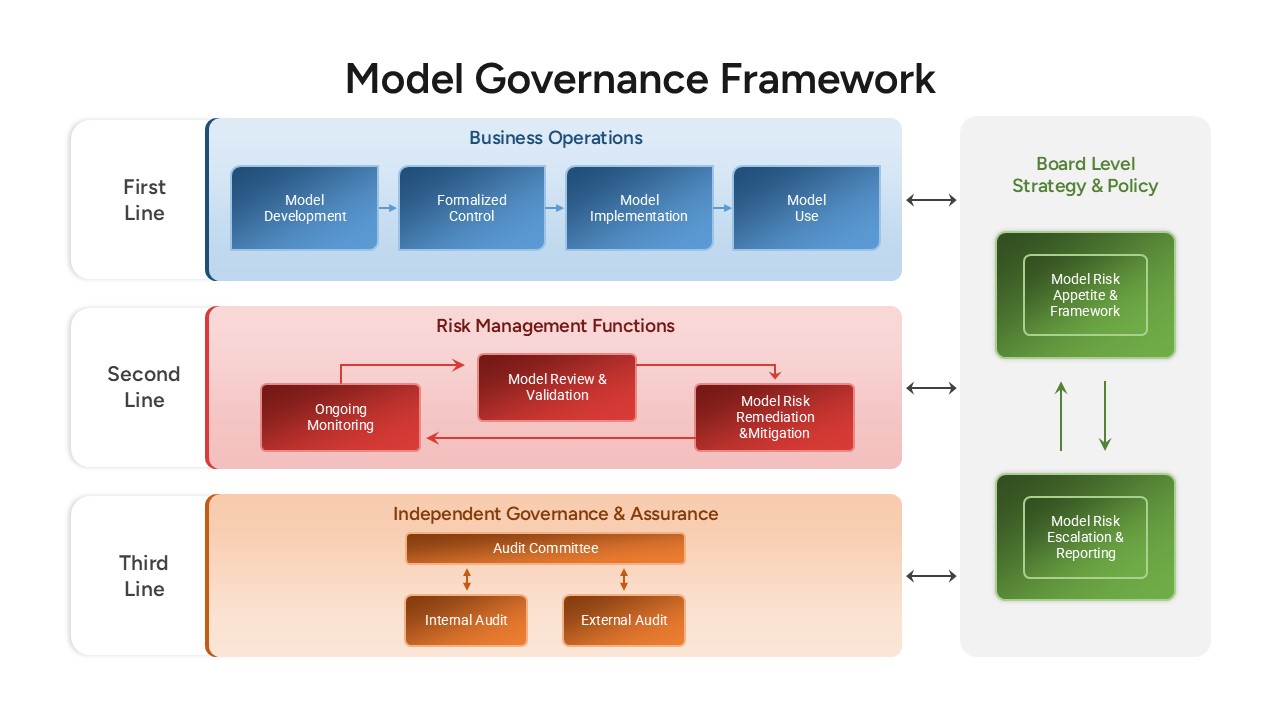
Model Governance Framework Template for PowerPoint & Google Slides
Risk Management
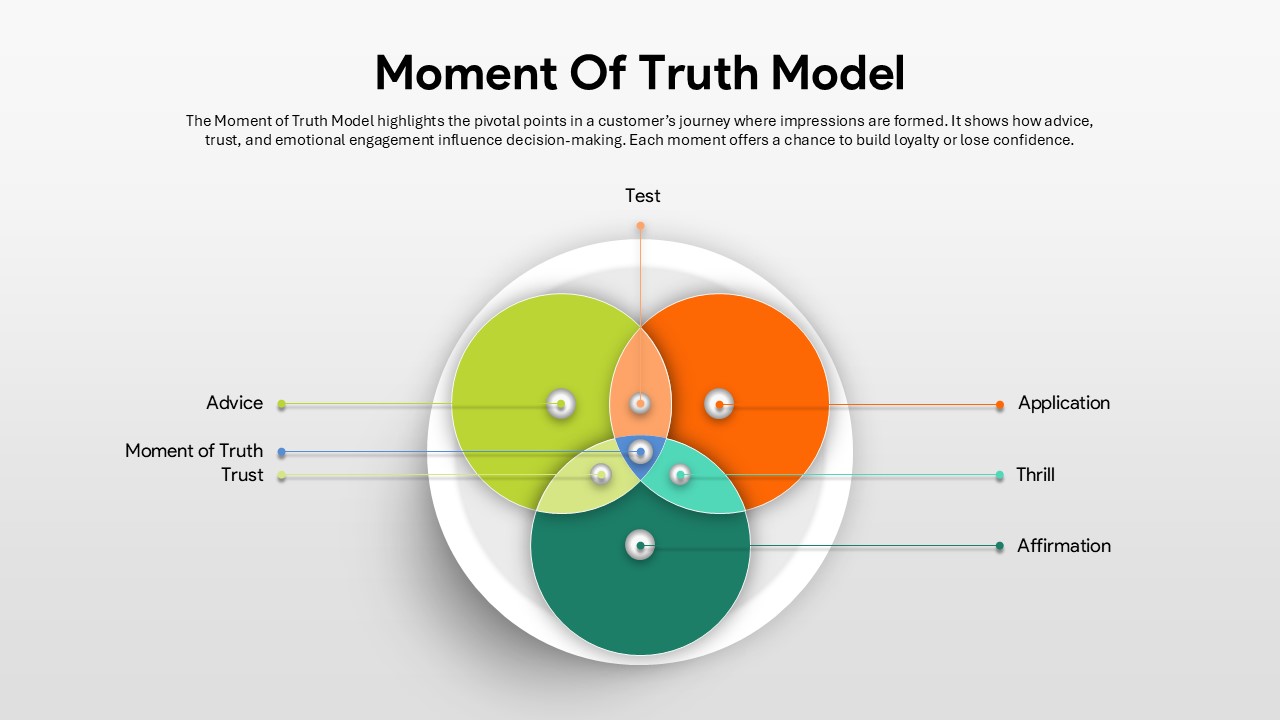
Moment of Truth Model Overview template for PowerPoint & Google Slides
Process
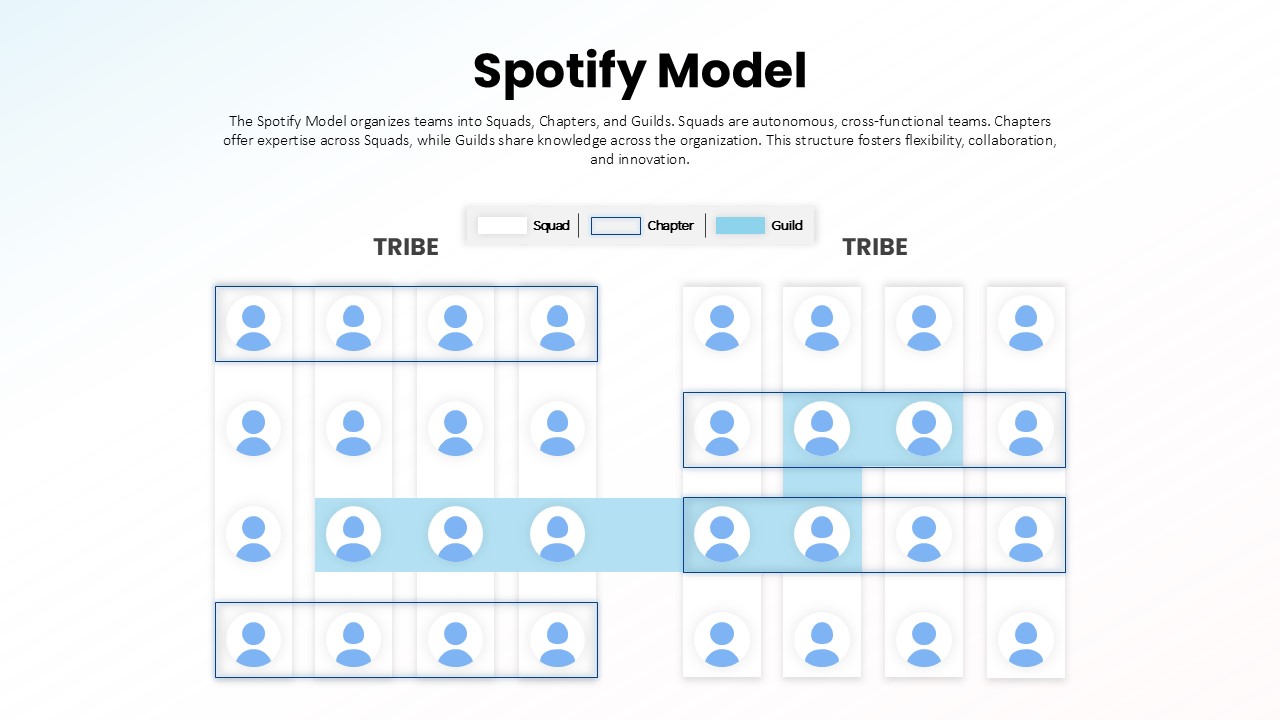
Spotify Model Organizational Structure template for PowerPoint & Google Slides
Business Strategy
Zero Trust Security Model Overview template for PowerPoint & Google Slides
Risk Management
Leadership Pipeline Model Overview template for PowerPoint & Google Slides
Leadership
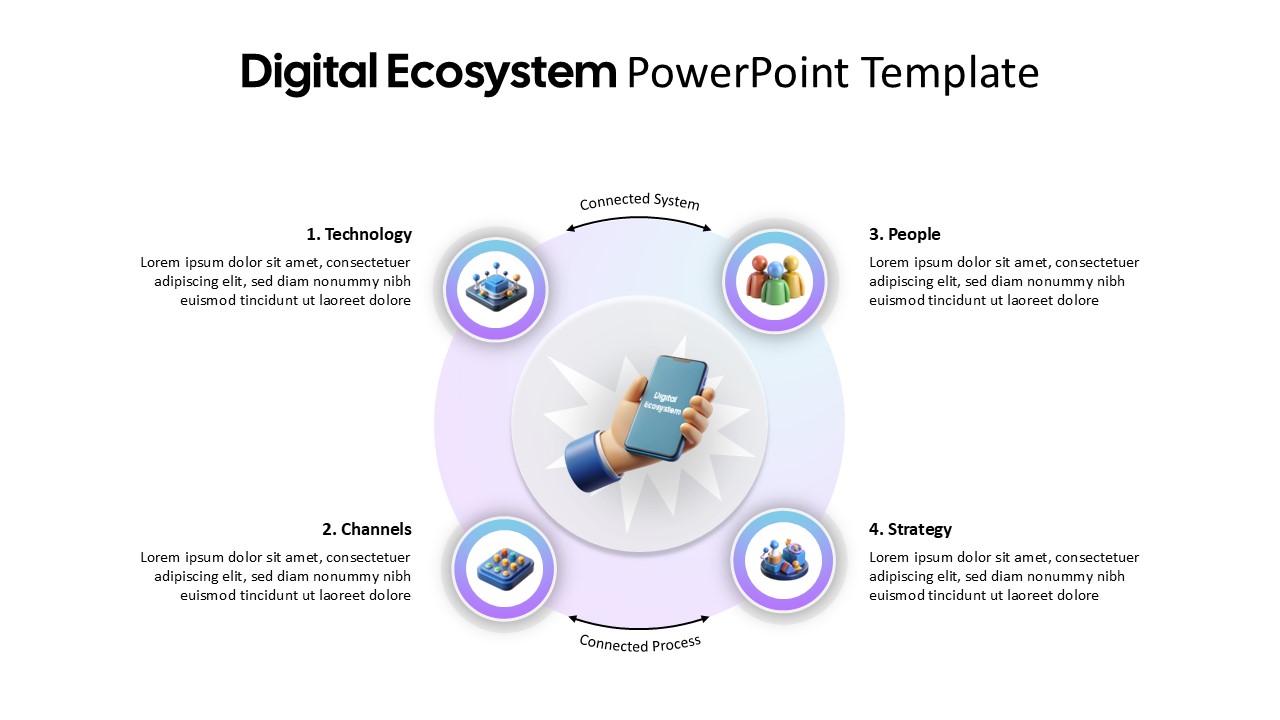
Digital Ecosystem Circular Model Template for PowerPoint & Google Slides
Information Technology
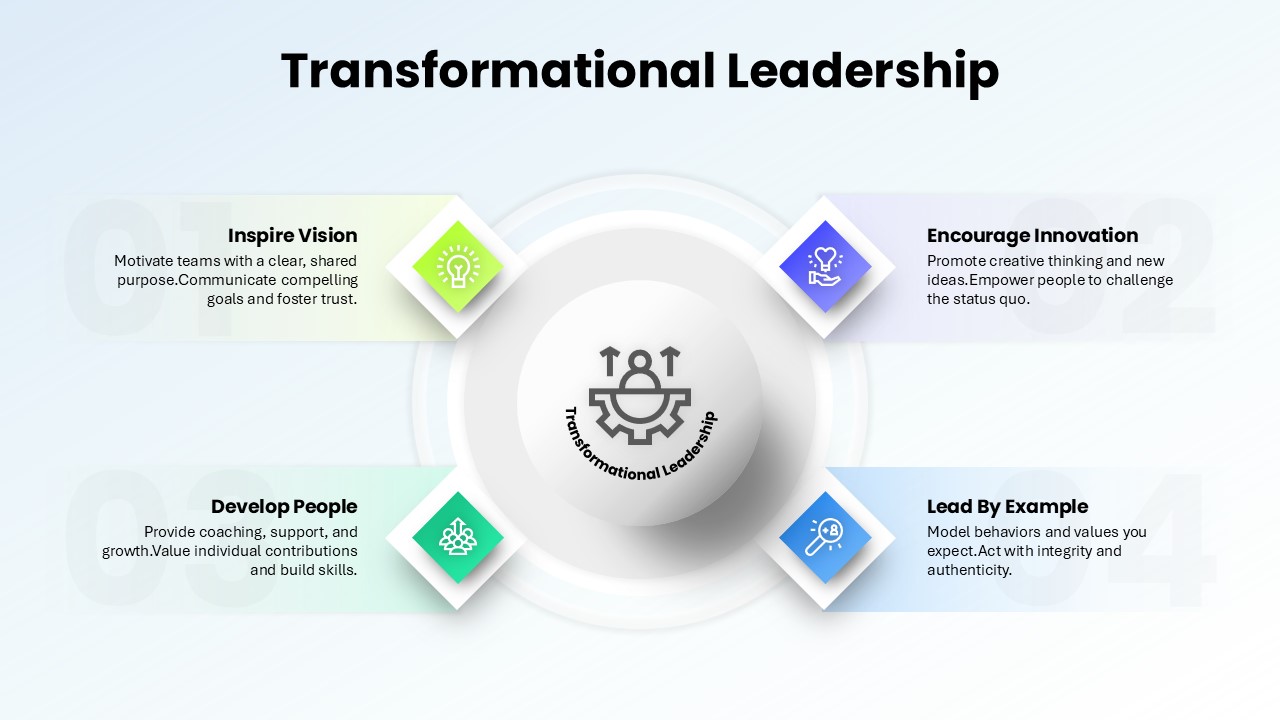
Transformational Leadership Model Template for PowerPoint & Google Slides
Leadership
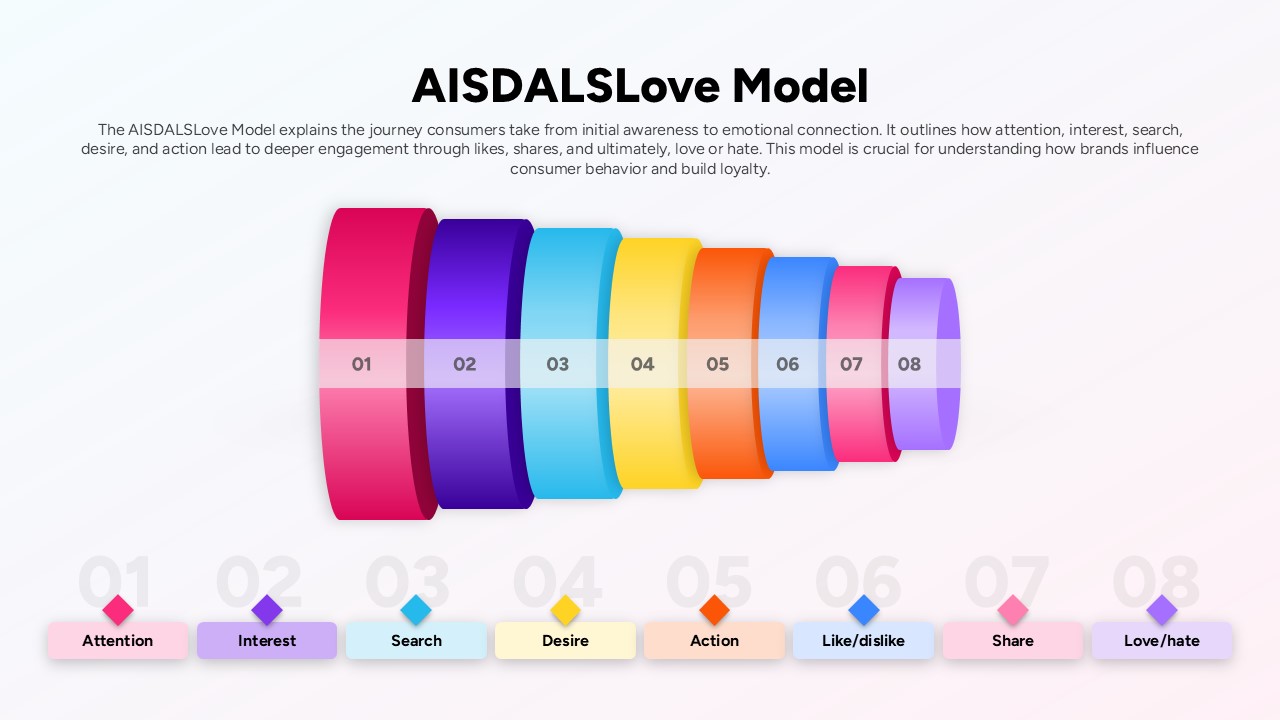
AISDALSLove Consumer Journey Model Slide Template for PowerPoint & Google Slides
Customer Journey
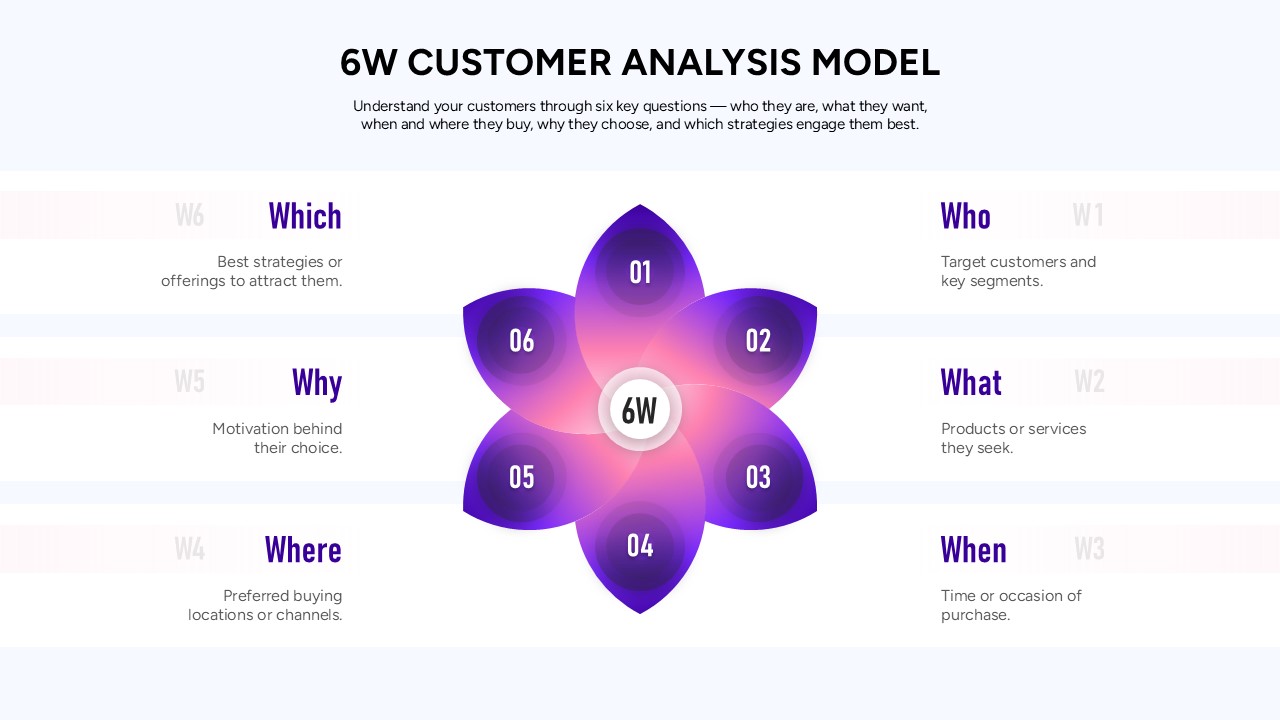
6W Customer Analysis Model Template for PowerPoint & Google Slides
Customer Experience
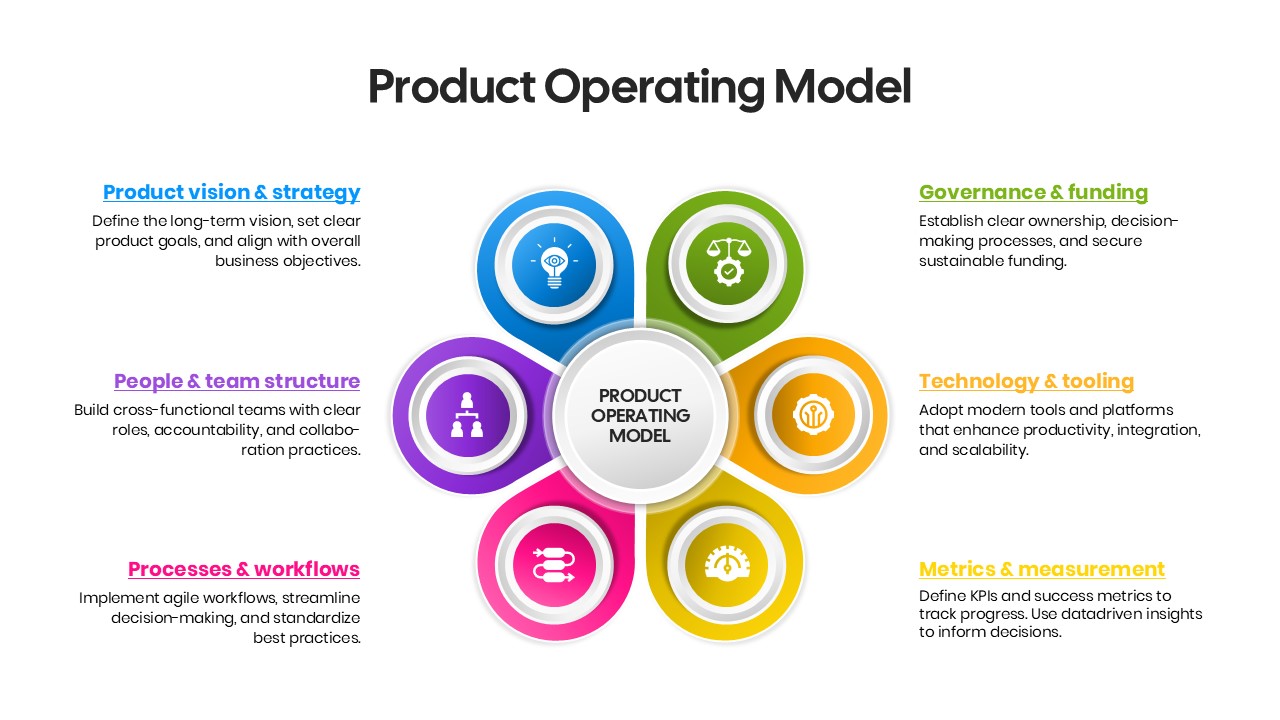
Product Operating Model Framework Template for PowerPoint & Google Slides
Business Strategy
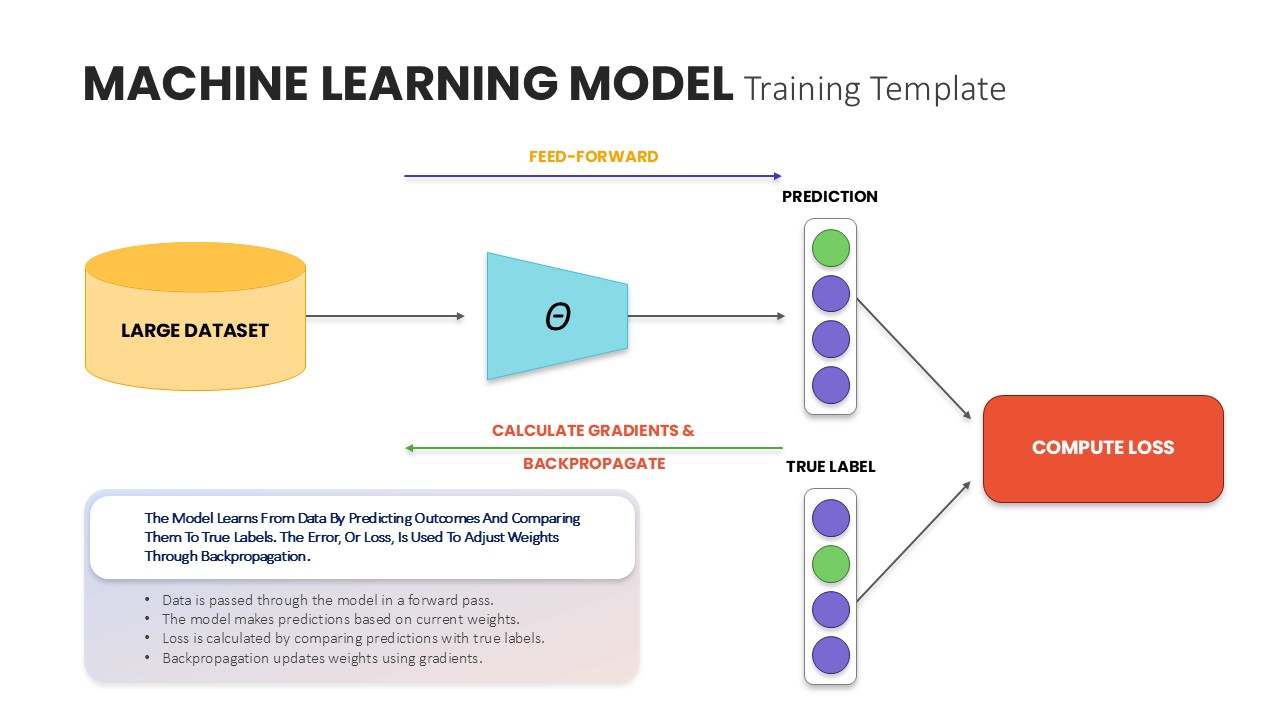
Machine Learning Model Training Template for PowerPoint & Google Slides
Machine Learning
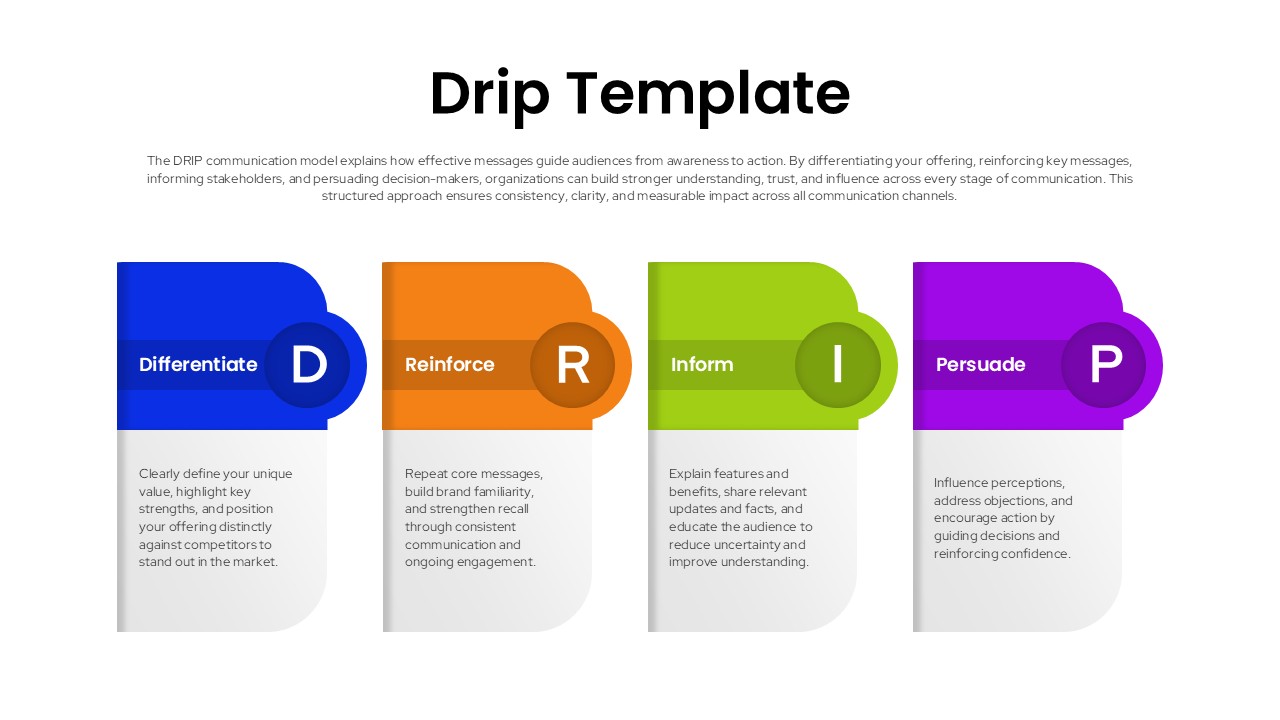
Drip Model Template for Microsoft PowerPoint & Google Slides
Marketing