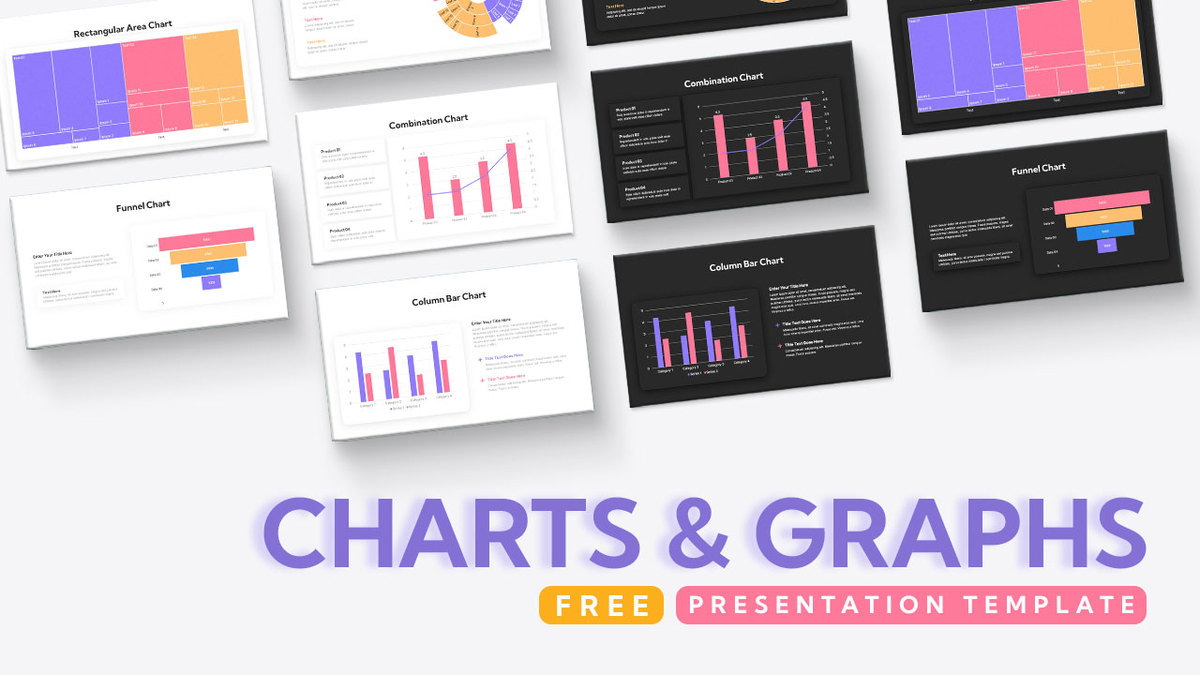
Free Comprehensive Charts & Graphs Template for PowerPoint & Google Slides


Description
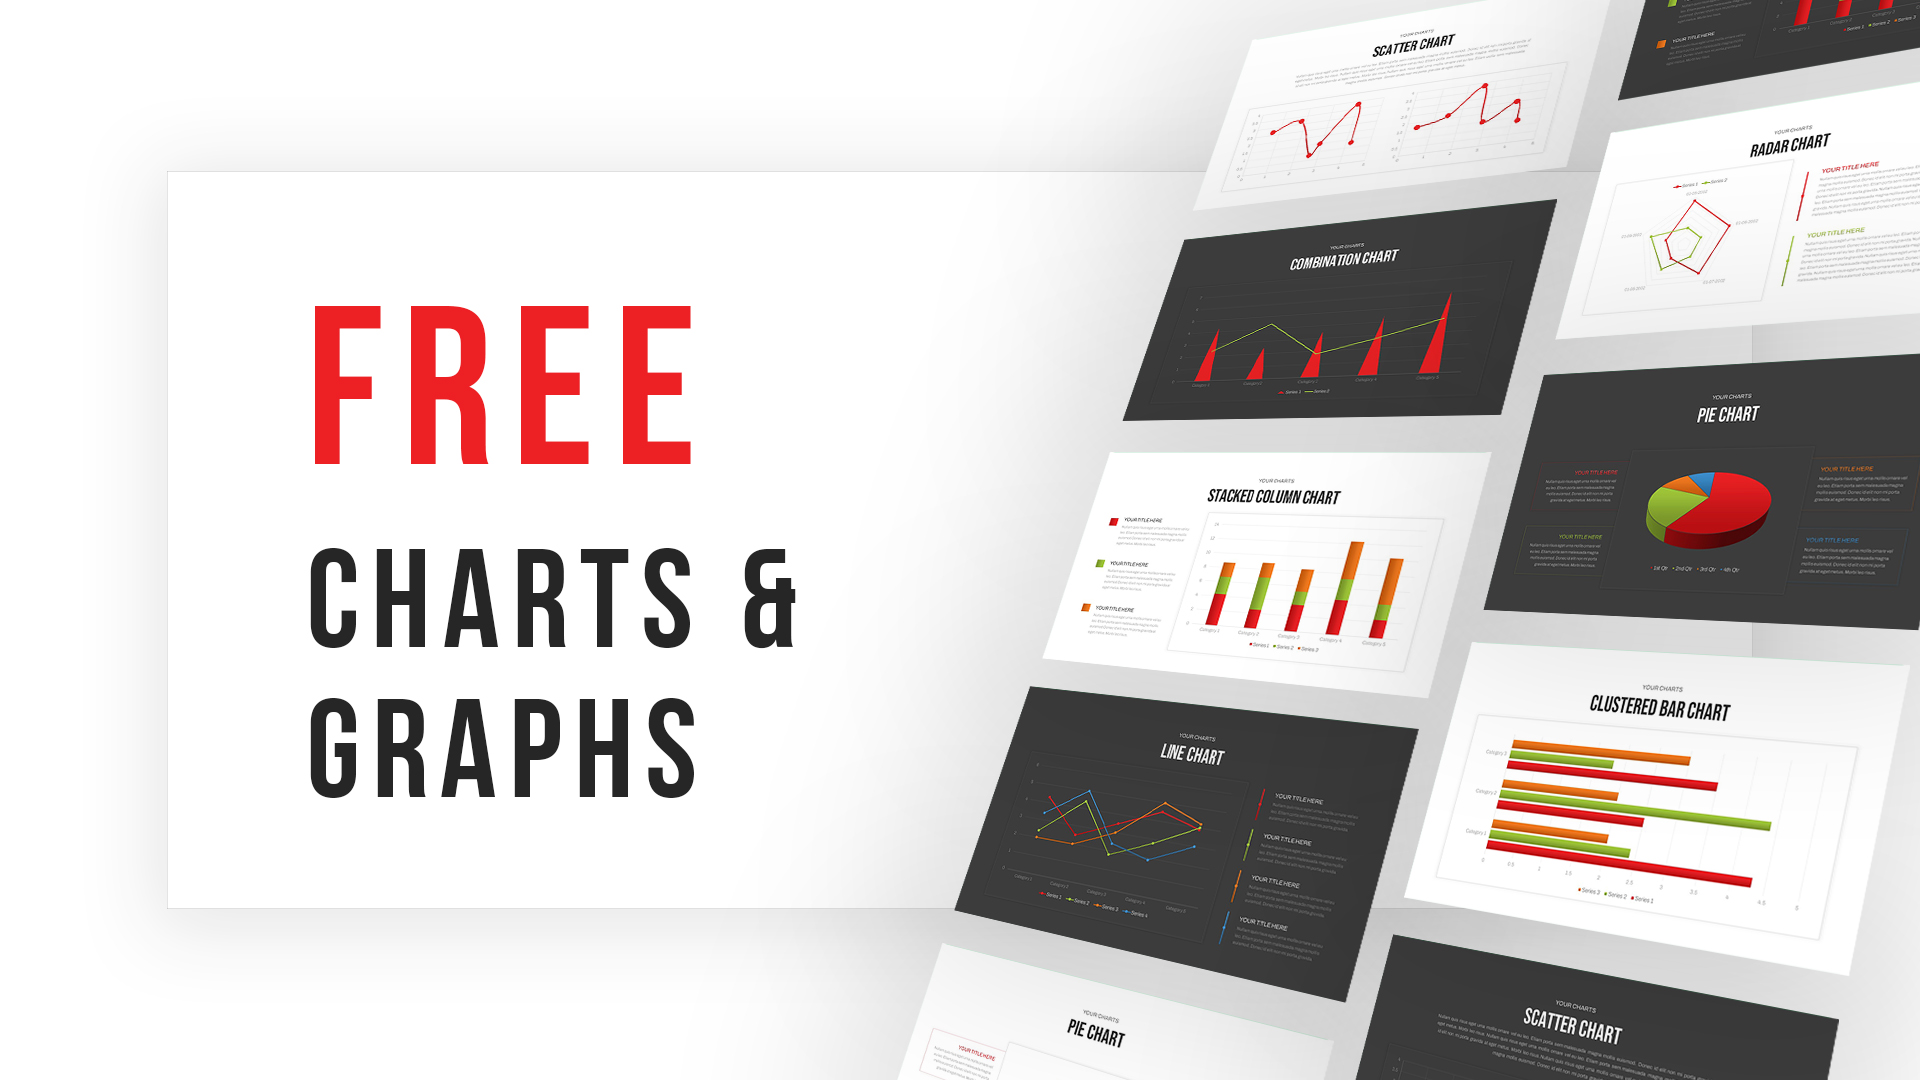
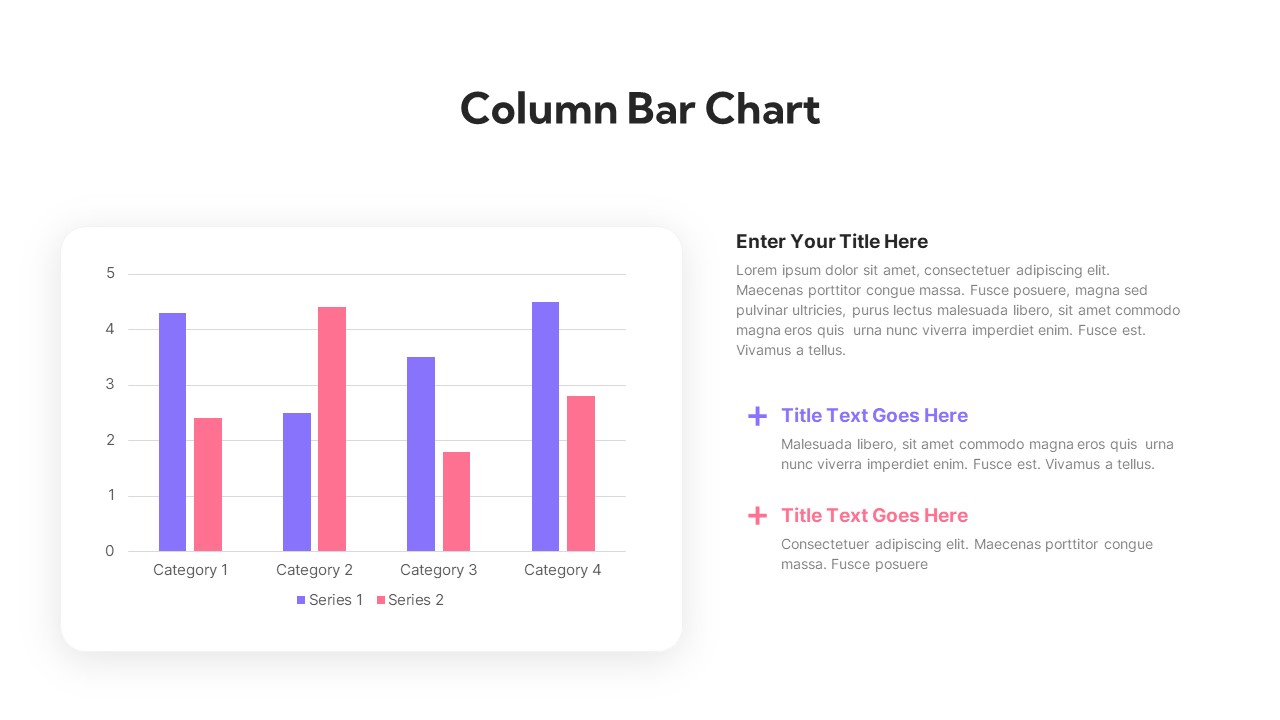
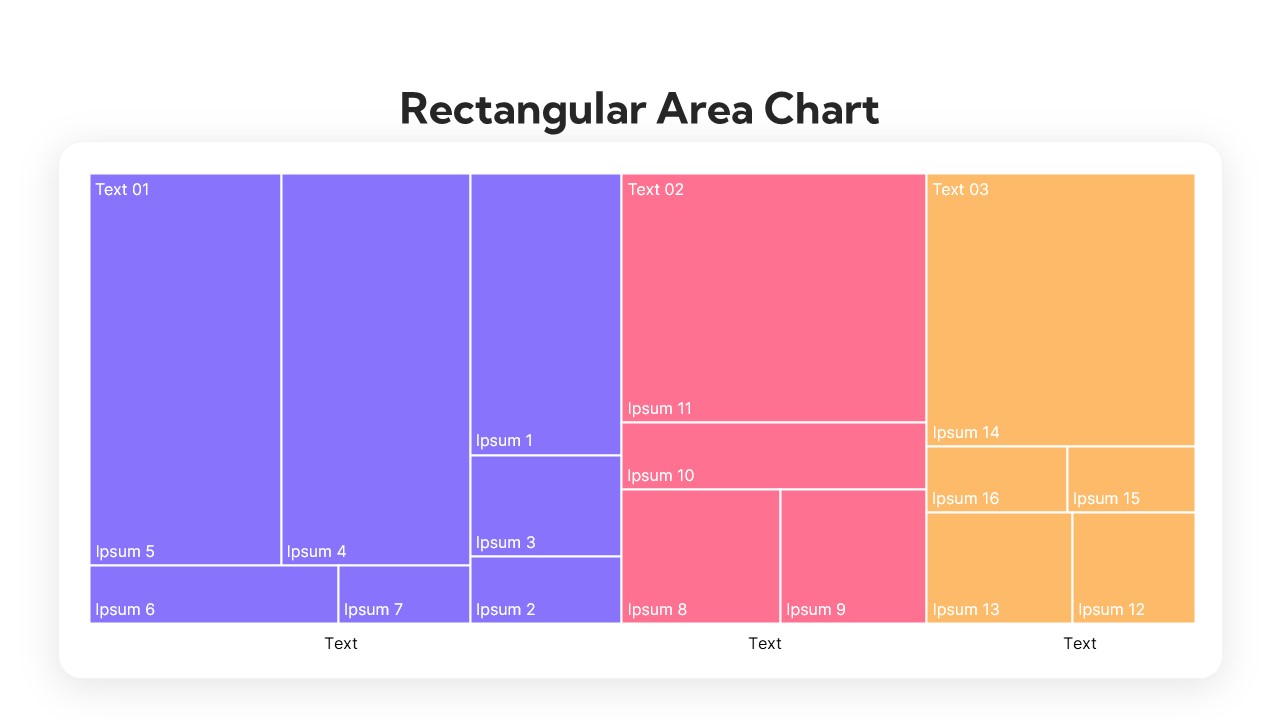
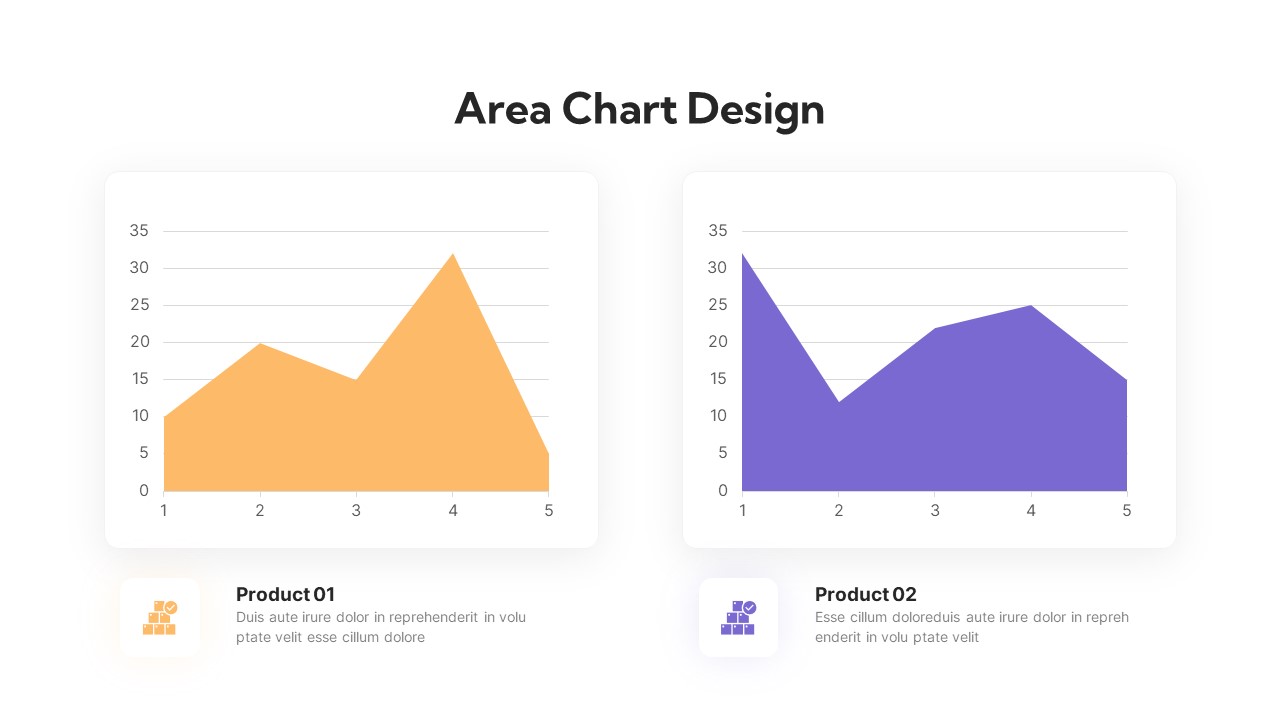
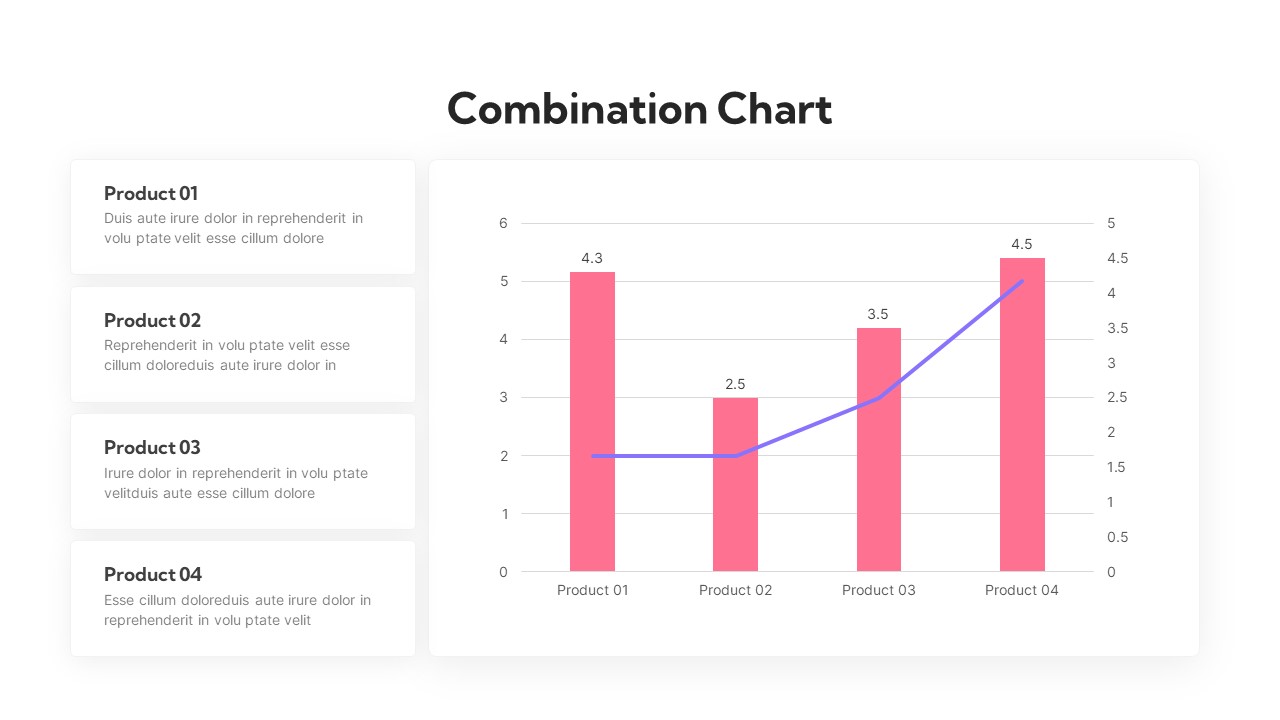
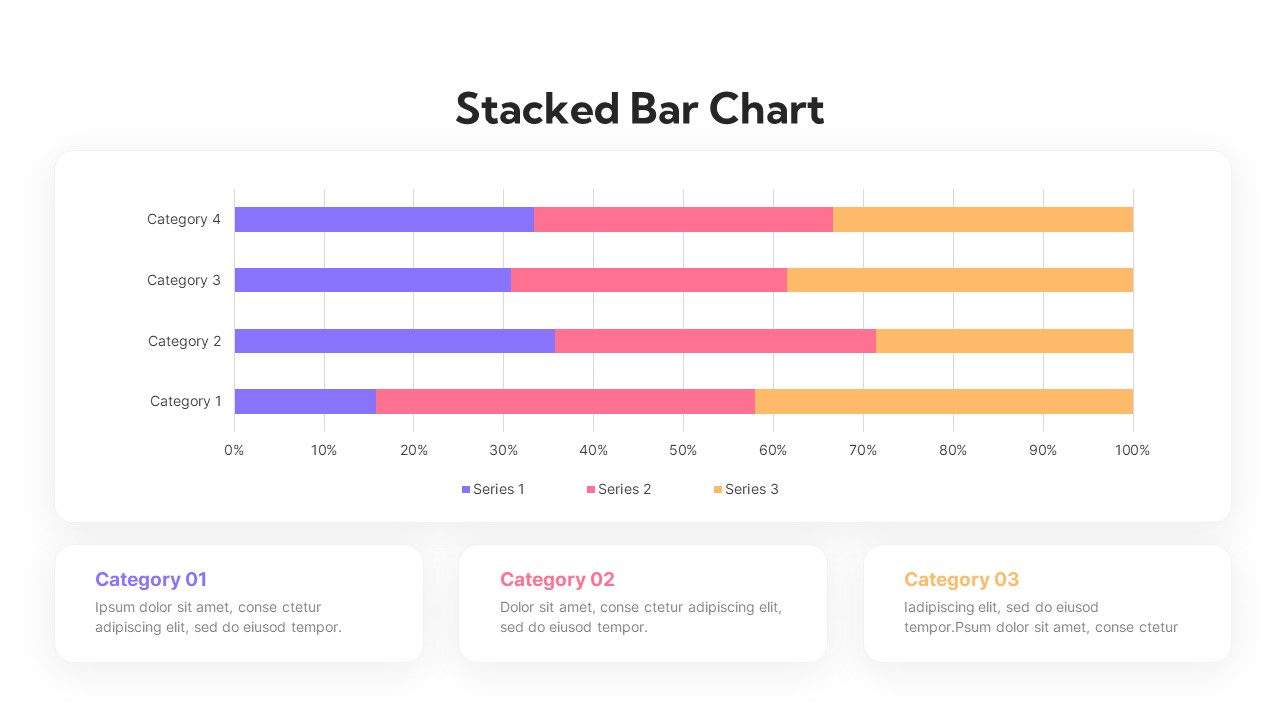
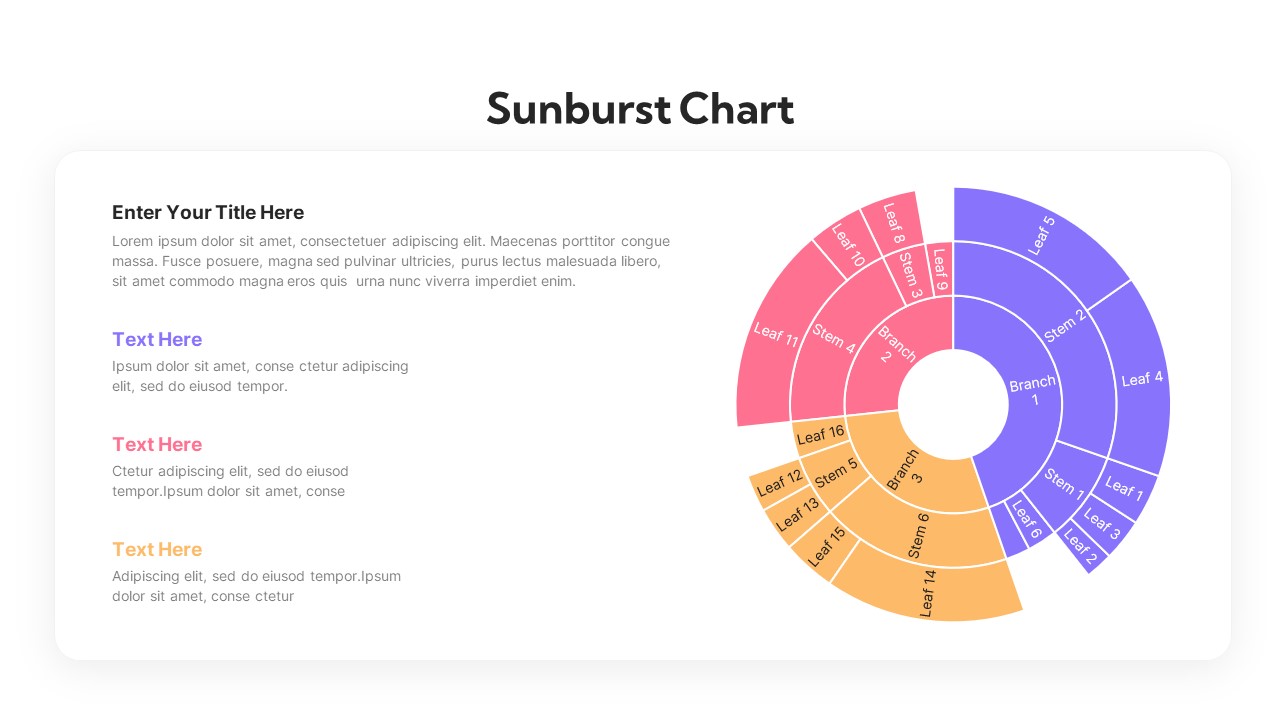
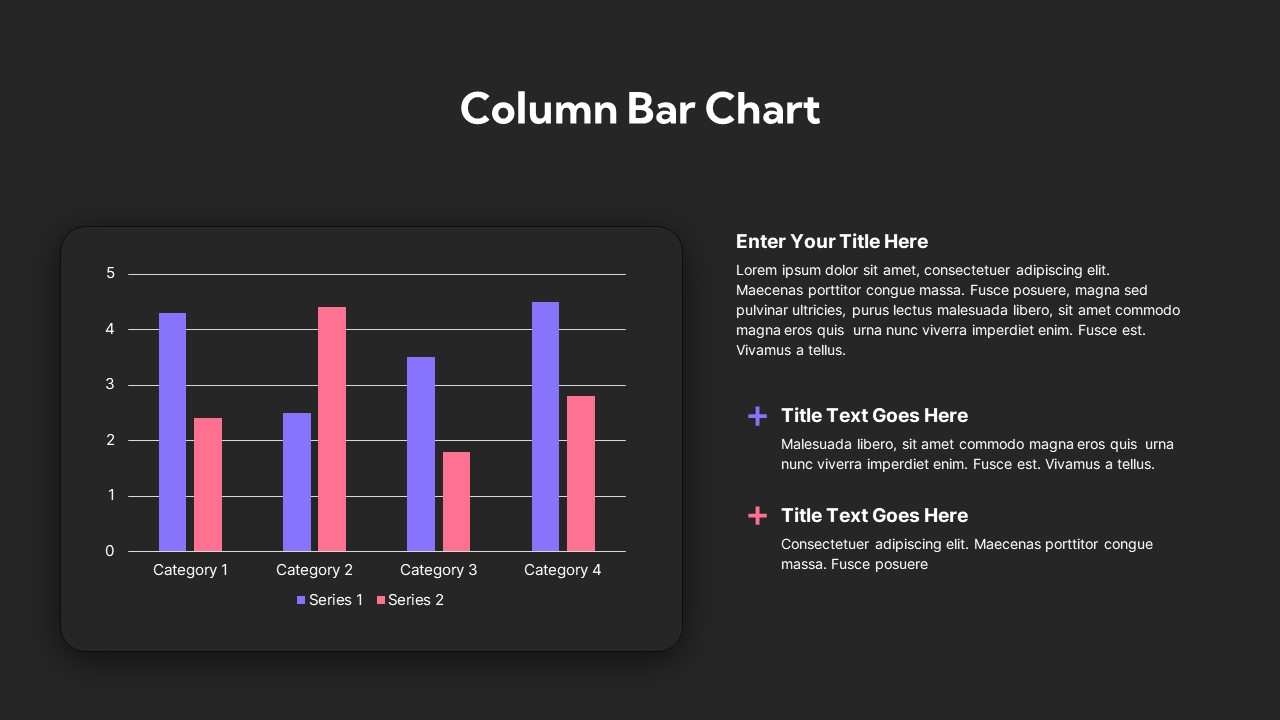
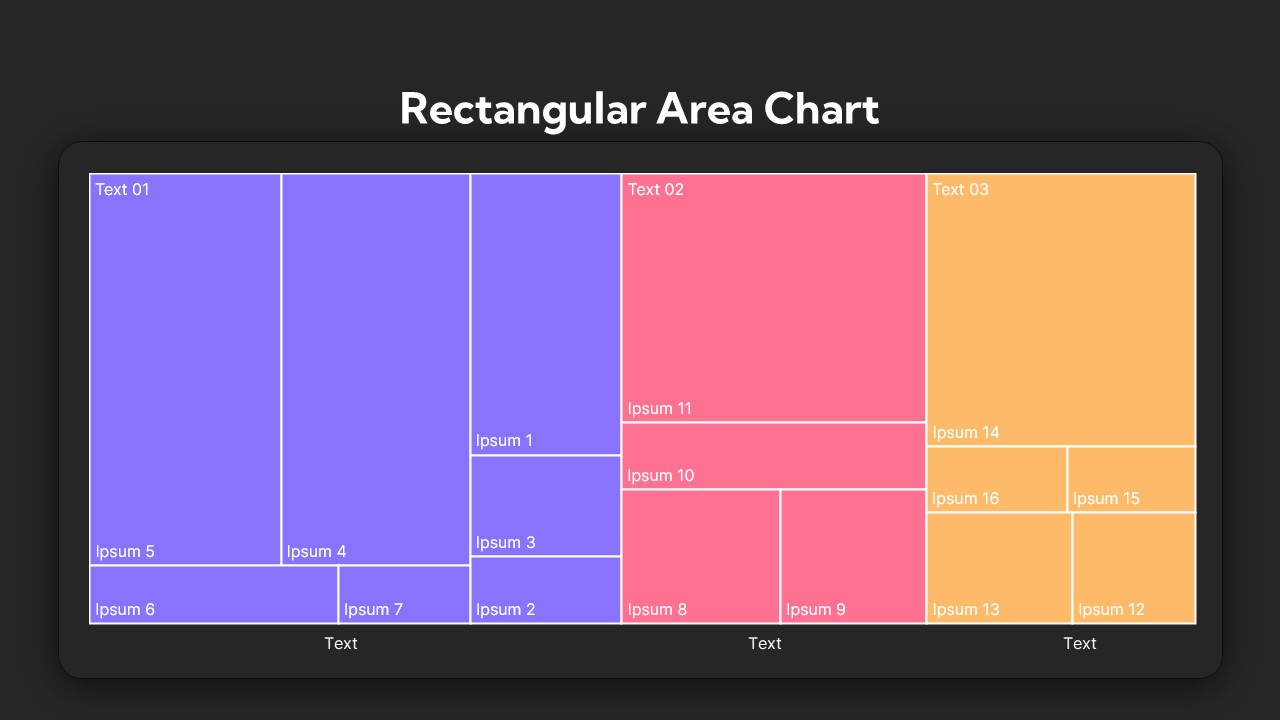
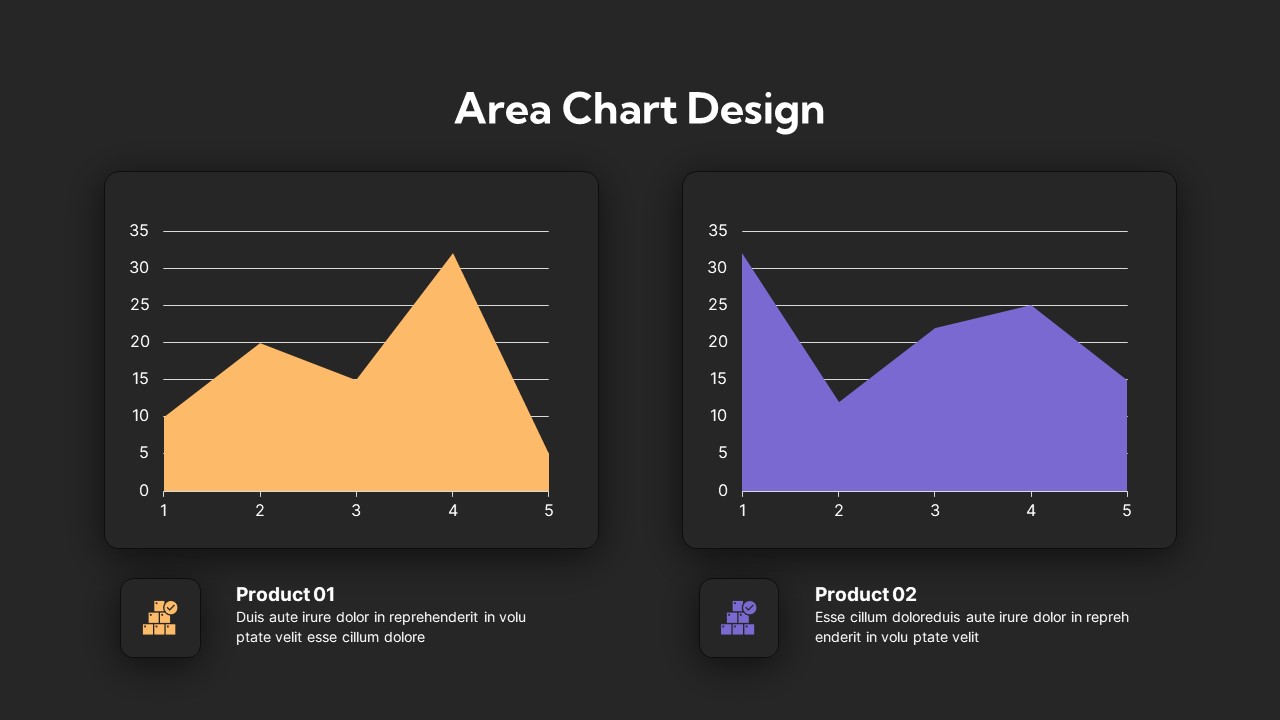
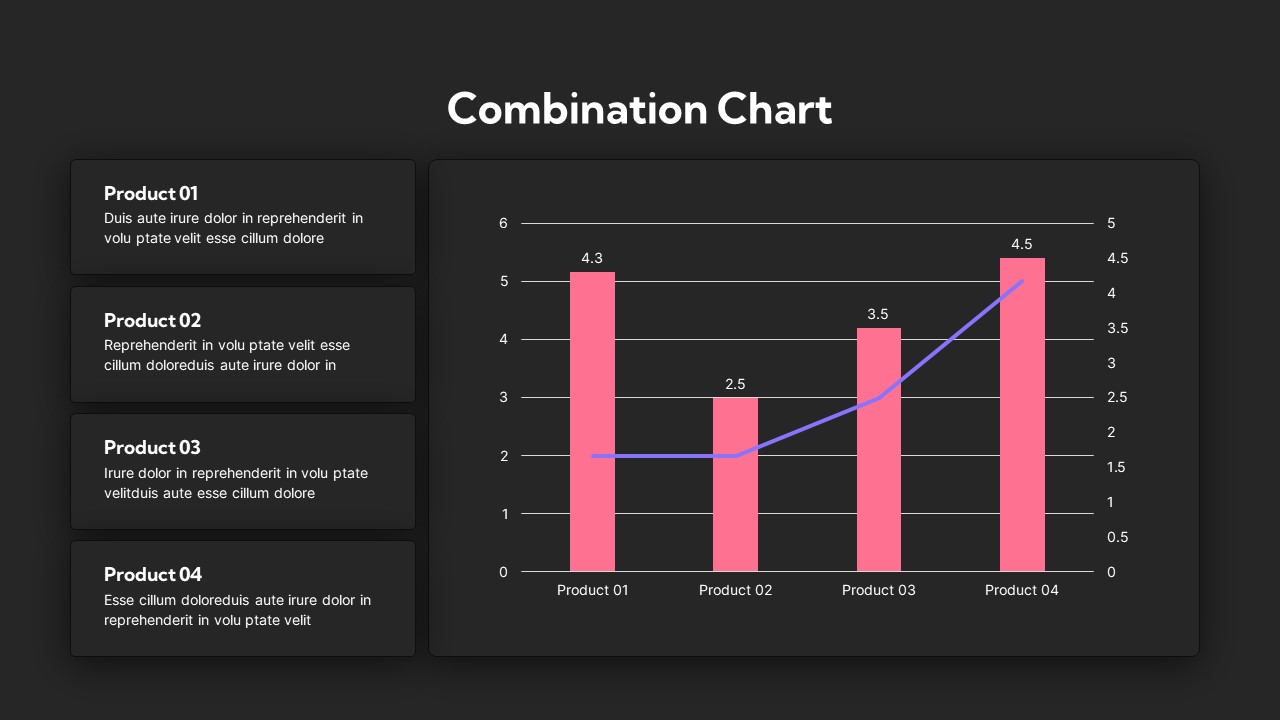
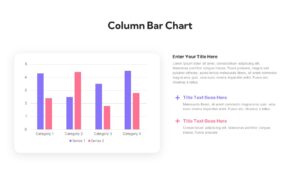
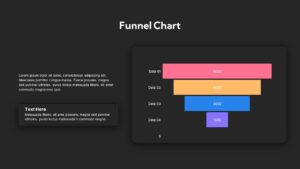
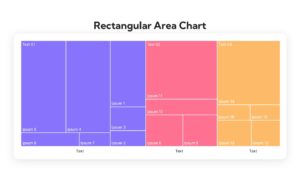
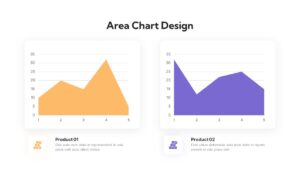
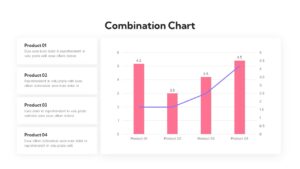
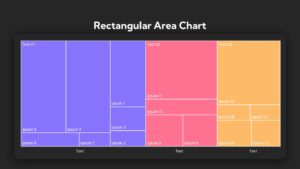
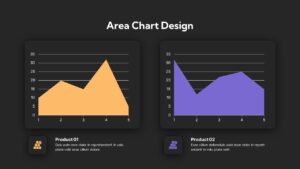
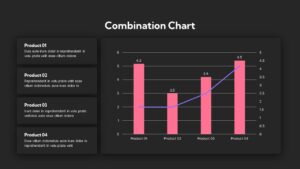
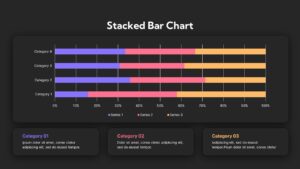
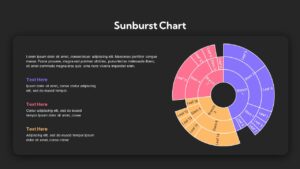
Present your data with clarity and style using this Charts & Graphs Template for PowerPoint & Google Slides. This free 15-slide pack includes fully editable layouts for rectangular area charts, funnel diagrams, combination charts, and column bar graphs in both light and dark themes. Each slide features clean typography, high-contrast chart elements, and theme-linked color swatches—pink, purple, blue, and yellow—so you can rebrand in seconds. Drag-and-drop placeholders, live-data chart links, and snap-to guides ensure pixel-perfect alignment and rapid customization. Built on a widescreen 16:9 canvas, this template maintains full resolution in PowerPoint and Google Slides, making it ideal for dashboards, performance reviews, and data-driven presentations.
Who is it for
Analysts, marketing managers, executives, consultants, and educators will benefit from these slides when visualizing KPIs, reporting performance metrics, and creating dashboards.
Other Uses
Repurpose these layouts for financial reports, sales reviews, project status updates, pitch decks, or academic lectures to maintain a consistent, professional visual language.
Login to download this file

Item ID
SB03897
Related Templates

Free Charts & Graphs Presentation Deck Template for PowerPoint & Google Slides
Pitch Deck
Free

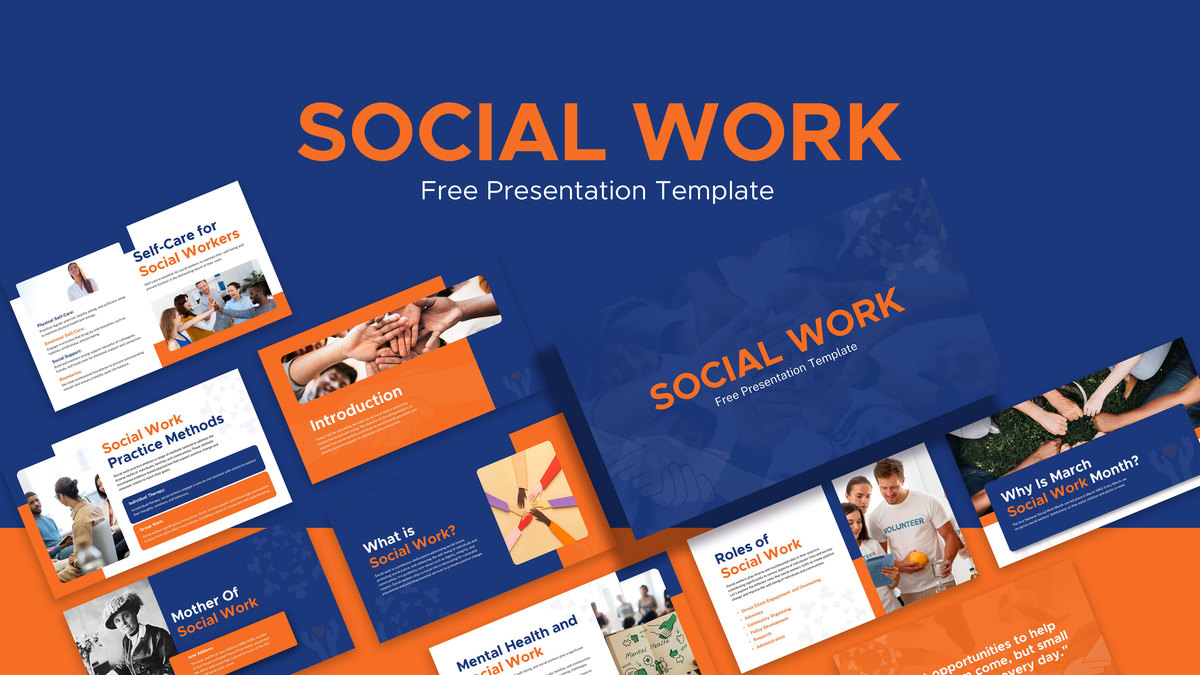
Social Work PowerPoint Template For Free
Pitch Deck
Free

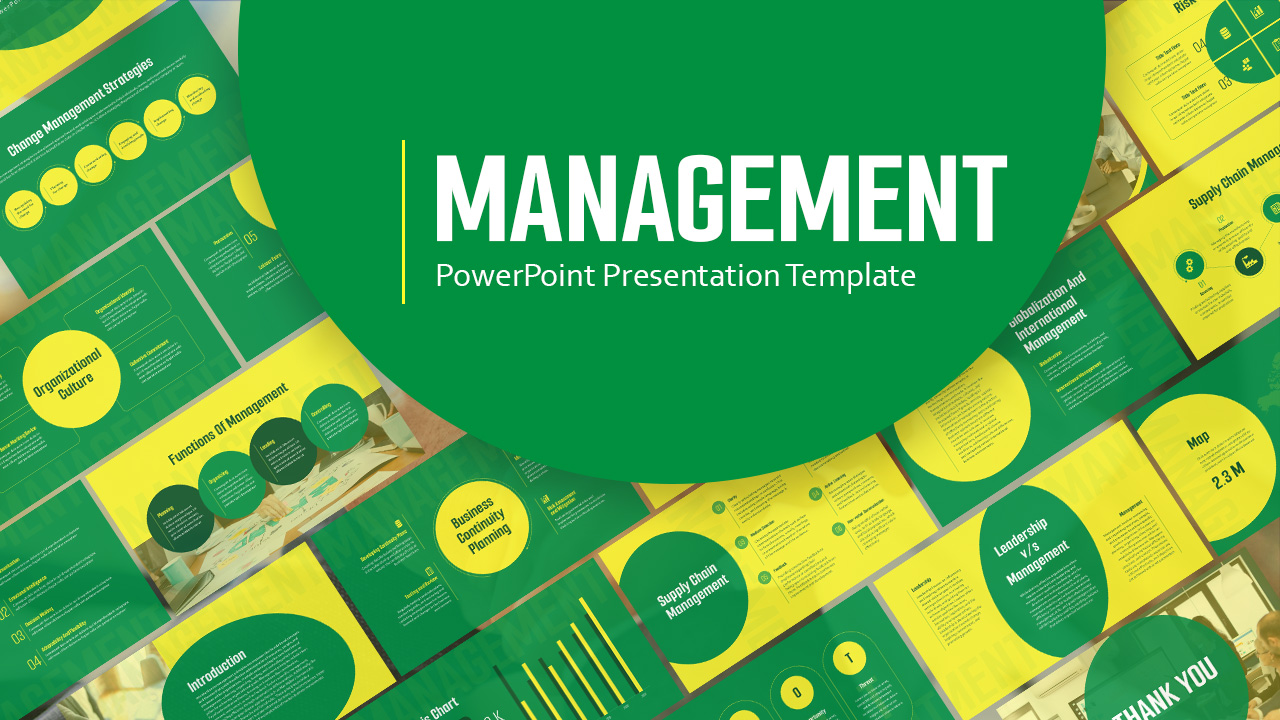
Free Comprehensive Management Strategy Deck Template for PowerPoint & Google Slides
Pitch Deck
Free
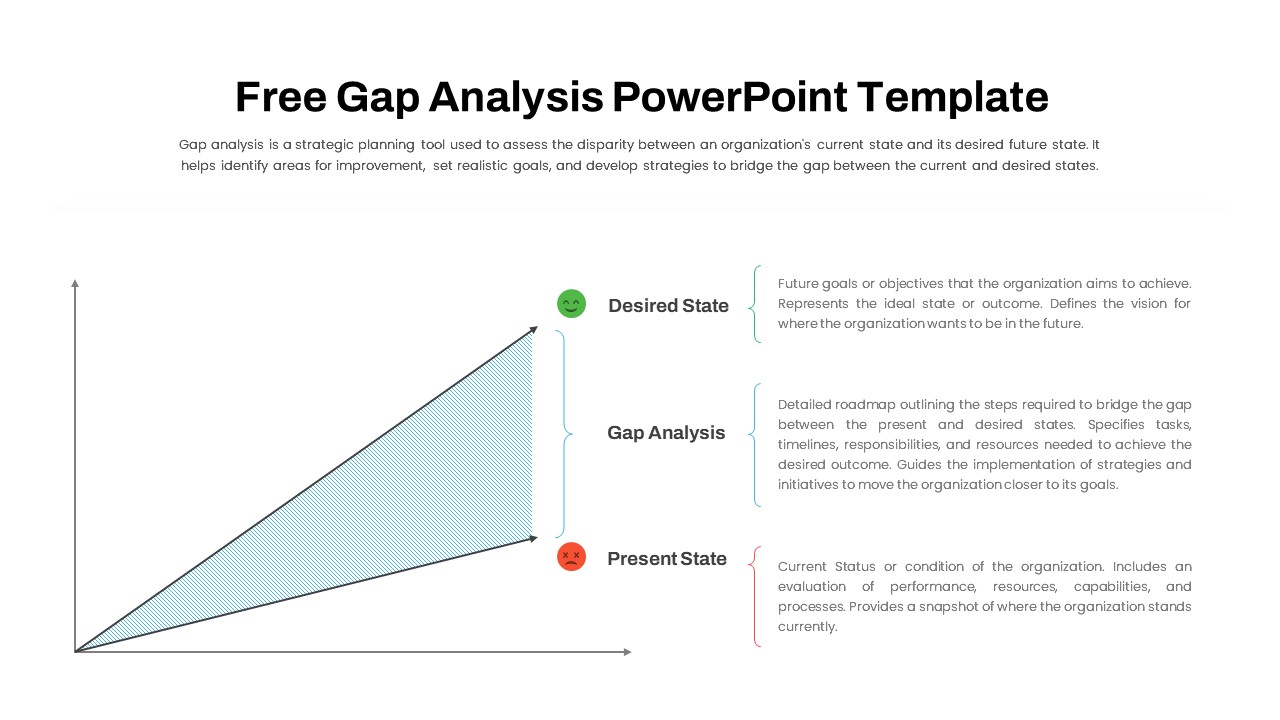
Free Comprehensive Gap Analysis Framework Template for PowerPoint & Google Slides
Opportunities Challenges
Free
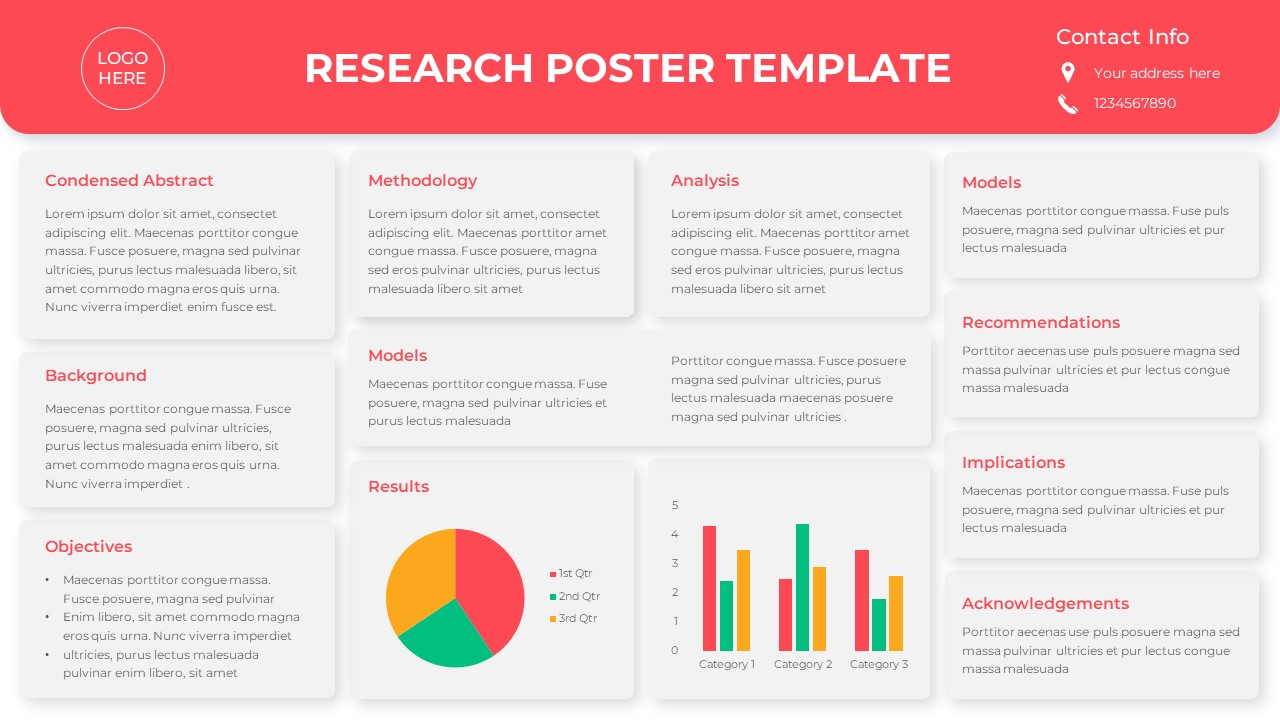
Free PowerPoint Research Poster Template
Pie/Donut
Free
Comprehensive Social Media Icons Slide Template for PowerPoint & Google Slides
Advertising
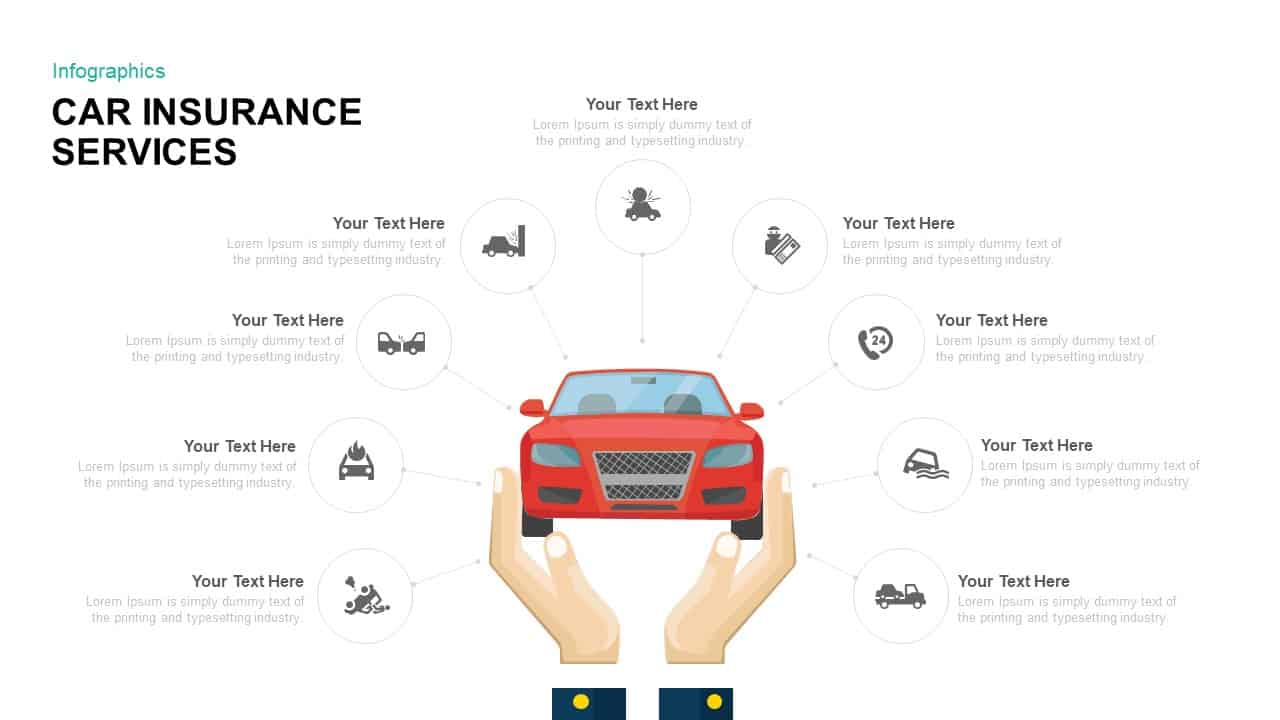
Comprehensive Car Insurance Services Diagram Template for PowerPoint & Google Slides
Business
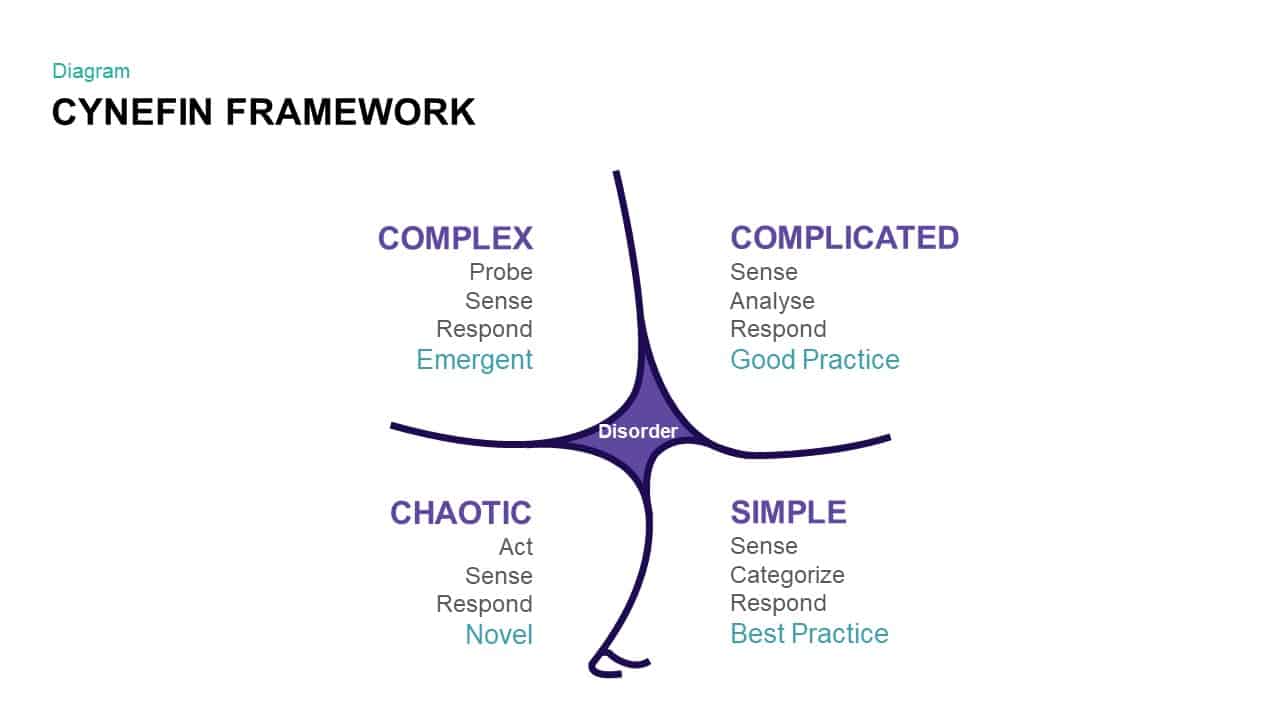
Comprehensive Cynefin Framework Diagram Template for PowerPoint & Google Slides
Opportunities Challenges
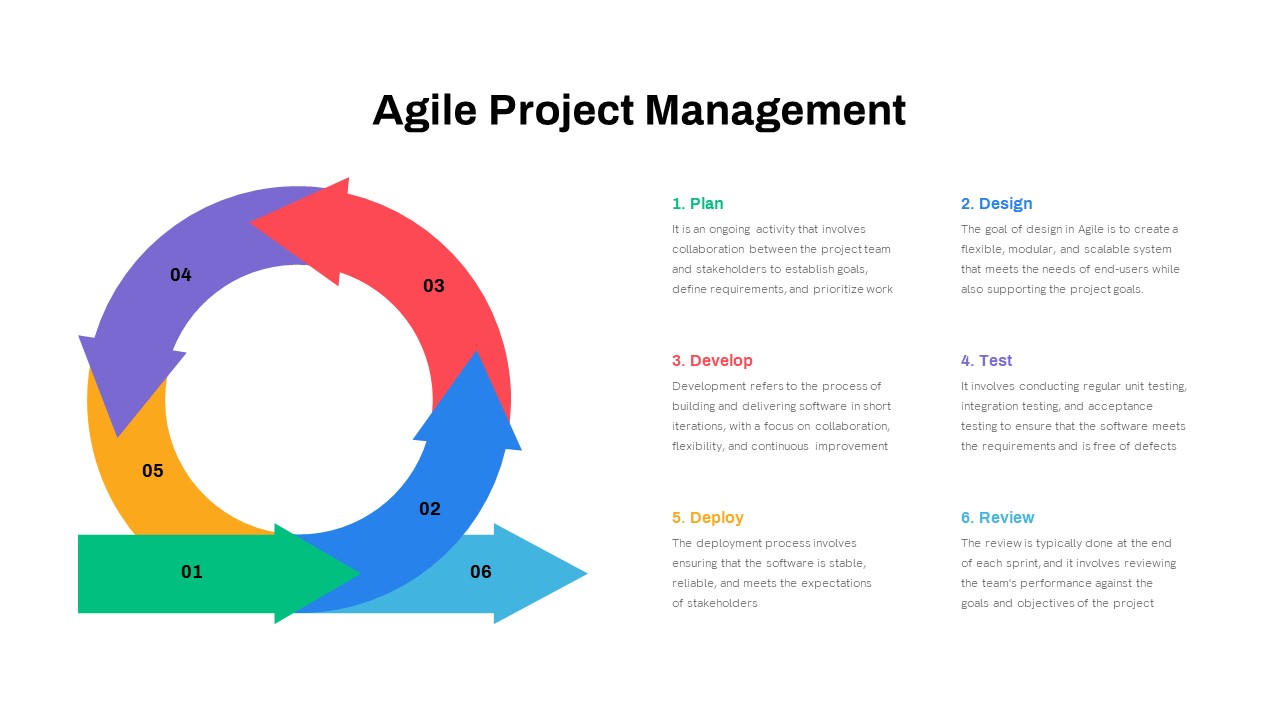
Comprehensive Agile Project Management Template for PowerPoint & Google Slides
Scrum
SCRUM PowerPoint Template and Google Slide Diagram
Scrum

IT Governance Framework Templates for PowerPoint & Google Slides
Pitch Deck
Comprehensive Healthcare Overview Deck Template for PowerPoint & Google Slides
Medical
Competitor Analysis Template PowerPoint and Google Slides
Competitor Analysis
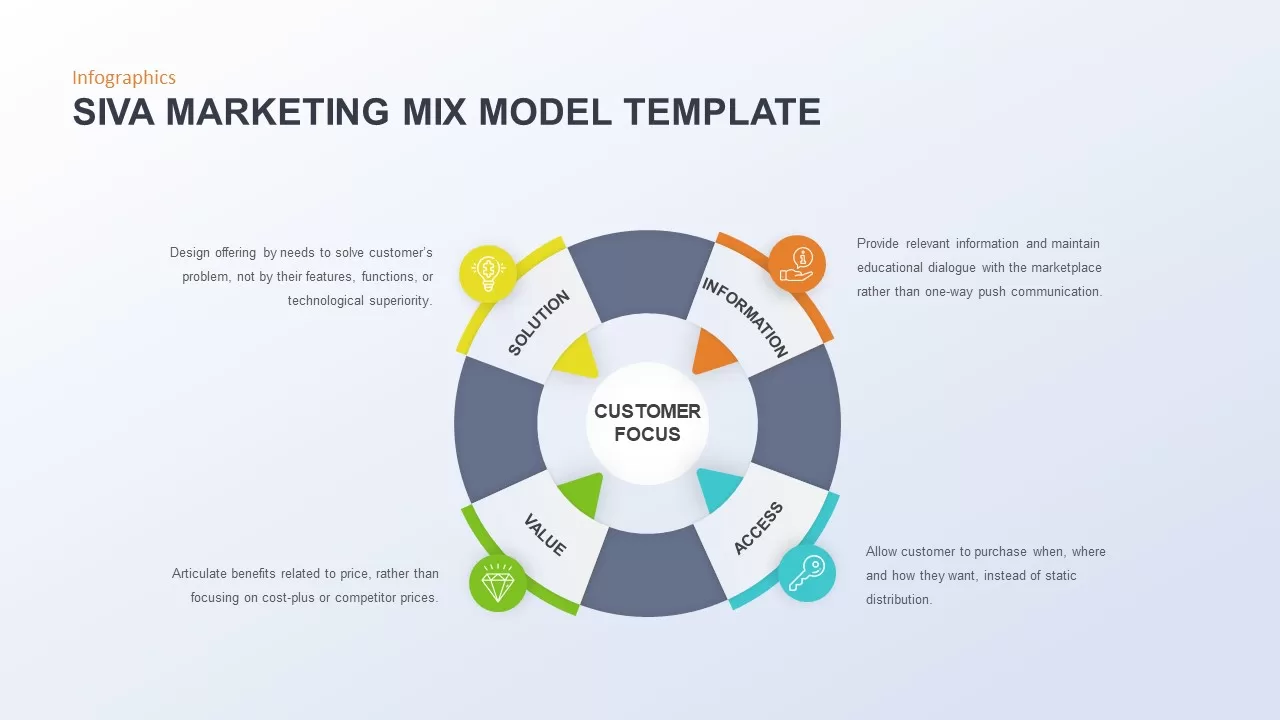
Comprehensive SIVA Marketing Mix Model Template for PowerPoint & Google Slides
Marketing
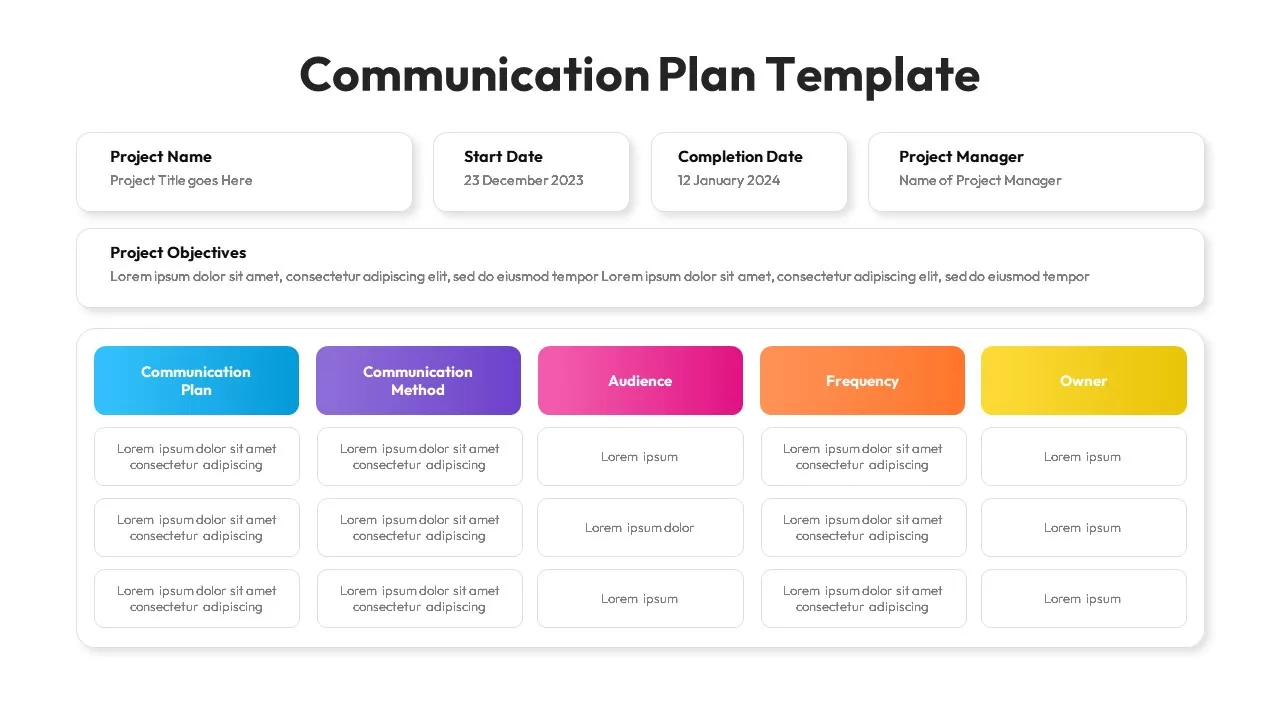
Comprehensive Communication Plan Template for PowerPoint & Google Slides
Business Plan
Comprehensive Recruitment Metrics Report Template for PowerPoint & Google Slides
Recruitment
Thesis Defense PowerPoint Template
Pitch Deck
Risk Impact Analysis Template
Risk Management
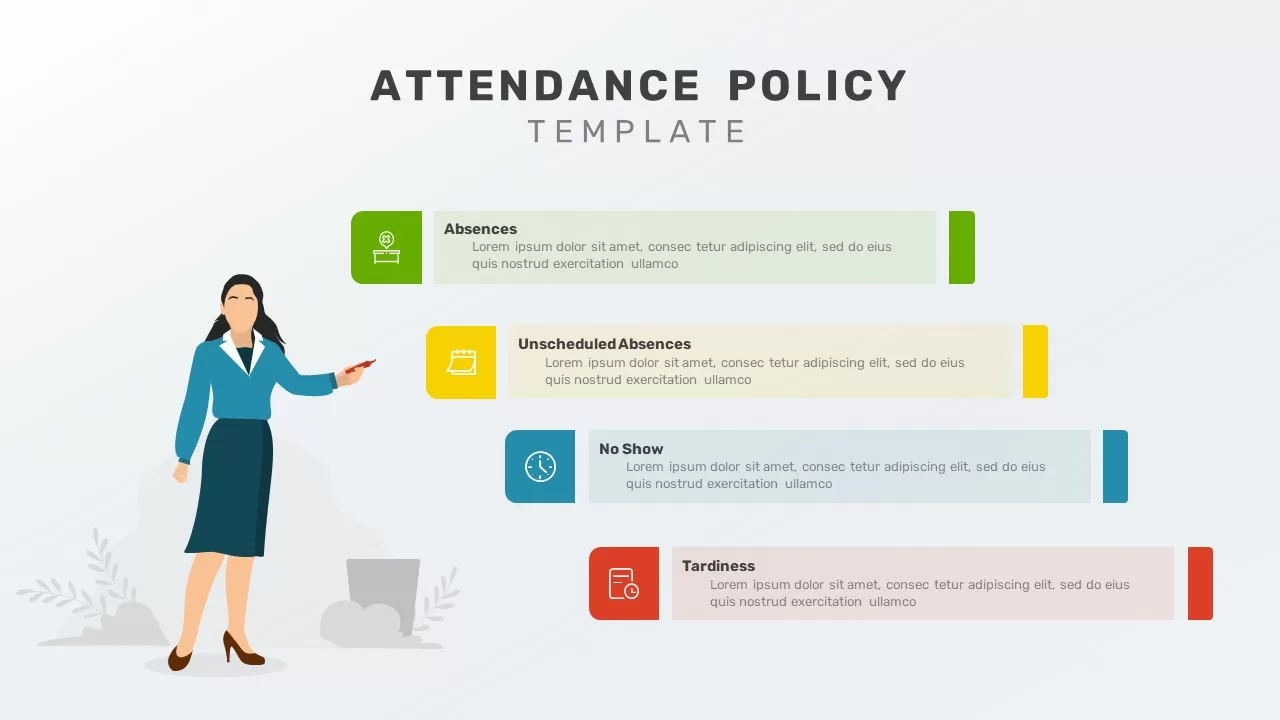
Attendance Policy Template
Process
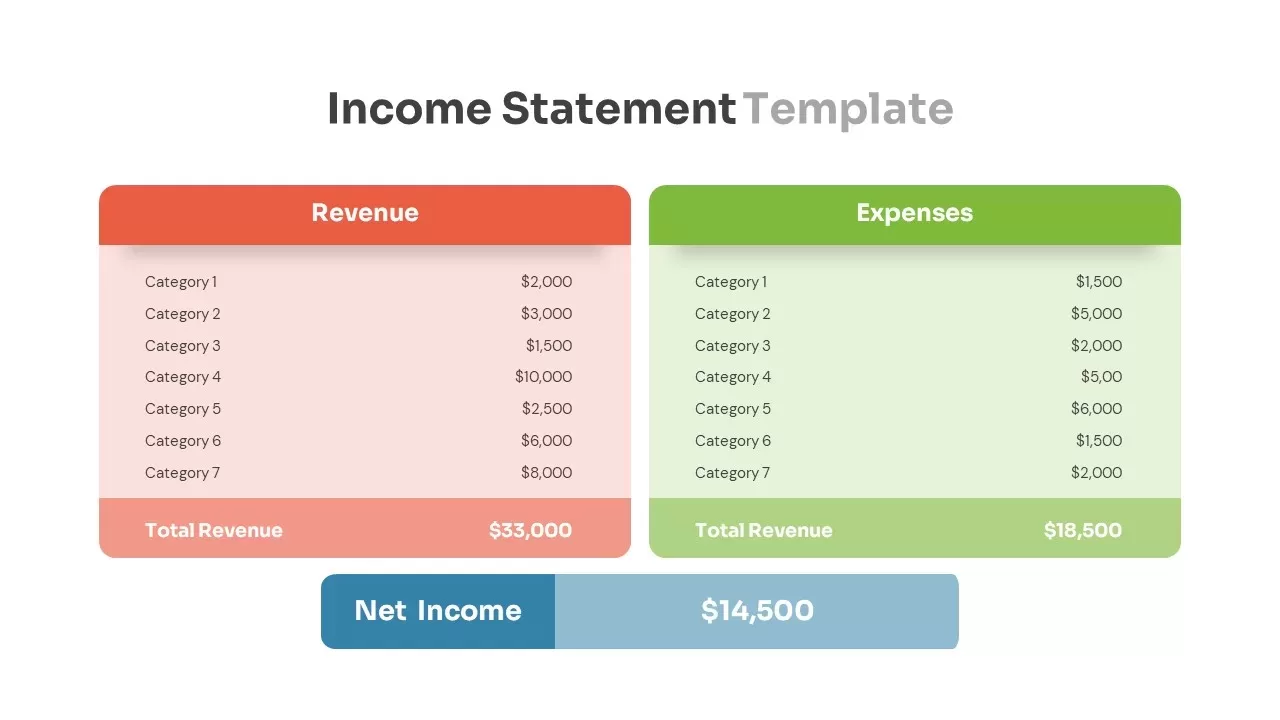
Comprehensive Income Statement Overview Template for PowerPoint & Google Slides
Business Report
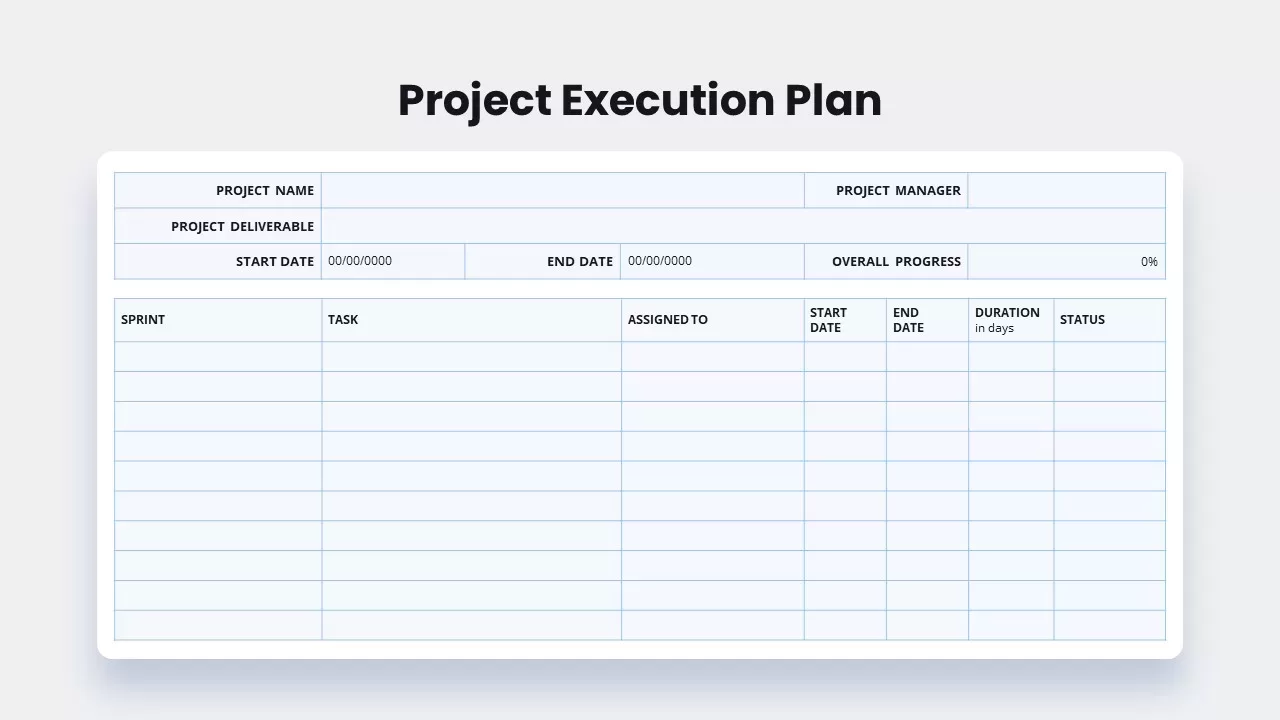
Comprehensive Project Execution Plan template for PowerPoint & Google Slides
Project Status
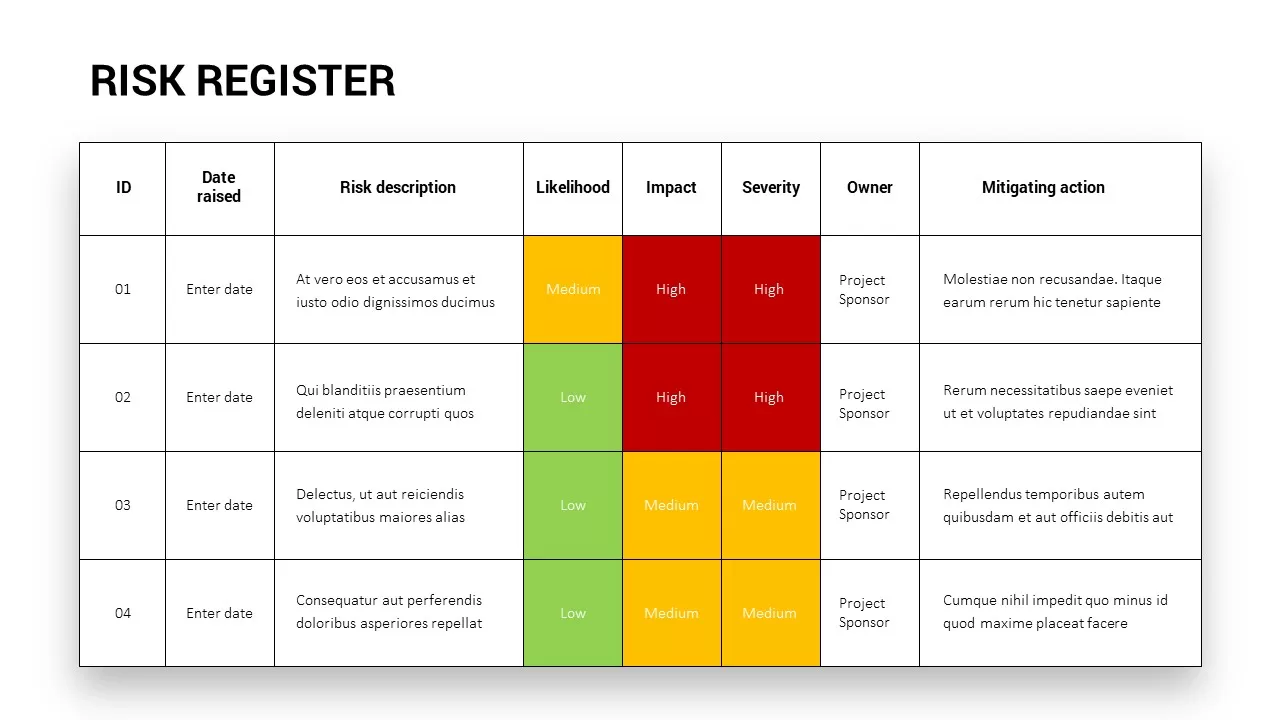
Risk Register Template PPT Slides
Risk Management
Resource Planning PowerPoint Template
Project
Recruitment Process Flowchart PowerPoint and Google Slides
Flow Charts
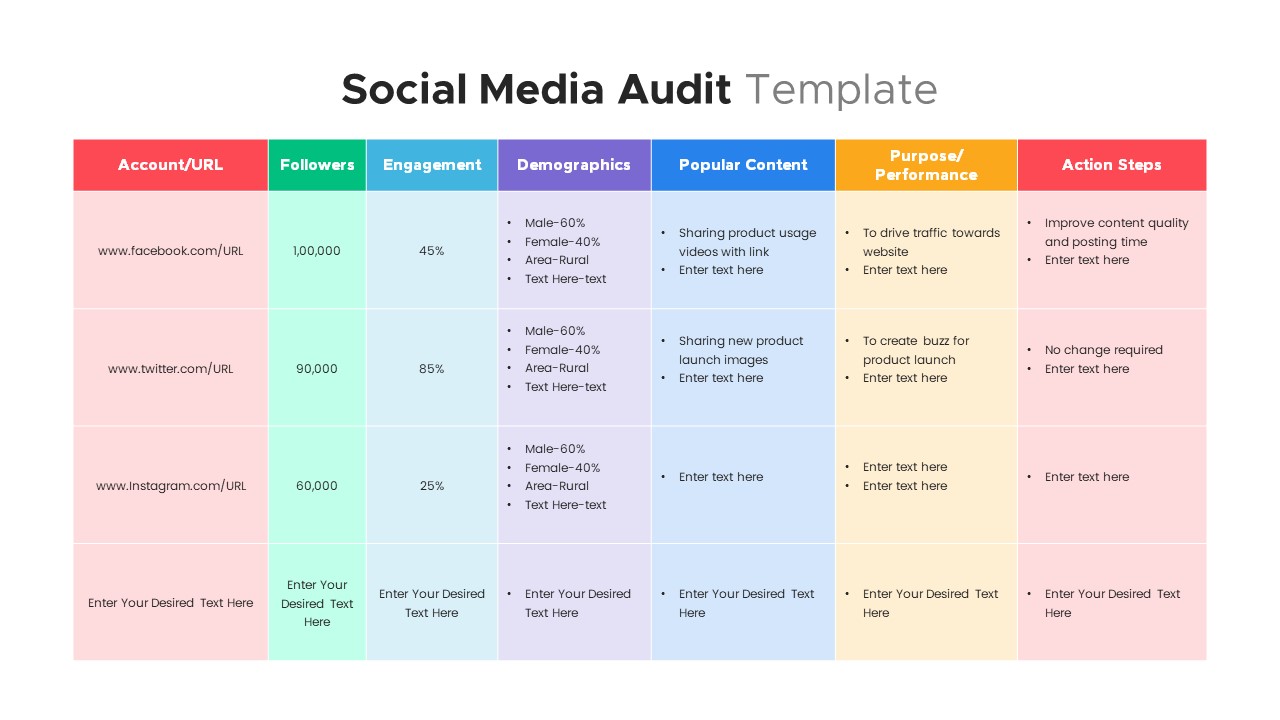
Comprehensive Social Media Audit Template for PowerPoint & Google Slides
Digital Marketing
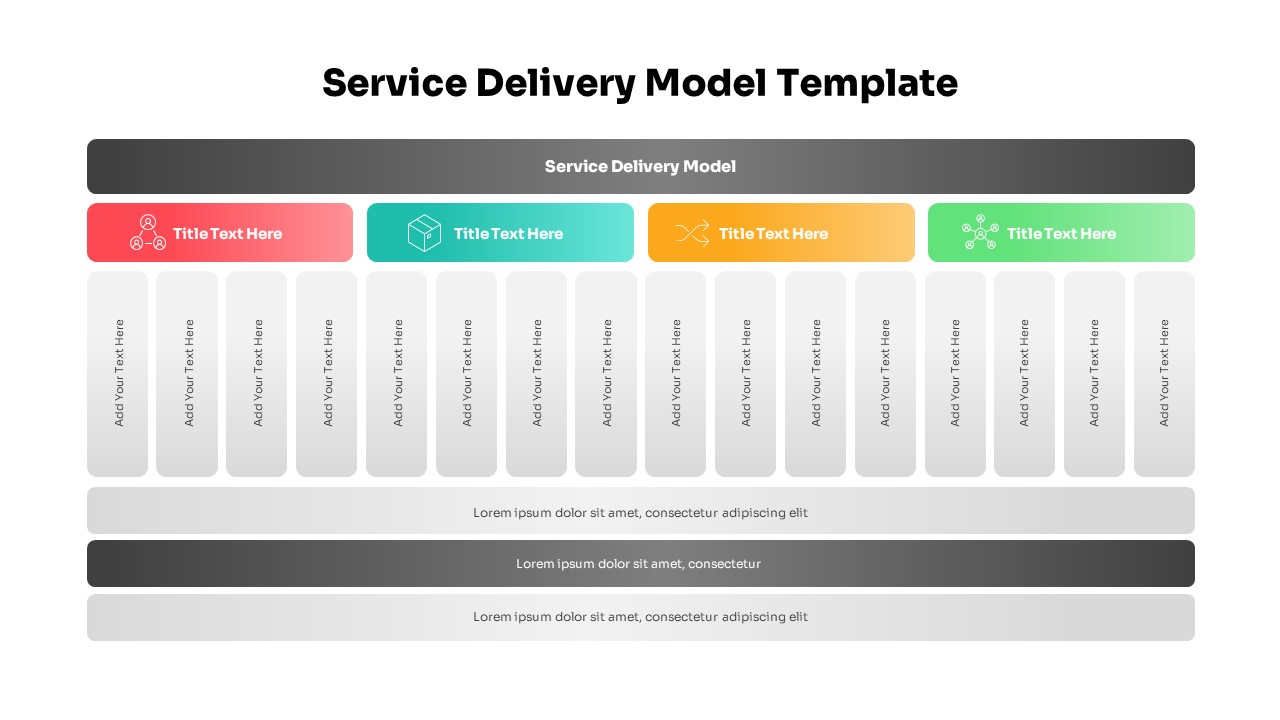
Service Delivery Model PowerPoint Template
Project
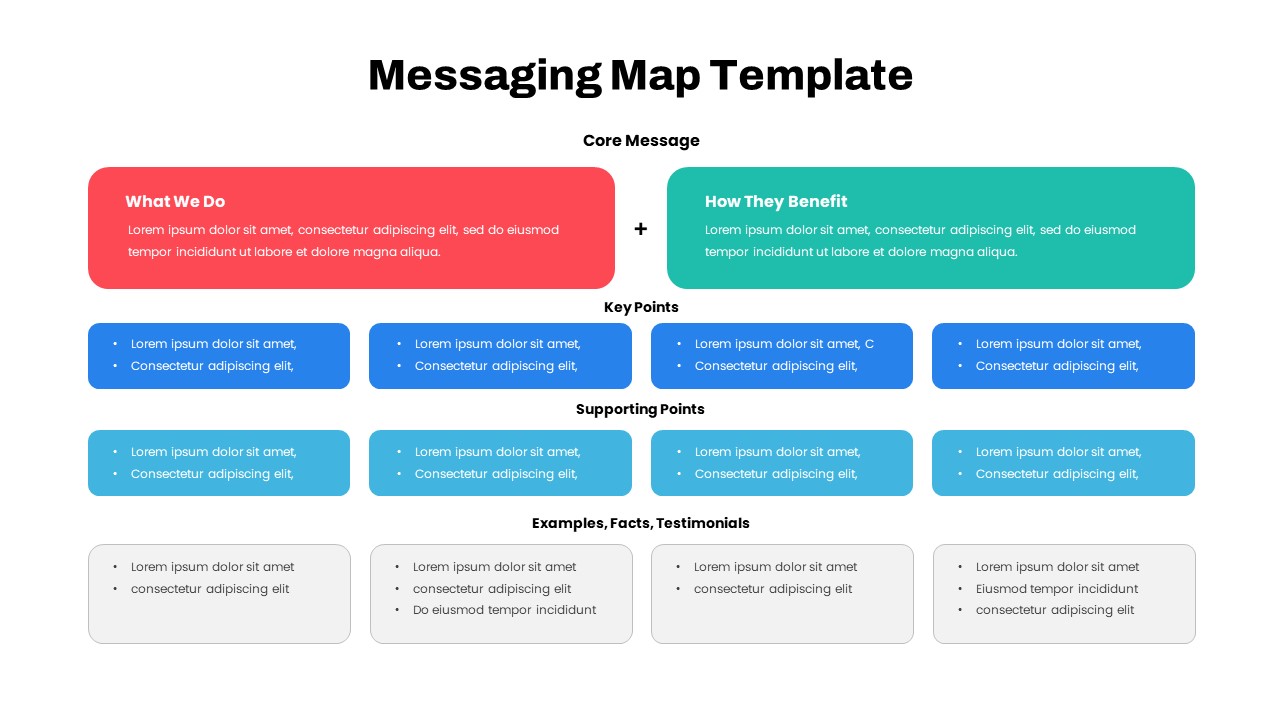
Comprehensive Messaging Map Framework Template for PowerPoint & Google Slides
Process
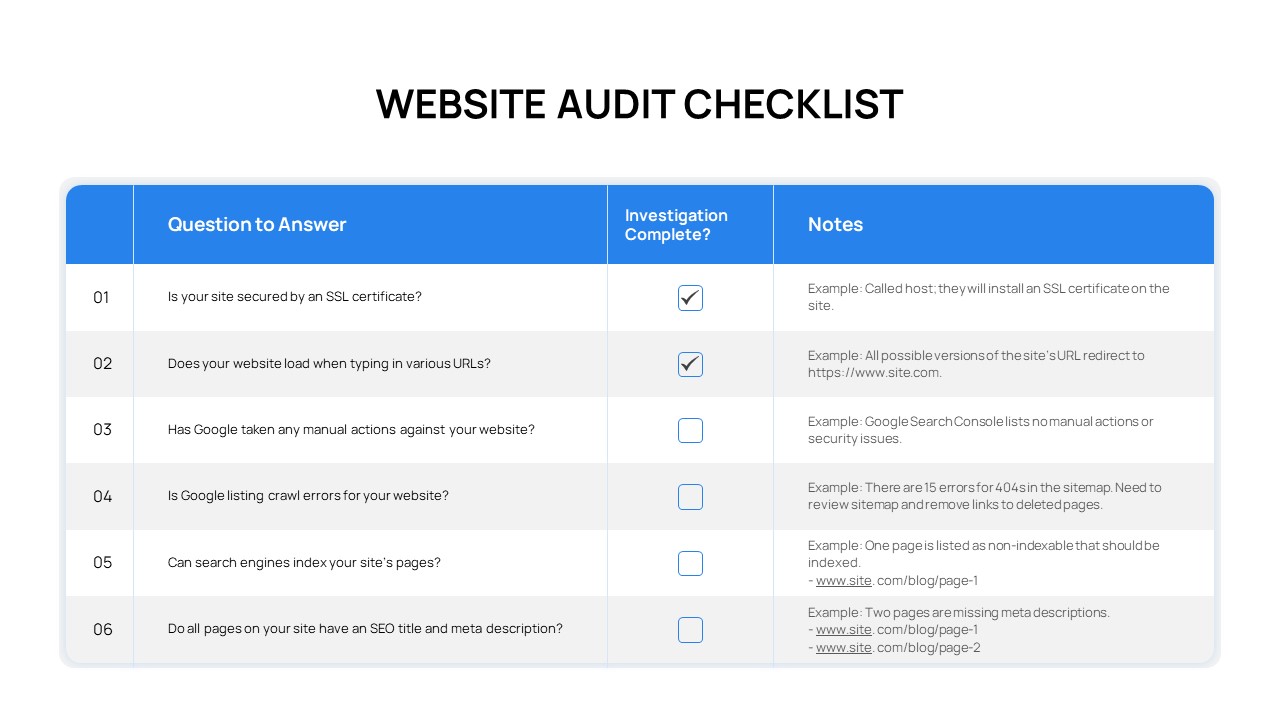
Comprehensive Website Audit Checklist Template for PowerPoint & Google Slides
Technology
Process Flow Diagram Template PowerPoint & Google Slides
Process
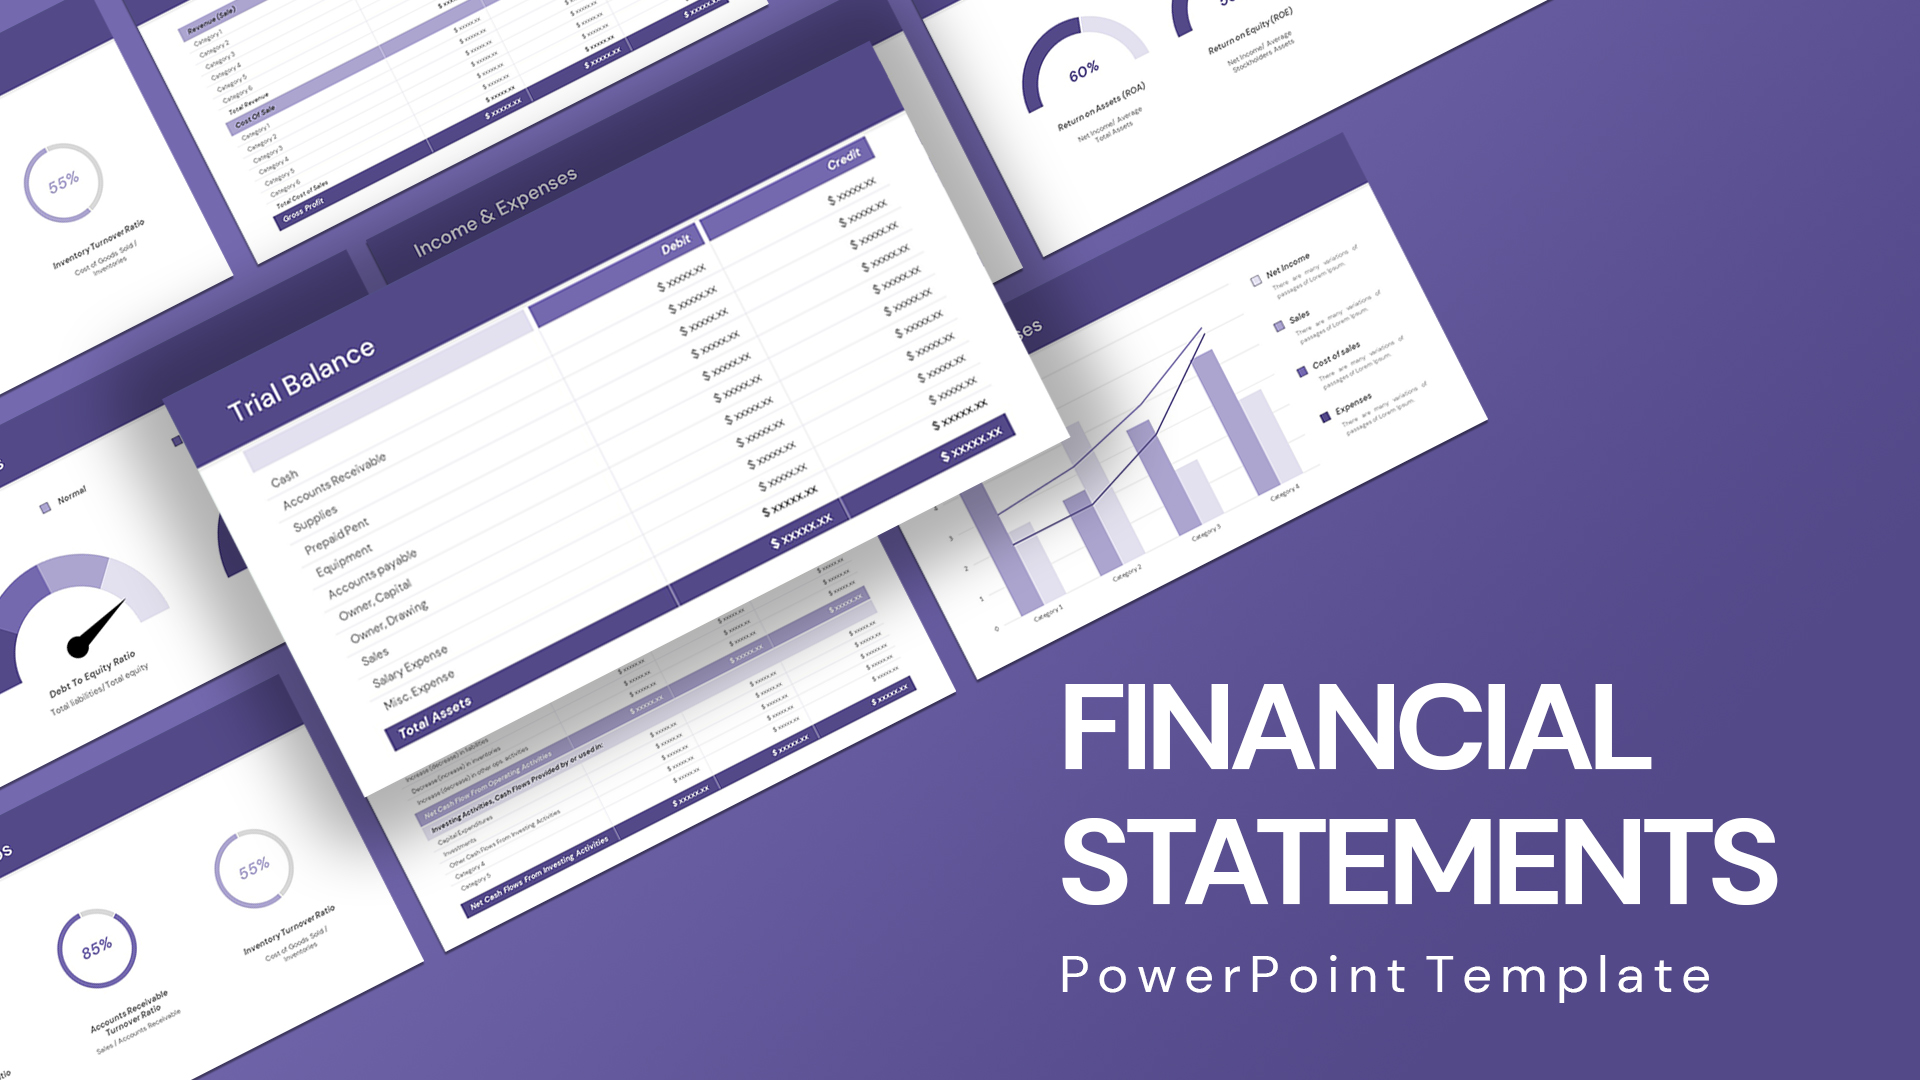
Comprehensive Financial Statements Template for PowerPoint & Google Slides
Finance
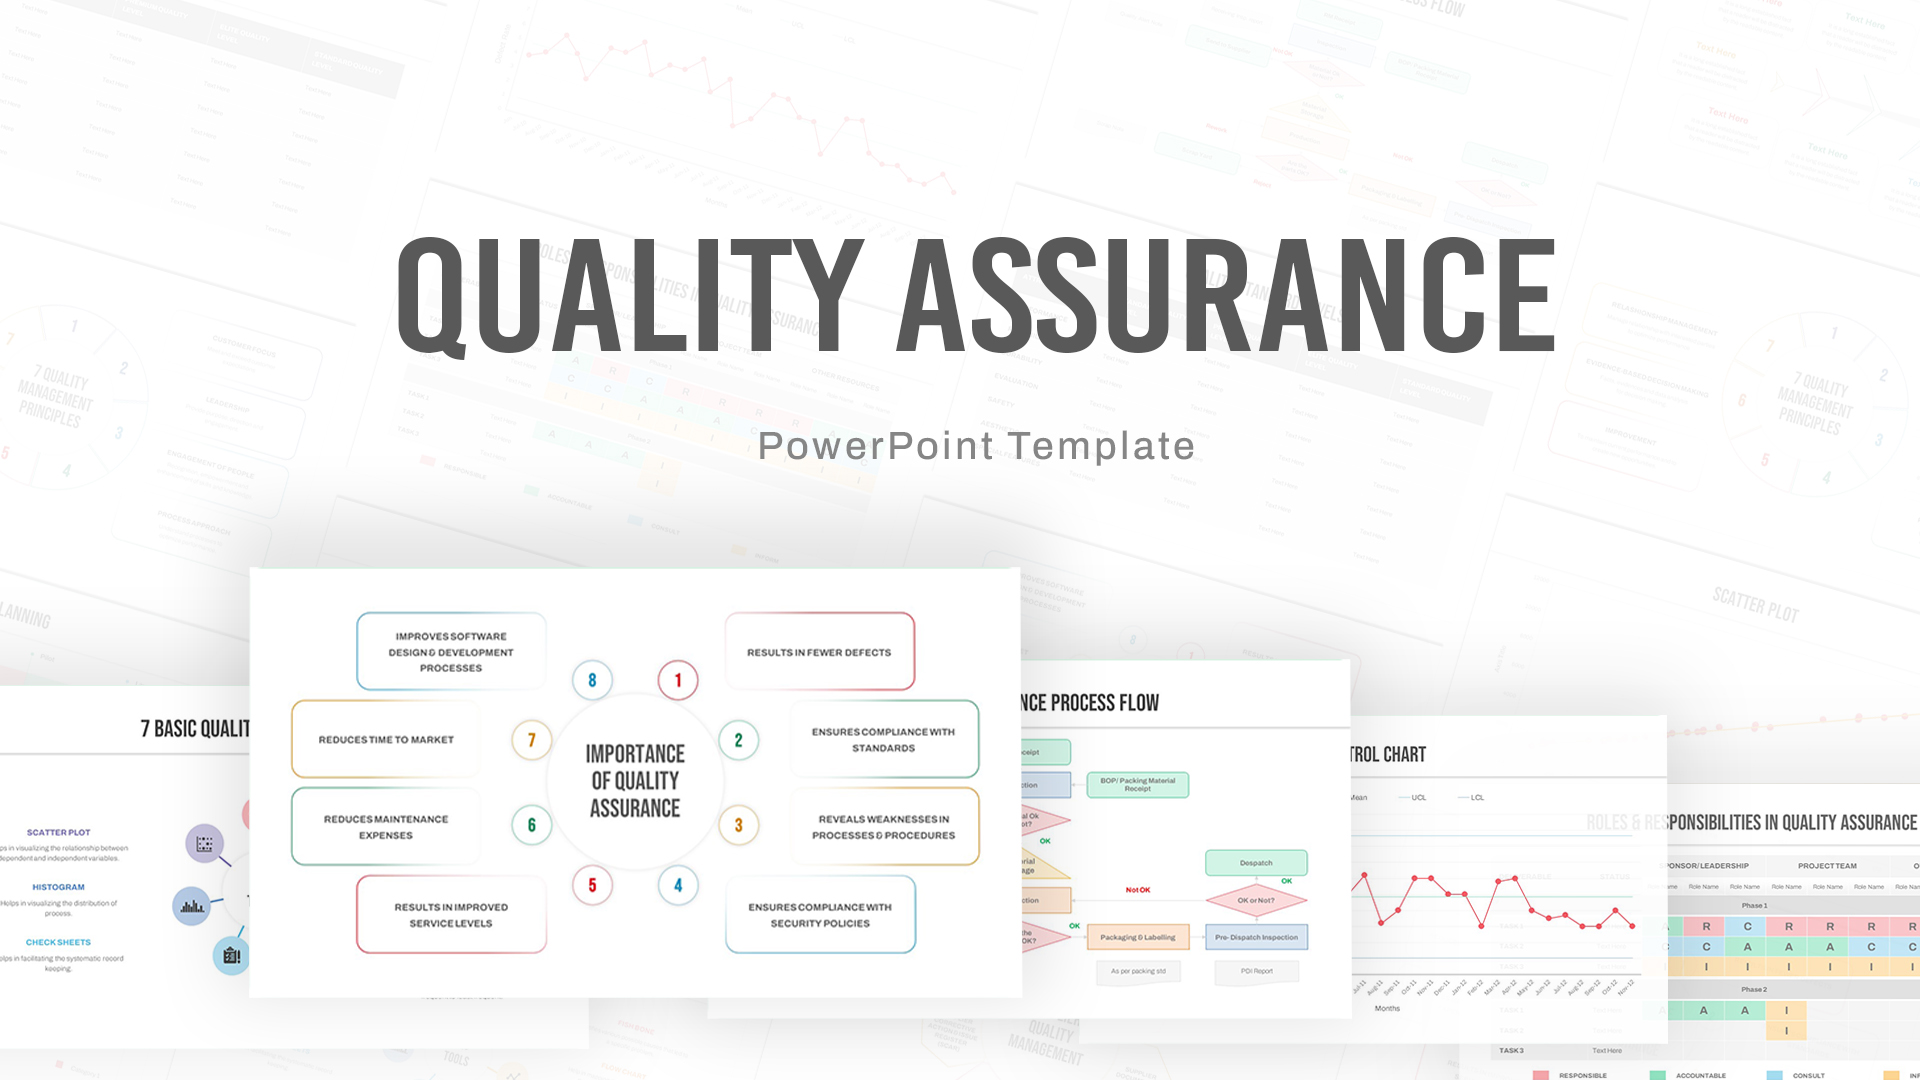
Comprehensive Quality Assurance Workflow Template for PowerPoint & Google Slides
Company Profile
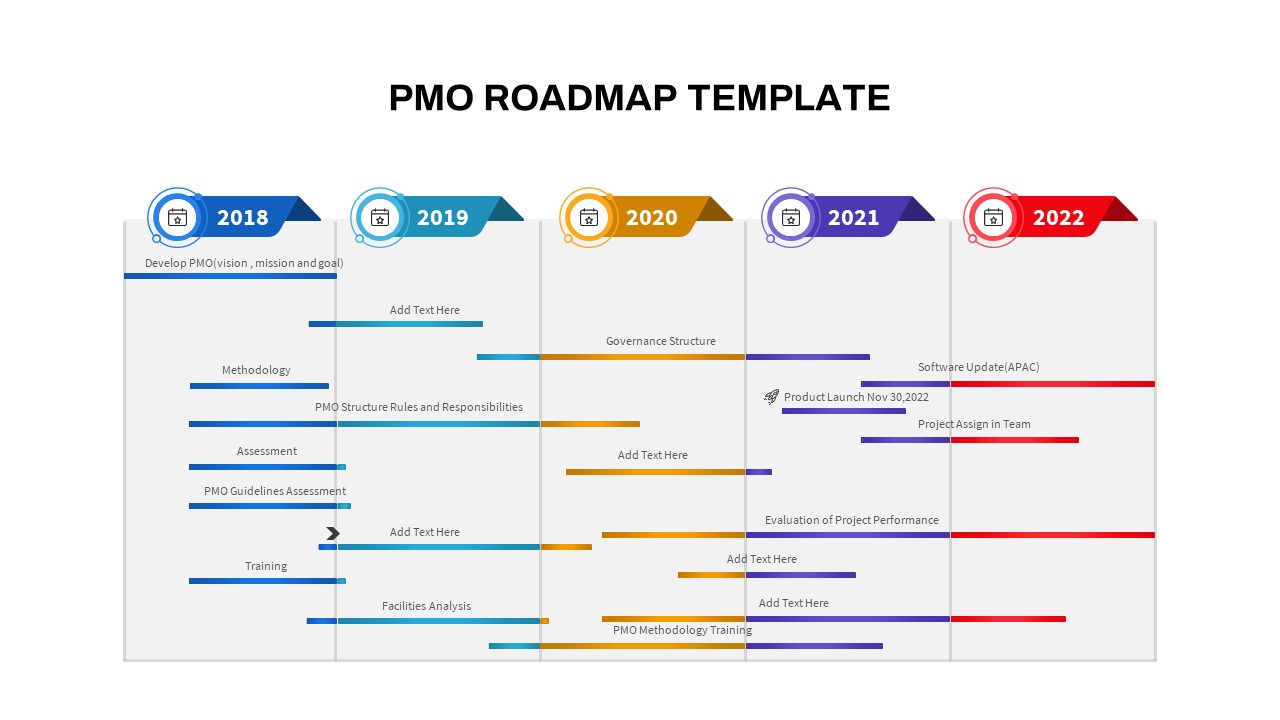
Comprehensive PMO Roadmap Timeline Template for PowerPoint & Google Slides
Roadmap
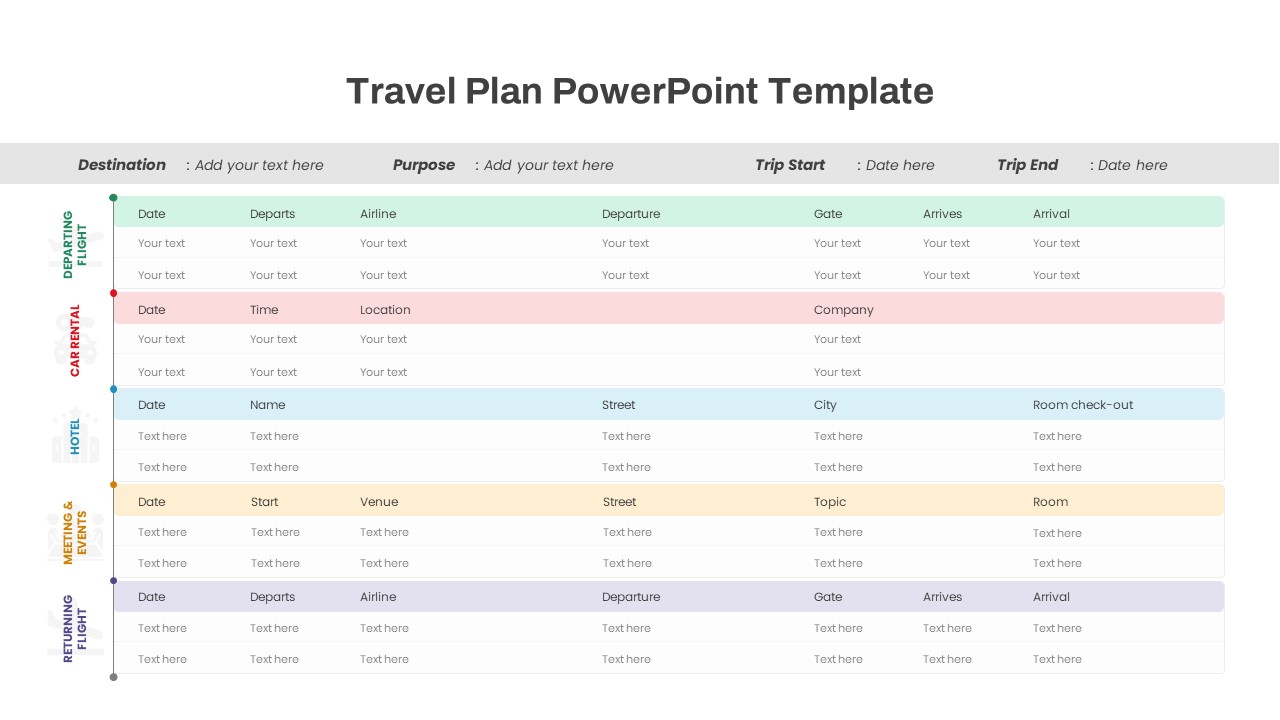
Travel Plan PowerPoint Template
Agenda
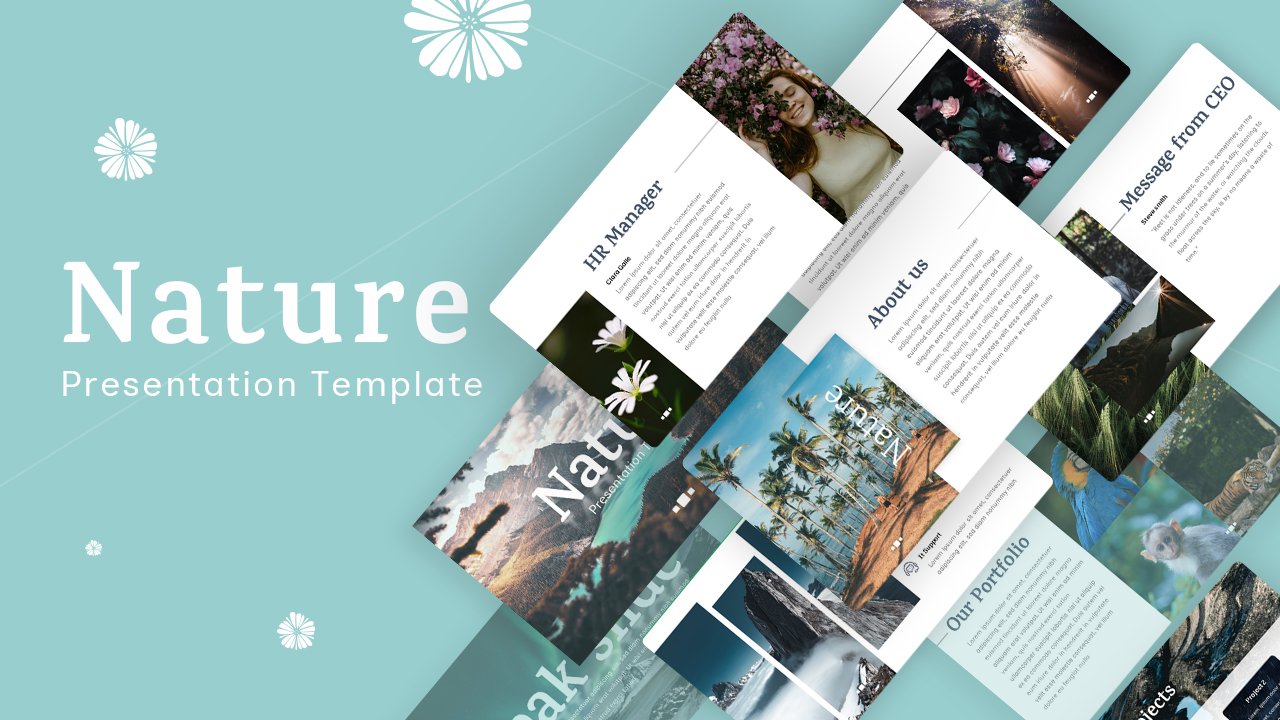
Comprehensive Nature Presentation Template for PowerPoint & Google Slides
Pitch Deck
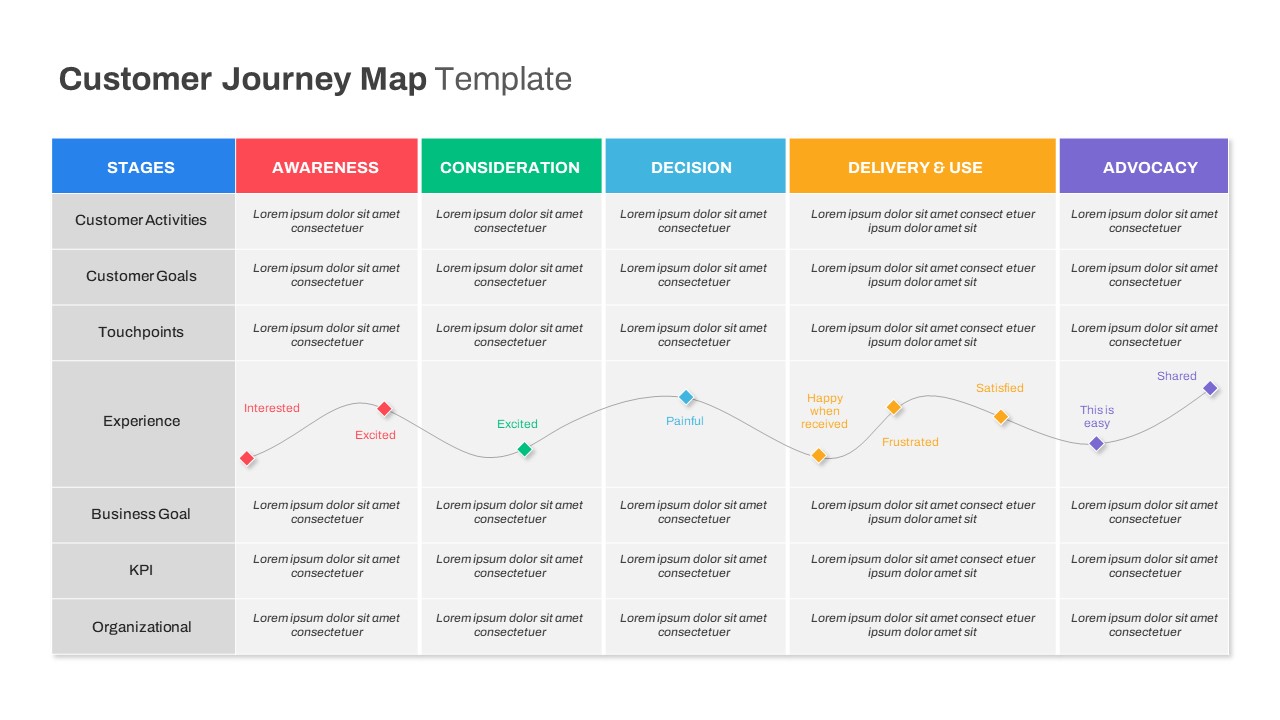
Customer Journey Map PowerPoint Templates
Customer Journey
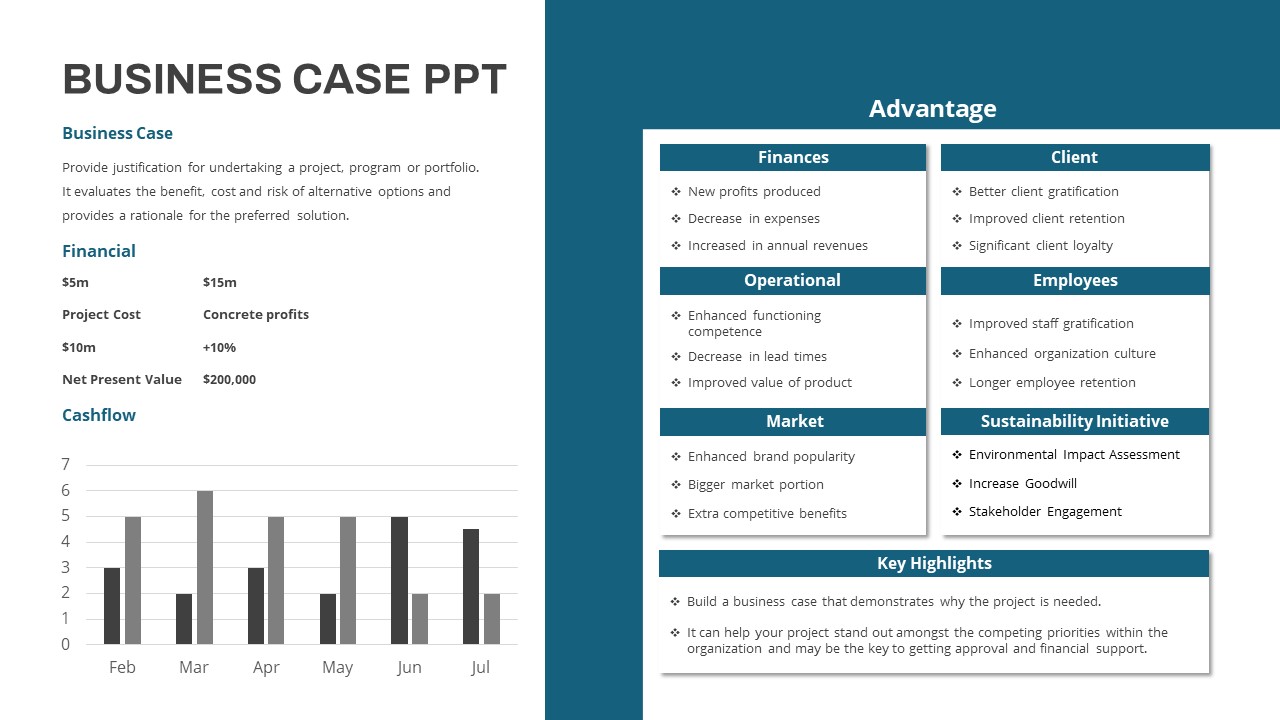
Comprehensive Business Case Presentation Template for PowerPoint & Google Slides
Pie/Donut
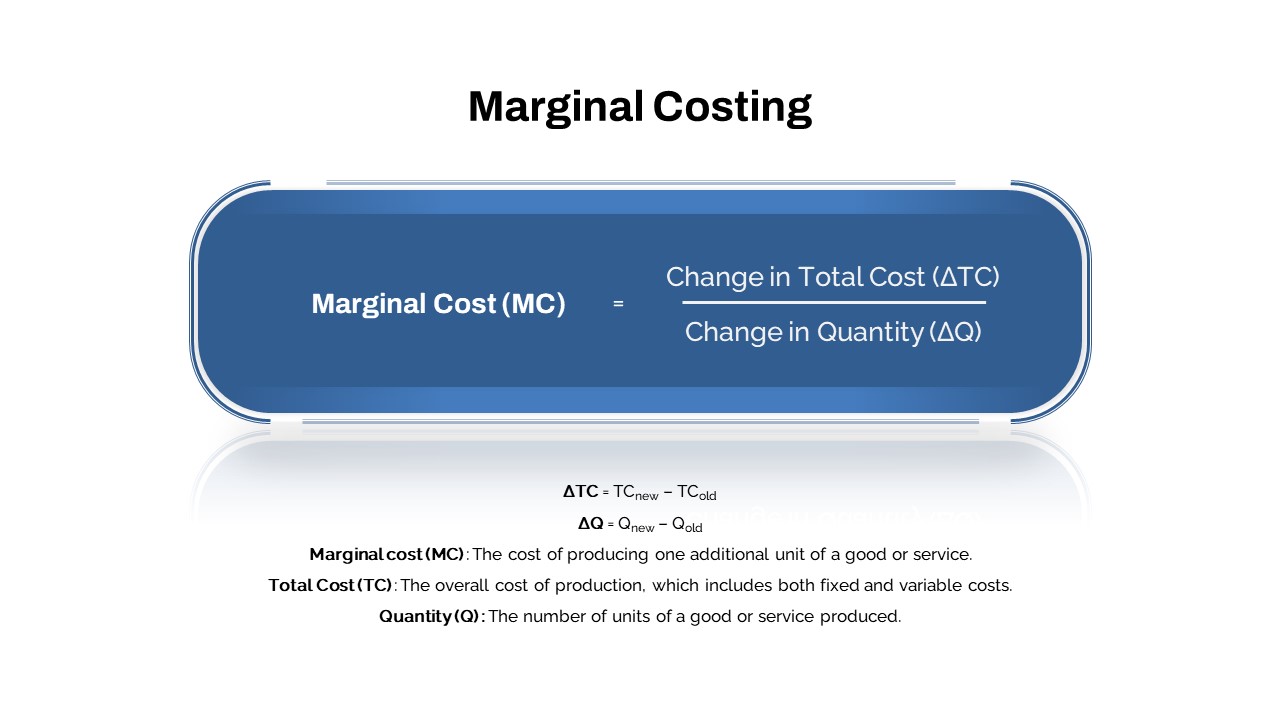
Comprehensive Marginal Costing Formula Template for PowerPoint & Google Slides
Process
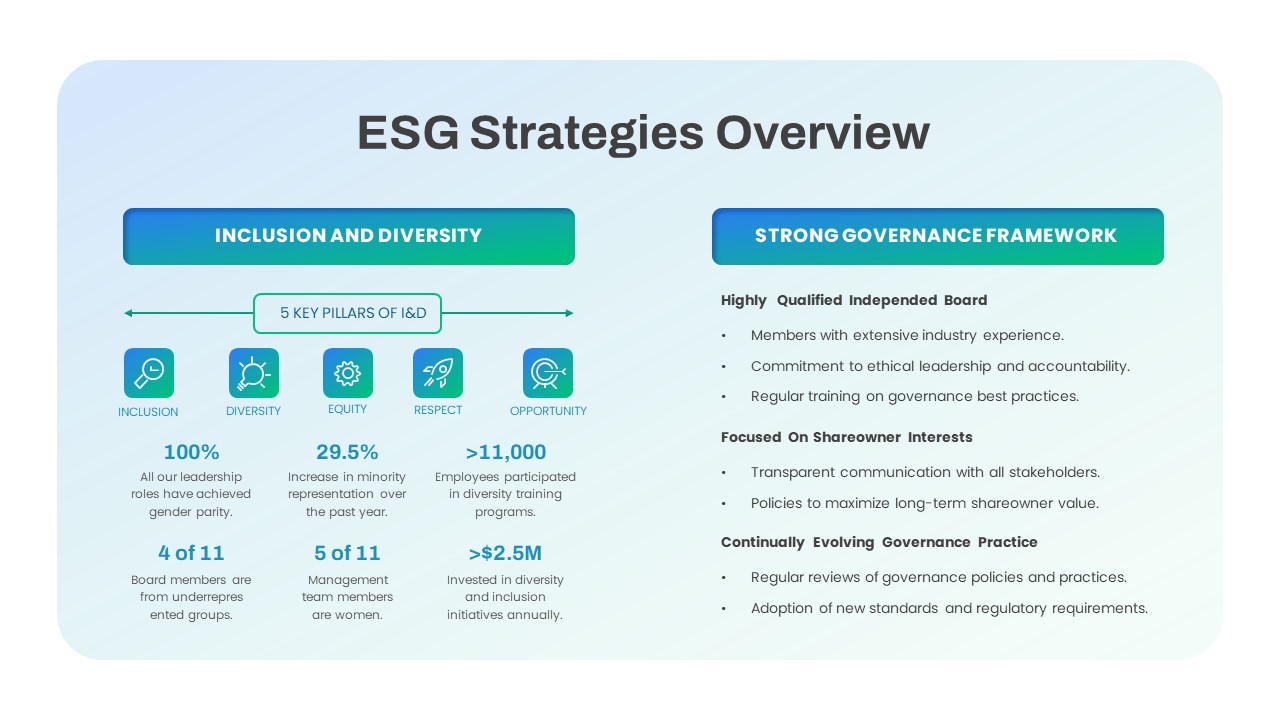
Comprehensive ESG Strategies Overview Template for PowerPoint & Google Slides
Infographics
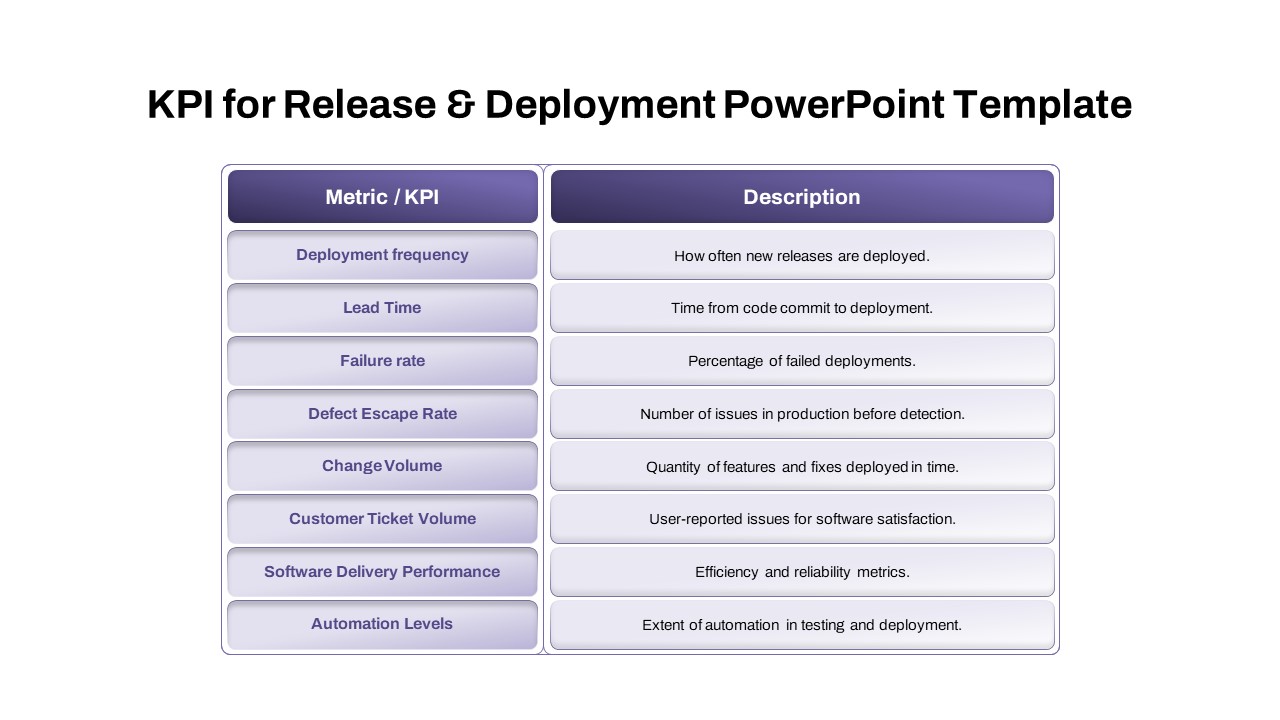
Comprehensive Release & Deployment KPI Template for PowerPoint & Google Slides
Software Development
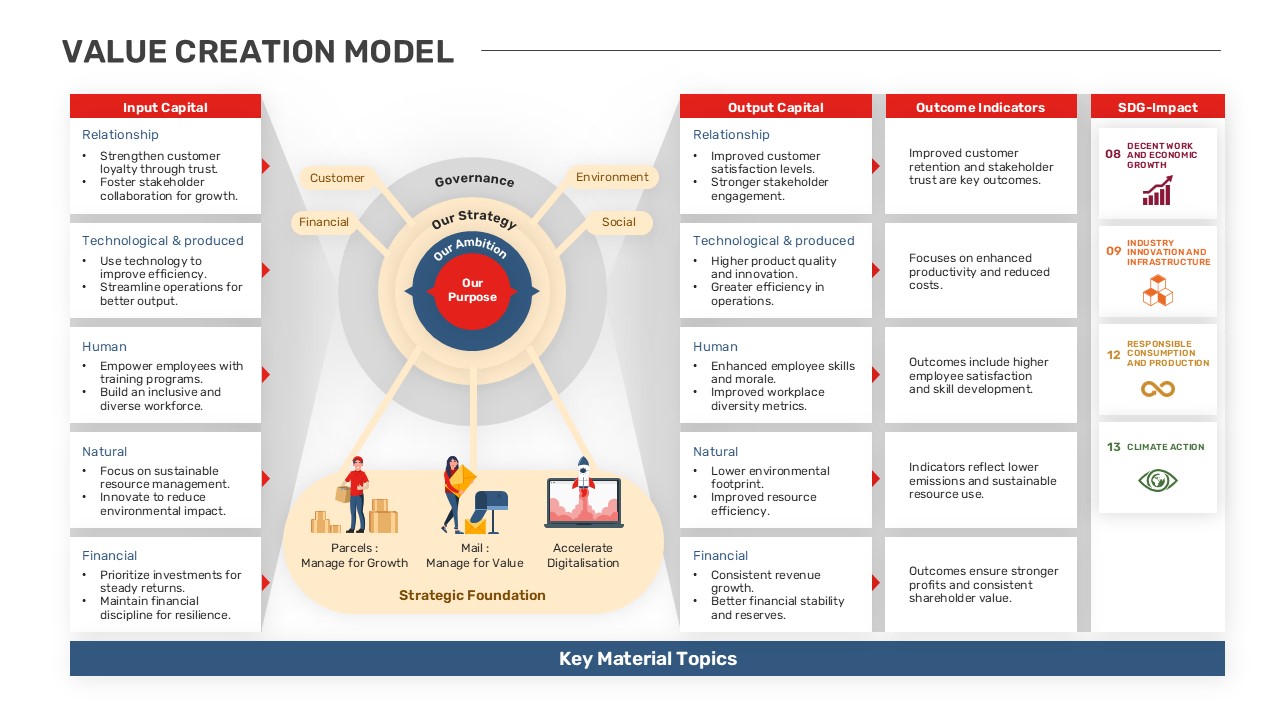
Comprehensive Value Creation Model Template for PowerPoint & Google Slides
Business Models
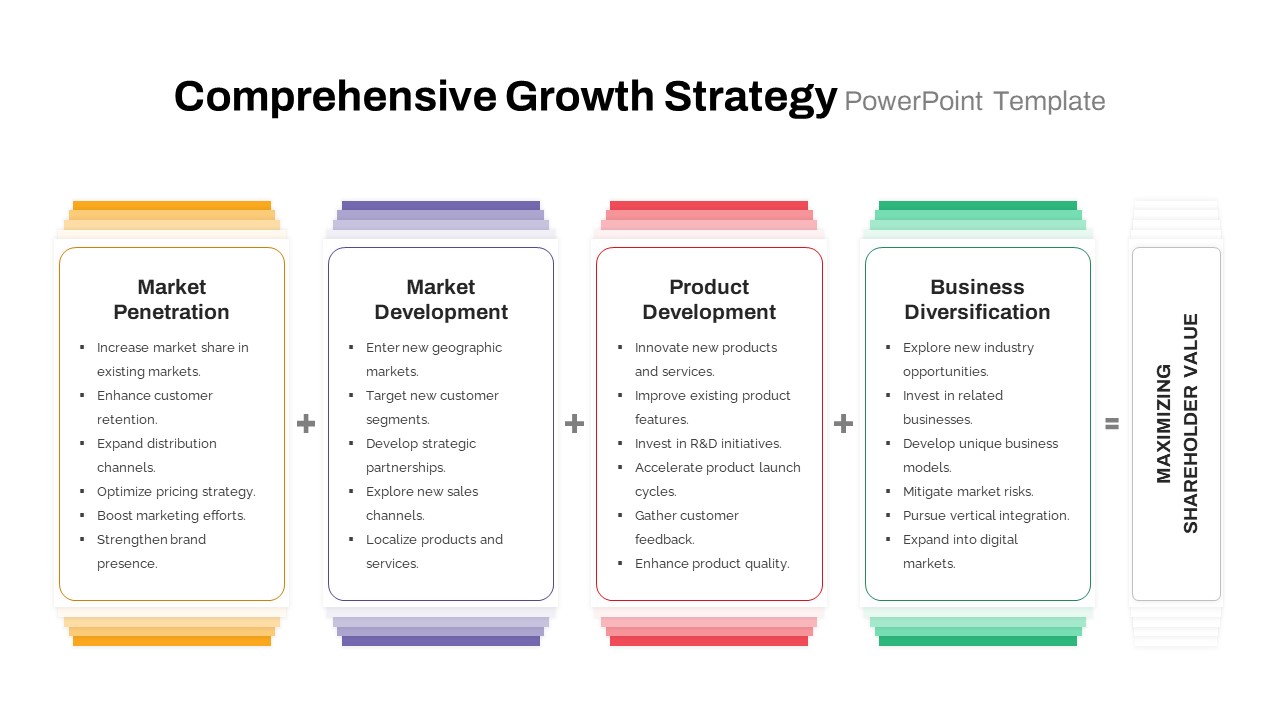
Comprehensive Growth Strategy Cards Template for PowerPoint & Google Slides
Infographics
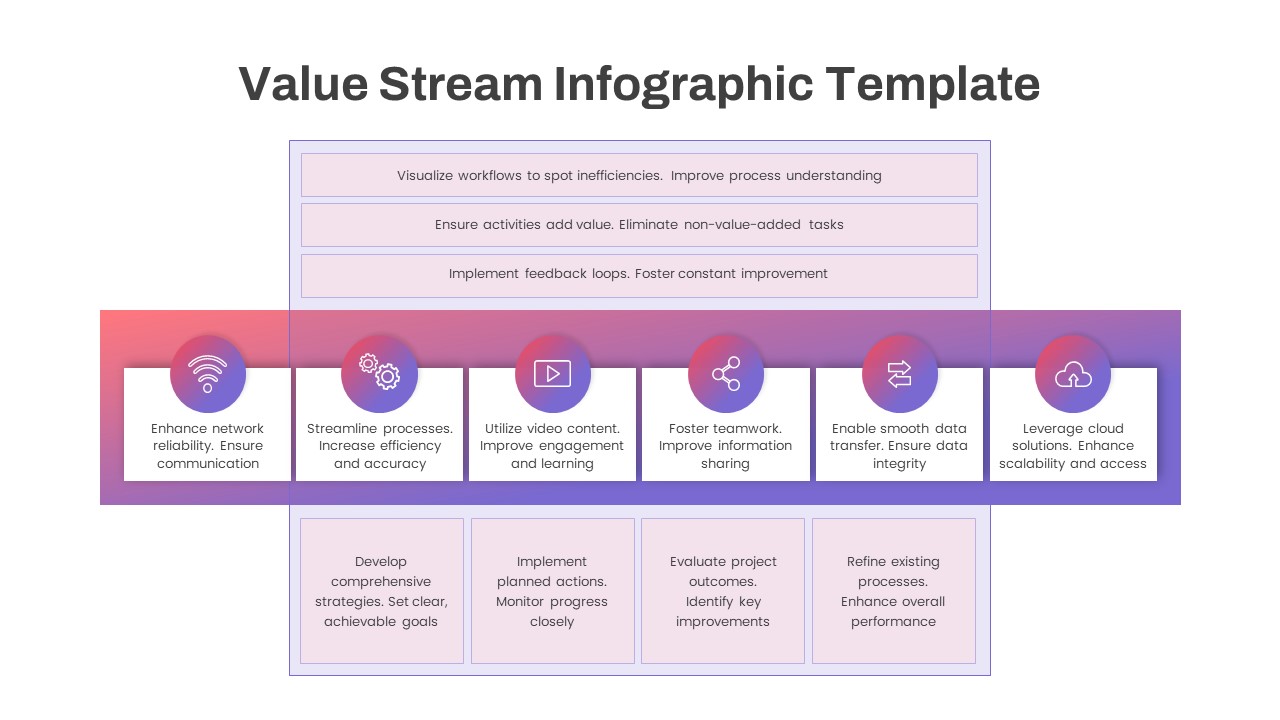
Comprehensive Value Stream Infographic Template for PowerPoint & Google Slides
Process
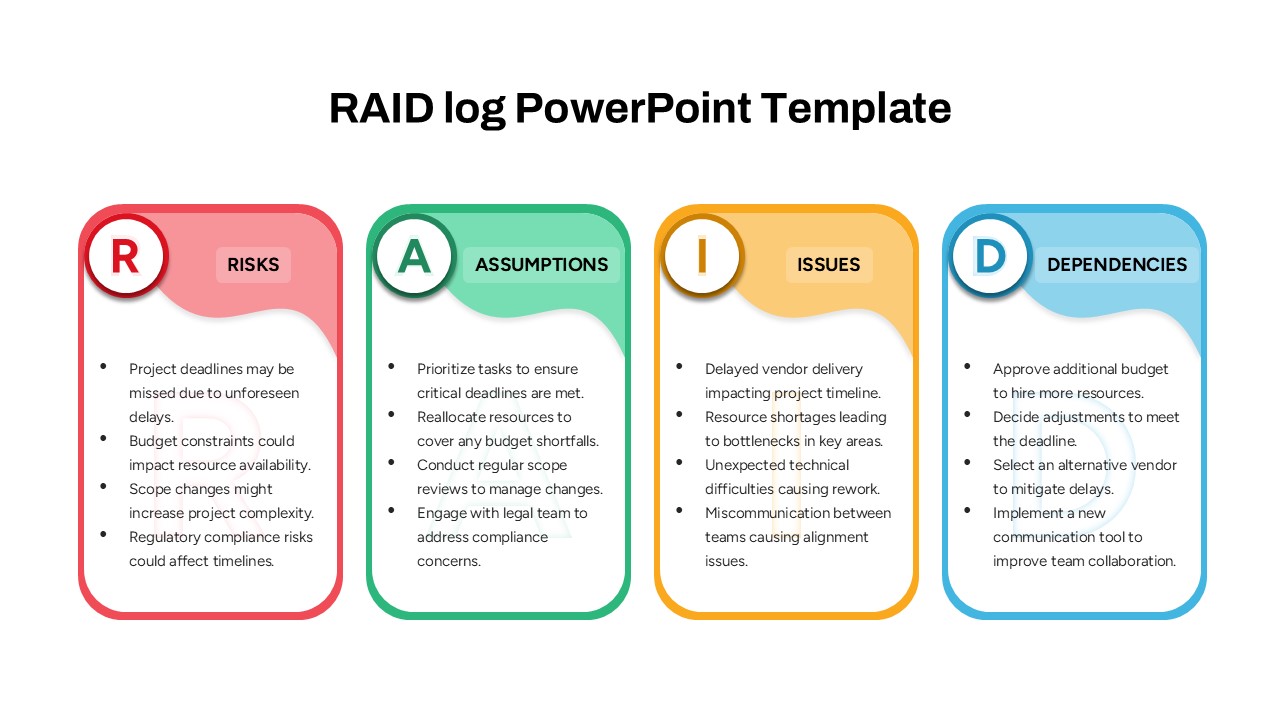
Comprehensive RAID Log Slide Pack Template for PowerPoint & Google Slides
Project
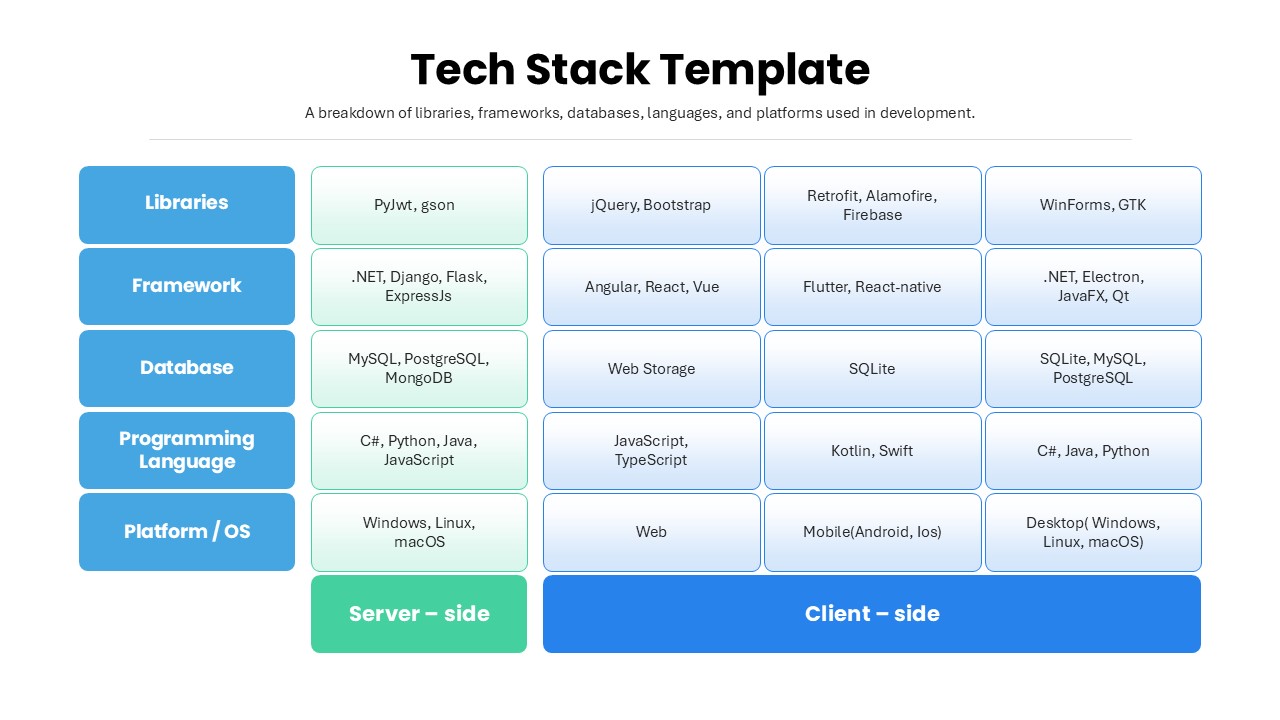
Comprehensive Tech Stack Breakdown Slide Template for PowerPoint & Google Slides
Software Development
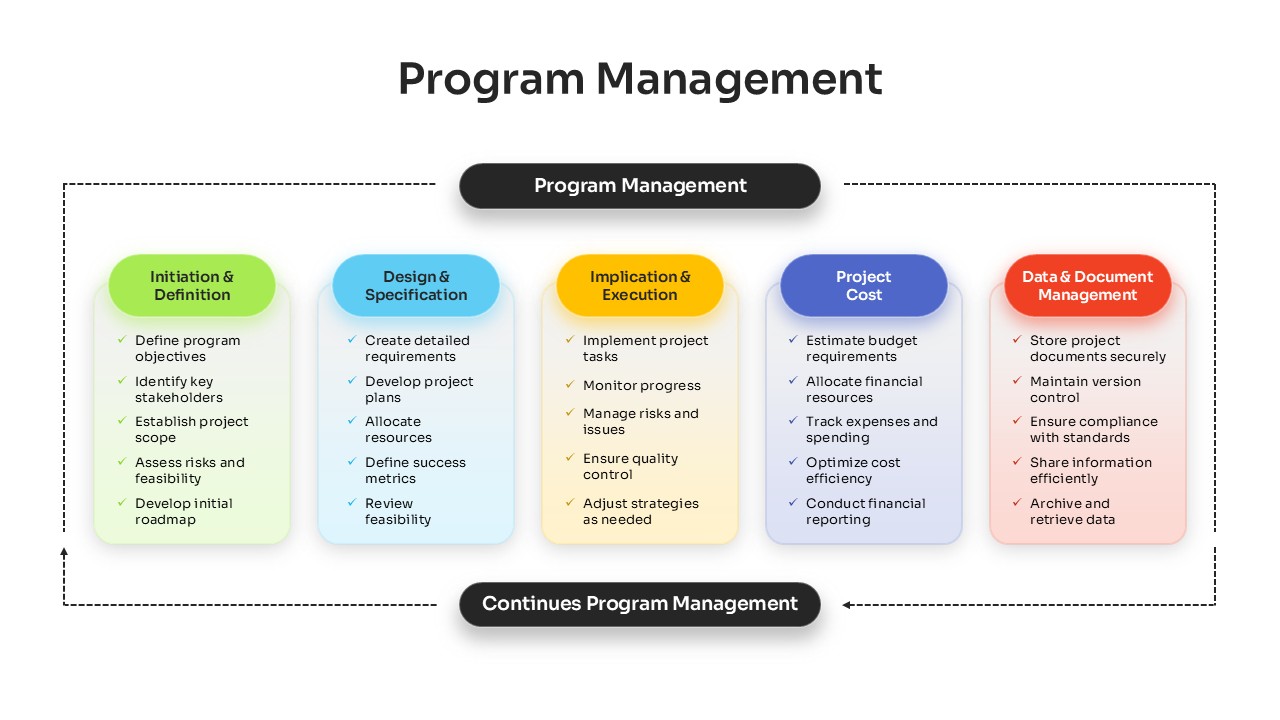
Comprehensive Program Management Process Template for PowerPoint & Google Slides
Process
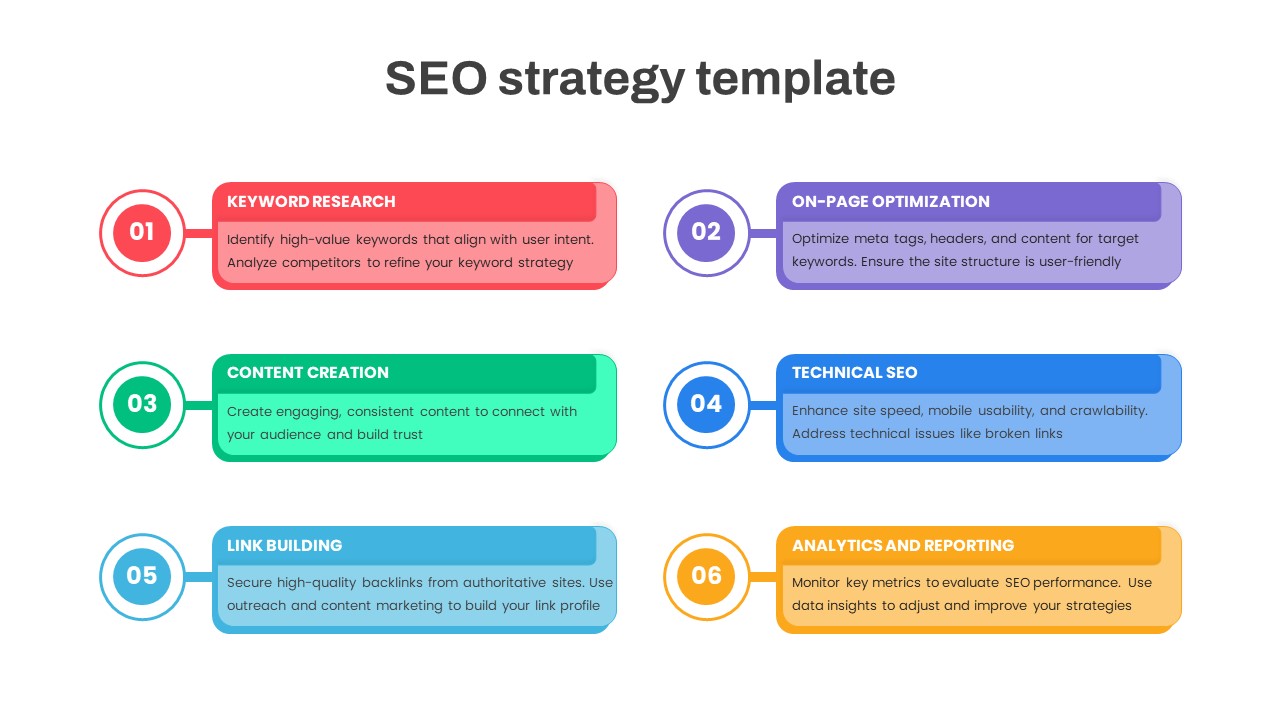
Comprehensive SEO Strategy Roadmap Template for PowerPoint & Google Slides
Digital Marketing
Comprehensive Data & AI Capability Model Template for PowerPoint & Google Slides
AI
Comprehensive Action Tracker Table Template for PowerPoint & Google Slides
Business
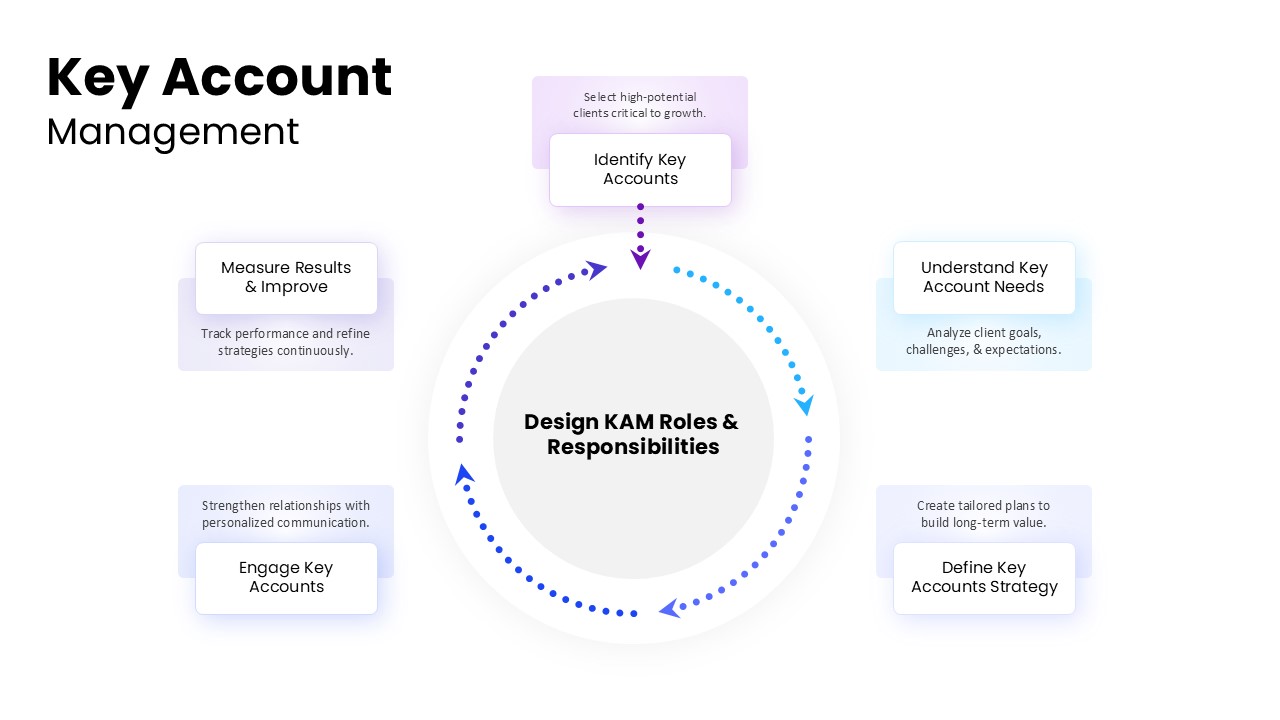
Comprehensive Key Account Management Template for PowerPoint & Google Slides
Process
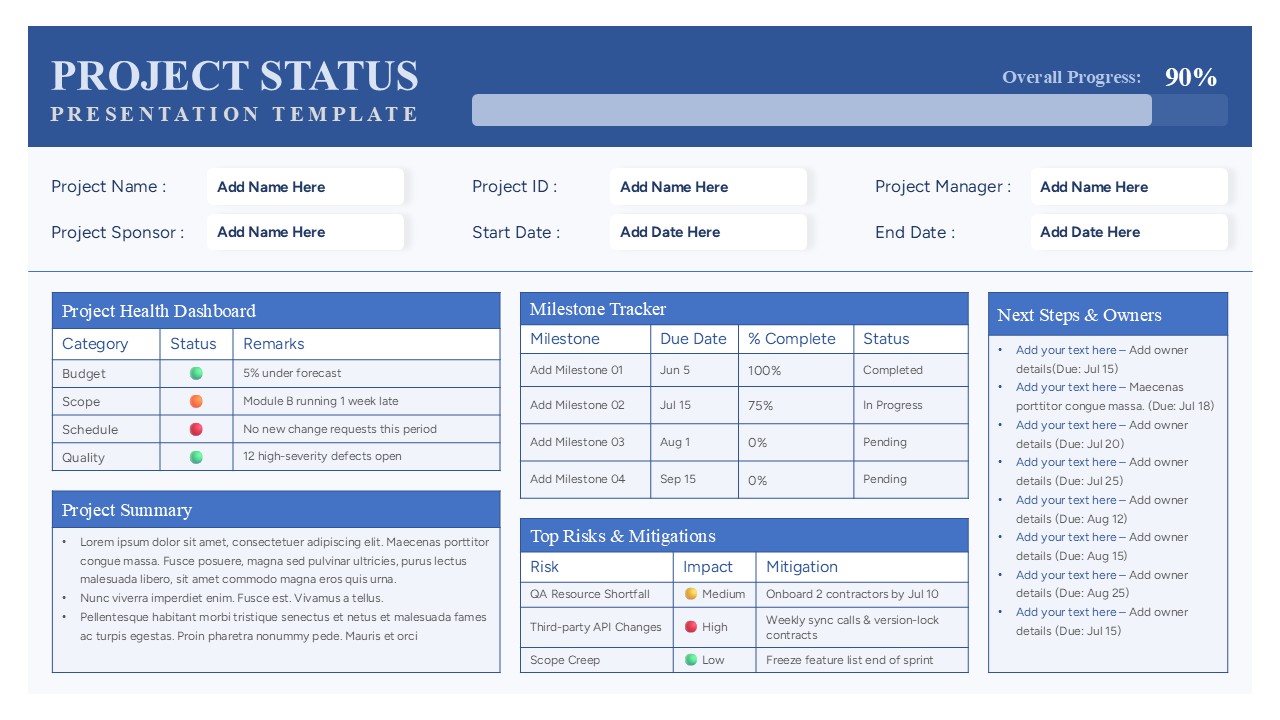
Comprehensive Project Status Report Template for PowerPoint & Google Slides
Project Status

Statement of Comprehensive Income & Income Statement Template for PowerPoint
Business Report
Social Media Market Share Pie Charts Template for PowerPoint & Google Slides
Pie/Donut
Dynamic Statistics & Progress Charts Template for PowerPoint & Google Slides
Pie/Donut
Project Progress Dashboard Pie Charts Template for PowerPoint & Google Slides
Project
Budget Forecast Dashboard & Donut Charts Template for PowerPoint & Google Slides
Pie/Donut
Free Professional Gantt Chart Pack – 4 Slides Template for PowerPoint & Google Slides
Gantt Chart
Free
Free Modern Gradient Wave Welcome Slides Template for PowerPoint & Google Slides
Free
Free
Free Colorful Morning Meeting Agenda Slides Template for PowerPoint & Google Slides
Agenda
Free
Free New Year’s Resolution Slides Pack for PowerPoint & Google Slides 2023
Graphics
Free
BEST: Free Business PowerPoint Templates for Download
Company Profile
Free
Free Garden Area PowerPoint Template for PowerPoint & Google Slides
Marketing
Free
Free Teacher’s Week Plan PowerPoint Template for PowerPoint & Google Slides
Decks
Free
Free Animated Church PowerPoint Template for PowerPoint & Google Slides
Decks
Free
Free About Me PowerPoint Template
Employee Performance
Free
Free KPI Dashboard Template for PowerPoint & Google Slides
Charts
Free
Free Case Study PowerPoint Template
Infographics
Free
Free Monthly Report PowerPoint Template
Business Report
Free
Free Callout Boxes PowerPoint Shapes for PowerPoint & Google Slides
Infographics
Free
Free Infographic Deck PowerPoint Pack for PowerPoint & Google Slides
Infographics
Free
Free Fishbone Diagram PowerPoint Template
Project
Free
Free Professional Cloud Infographics Template for PowerPoint & Google Slides
Process
Free
Free Application Mockup Screens Infographic Template for PowerPoint & Google Slides
Comparison
Free
Corporate Presentation Template – Free Download
Pitch Deck
Free
Free Christmas Celebration Presentation template for PowerPoint & Google Slides
Pitch Deck
Free
Free Emoji Template for PowerPoint and Google Slides
Graphics
Free
Free Real Estate PowerPoint Template
Company Profile
Free
Free Black History Month PowerPoint Template
Pitch Deck
Free

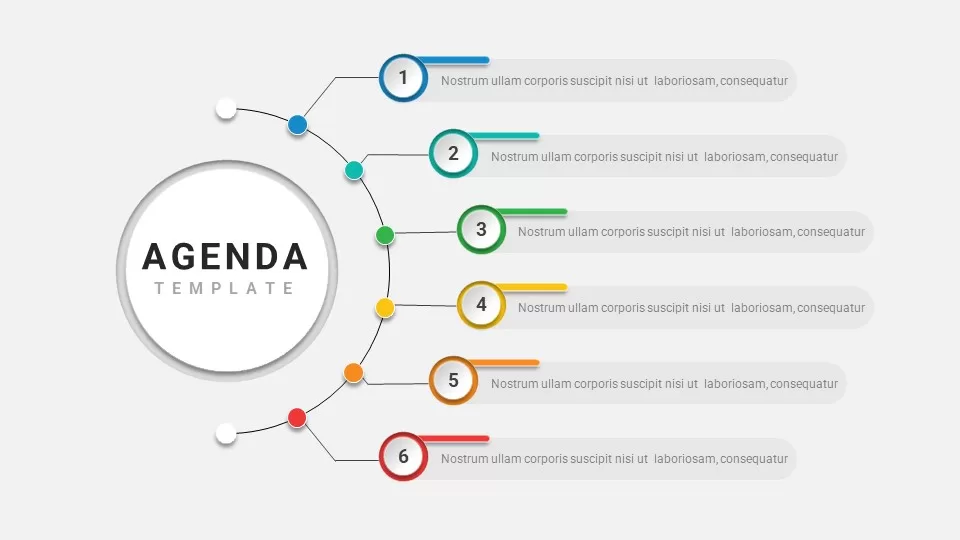
Free Agenda PowerPoint Template & Google Slides
Agenda
Free
Free Veterans Day Patriotic Slide Pack Template for PowerPoint & Google Slides
Graphics
Free
Free Animated Countdown Timer Slide Template for PowerPoint & Google Slides
Free
Free
Free Editable U.S. Map Template for PowerPoint
World Maps
Free
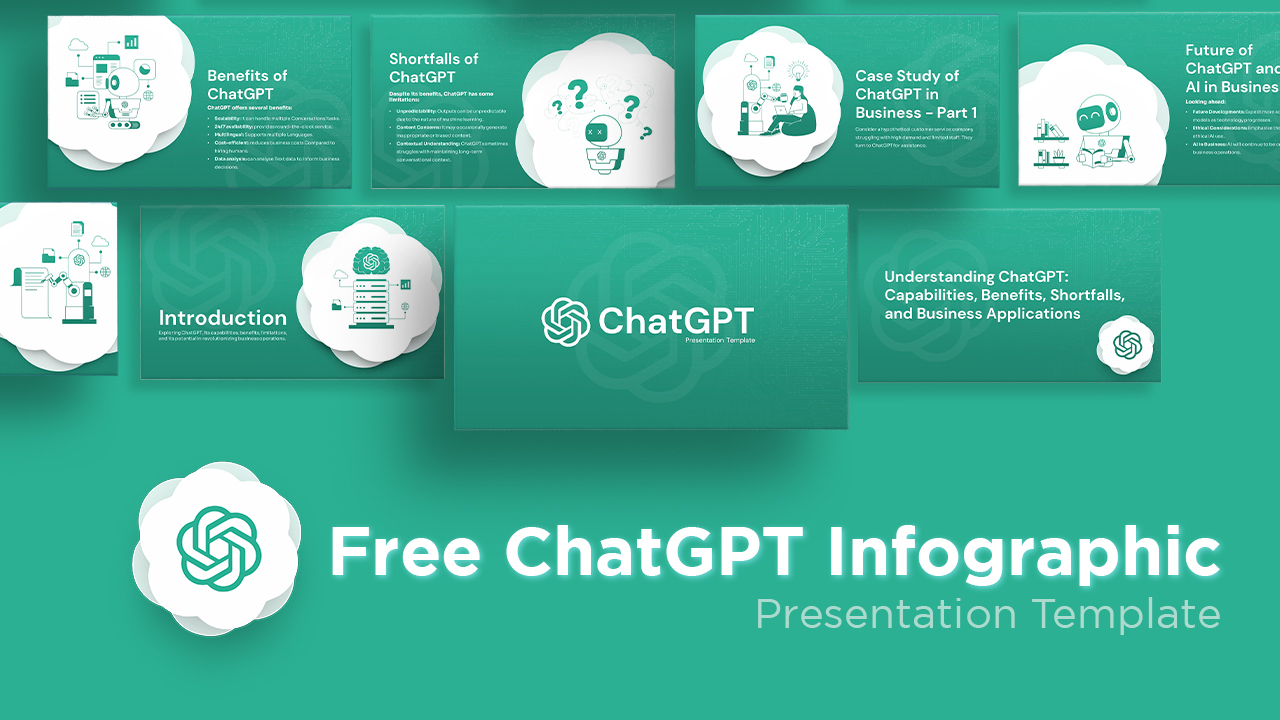
Free ChatGPT Infographic Presentation Template
Pitch Deck
Free
Free Happy 4th of July Celebration Template for PowerPoint & Google Slides
Graphics
Free
Free World UFO Day Slide Template for PowerPoint & Google Slides
Business
Free
Free Coffee PowerPoint Presentation Template
Company Profile
Free

Free Company Profile PowerPoint Template for Business Presentations
Company Profile
Free
Free Animated Gradient Corporate Presentation Template for PowerPoint & Google Slides
Company Profile
Free
Free Snow Animation Template for PowerPoint & Google Slides
Graphics
Free
Free Hexagonal Six-Step Business Strategy Template for PowerPoint & Google Slides
Process
Free
Free Traffic Light Project Status Slide Template for PowerPoint & Google Slides
Project Status
Free
Free Brain Function Diagram Infographic Template for PowerPoint & Google Slides
Process
Free
Free Modern About Me Profile Slide Template for PowerPoint & Google Slides
Company Profile
Free
Free Balanced Scorecard Template PowerPoint and Google Slides
Employee Performance
Free
Free Time Management Clock Cycle Diagram Template for PowerPoint & Google Slides
Process
Free
Free Economics PowerPoint Template & Google Slide
Decks
Free
Free Tiktok PowerPoint Template
Company Profile
Free
Free Forest PowerPoint Template
Company Profile
Free
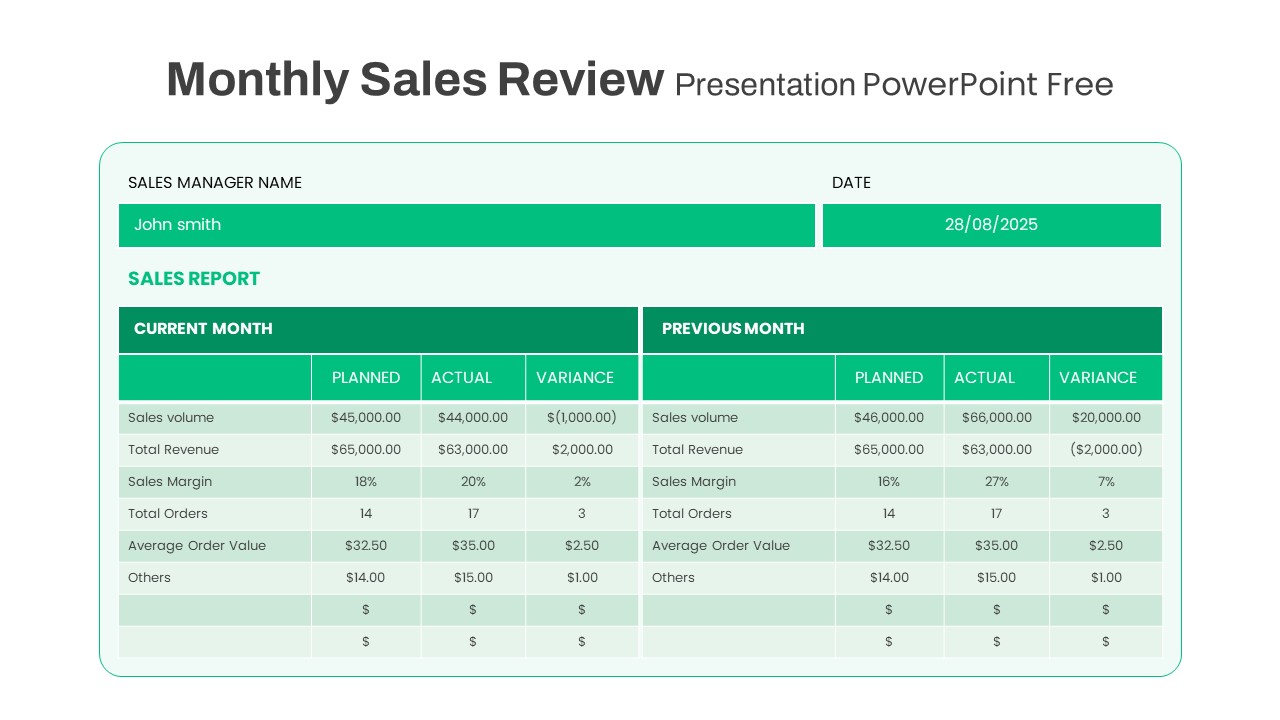
Free Monthly Sales Review template for PowerPoint & Google Slides
Business Report
Free
Free Online Shopping 3-Slide Infographic Template for PowerPoint & Google Slides
Digital Marketing
Free
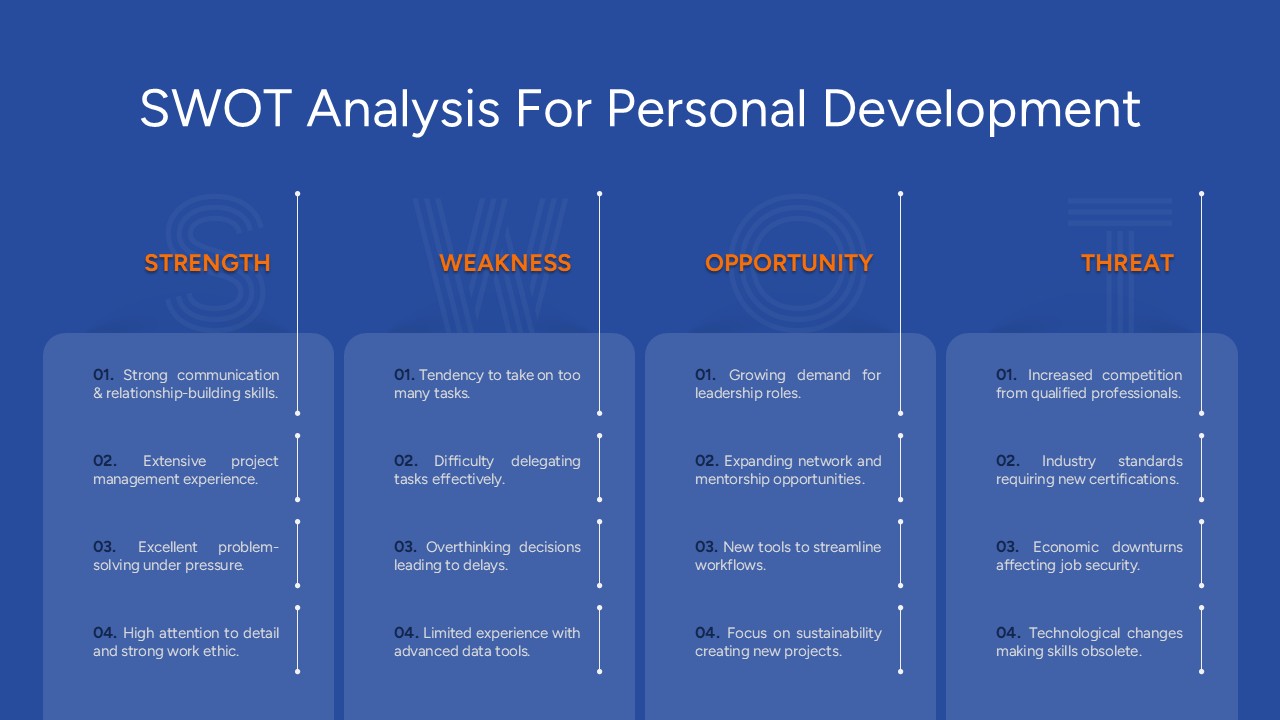
Free SWOT Analysis for Personal Development Template for PowerPoint & Google Slides
SWOT
Free