Free Simple Venn Diagram PowerPoint Template
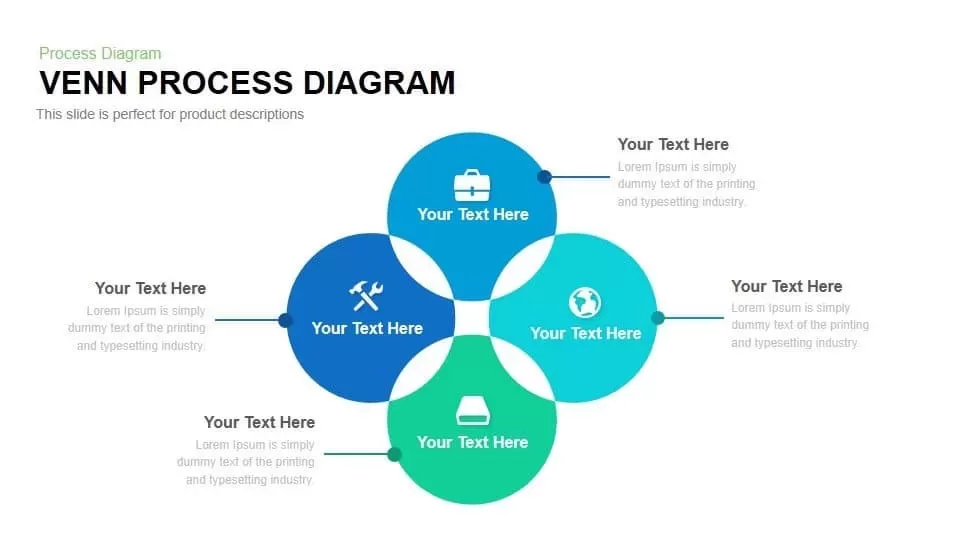
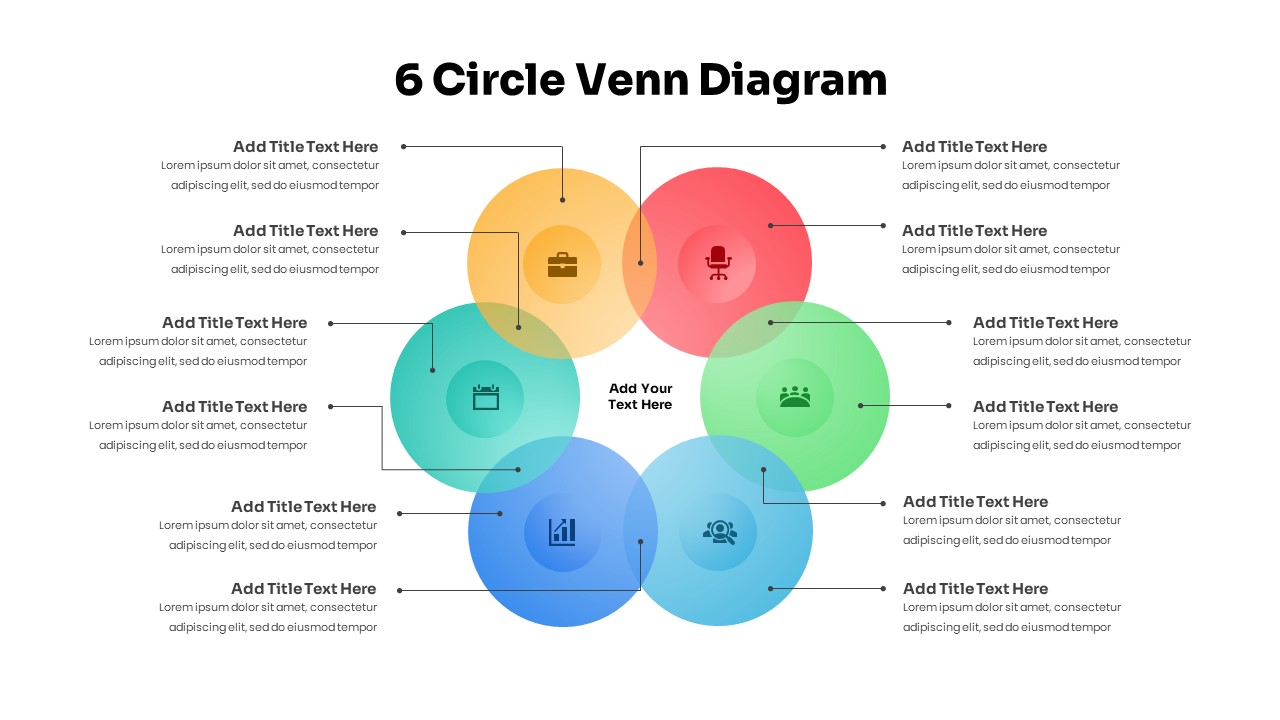
Free Simple Venn diagram powerpoint template allow the users to display three data sets with similarities and differences. Venn diagrams are statistical tools to transmit correlation with a clear understanding fashion. It enables the audience to easily grasp the core ideas using the three-circle Venn diagram powerpoint templates. It visually displays the intersecting of loops as a pictorial representation of the statistical data. The Venn diagram ideally shows the differences and similarities using overlapping circles. The non-intersecting parts allow you the reveal three entities of the information, and the intersecting sections will show the similarities between the three. The overlapping PPT circles help to show the common by-product in a logical relationship. For example, you can show the similarities of three different animals, i.e., cow, goat, and buffalo, by showing the common by-product it provides for human health: milk.
A free simple Venn diagram PowerPoint template is an instructive template, so it is the best of educational PowerPoint presentations. For example, it helps demonstrate statistical analysis, math displays, logical reasoning, science, technology, and business. The One Pager template uses three colors for circle creation. Besides, the circles are ornamented with infographic icons. The black and white PowerPoint background allows medication and changes if you need a different backdrop. Similarly, size, shape, and fonts are replaceable. Download our free venn diagram template and free powerpoint templates for educational presentations.
Login to download this file
Add to favorites
Add to collection


