Five Circle Venn Diagram for Template for PowerPoint & Google Slides


5 Circle Venn Diagram Template for PowerPoint
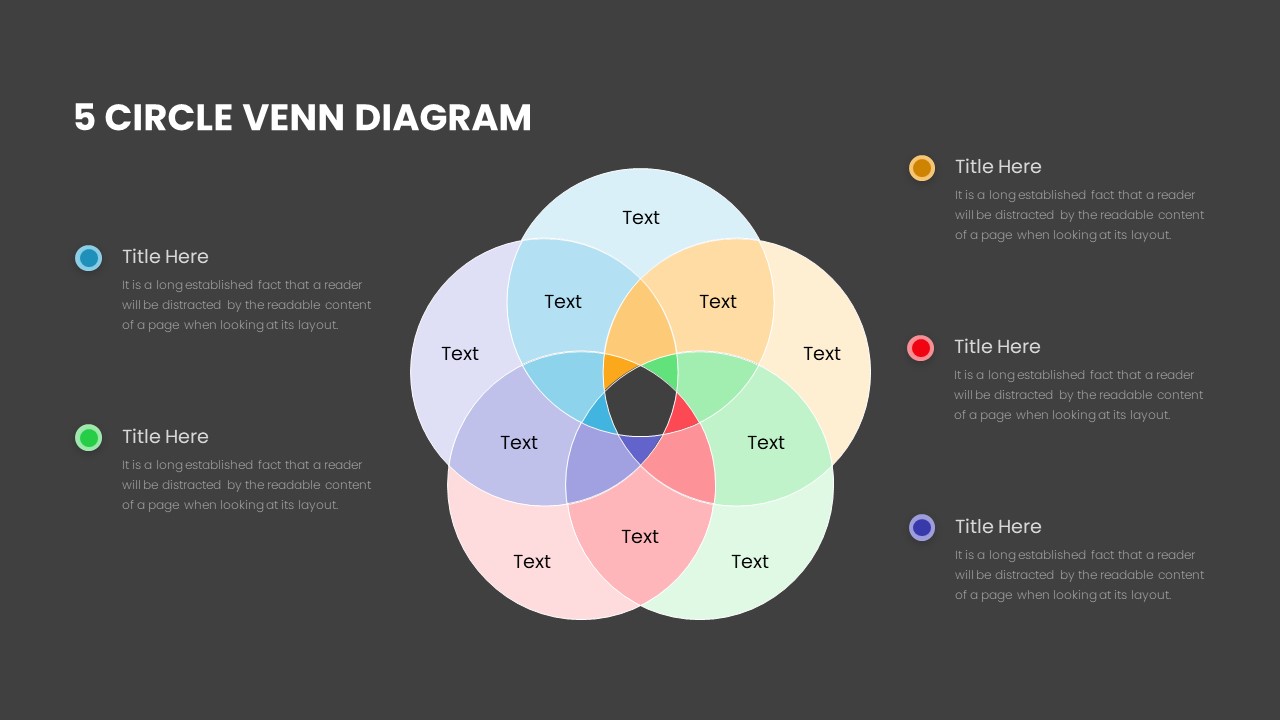
If you have ever tried to explain how five different variables connect, overlap, and influence each other using a bullet list, you already know how quickly that falls apart. The relationships get muddled, the audience loses the thread, and you end up spending more time explaining the explanation than actually making your point. That is exactly the kind of problem a good Venn diagram solves, and this 5 circle Venn diagram template for PowerPoint is built to solve it well.
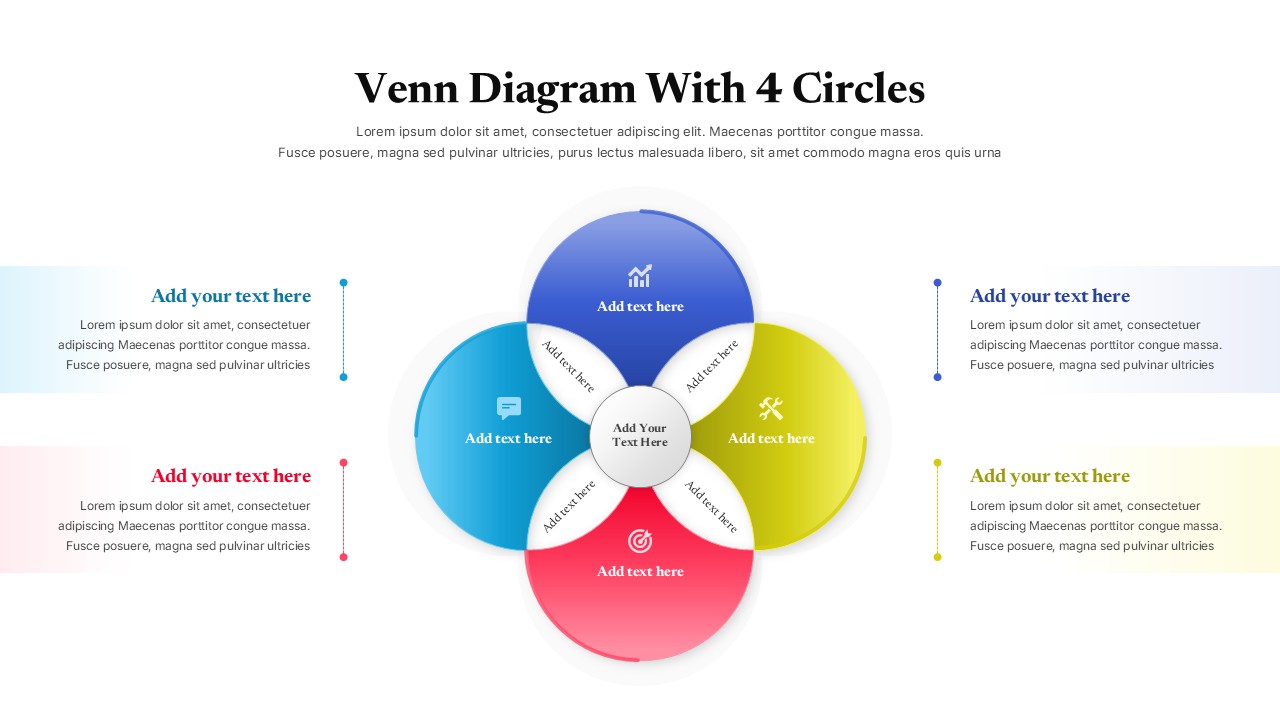
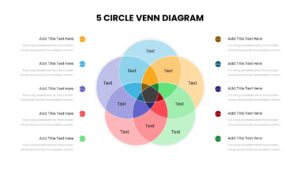
The five interconnecting loops give you a visual structure that makes overlapping relationships immediately clear. Whether you are presenting a merger analysis, comparing product categories, mapping shared traits across customer segments, or illustrating how different variables interact simultaneously, the diagram handles the complexity without making the slide feel overwhelming. Each intersection point represents a relationship between sets, and that logic is visible at a glance without needing a wall of text to support it.
The template uses soft and hard color combinations across the five circles to make each set and its overlapping zones easy to distinguish. Text placeholder areas sit on either side of the diagram, giving you space to add descriptions, labels, or supporting points without crowding the visual. Number sequences are also included for organizing textual content in a structured and readable format.
A Fully Editable 5 Circle Venn Diagram for PowerPoint and Google Slides
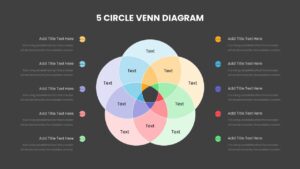
Everything in this template is fully customizable. The circle shapes are built as editable vector elements, so you can resize them, recolor them, and rearrange the layout without losing any visual quality. Swap in your own color codes to match brand guidelines, adjust the transparency of overlapping zones to make intersections more readable, or add clipart and PPT images directly into the diagram palette. Two variant formats are included, giving you options depending on whether your content is more visual or text-heavy.
The template works in both PowerPoint and Google Slides, so collaboration across teams and platforms is straightforward. If you are not particularly experienced with PowerPoint design, the good news is that you do not need to be. The diagram is structured well enough that keeping it close to the original layout will still give you a professional-looking result. The color mixing and visual balance are already done for you.
For anyone exploring similar layouts, the internal link to Venn diagram PowerPoint templates is worth checking out, and if you need one more layer of complexity, the 6 circle Venn diagram PowerPoint template is a natural next step.
Who Is It For
Business professionals, researchers, educators, and consultants who regularly need to present overlapping data, compare multiple groups, or visualize complex relational structures will find this template genuinely useful. It is also a strong fit for marketing teams running competitive analyses, product teams mapping feature overlaps, and trainers building visual learning materials for workshops or e-learning modules.
Other Uses
Beyond data comparison and research presentations, this 5 circle Venn diagram works well for personality assessments, logic exercises, strategic planning sessions, and academic presentations. Use it to express ideas visually, highlight similarities and differences between concepts, or map out how different teams, processes, or outcomes share common ground across your organization.
Login to download this file

Item ID
SB03441
Related Templates

Four-Circle Venn Process Diagram template for PowerPoint & Google Slides
Process

Creative Three-Circle Venn Diagram Template for PowerPoint & Google Slides
Comparison
8 Circle Venn Diagram PowerPoint Template
Circular
6 Circle Venn Diagram PowerPoint Template
Circular
Colorful Venn Diagram with 4 Circle for PowerPoint & Google Slides
Circular
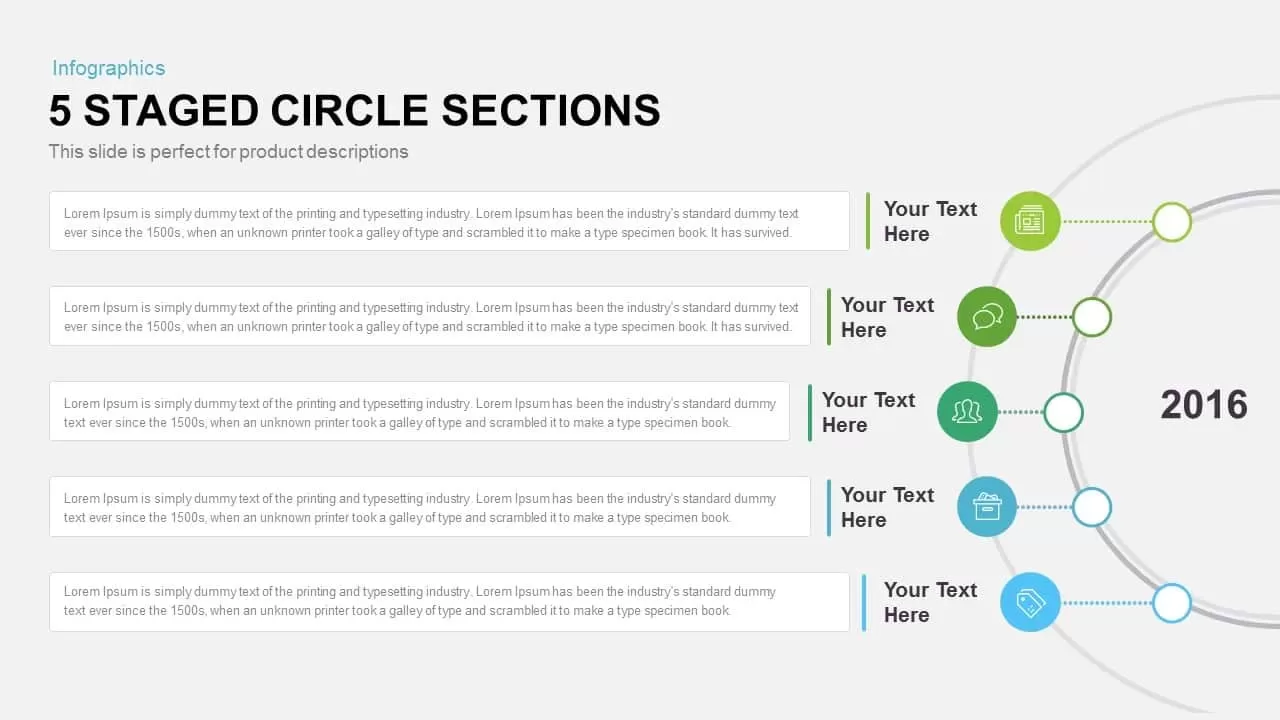
Five-Staged Circle Sections Diagram Template for PowerPoint & Google Slides
Circular
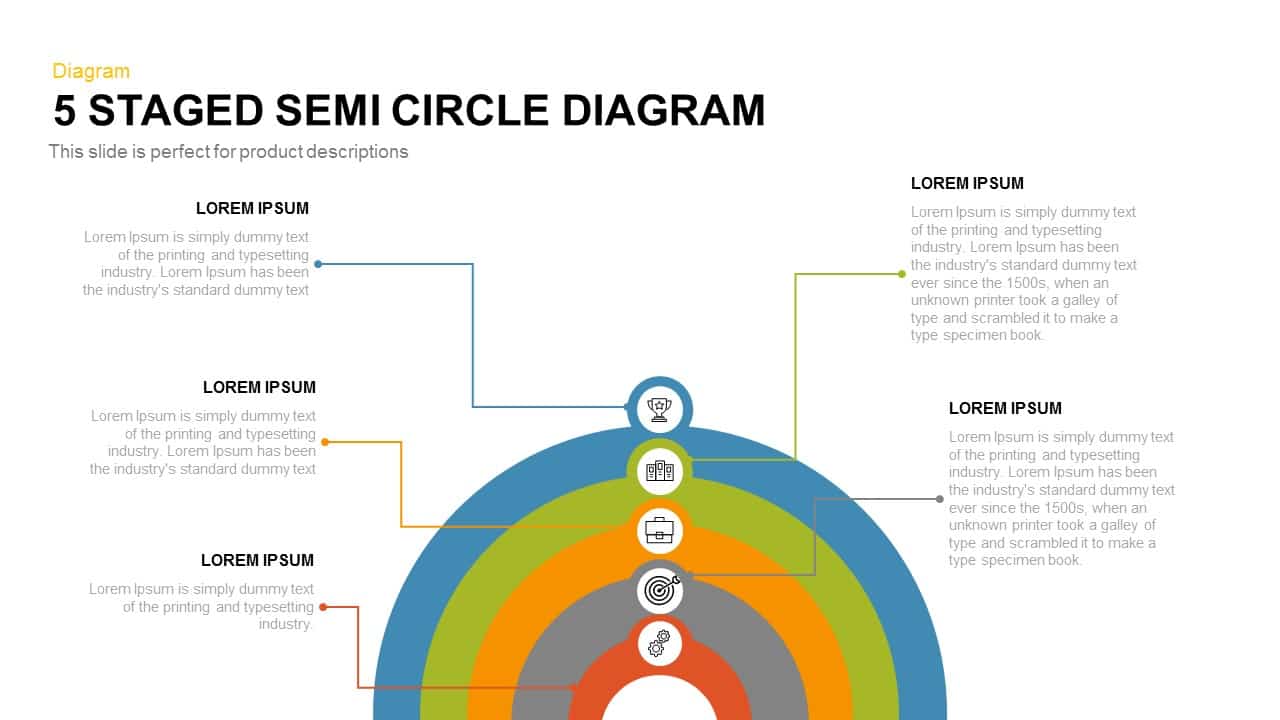
Five-Stage Semi-Circle Diagram Template for PowerPoint & Google Slides
Process
Five-Stage Circle Arrow Diagram Template for PowerPoint & Google Slides
Circular
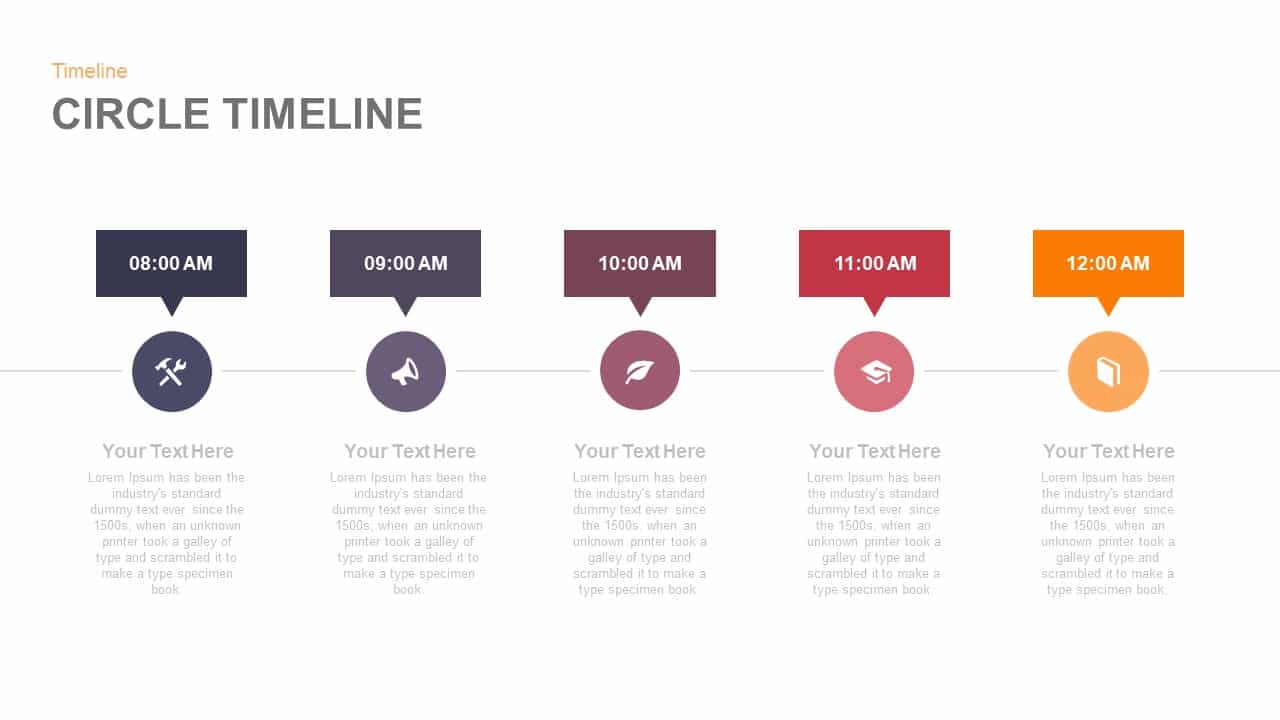
Five-Point Circle Timeline Diagram Template for PowerPoint & Google Slides
Timeline
Venn Diagram PPT Template and Google Slides
Circular
Past, Present & Future Venn Diagram Template for PowerPoint & Google Slides
Comparison
Colorful Venn Diagram Infographics Template for PowerPoint & Google Slides
Circular
Modern Gear Venn Diagram Infographic Template for PowerPoint & Google Slides
Comparison
Autonomy, Mastery & Purpose Venn Diagram Template for PowerPoint & Google Slides
Circular
Free Simple Venn Diagram Overview template for PowerPoint & Google Slides
Comparison Chart
Free
Free Venn Diagram template for PowerPoint & Google Slides
Charts
Free
Customer Centricity Venn Diagram template for PowerPoint & Google Slides
Infographics
Big Hairy Audacious Goal Venn Diagram Template for PowerPoint & Google Slides
Circular
MECE Framework Venn & Block Diagram Template for PowerPoint & Google Slides
Comparison
Corporate Synergy Venn Diagram Template for PowerPoint & Google Slides
Comparison
Salience Model Venn Diagram Infographic Template for PowerPoint & Google Slides
Circular
Modern Growth Hacking Venn Diagram Template for PowerPoint & Google Slides
Circular
Marketing Operations Venn Diagram Template for PowerPoint & Google Slides
Circular
3Ps Triple Bottom Line Venn Diagram Template for PowerPoint & Google Slides
Circular
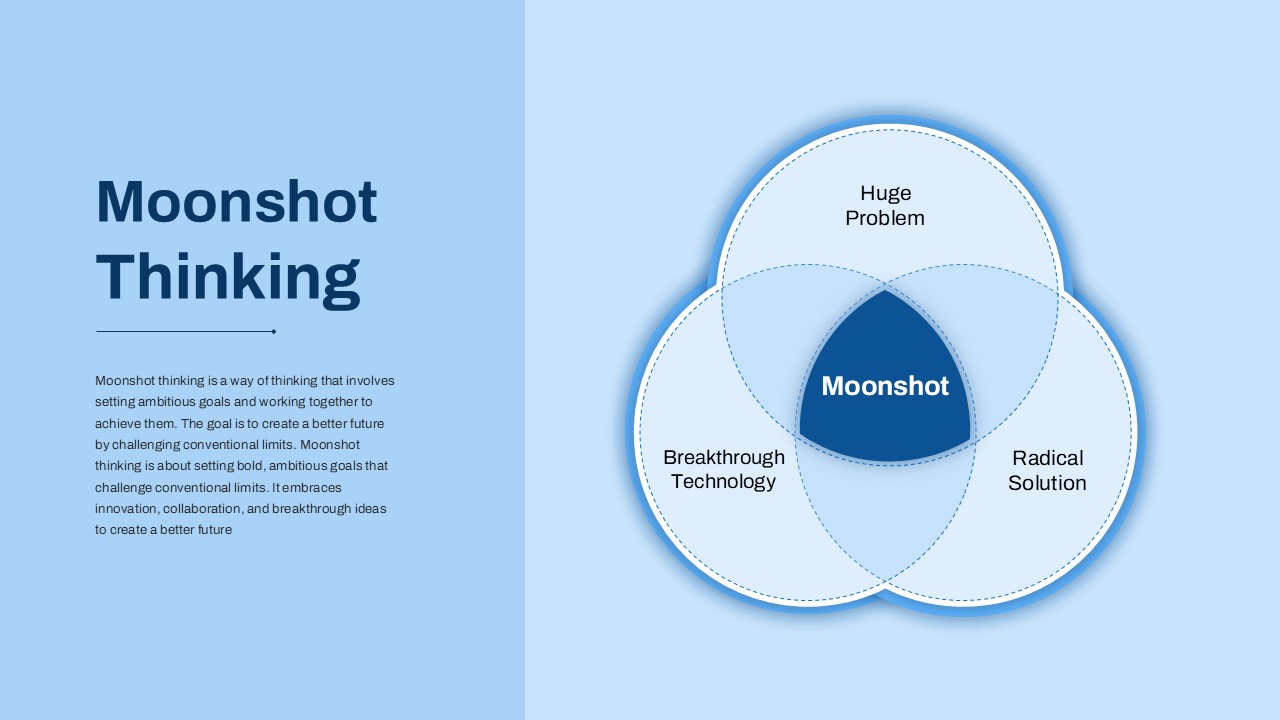
Bold Moonshot Thinking Venn Diagram Template for PowerPoint & Google Slides
Circular
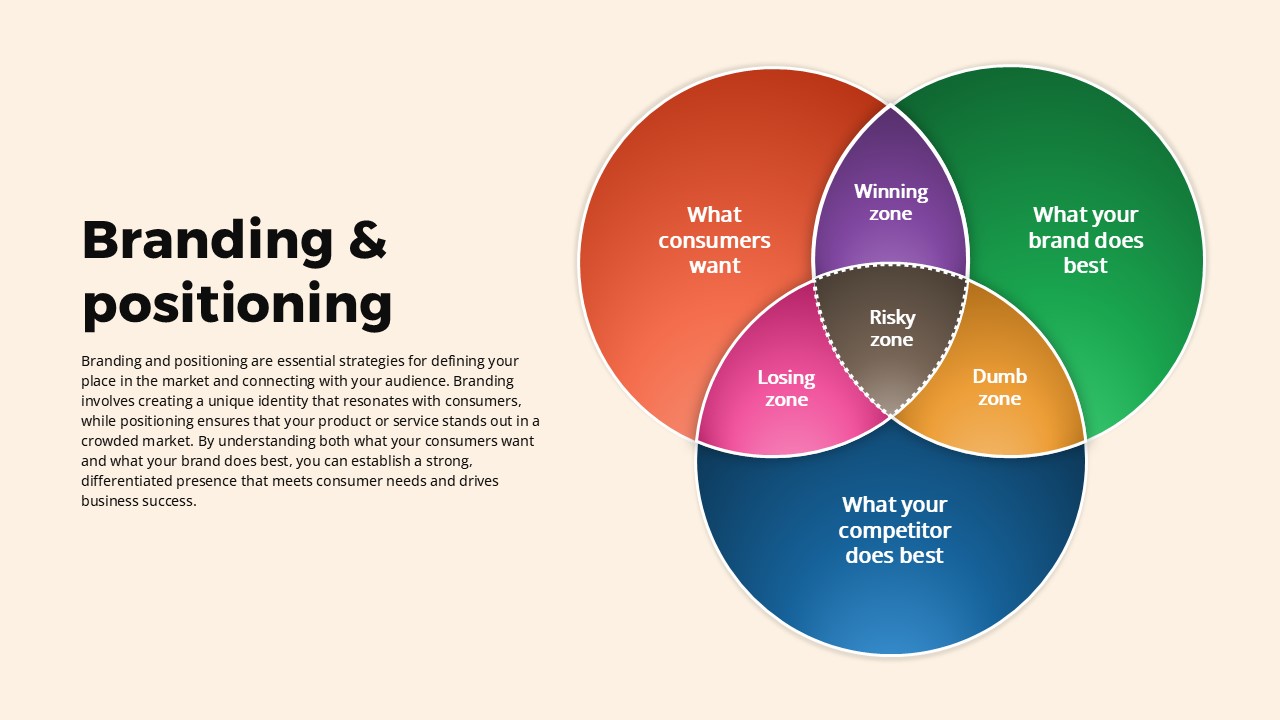
Branding and Positioning Venn Diagram Template for PowerPoint & Google Slides
Comparison
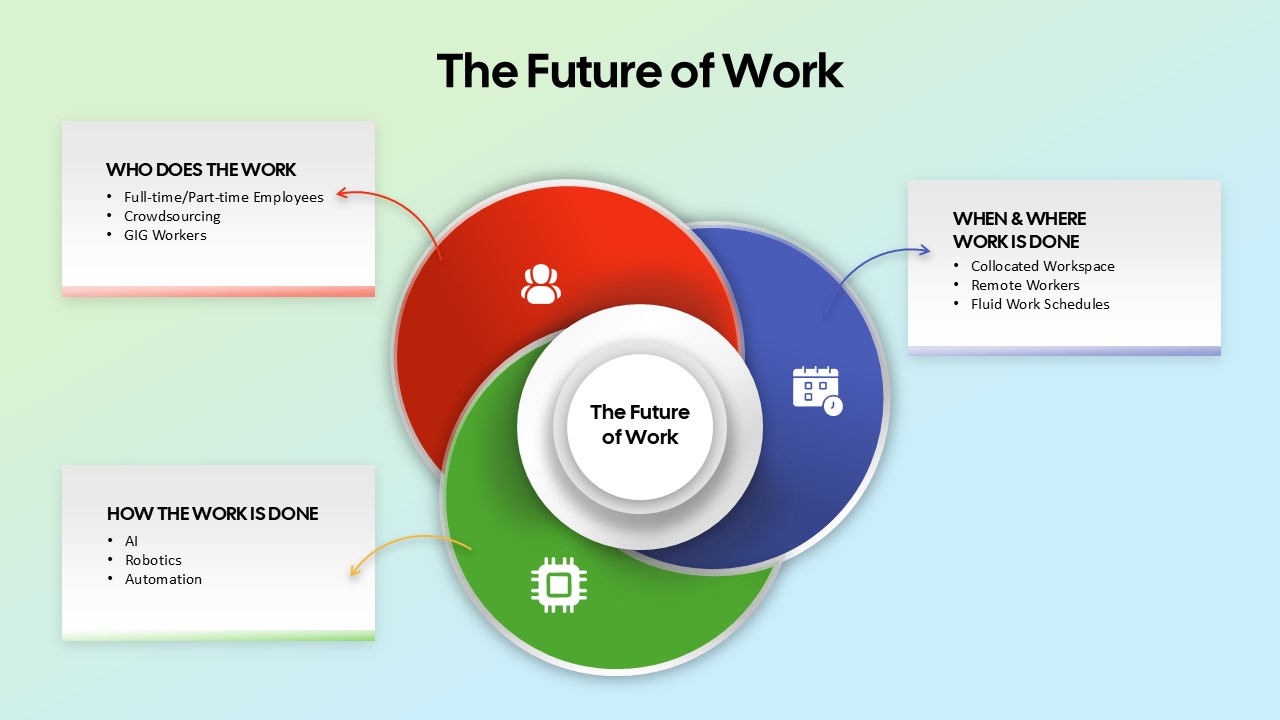
The Future of Work Venn Diagram Template for PowerPoint & Google Slides
Circular
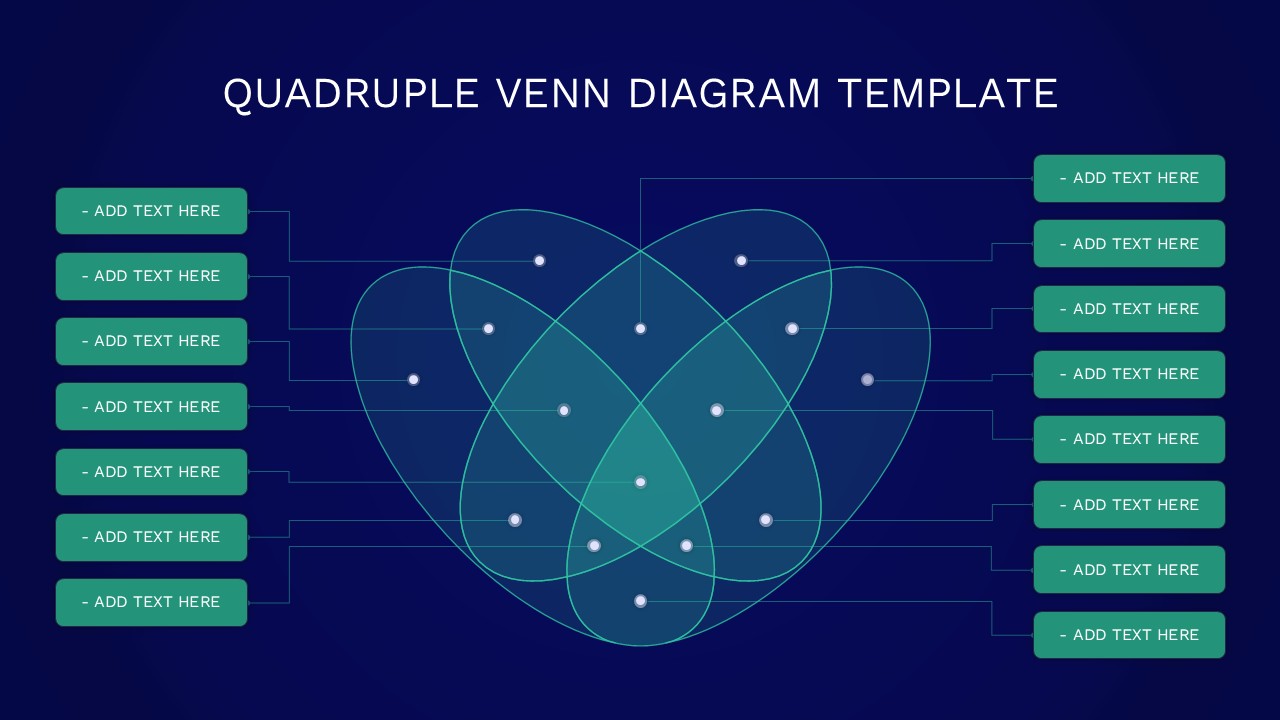
Quadruple Venn Diagram Template for PowerPoint & Google Slides
Circular
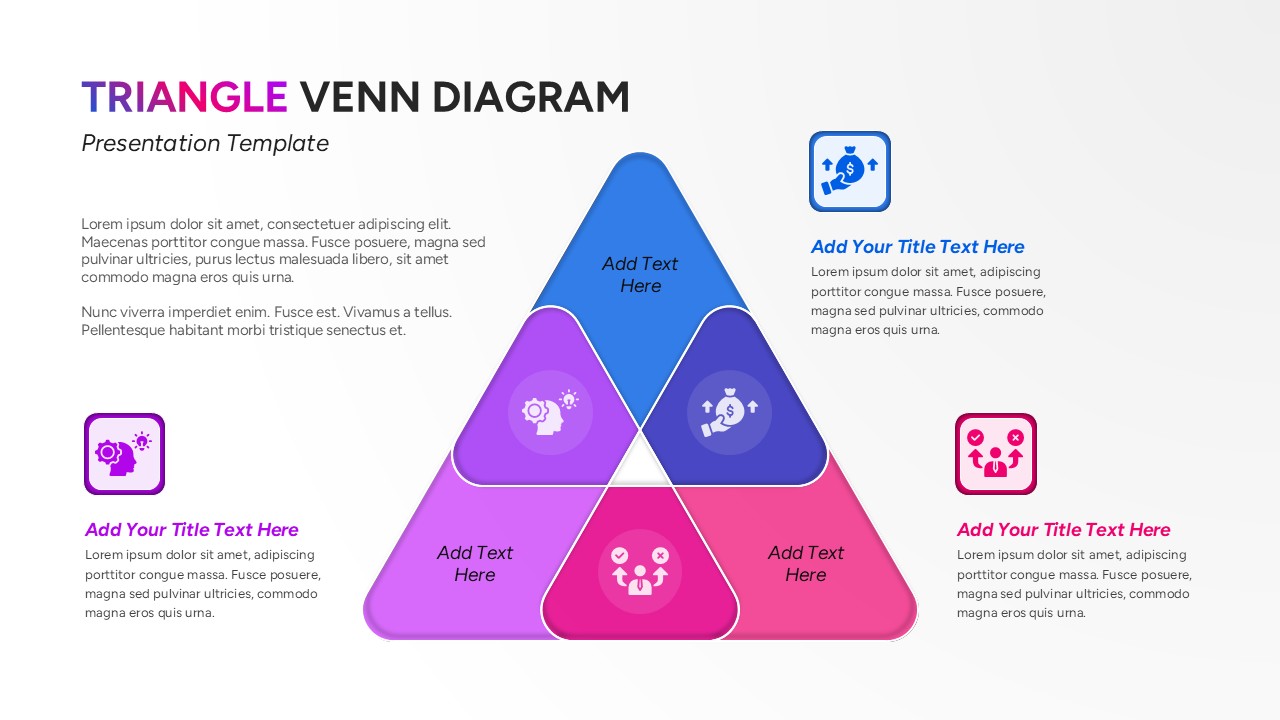
Triangle Venn Diagram Infographic Template for PowerPoint & Google Slides
Comparison
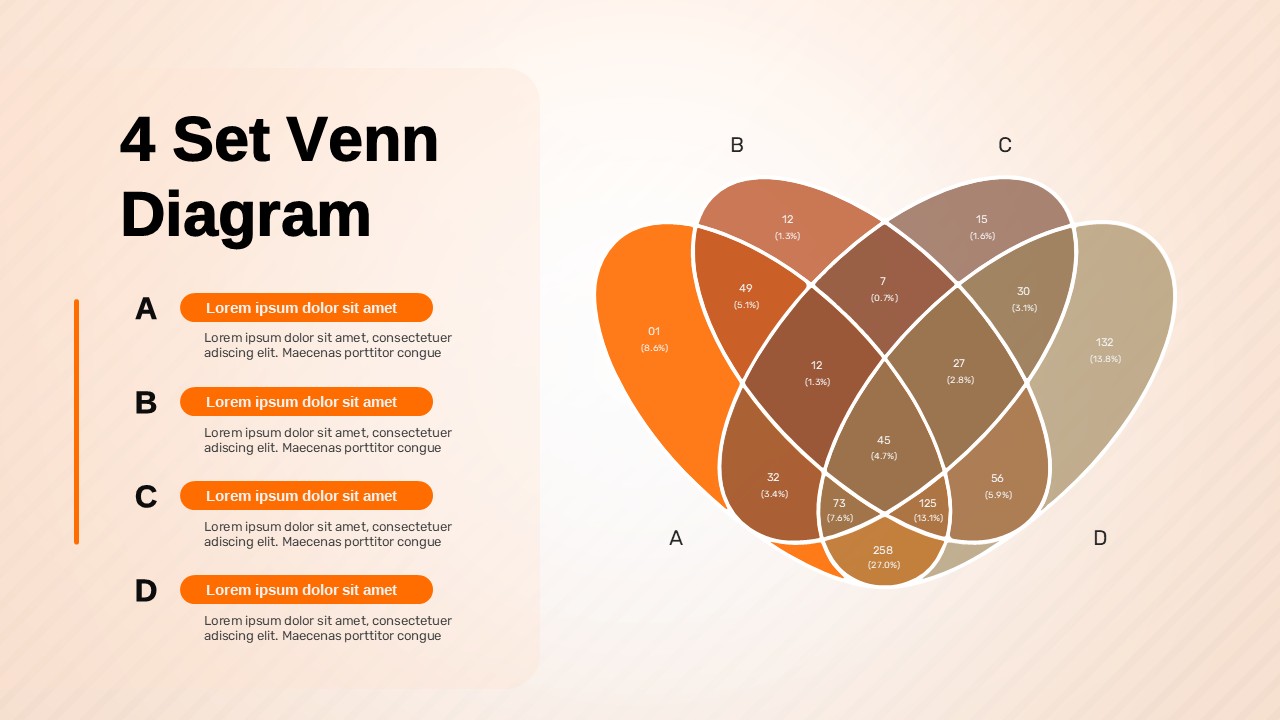
4 Set Venn Diagram Comparison Template for PowerPoint & Google Slides
Comparison
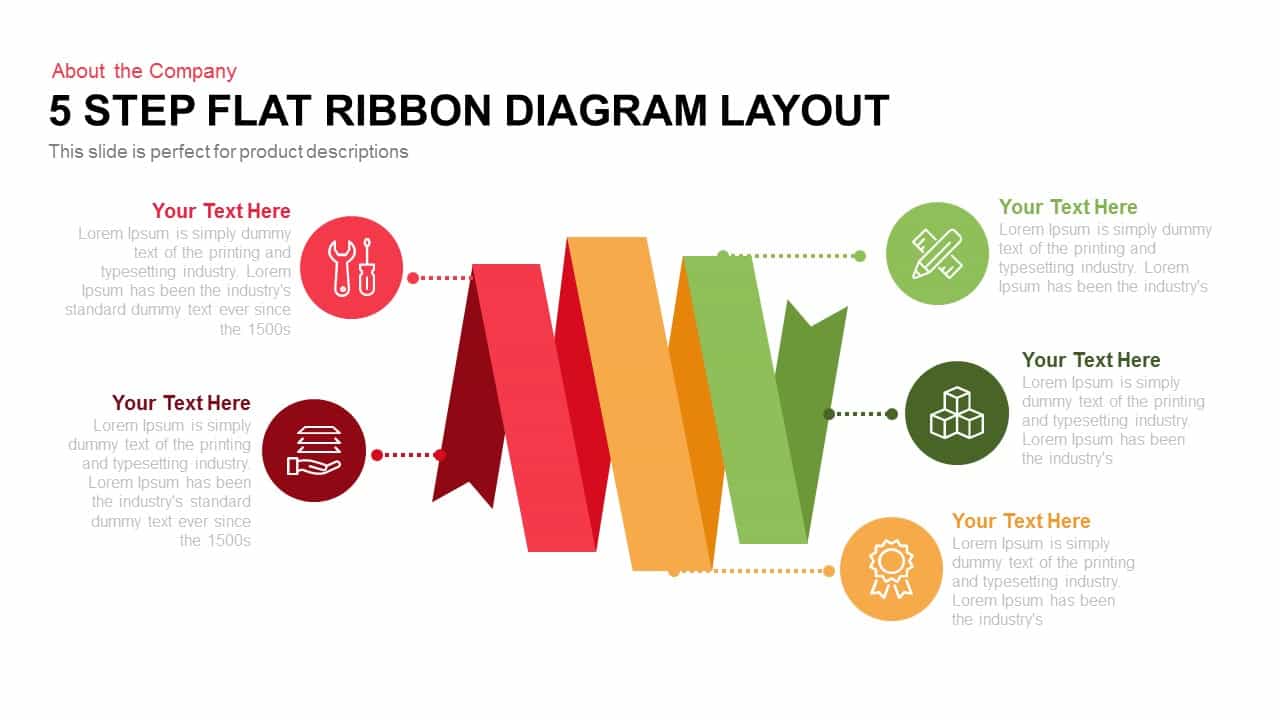
Five-Step Flat Ribbon Diagram Layout template for PowerPoint & Google Slides
Process
Five Up Arrow Infographic Diagram Template for PowerPoint & Google Slides
Arrow
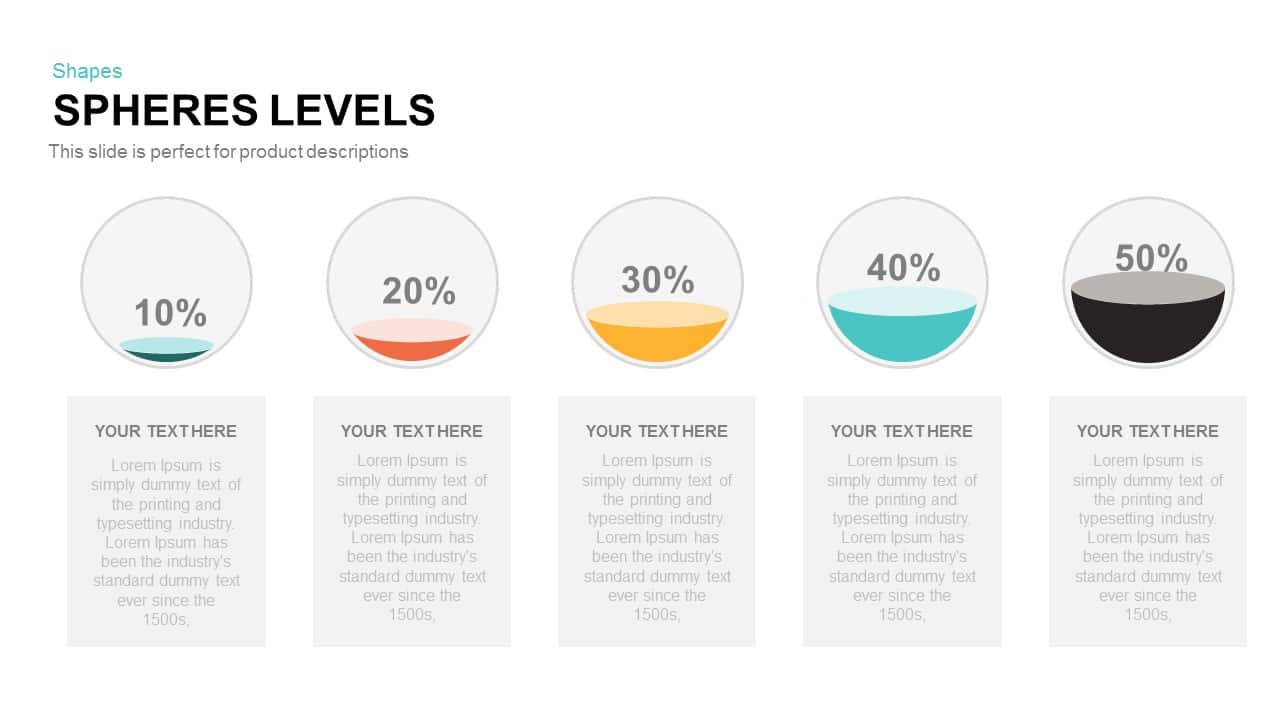
Five-Level Sphere Indicators Diagram template for PowerPoint & Google Slides
Infographics

Five-Step Gear Process Diagram Template for PowerPoint & Google Slides
Process
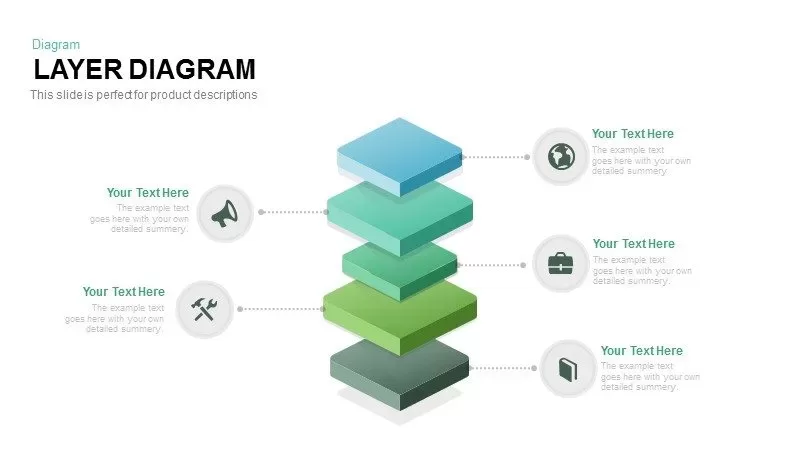
Five Layer Product Architecture Diagram Template for PowerPoint & Google Slides
Process

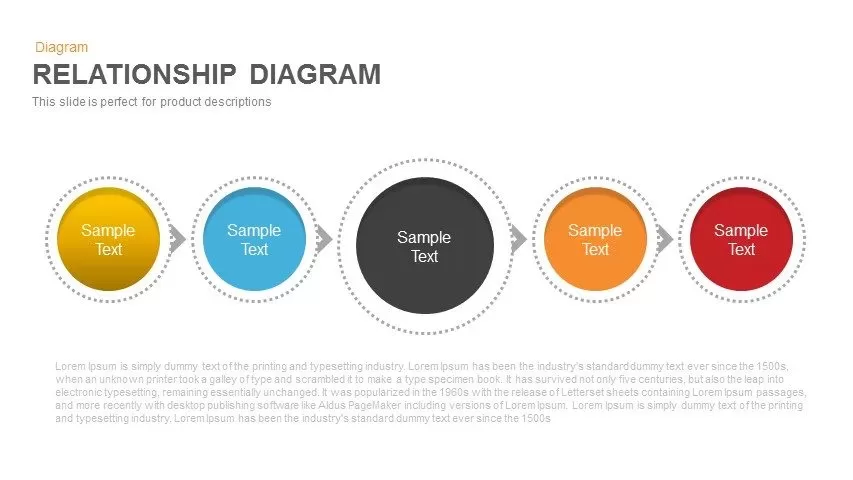
Colorful Five-Stage Relationship Diagram Template for PowerPoint & Google Slides
Process
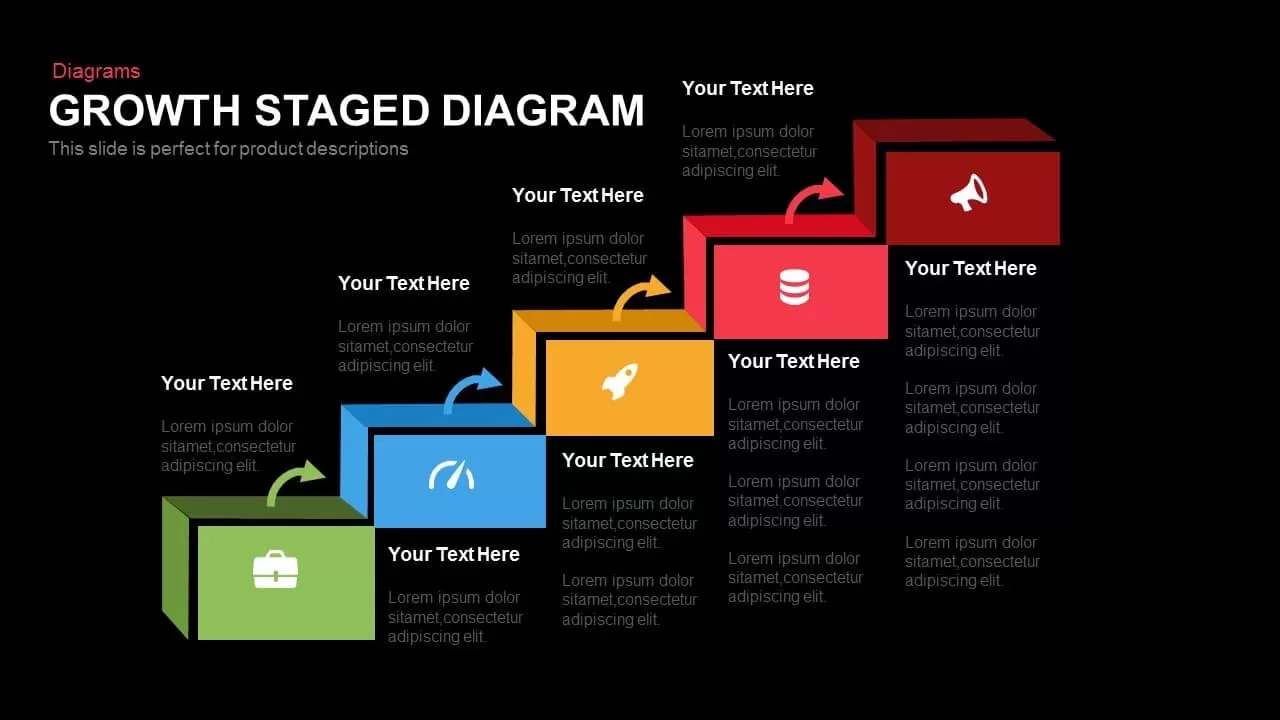
Five-Step Growth Stage Staircase Diagram Template for PowerPoint & Google Slides
Process
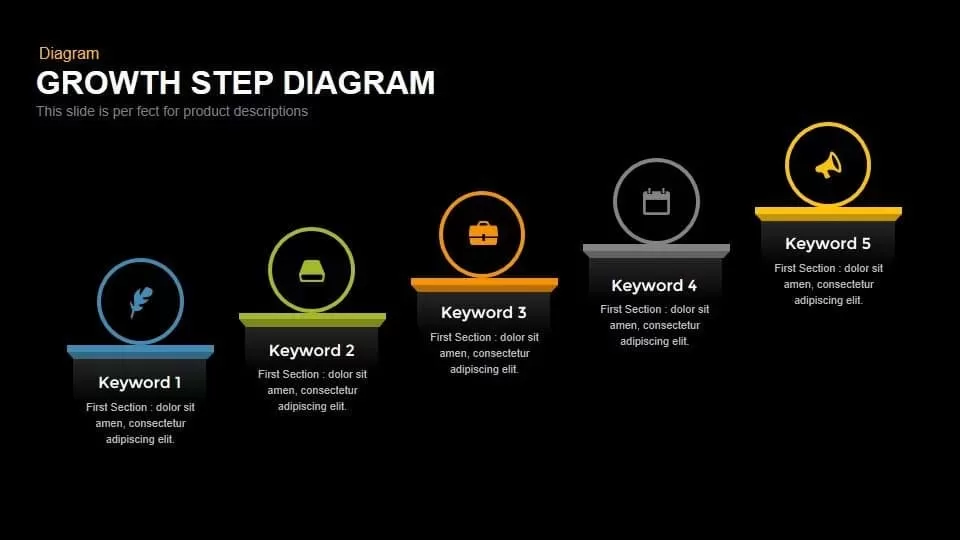
Modern Five-Step Growth Diagram Template for PowerPoint & Google Slides
Process
Five Arrow Infographics Diagram Template for PowerPoint & Google Slides
Arrow
Five-Section Circular Arrow Diagram Template for PowerPoint & Google Slides
Circular
Five-Stage Star Diagram for Milestones Template for PowerPoint & Google Slides
Process
Five-Stage Pyramid Infographics Diagram Template for PowerPoint & Google Slides
Pyramid
Five-Stage Zig-Zag Arrow Diagram Template for PowerPoint & Google Slides
Process
Cycle Process PowerPoint Template
Process
Five-Section Arrow Signpost Diagram Template for PowerPoint & Google Slides
Arrow
Pencil Section Five-Part Diagram Template for PowerPoint & Google Slides
Process
Engaging Five-Stage Process Diagram Template for PowerPoint & Google Slides
Process
Four and Five-Stage Funnel Diagram Template for PowerPoint & Google Slides
Funnel
Five-Part Pentagon Shaped Diagram Template for PowerPoint & Google Slides
Process
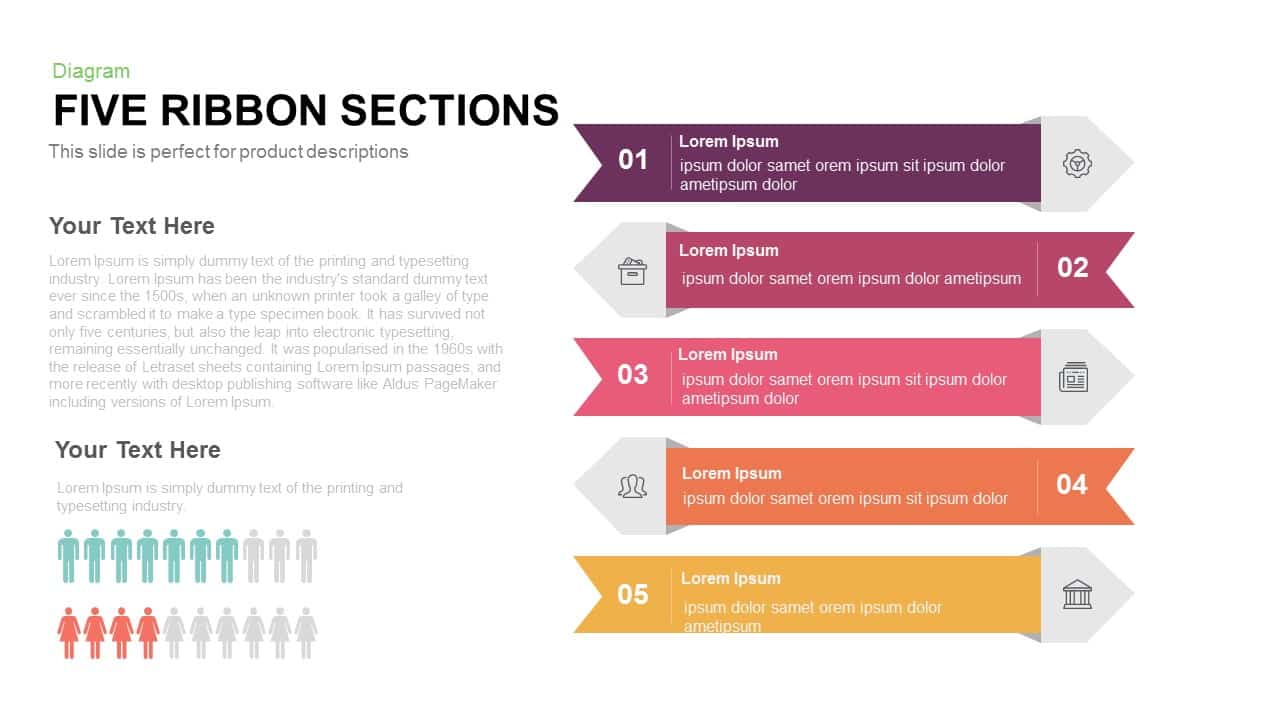
Five Ribbon Sections Process Diagram Template for PowerPoint & Google Slides
Process
Five-Stage Pentagon Arrow Diagram Template for PowerPoint & Google Slides
Arrow
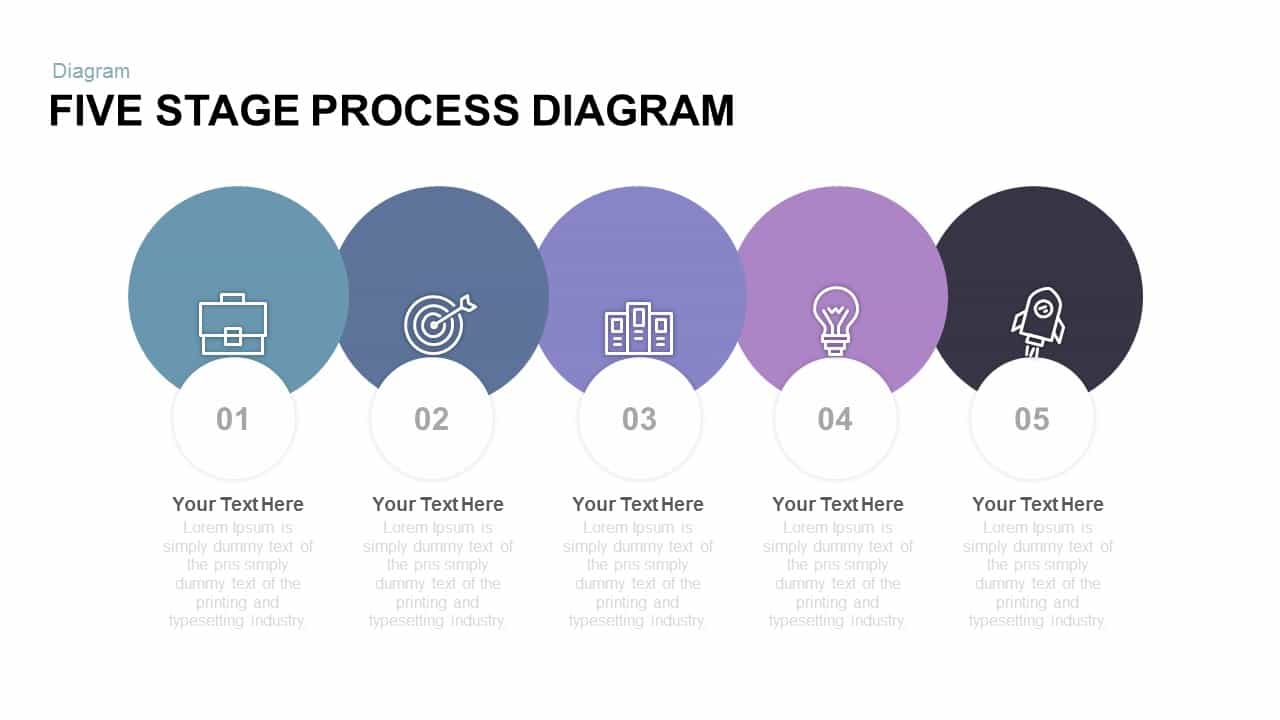
Five Stage Process Diagram Infographic Template for PowerPoint & Google Slides
Process
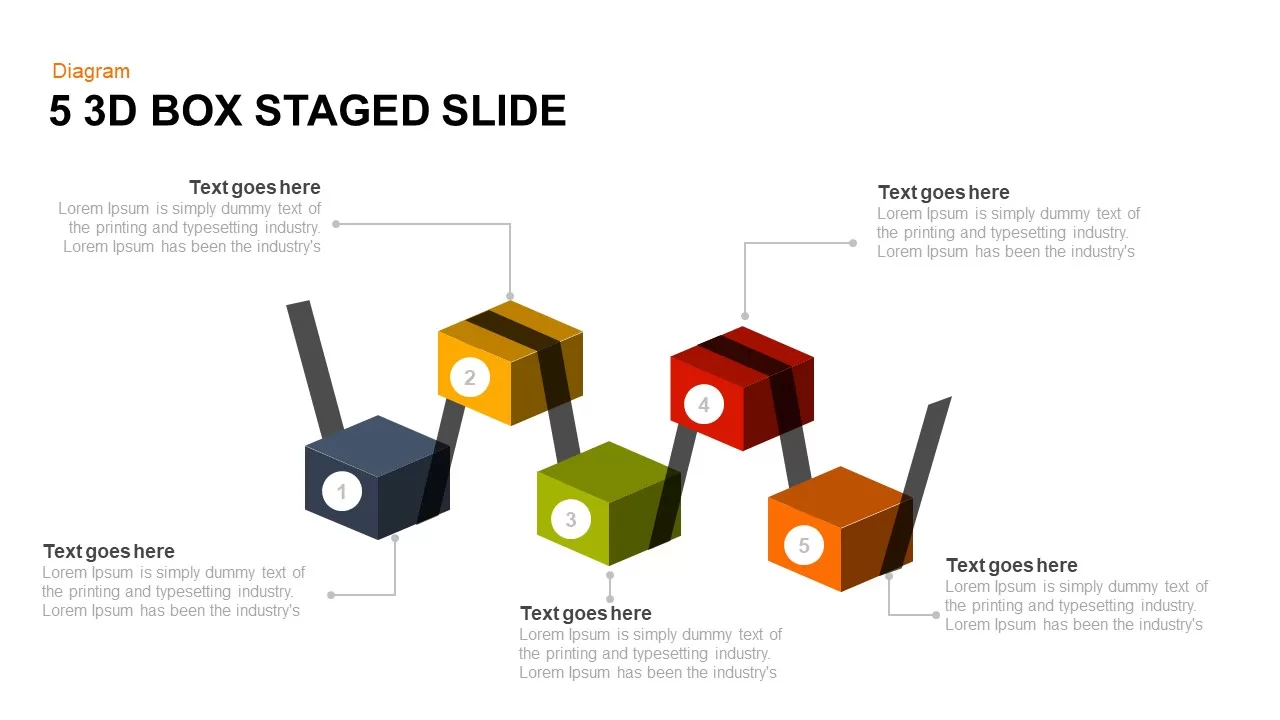
Five-Stage 3D Box Flow Diagram Template for PowerPoint & Google Slides
Process

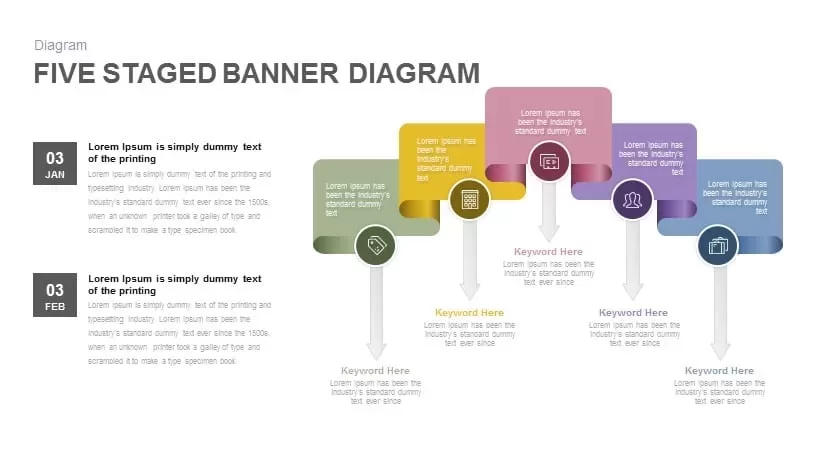
Elegant Five Staged Banner Diagram Template for PowerPoint & Google Slides
Process
Five Stage Process Diagram template for PowerPoint & Google Slides
Process
Free
Porter’s Five Forces Model Diagram Template for PowerPoint & Google Slides
Competitor Analysis

Five-Stage Cyclic Process Arrow Diagram Template for PowerPoint & Google Slides
Process
Five-Level Staged Pyramid Diagram Template for PowerPoint & Google Slides
Pyramid
Modern Five-Step Circles Process Diagram Template for PowerPoint & Google Slides
Circular
Five Stages Pyramid with Ribbons Diagram Template for PowerPoint & Google Slides
Pyramid
Five-Stage Process Diagram Template for PowerPoint & Google Slides
Process
Five-Step Diamond Process Diagram Template for PowerPoint & Google Slides
Process
Five Stage Linear Process Flow Diagram Template for PowerPoint & Google Slides
Process
Five-Stage Linear Process Flow Diagram Template for PowerPoint & Google Slides
Process
Five-Stage Eco Tree Process Diagram Template for PowerPoint & Google Slides
Process
Five-Stage Circular Infographic Diagram Template for PowerPoint & Google Slides
Process
Five-Stage Circular Process Diagram Template for PowerPoint & Google Slides
Circular
Five Layer Circular Ring Diagram Template for PowerPoint & Google Slides
Circular
Five-Stage Agenda Flow Diagram Template for PowerPoint & Google Slides
Agenda
Five Stage Circular Arrow Diagram Template for PowerPoint & Google Slides
Process
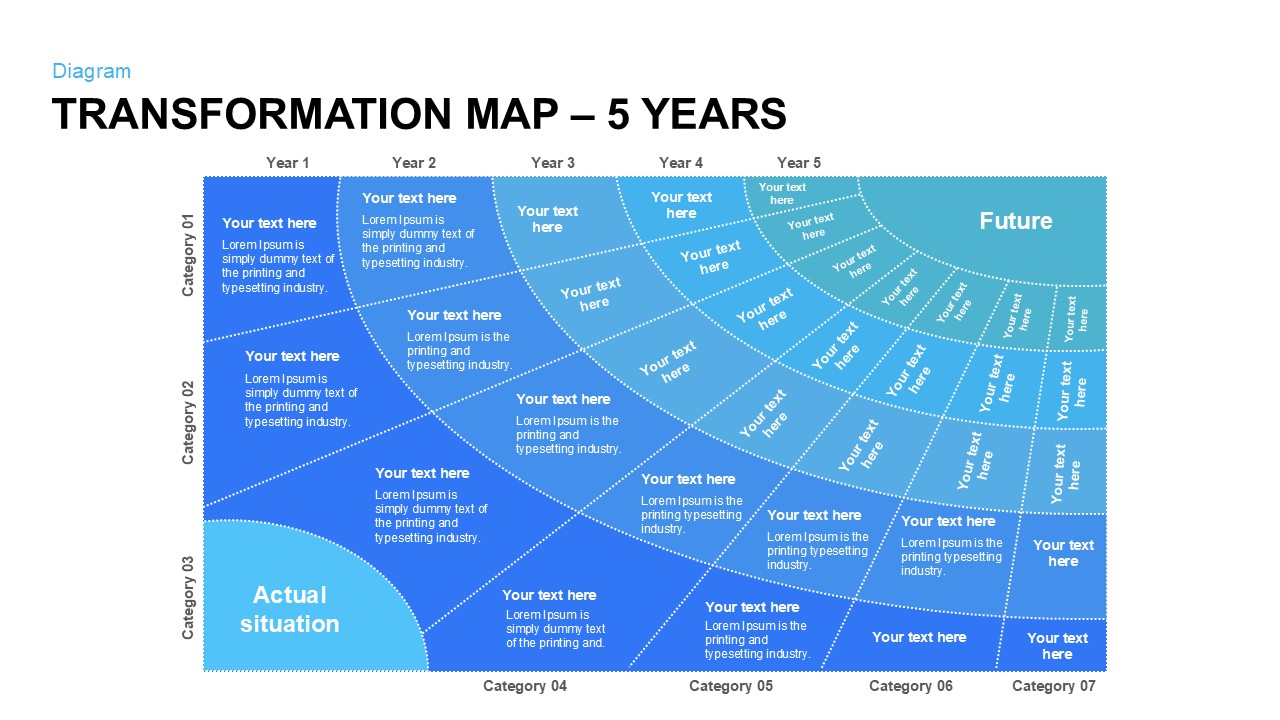
Five-Year Transformation Map Diagram Template for PowerPoint & Google Slides
Process
Five-Year Ribbon Timeline Diagram Template for PowerPoint & Google Slides
Timeline
Five-Stage Slanted Timeline Diagram Template for PowerPoint & Google Slides
Timeline
Five-Step Circular Process Diagram Template for PowerPoint & Google Slides
Circular
Five-Stage Circular Flow Diagram Template for PowerPoint & Google Slides
Circular
Five-Step Gradient Blue Funnel Diagram Template for PowerPoint & Google Slides
Funnel
Five-Stage Pipe Process Diagram Template for PowerPoint & Google Slides
Process
5 Stage Process Flow Diagram Template for PowerPoint & Google Slides
Process
Cause and Effect Template for PowerPoint & Google Slides
Arrow
Five Stage Puzzle Flow Diagram Template for PowerPoint & Google Slides
Process
Porter’s Five Forces Visual Diagram Template for PowerPoint & Google Slides
Infographics
3D Five-Step Roadmap Diagram Slide Layout Template for PowerPoint & Google Slides
Roadmap
Gradient Five-Step Roadmap Diagram Template for PowerPoint & Google Slides
Roadmap
Five-Stage Digital Maturity Model Diagram Template for PowerPoint & Google Slides
Process
Five-Node Hub and Spoke Diagram Template for PowerPoint & Google Slides
Business Strategy
Five-Node Hub & Spoke Diagram Process Template for PowerPoint & Google Slides
Business Models
Colorful Five-Stage Methodology Diagram Template for PowerPoint & Google Slides
Process
Five-Layer Onion Diagram Infographic Template for PowerPoint & Google Slides
Process
Five-Step Flywheel Infographic Diagram Template for PowerPoint & Google Slides
Process
Five-Step Interlocking Gears Diagram Template for PowerPoint & Google Slides
Process
3D Five-Stage Pyramid Diagram Slide Template for PowerPoint & Google Slides
Pyramid
Five-Step Modelling Process Diagram Template for PowerPoint & Google Slides
Process
Five-Step Cascade Diagram & Timeline Template for PowerPoint & Google Slides
Process
Five-Level Vision Pyramid Diagram Template for PowerPoint & Google Slides
Pyramid
Strategy Timeline PowerPoint Template
Timeline
Five-Year Plan Timeline Diagram Template for PowerPoint & Google Slides
Timeline
Five-Phase Project Lifecycle Diagram Template for PowerPoint & Google Slides
Infographics
Puzzle Shape Diagram with Five Elements Template for PowerPoint & Google Slides
Circular
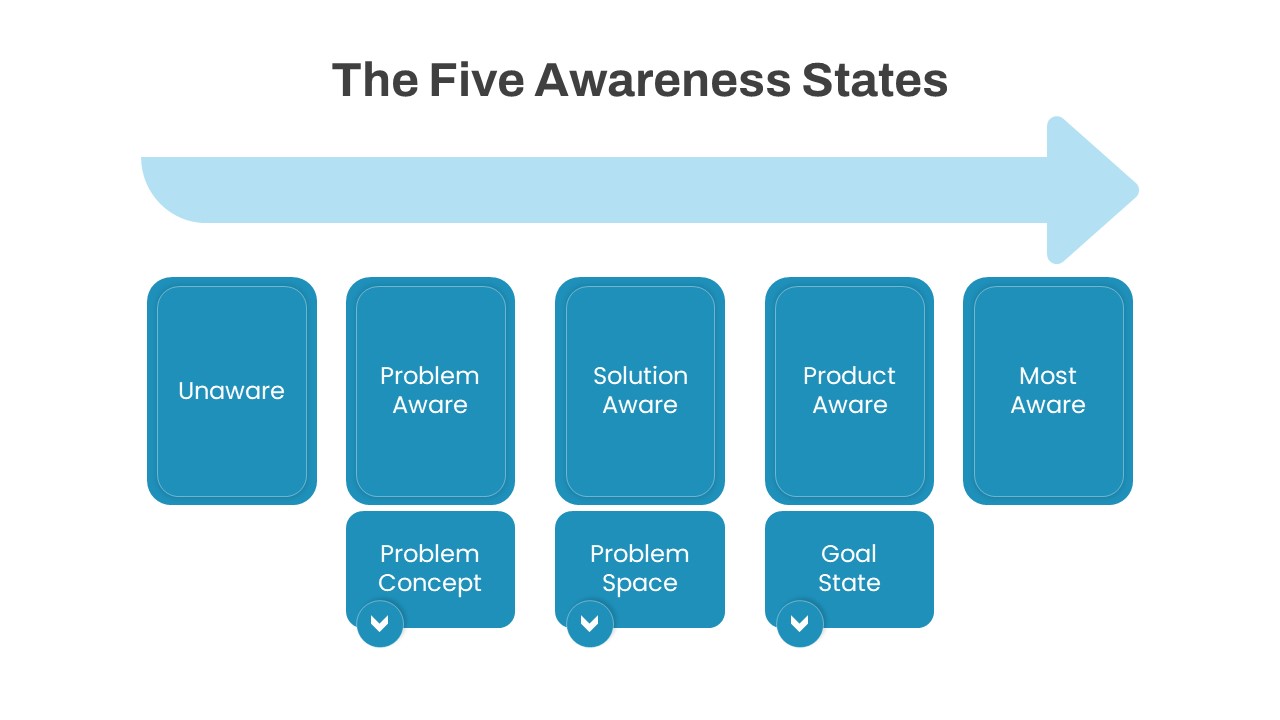
The Five Awareness States diagram template for PowerPoint & Google Slides
Infographics
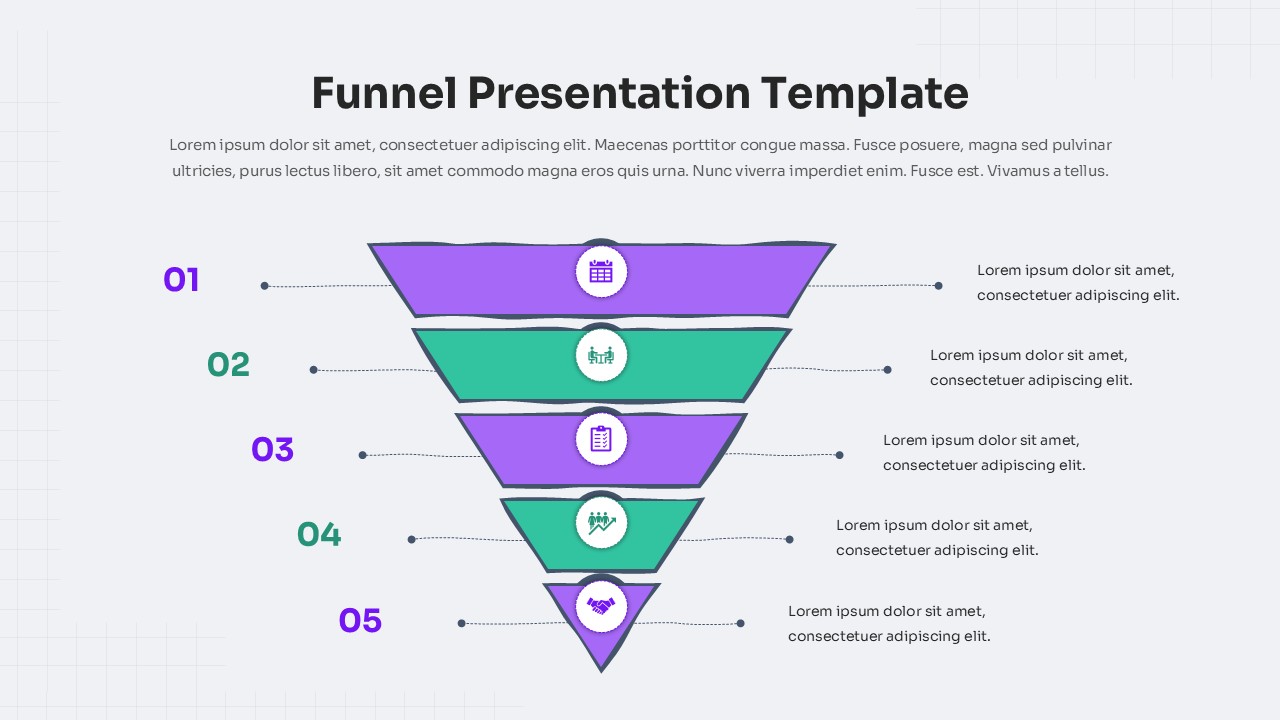
Five-Step Modern Funnel Diagram Template for PowerPoint & Google Slides
Funnel