Colorful Venn Diagram Infographics Template for PowerPoint & Google Slides


Description
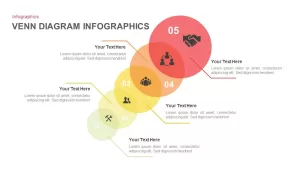
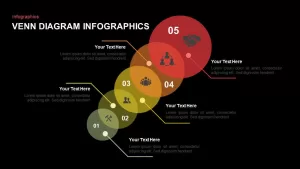
Leverage this colorful Venn diagram infographic to illustrate complex overlaps and relationships with clarity and visual appeal. The slide features five overlapping circles—each uniquely colored in a gradient from green through yellow to red—numbered 01 to 05, with minimalist icons at their centers representing stages of teamwork, strategy, collaboration, and partnership. Editable callout lines extend from each intersection area, providing space for concise headings and detailed descriptions that align neatly around the graphic. The central white circle can be used for a unifying theme or key insight.
Built on master slide layouts, every element is fully editable: swap icons from the integrated library, adjust circle colors via the theme palette, or resize shapes without disrupting the alignment. All graphics are vector-based and grouped for effortless drag-and-drop repositioning. Preconfigured fade-in animations let you reveal each segment sequentially to guide audience focus through your narrative. The clean white background and modern typography ensure readability, while the vibrant palette adds energy and engagement.
Optimized for both PowerPoint and Google Slides, this template maintains high-resolution clarity on any screen size. Theme colors and font styles are managed centrally in the slide master, so branding updates and content revisions take minutes rather than hours. Whether you’re mapping market segments, highlighting product features, or comparing service offerings, this Venn diagram infographics slide balances data richness with design elegance, making complex intersections simple to understand.
Who is it for
Marketing managers, product teams, and business strategists will leverage this slide to compare customer segments, showcase feature overlaps, or articulate cross-departmental initiatives. Educators and researchers can visualize data set intersections or conceptual frameworks in academic presentations.
Other Uses
Repurpose this layout for competitive analysis, resource allocation charts, process integration maps, or strategic planning workshops. Simply update the icons, colors, and callout text to fit any five-way relationship model.
Login to download this file

Item ID
SB01455
Related Templates

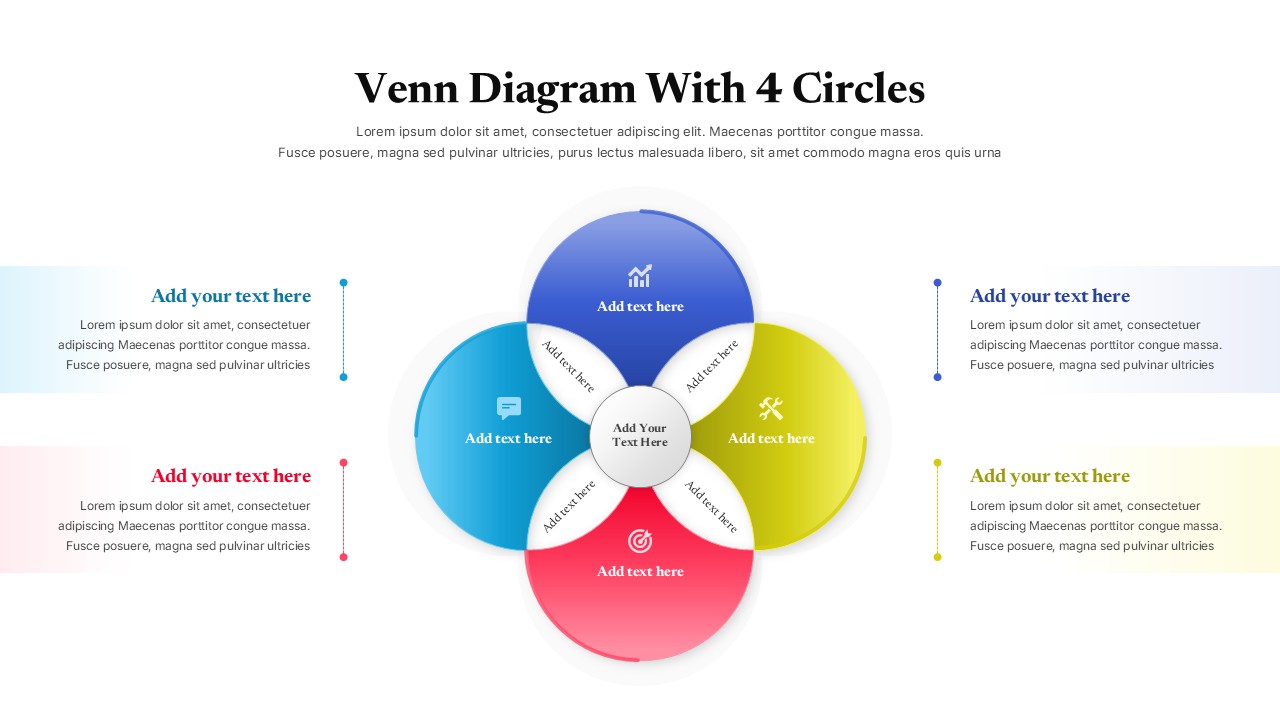
Colorful Venn Diagram with 4 Circle for PowerPoint & Google Slides
Circular
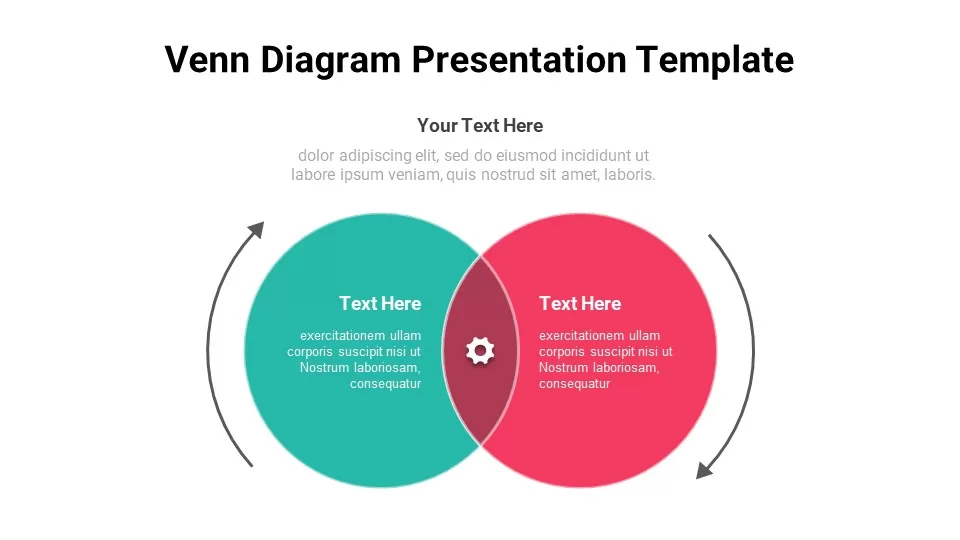
Venn Diagram PPT Template and Google Slides
Circular

Four-Circle Venn Process Diagram template for PowerPoint & Google Slides
Process
Creative Three-Circle Venn Diagram Template for PowerPoint & Google Slides
Comparison
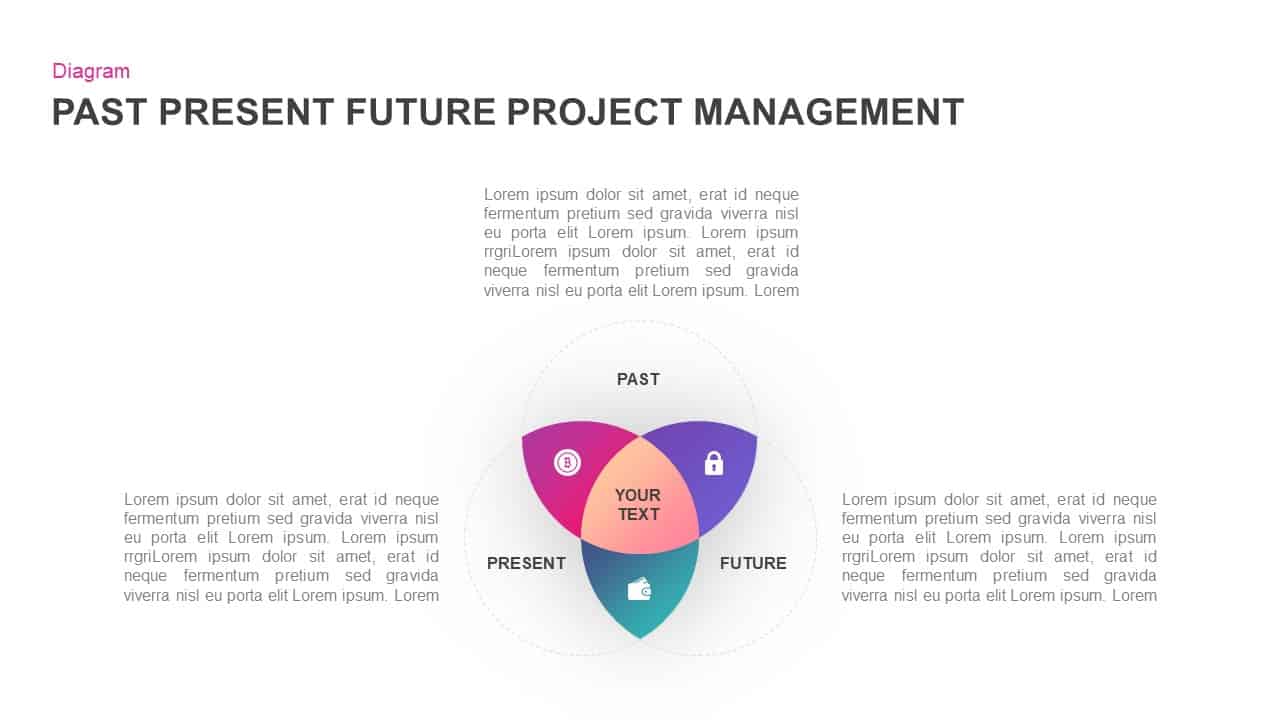
Past, Present & Future Venn Diagram Template for PowerPoint & Google Slides
Comparison
Modern Gear Venn Diagram Infographic Template for PowerPoint & Google Slides
Comparison
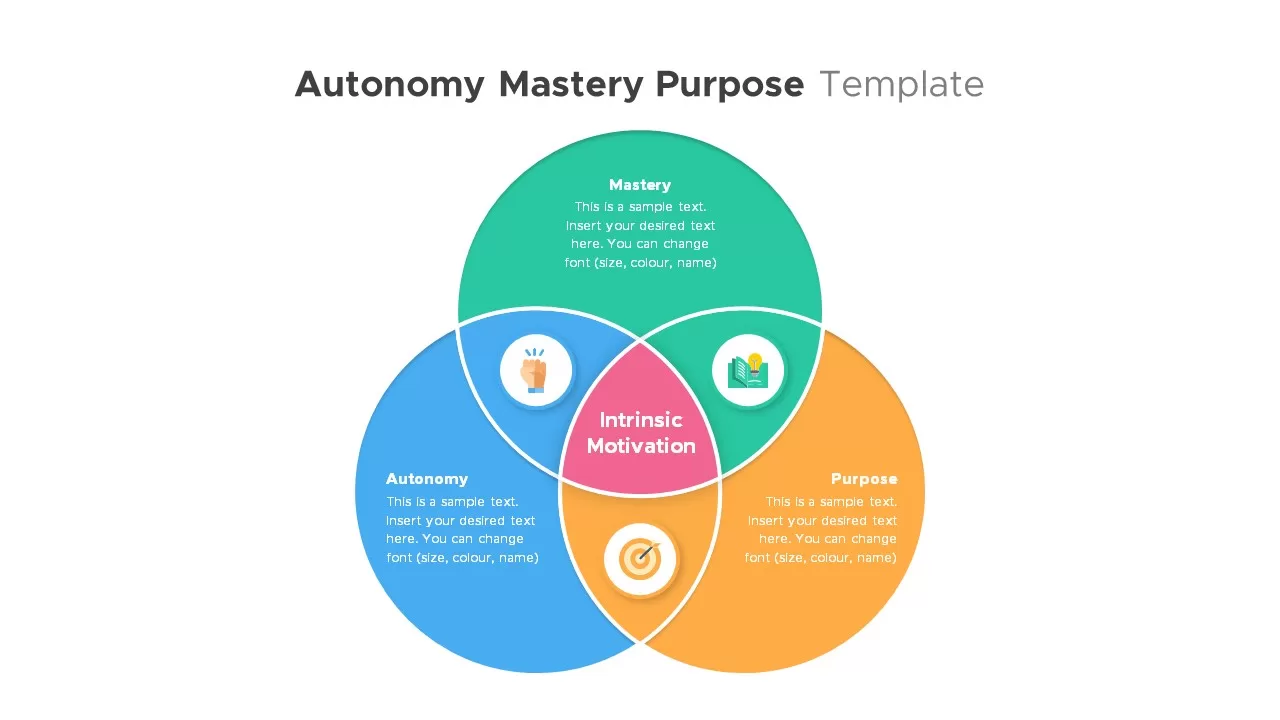
Autonomy, Mastery & Purpose Venn Diagram Template for PowerPoint & Google Slides
Circular
Free Simple Venn Diagram Overview template for PowerPoint & Google Slides
Comparison Chart
Free
Free Venn Diagram template for PowerPoint & Google Slides
Charts
Free
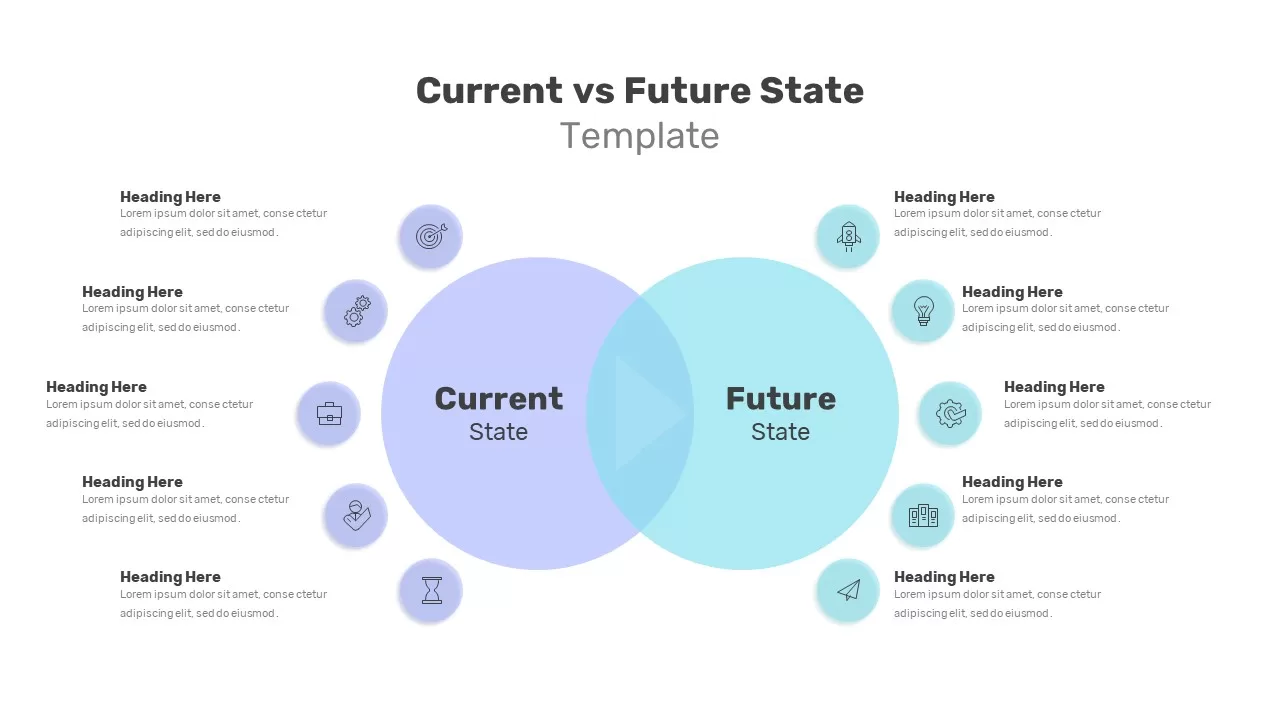
Current vs Future State PowerPoint Template
Comparison
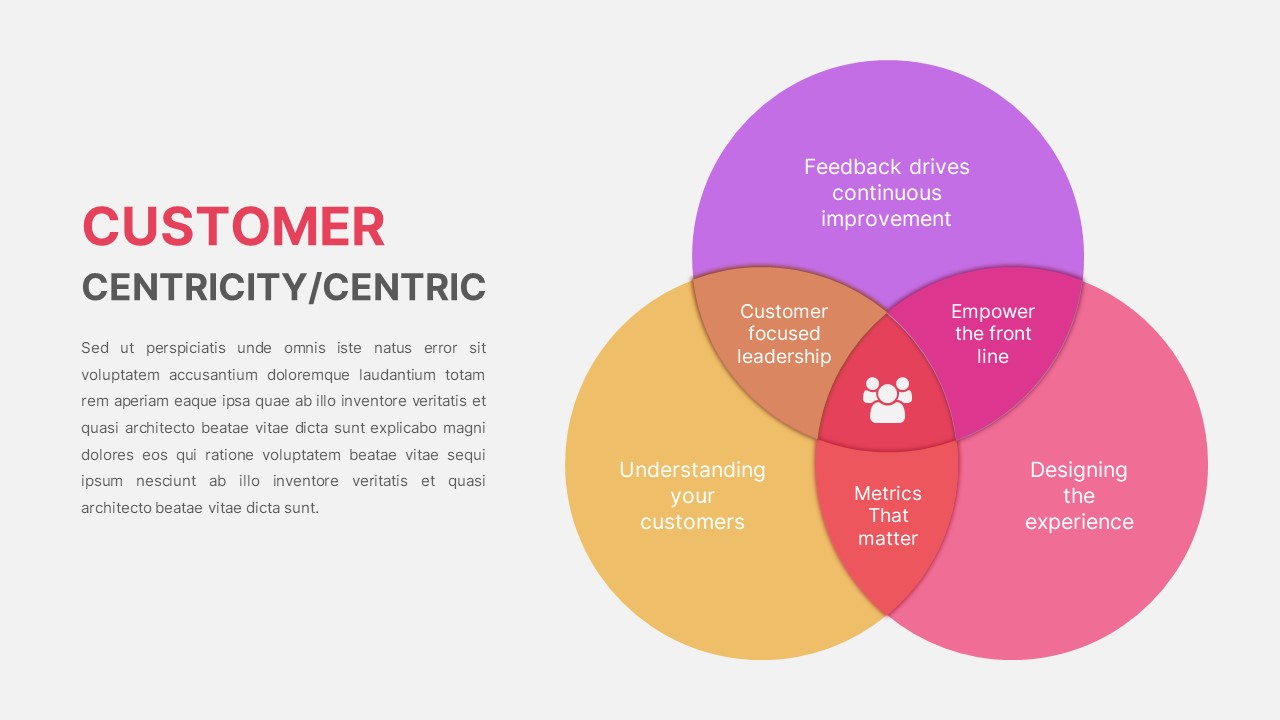
Customer Centricity Venn Diagram template for PowerPoint & Google Slides
Infographics
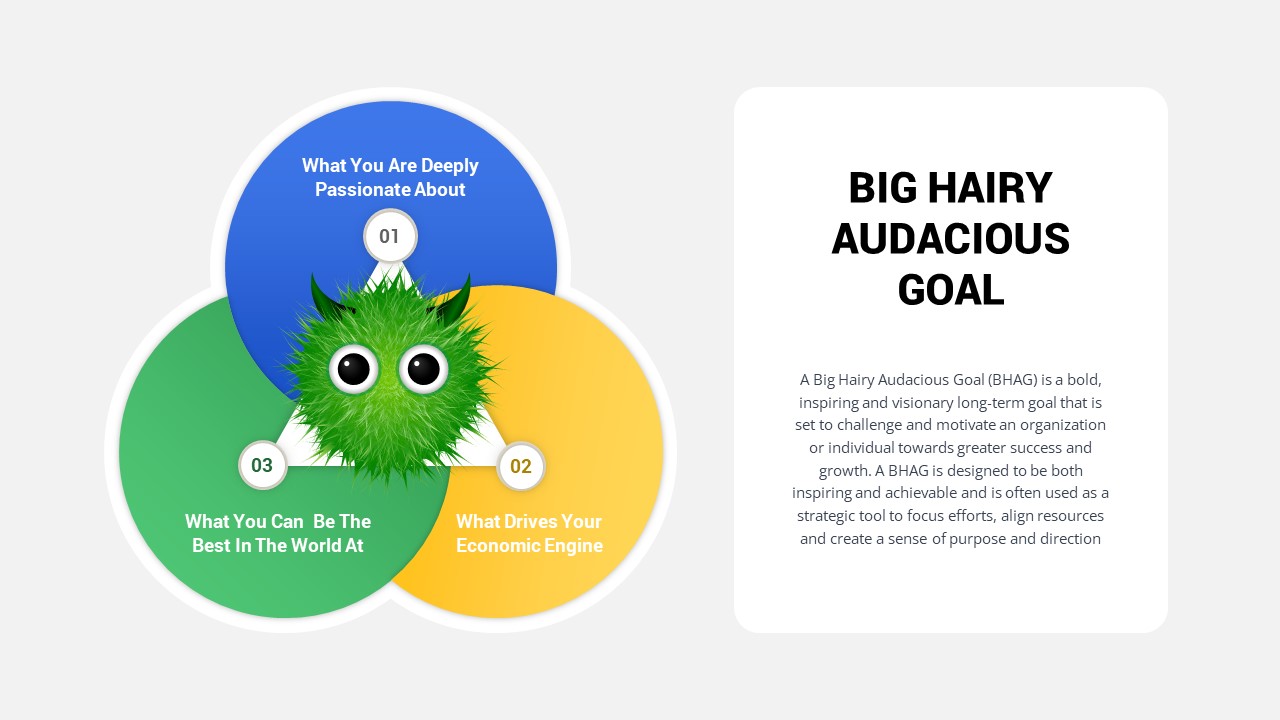
Big Hairy Audacious Goal Venn Diagram Template for PowerPoint & Google Slides
Circular
Five Circle Venn Diagram for Template for PowerPoint & Google Slides
Circular
8 Circle Venn Diagram PowerPoint Template
Circular
6 Circle Venn Diagram PowerPoint Template
Circular
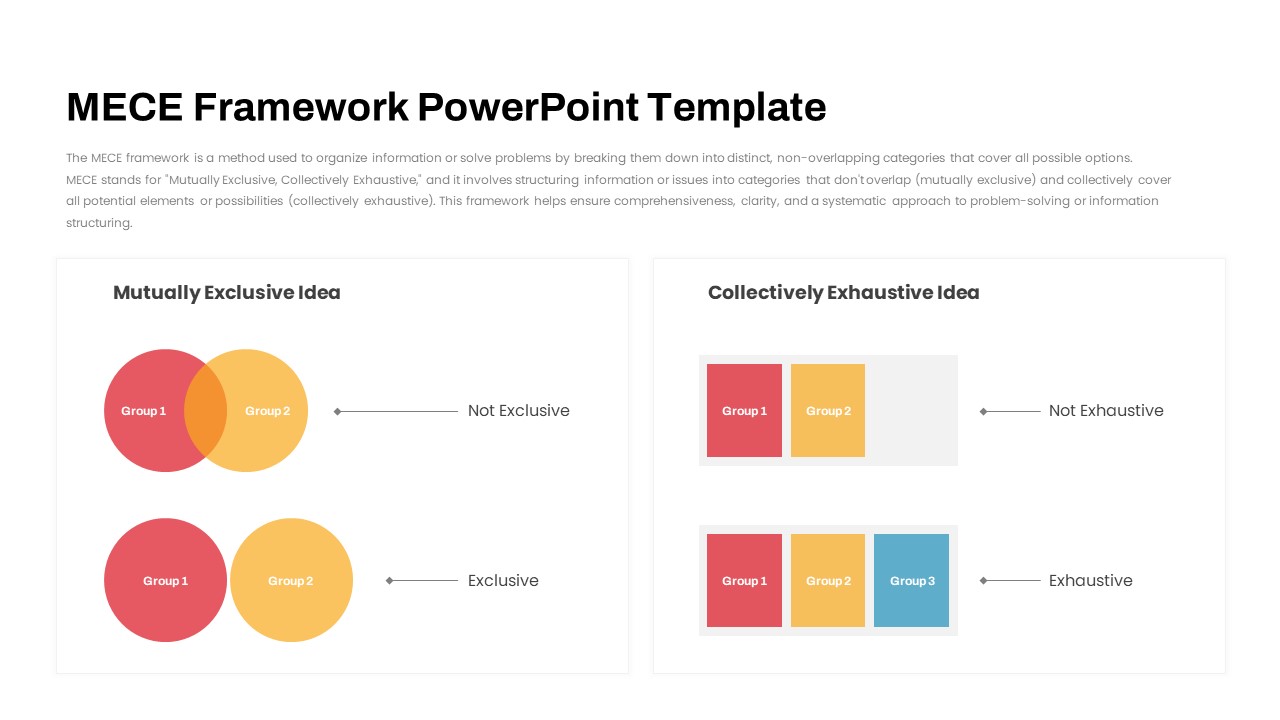
MECE Framework Venn & Block Diagram Template for PowerPoint & Google Slides
Comparison
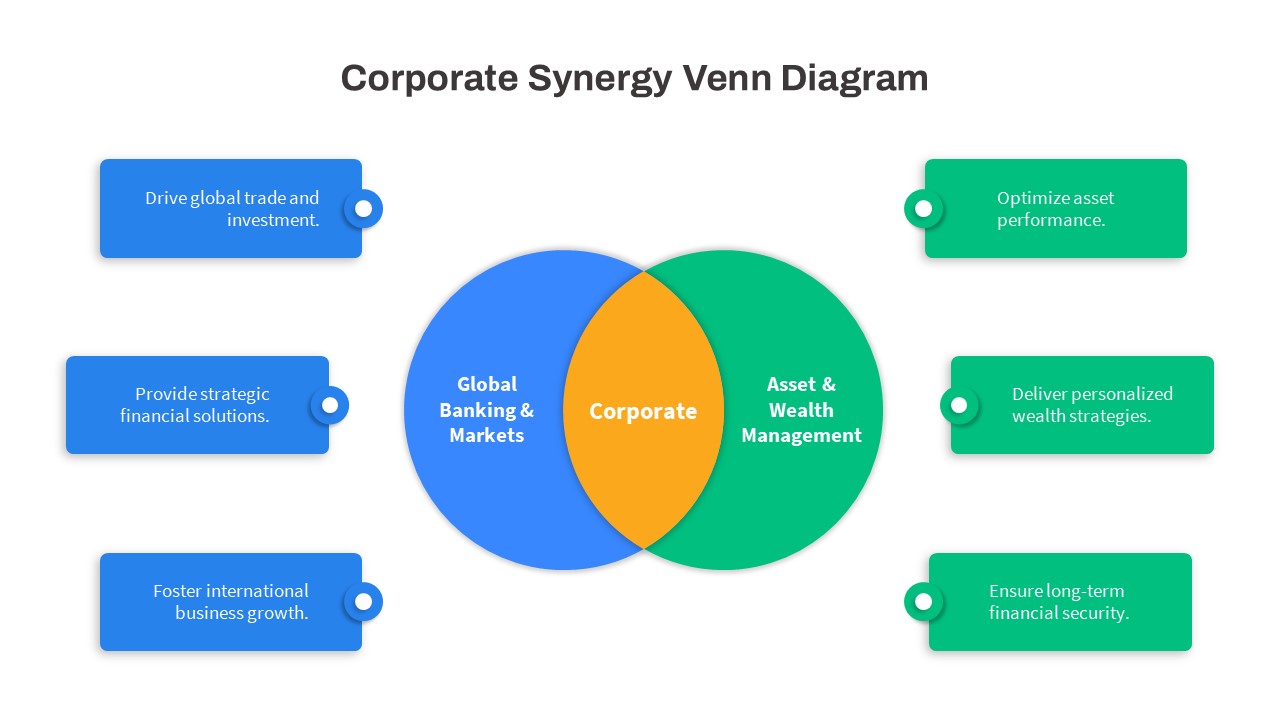
Corporate Synergy Venn Diagram Template for PowerPoint & Google Slides
Comparison
Salience Model Venn Diagram Infographic Template for PowerPoint & Google Slides
Circular
Modern Growth Hacking Venn Diagram Template for PowerPoint & Google Slides
Circular
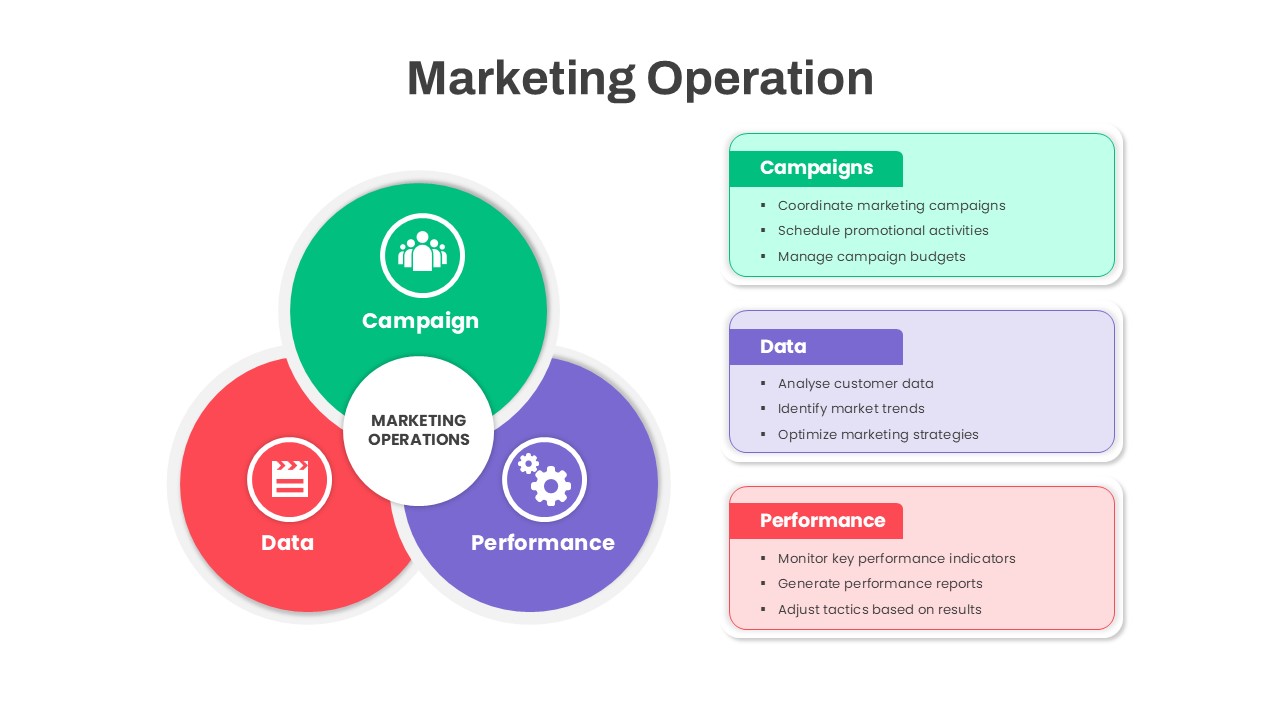
Marketing Operations Venn Diagram Template for PowerPoint & Google Slides
Circular
3Ps Triple Bottom Line Venn Diagram Template for PowerPoint & Google Slides
Circular
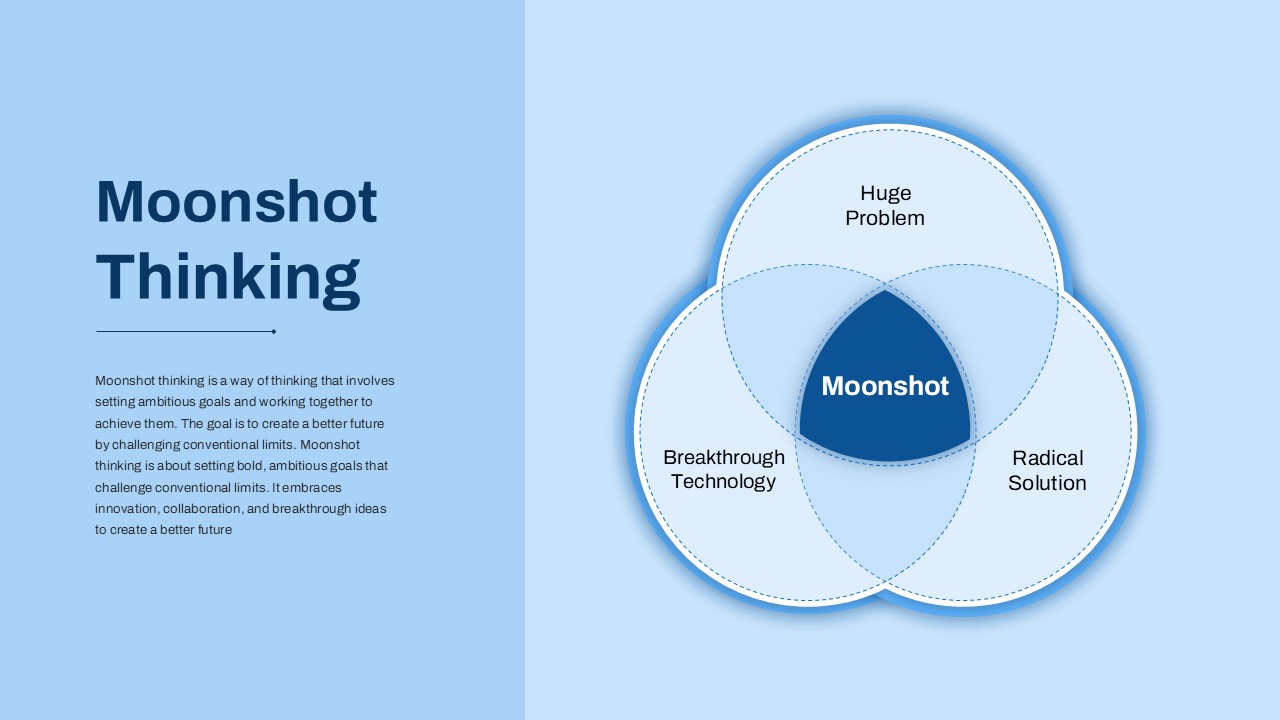
Bold Moonshot Thinking Venn Diagram Template for PowerPoint & Google Slides
Circular
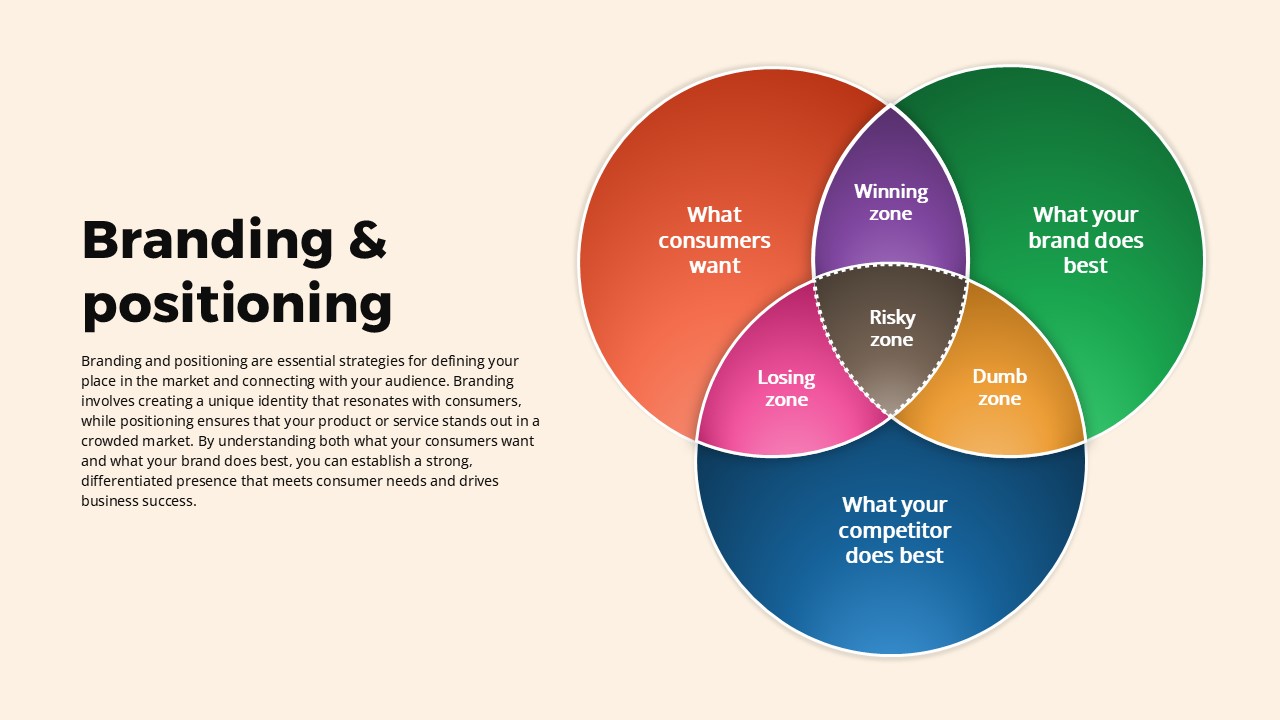
Branding and Positioning Venn Diagram Template for PowerPoint & Google Slides
Comparison
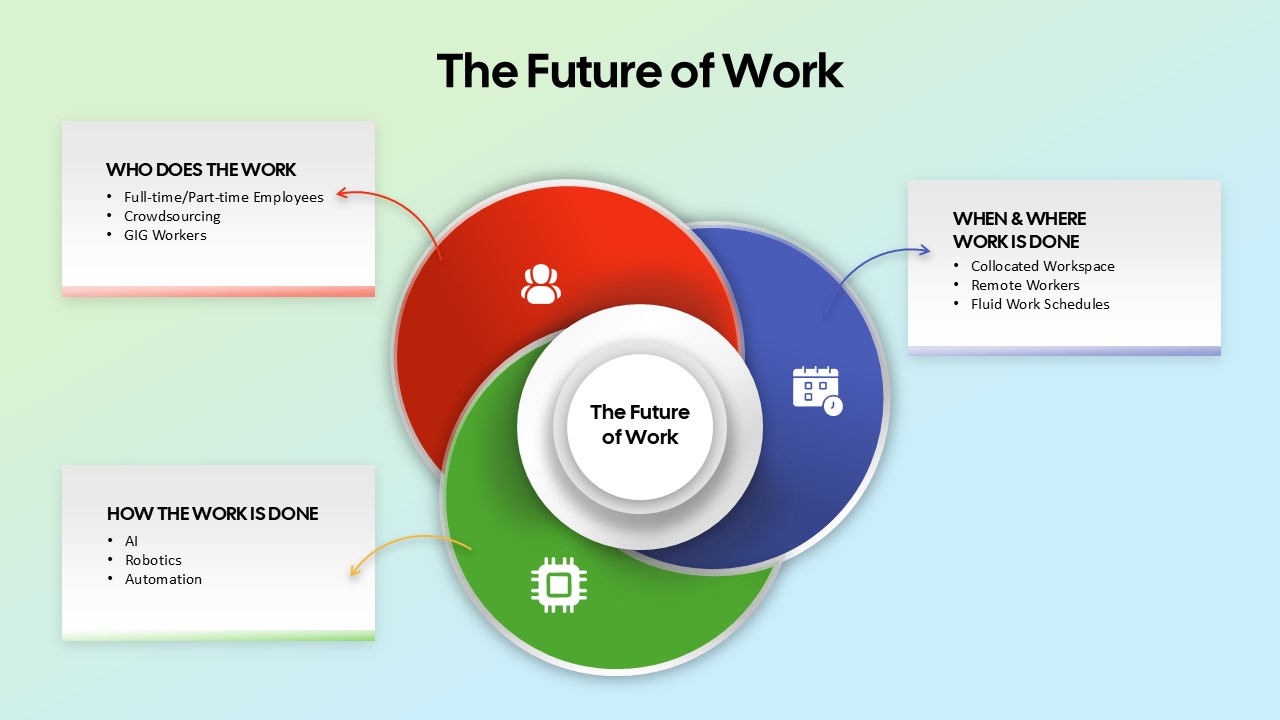
The Future of Work Venn Diagram Template for PowerPoint & Google Slides
Circular
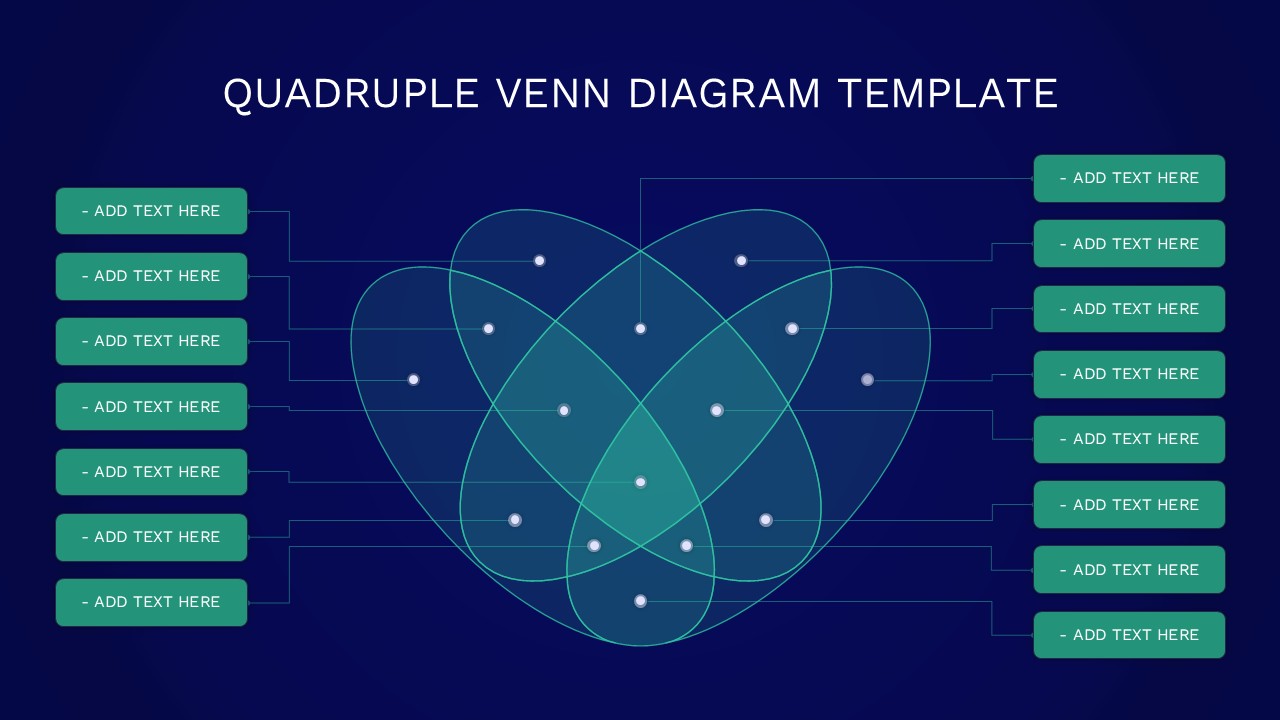
Quadruple Venn Diagram Template for PowerPoint & Google Slides
Circular
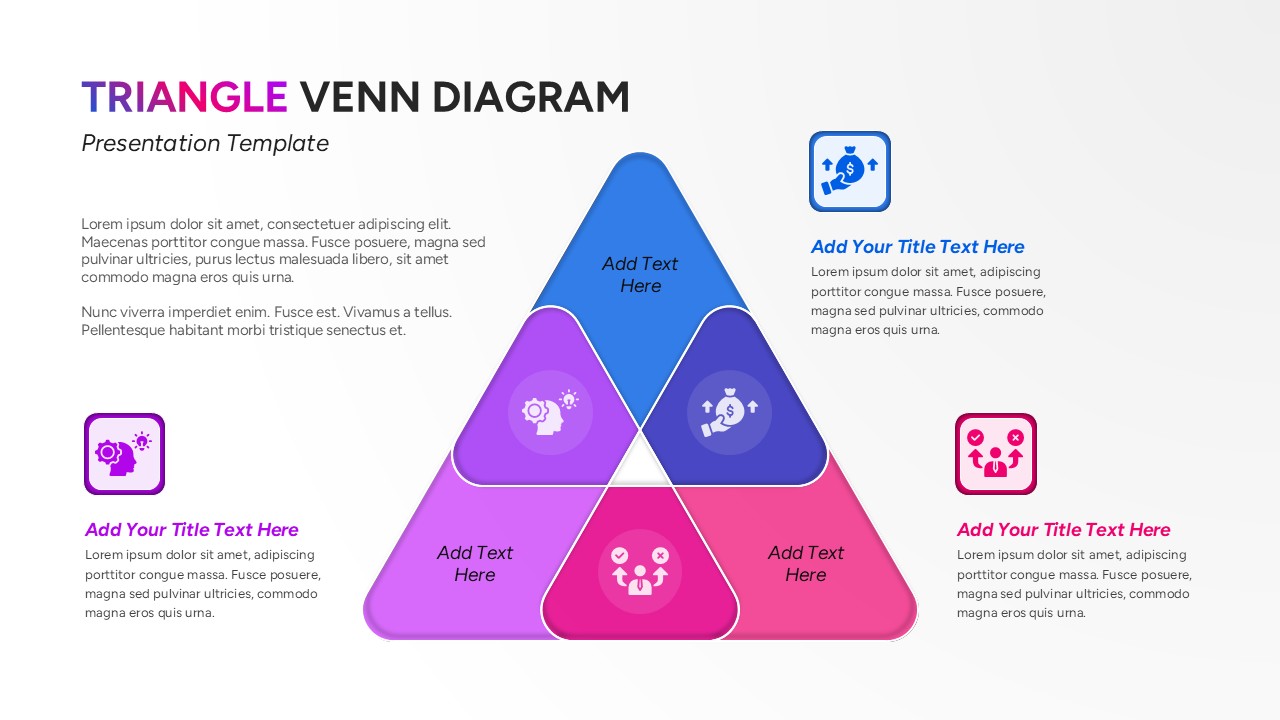
Triangle Venn Diagram Infographic Template for PowerPoint & Google Slides
Comparison
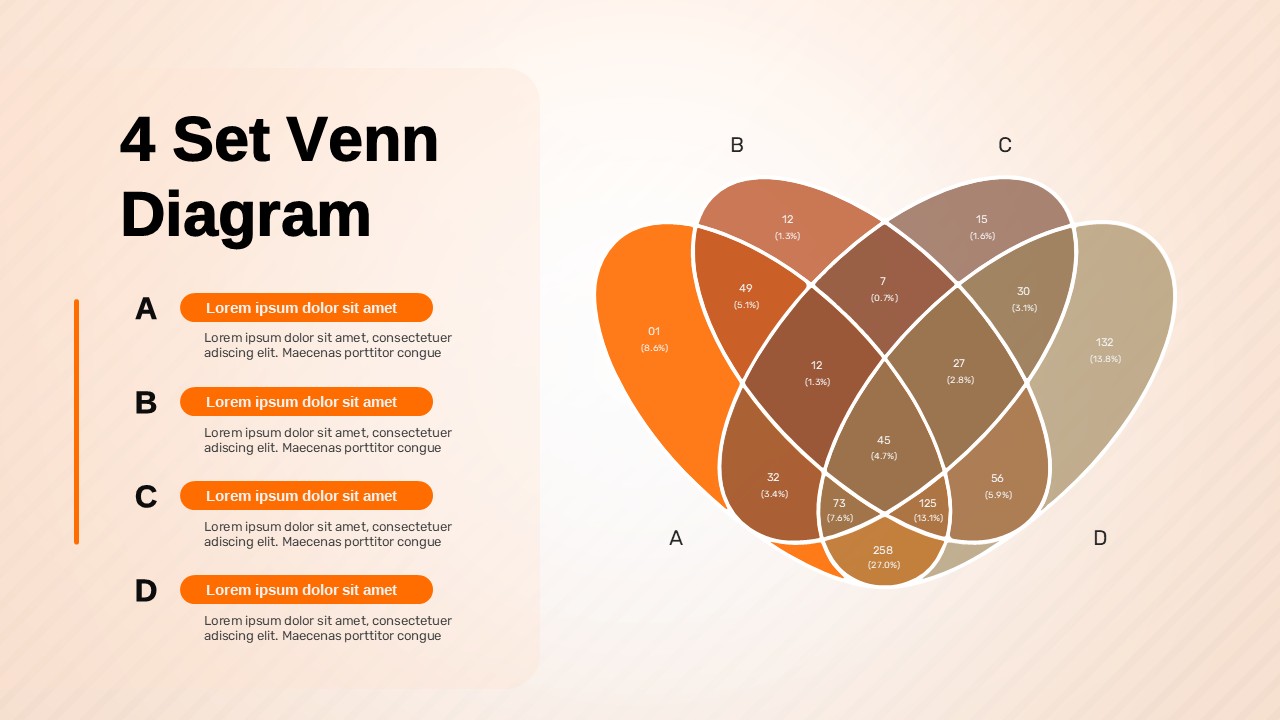
4 Set Venn Diagram Comparison Template for PowerPoint & Google Slides
Comparison
Free Colorful Process Flow Infographics Template for PowerPoint & Google Slides
Process
Free
Colorful Process Flow Infographics Template for PowerPoint & Google Slides
Process

Free Colorful Timeline Infographics Template for PowerPoint & Google Slides
Timeline
Free
Colorful Arrow Process Diagram Template for PowerPoint & Google Slides
Arrow
Colorful Decision Tree Diagram template for PowerPoint & Google Slides
Decision Tree
Creative Mind Map PowerPoint Template
Mind Maps

Colorful Five-Stage Relationship Diagram Template for PowerPoint & Google Slides
Process
Colorful Modern CRM Gear Diagram Template for PowerPoint & Google Slides
Customer Experience
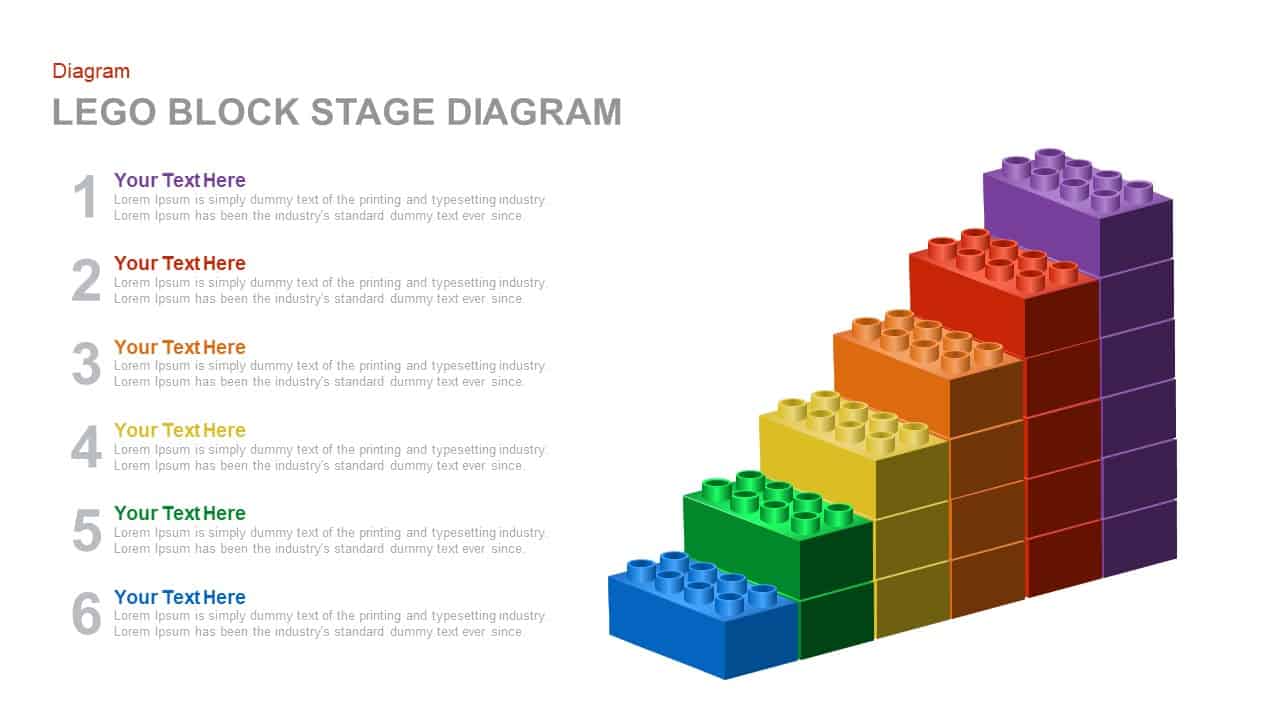
Colorful LEGO Block Stage Diagram Template for PowerPoint & Google Slides
Process
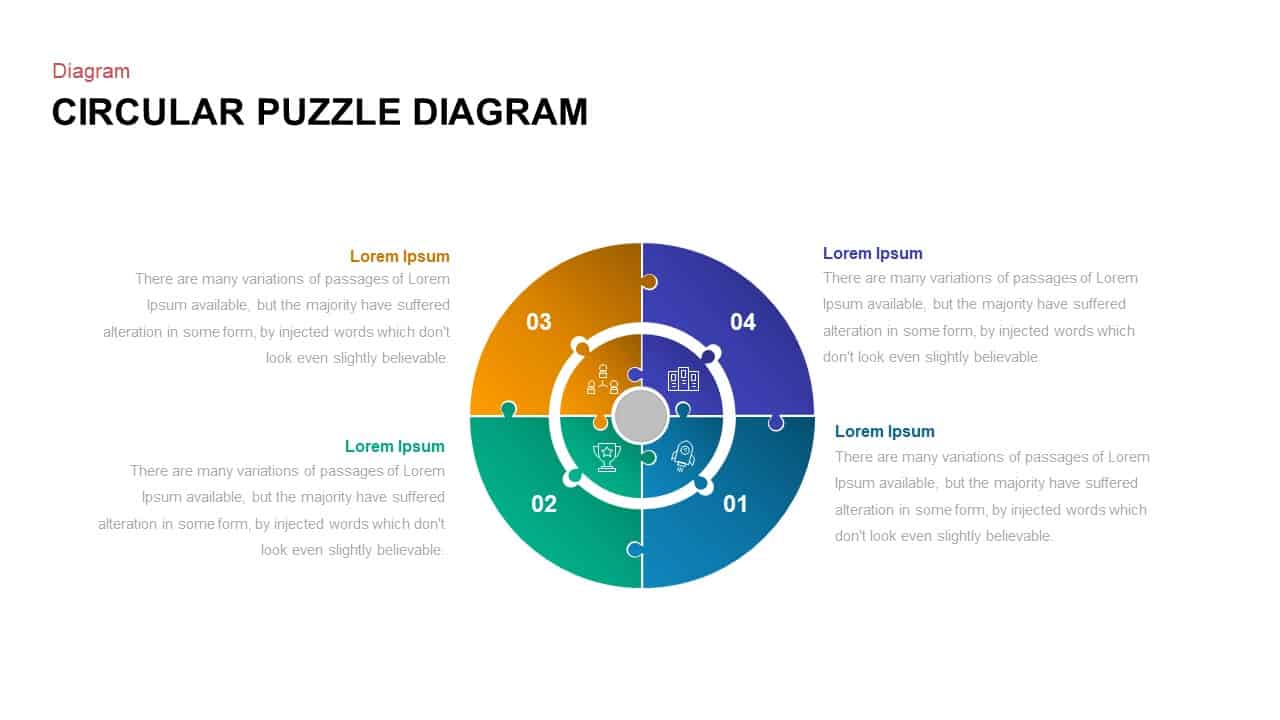
Colorful Circular Puzzle Diagram Template for PowerPoint & Google Slides
Circular
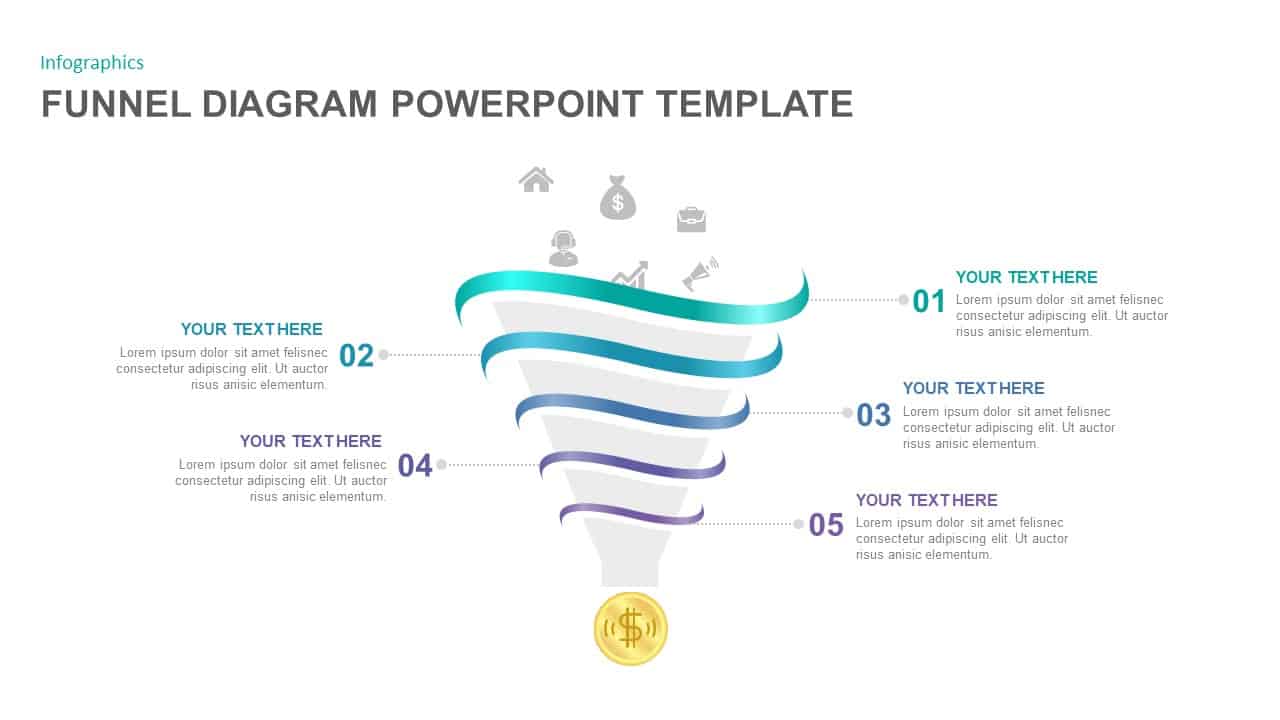
5-Step Colorful Funnel Diagram Template for PowerPoint & Google Slides
Funnel
Colorful 8-Stage Droplet Process Flow Diagram Template for PowerPoint & Google Slides
Process
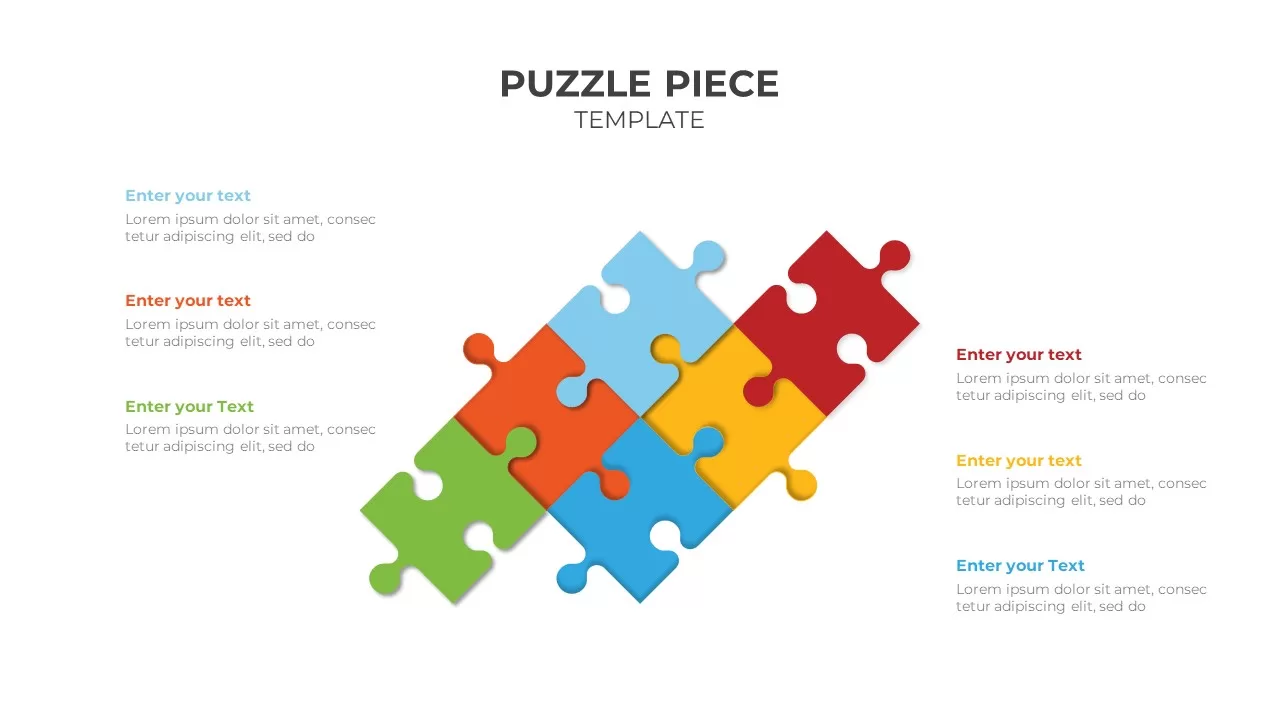
Colorful Six-Piece Puzzle Diagram Template for PowerPoint & Google Slides
Infographics
Colorful Eight-Piece Puzzle Diagram Template for PowerPoint & Google Slides
Process
Colorful Five-Step Roadmap Diagram Template for PowerPoint & Google Slides
Roadmap
Colorful Seven-Piece Puzzle Diagram Template for PowerPoint & Google Slides
Process
Colorful Nine-Piece Puzzle Diagram Template for PowerPoint & Google Slides
Process
10-Step Colorful Circular Diagram Template for PowerPoint & Google Slides
Circular
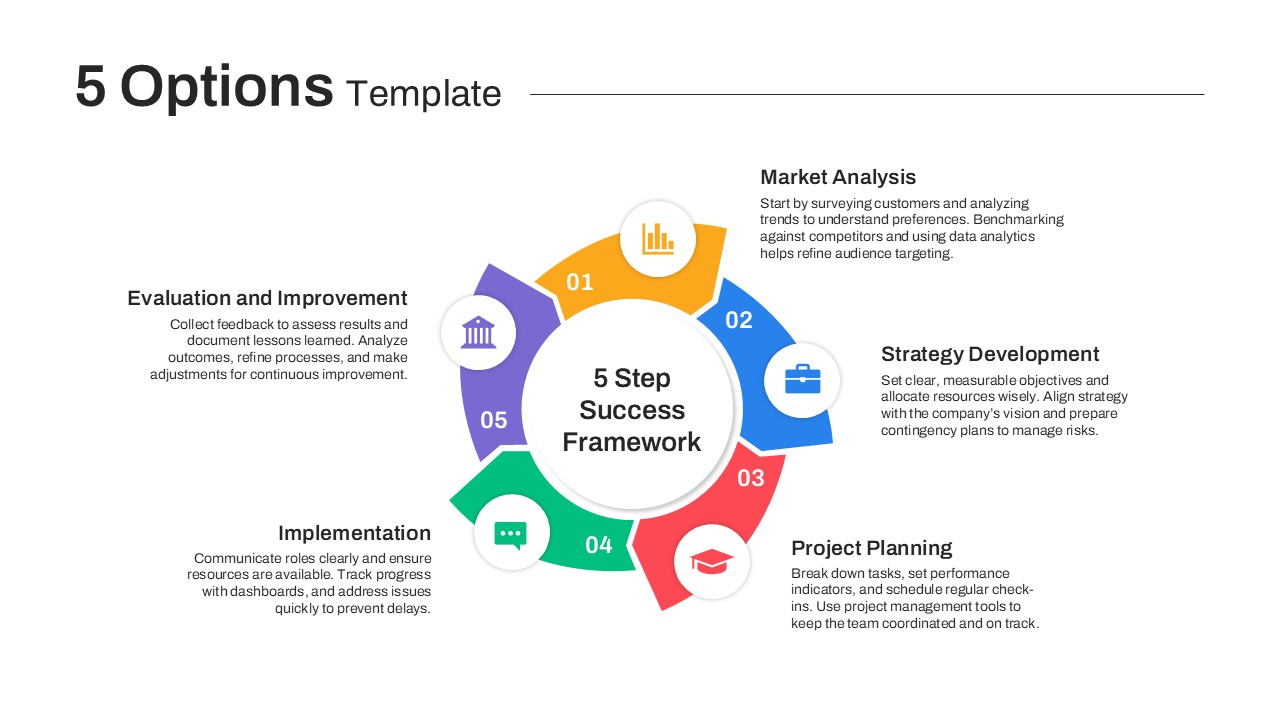
Colorful Five-Stage Methodology Diagram Template for PowerPoint & Google Slides
Process
Six-Step Colorful Flywheel Diagram Template for PowerPoint & Google Slides
Circular
Four-Level Colorful Pyramid Diagram Template for PowerPoint & Google Slides
Pyramid
Colorful Snake Process Diagram Template for PowerPoint & Google Slides
Process
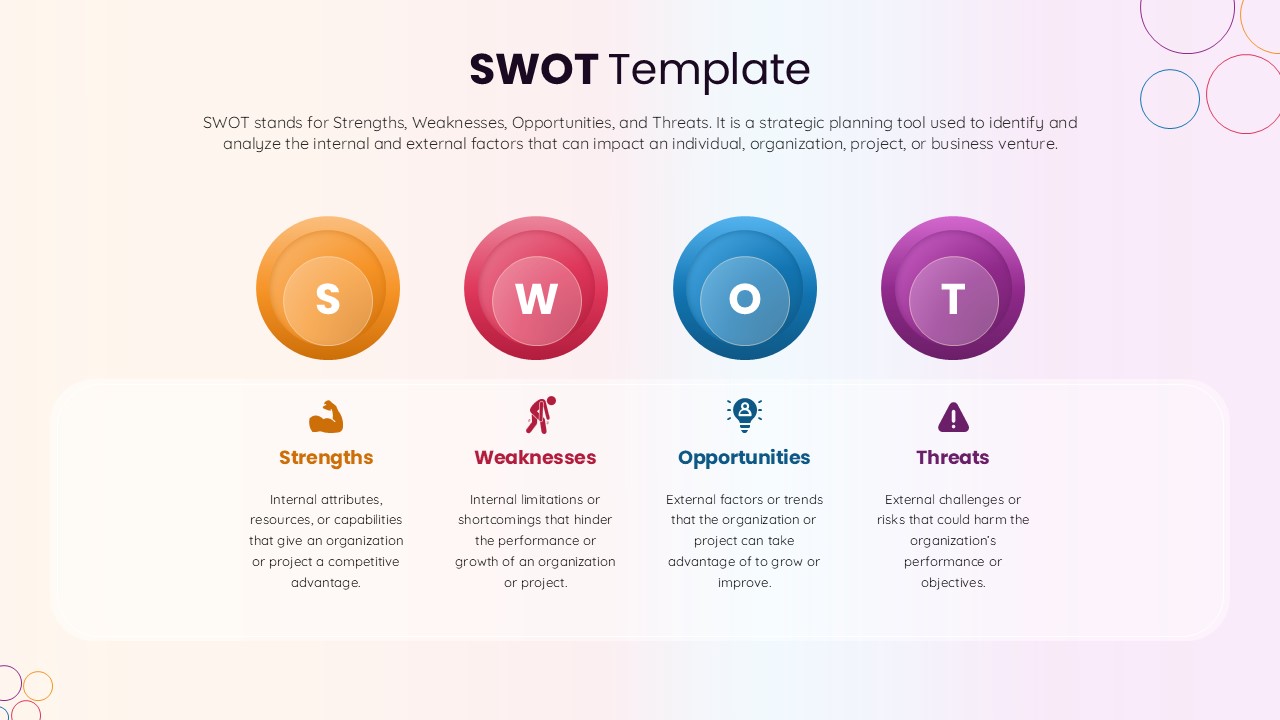
Colorful SWOT Analysis Diagram Template for PowerPoint & Google Slides
SWOT
Colorful Startup Financing Cycle Diagram Template for PowerPoint & Google Slides
Finance
Four-Level Colorful Pyramid Diagram Template for PowerPoint & Google Slides
Pyramid
Colorful Layered Onion Diagram Slide for PowerPoint & Google Slides
Process
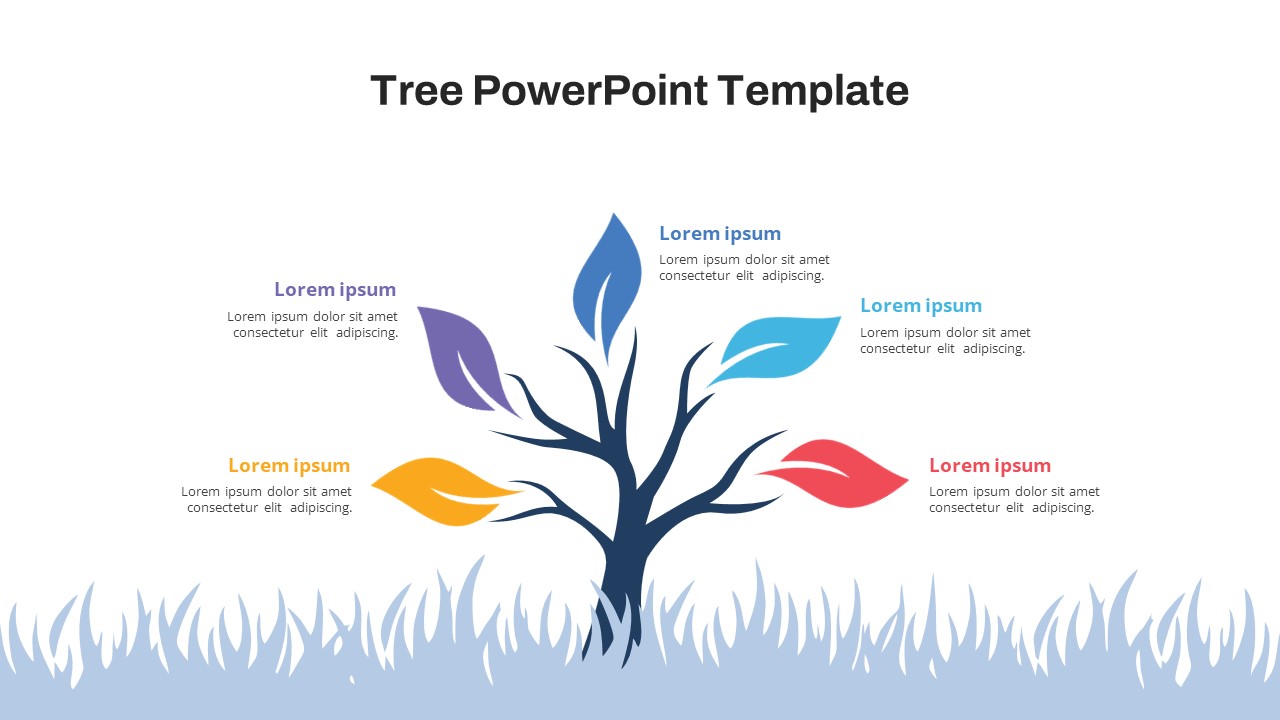
Free Colorful Tree Diagram for Growth & Strategy in PowerPoint & Google Slides
Infographics
Free
Colorful Rainbow Slides Template for PowerPoint & Google Slides
Graphics
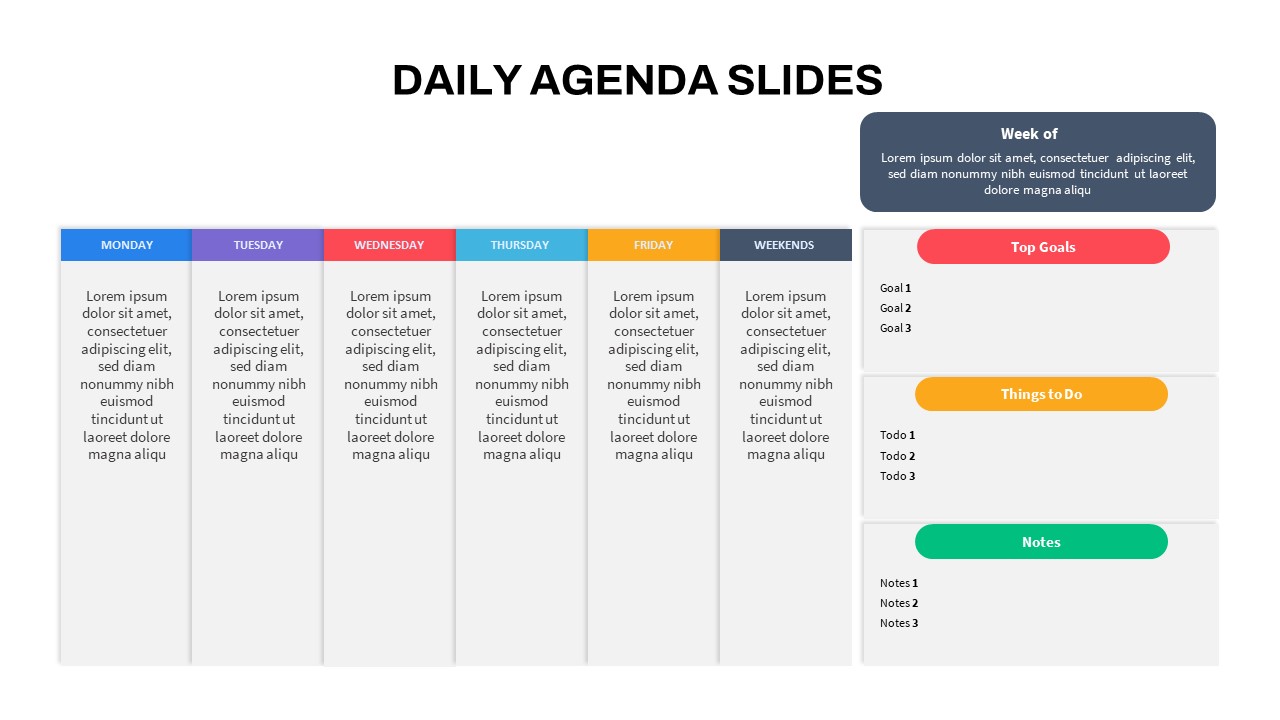
Editable Colorful Daily Agenda Slides Template for PowerPoint & Google Slides
Agenda
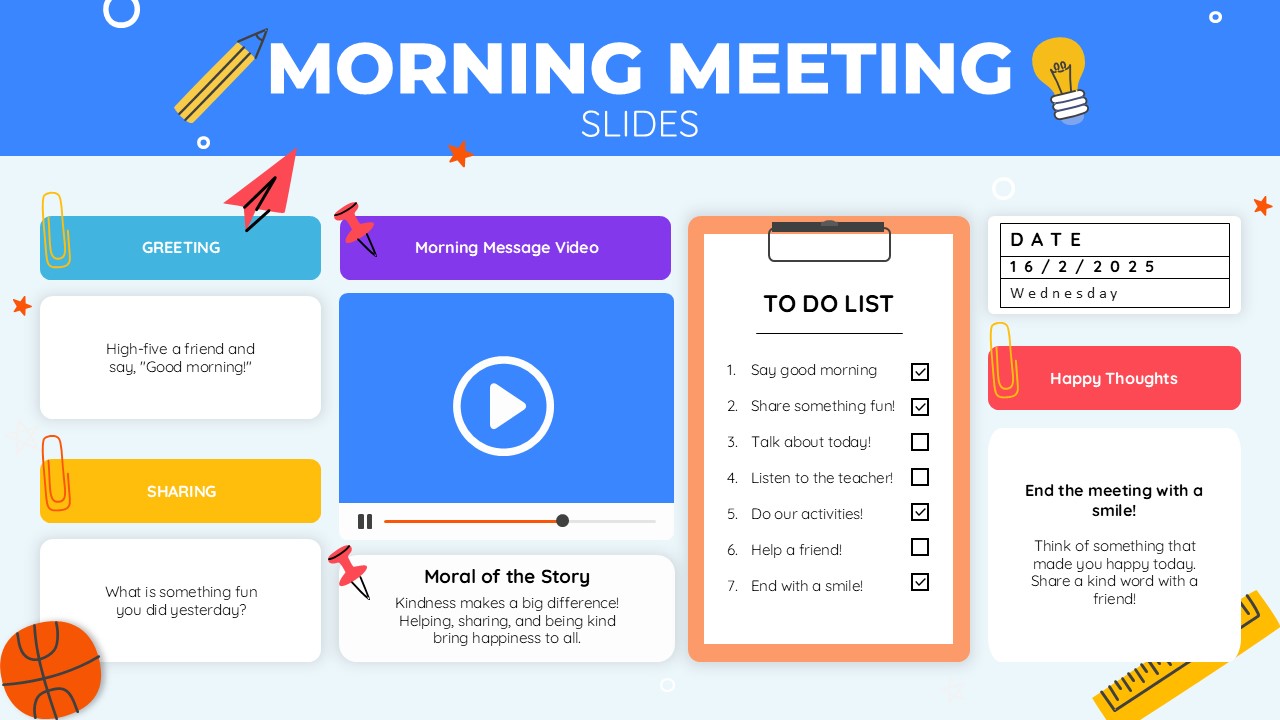
Free Colorful Morning Meeting Agenda Slides Template for PowerPoint & Google Slides
Agenda
Free
Colorful Birthday Celebration Slides for PowerPoint & Google Slides
Graphics
7-Stage Colorful Timeline Infographic Template for PowerPoint & Google Slides
Timeline
Colorful Radial Bar Chart Template for PowerPoint & Google Slides
Bar/Column
Six-Stage Colorful Spiral Timeline Template for PowerPoint & Google Slides
Timeline
Circular Org Chart in PowerPoint & Google Slides
Org Chart
Mind Map PowerPoint Template and Google Slides
Mind Maps
Colorful Mind Map Infographic Template for PowerPoint & Google Slides
Mind Maps
Colorful Nine-Stage Agenda Slide Template for PowerPoint & Google Slides
Agenda
Content Marketing Matrix Template for PowerPoint & Google Slides
Comparison
Modern Colorful SWOT Quadrant Analysis Template for PowerPoint & Google Slides
SWOT
Colorful Callout Calendar Infographic Template for PowerPoint & Google Slides
Infographics
Colorful SWOT Analysis Quadrant Template for PowerPoint & Google Slides
SWOT
Free Roadmap Infographics Template
Roadmap
Free
Colorful Mind Map Template for PowerPoint & Google Slides
Mind Maps
Colorful Mind Map with Icons Template for PowerPoint & Google Slides
Mind Maps
Colorful Process Flow Template for PowerPoint & Google Slides
Process
Table Of Contents Presentation Template
Infographics
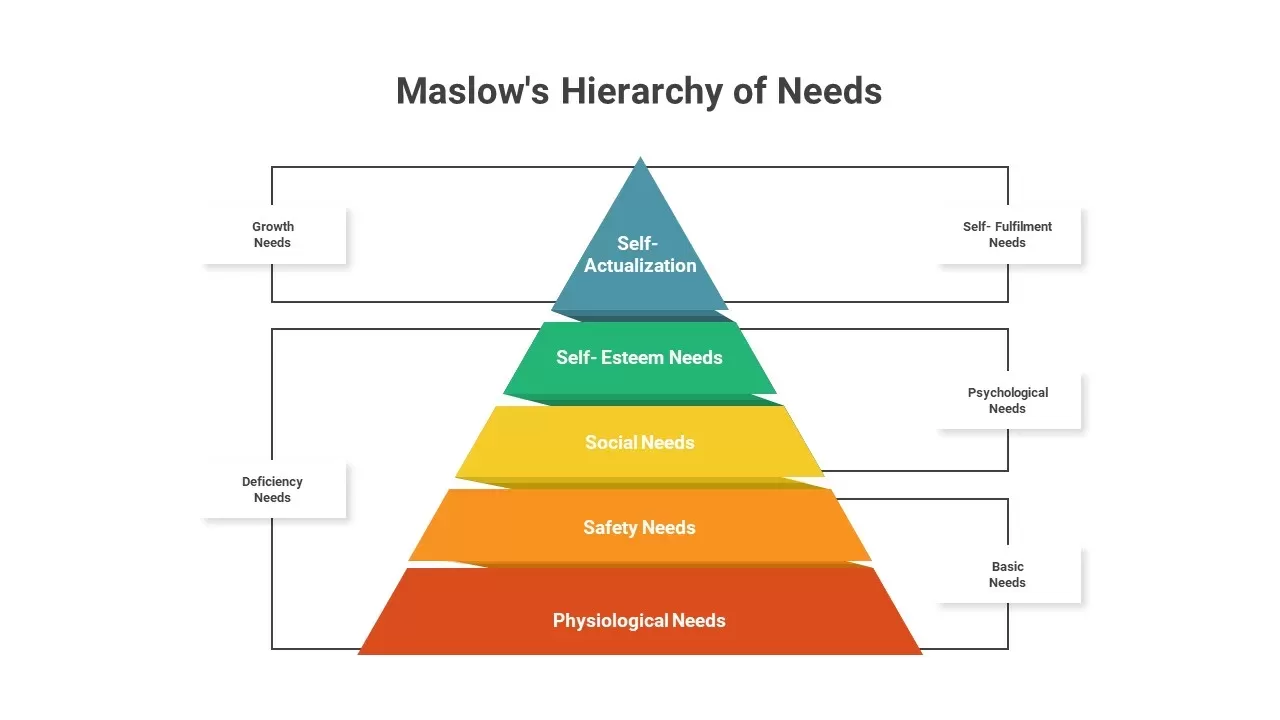
Maslow’s Colorful Pyramid of Needs Template for PowerPoint & Google Slides
Pyramid
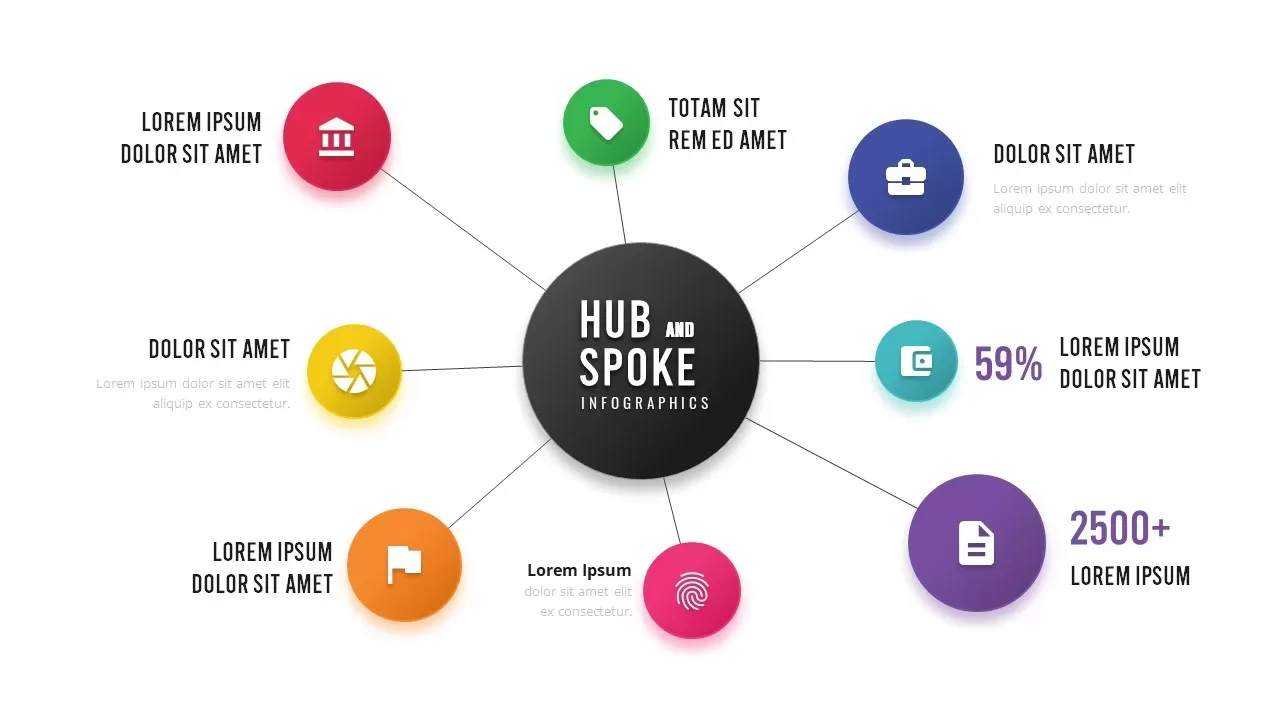
Colorful Hub-and-Spoke Infographic Template for PowerPoint & Google Slides
Circular
Methodology PowerPoint Template
Process
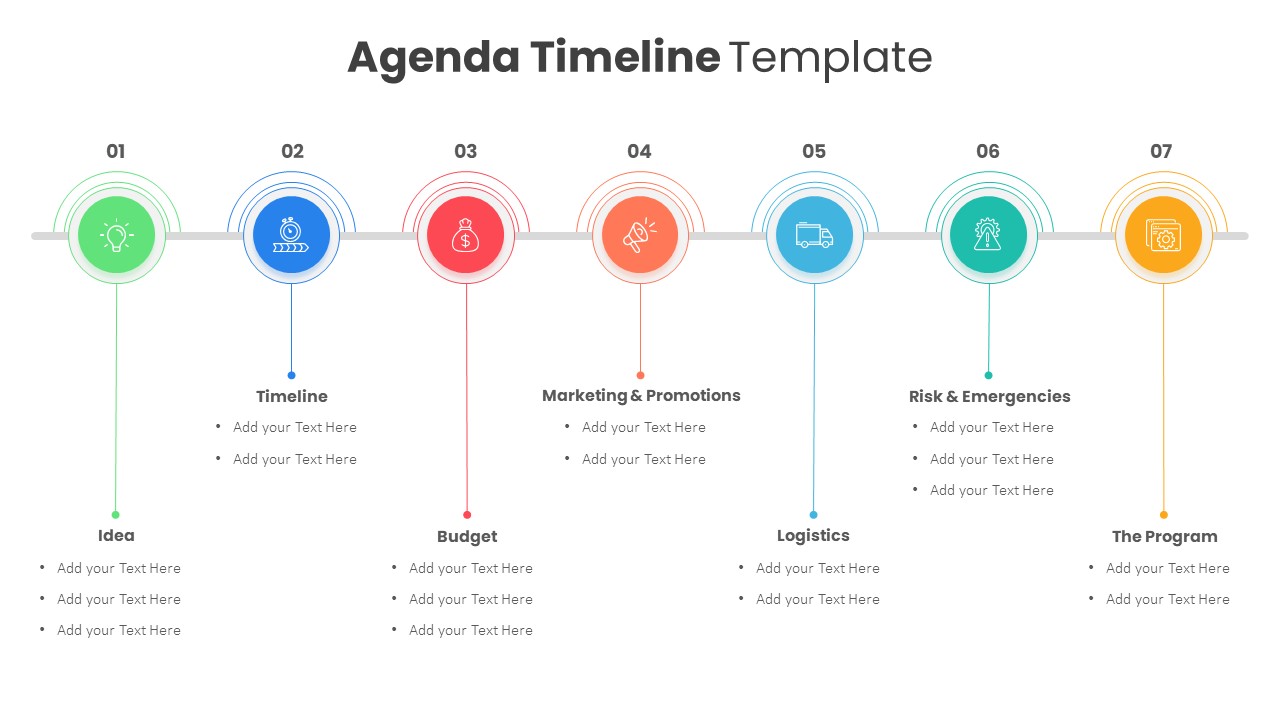
Colorful Agenda Timeline Infographic Template for PowerPoint & Google Slides
Agenda
Colorful Polka Dot Background Theme Template for PowerPoint & Google Slides
Decks
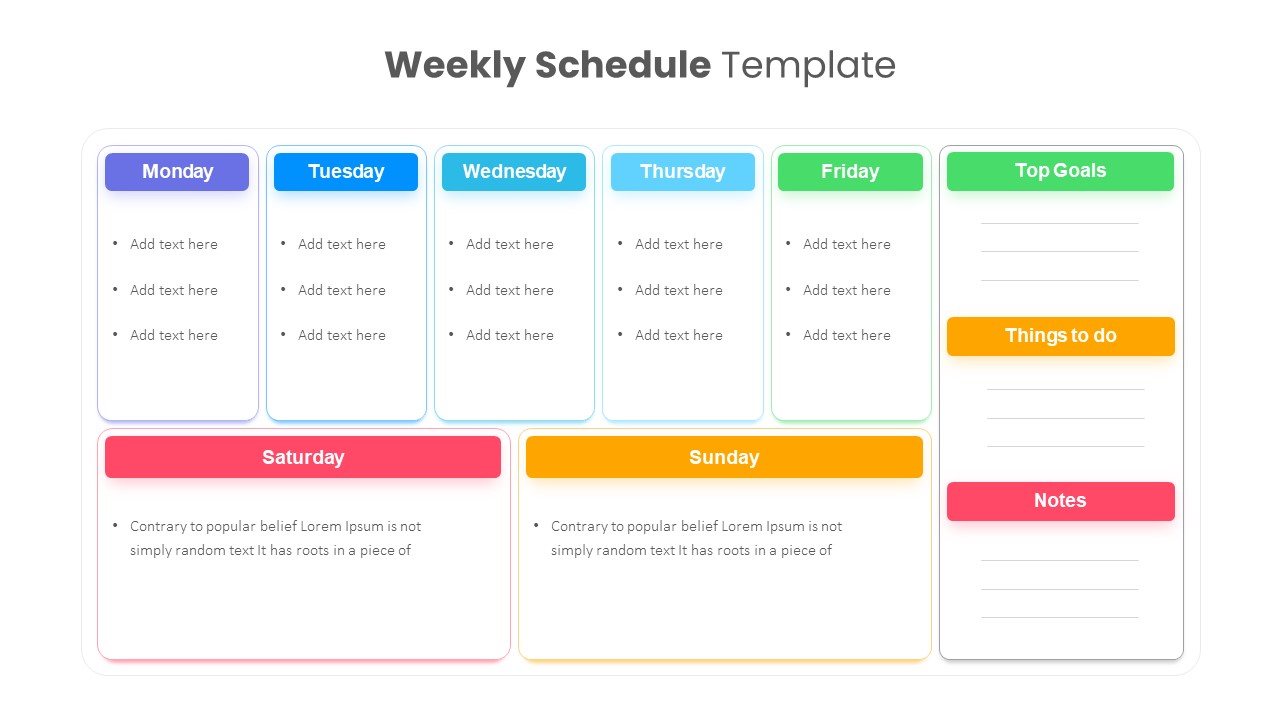
Colorful Weekly Schedule Slide Deck Template for PowerPoint & Google Slides
Agenda
Colorful Four-Segment Wheel Chart Template for PowerPoint & Google Slides
Circular
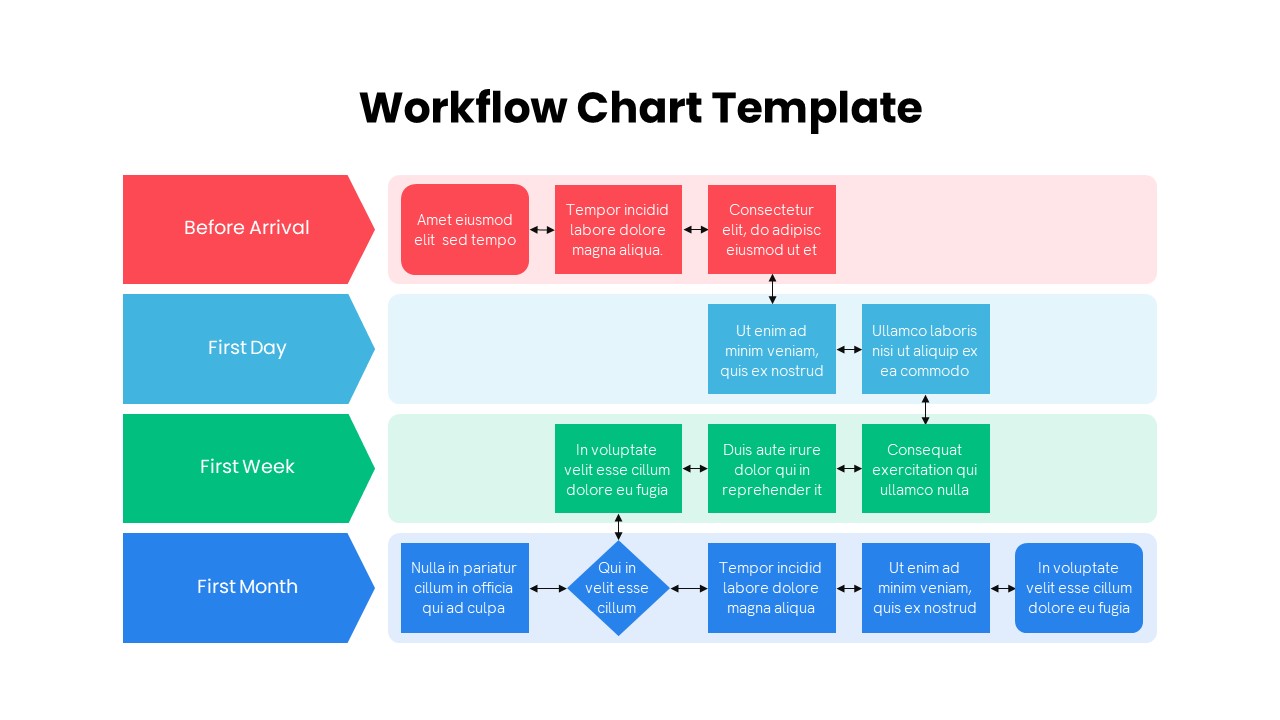
Workflow Chart PowerPoint Template
Flow Charts
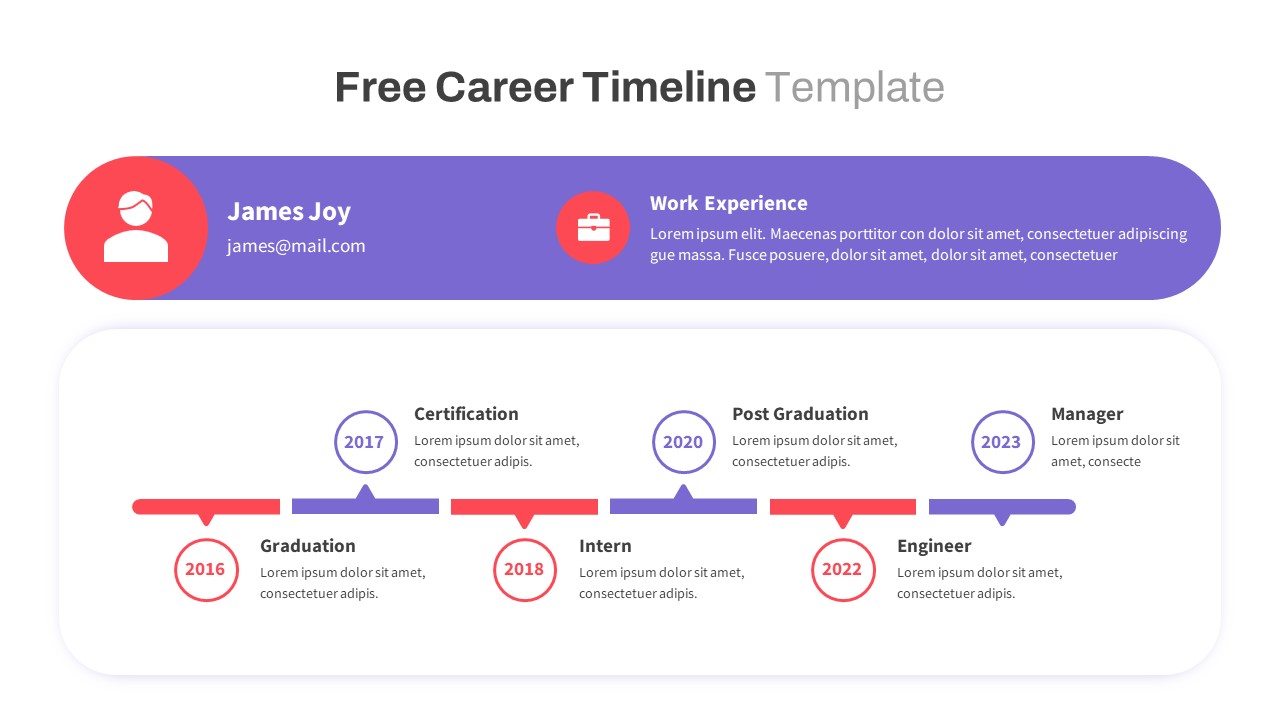
Free Colorful Career Timeline Resume Slide Template for PowerPoint & Google Slides
Timeline
Free
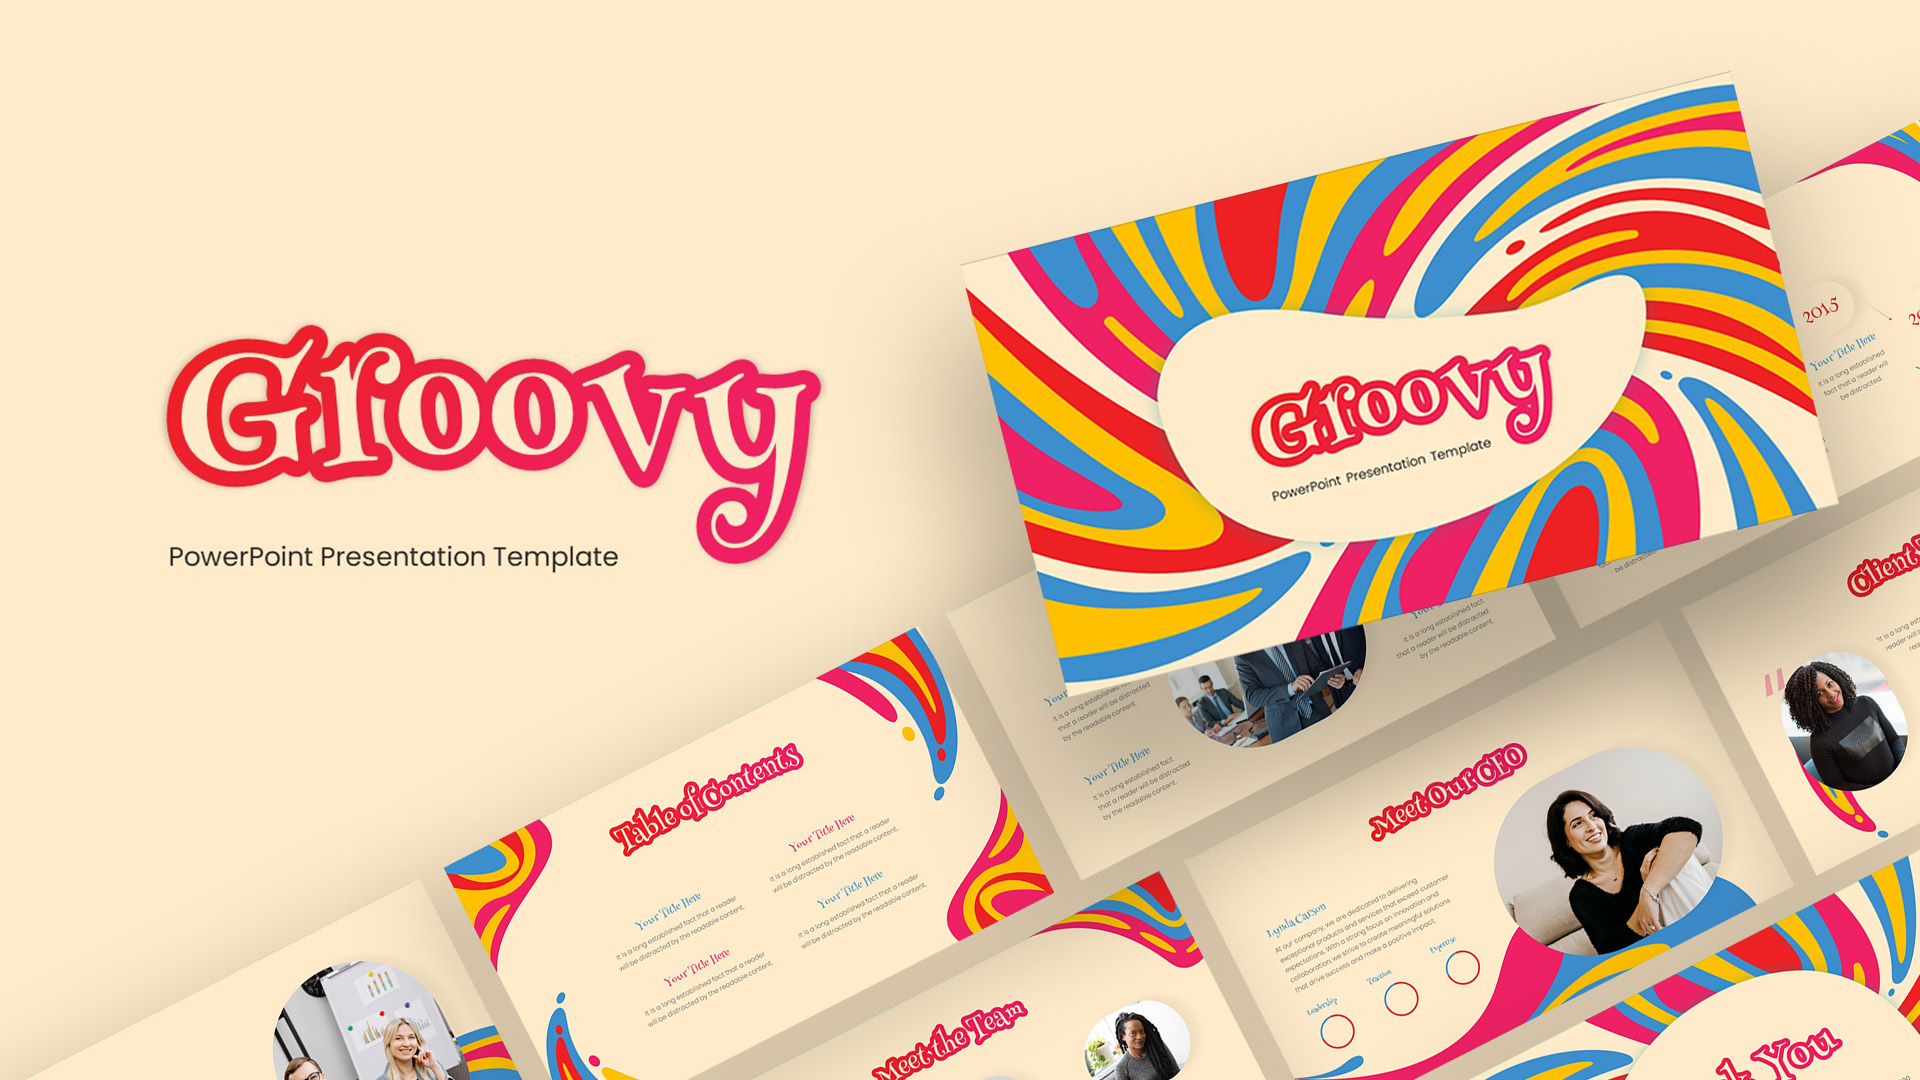
Groovy Retro Colorful Presentation Template for PowerPoint & Google Slides
Company Profile
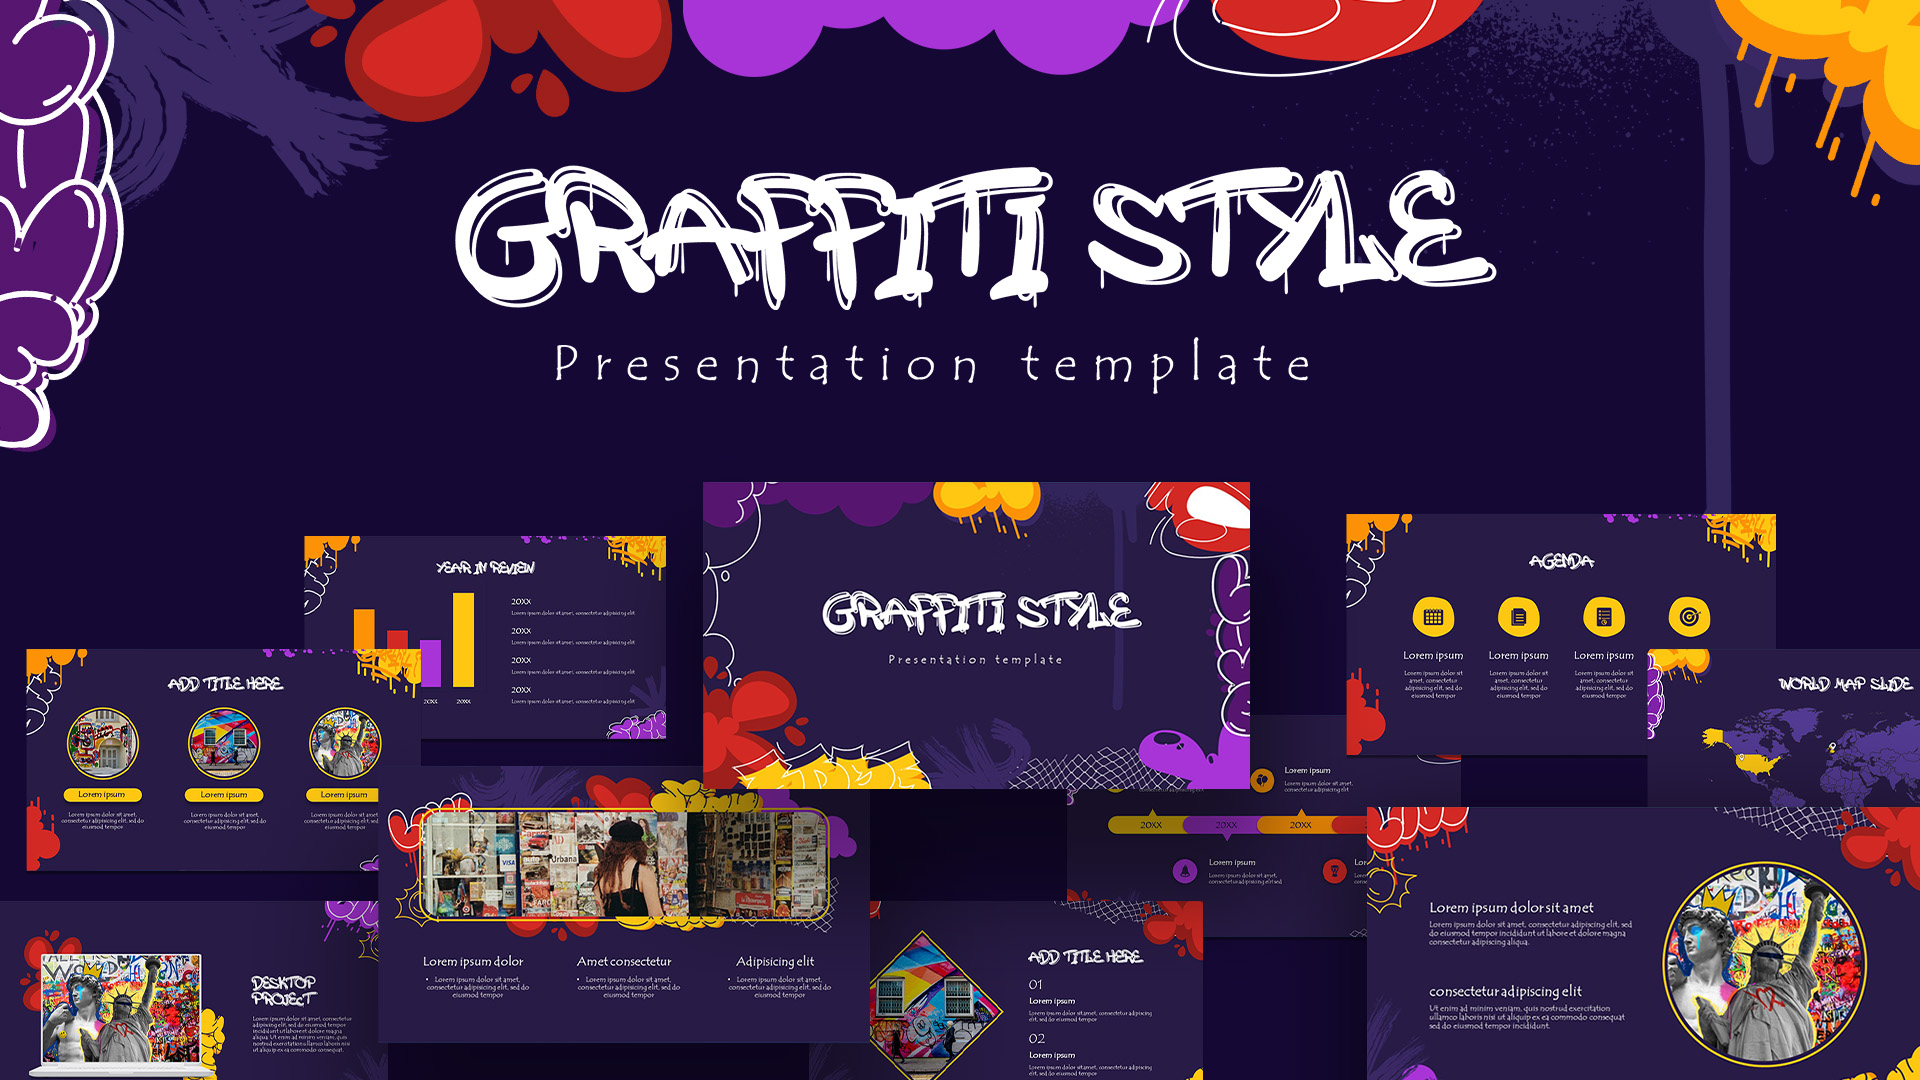
Free Graffiti PowerPoint Templates & Google Slides Themes
Pitch Deck
Free
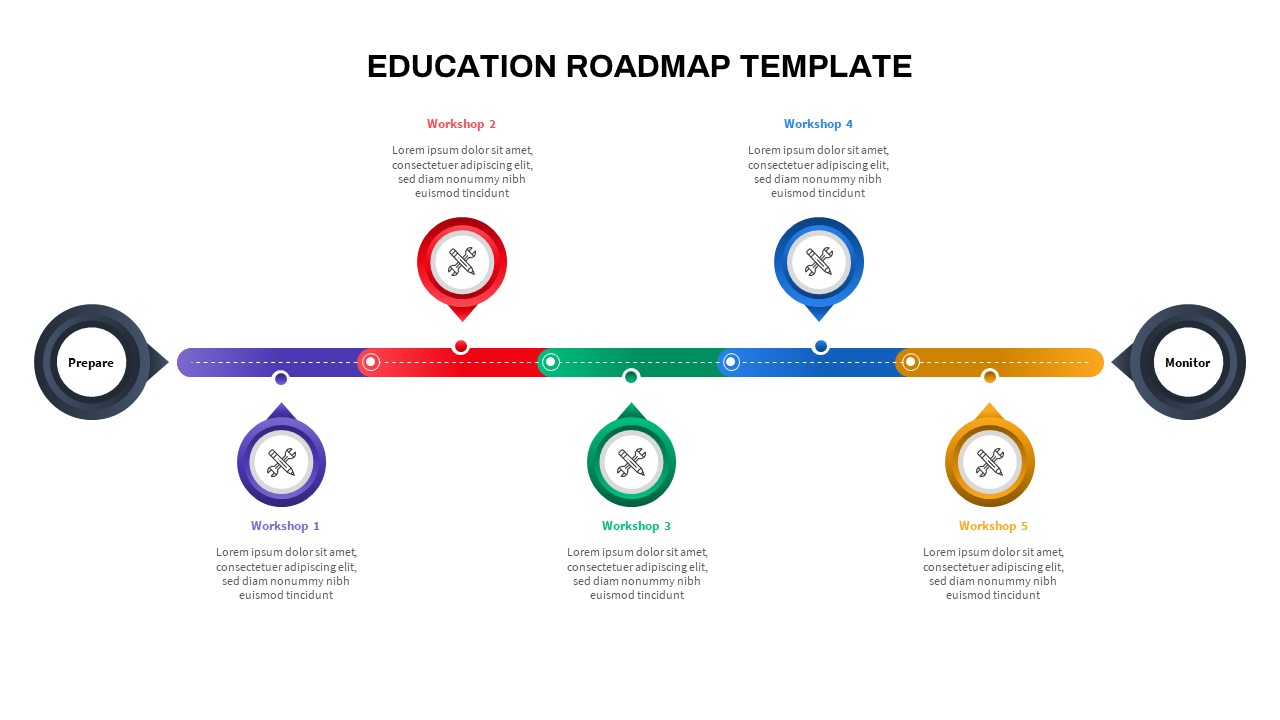
Colorful Education Roadmap Workshop Timeline Template for PowerPoint & Google Slides
Roadmap
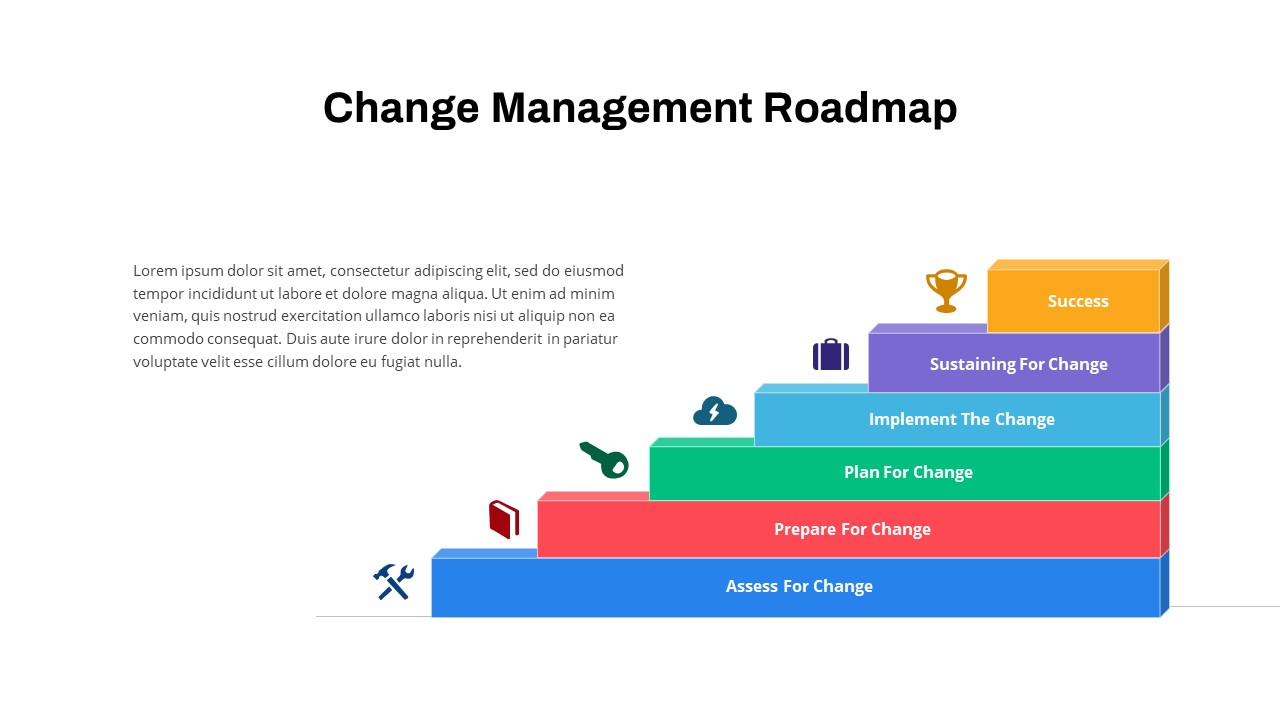
Colorful Change Management Roadmap Template for PowerPoint & Google Slides
Roadmap
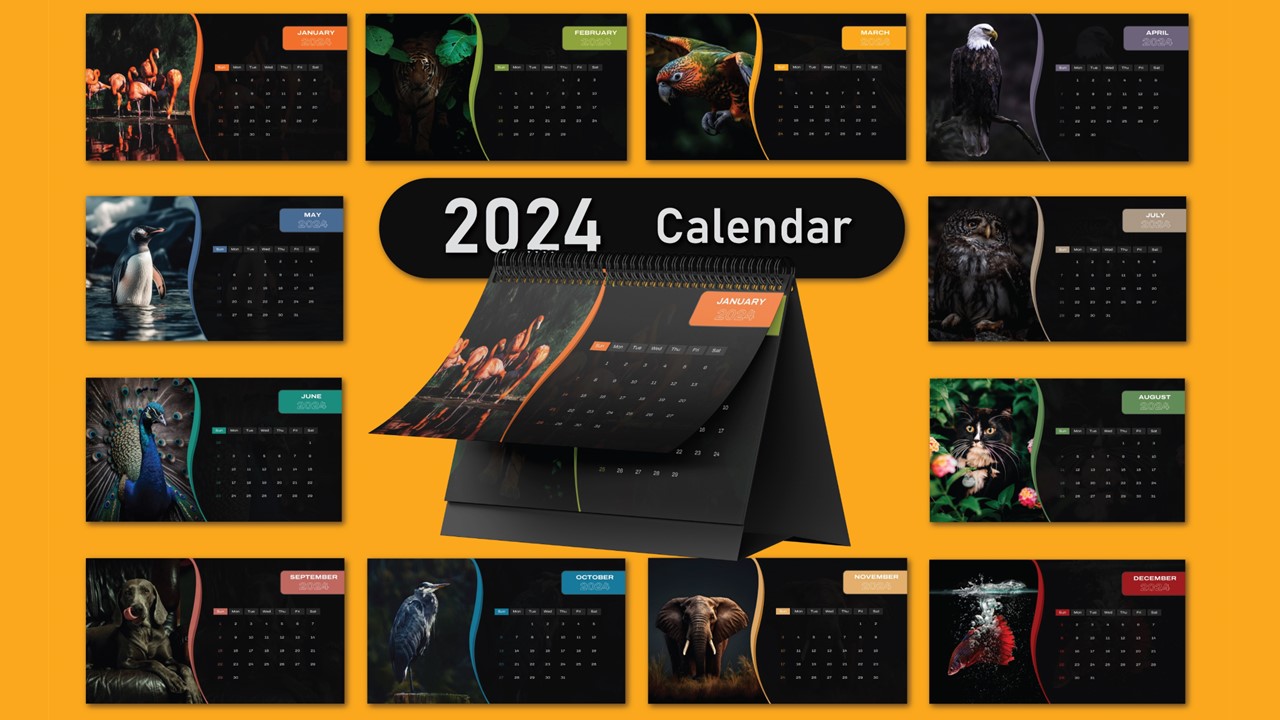
Free Colorful Animal 2024 Calendar Slide Pack Template for PowerPoint & Google Slides
Infographics
Free
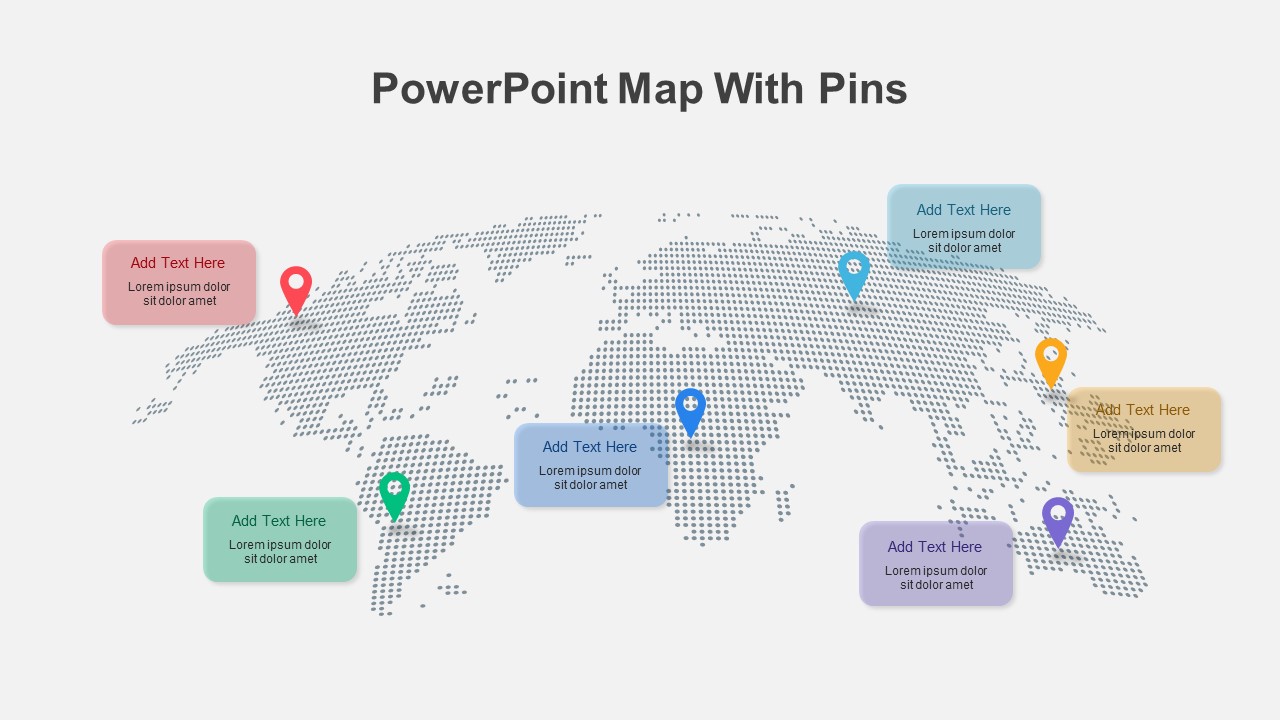
PowerPoint Map with Pins
World Maps

Free Colorful Infographic Slide Pack Template for PowerPoint & Google Slides
Roadmap
Free
Multi-Level Colorful Pyramid Chart Template for PowerPoint & Google Slides
Pyramid
Six Colorful Gear Shapes Infographic Template for PowerPoint & Google Slides
Process
Free
Colorful Multi-Branch Mind Map Slide Template for PowerPoint & Google Slides
Mind Maps
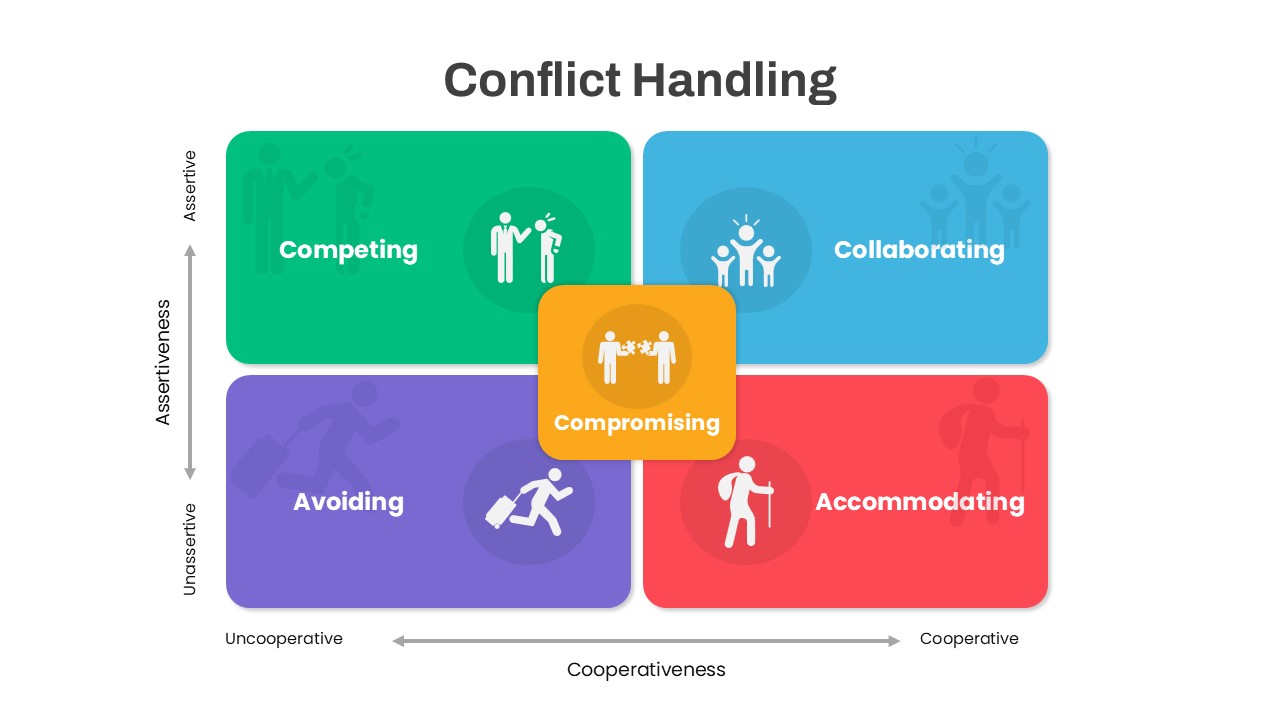
Colorful Conflict Handling Matrix Template for PowerPoint & Google Slides
Comparison
Colorful Seven-Item Agenda Slide Template for PowerPoint & Google Slides
Agenda
Colorful Five-Option Ribbon Infographic Template for PowerPoint & Google Slides
Process
Colorful Annual Gantt Chart Project Planner Template for PowerPoint & Google Slides
Gantt Chart
SWOT Template with Colorful Circles for PowerPoint & Google Slides
SWOT
Colorful Annual Gantt Chart Timeline Template for PowerPoint & Google Slides
Gantt Chart
Colorful Table Presentation Template for PowerPoint & Google Slides
Table