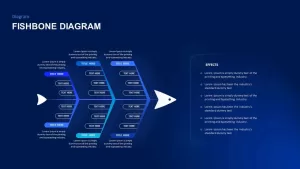
Fishbone Cause Analysis Diagram Template for PowerPoint & Google Slides


Description
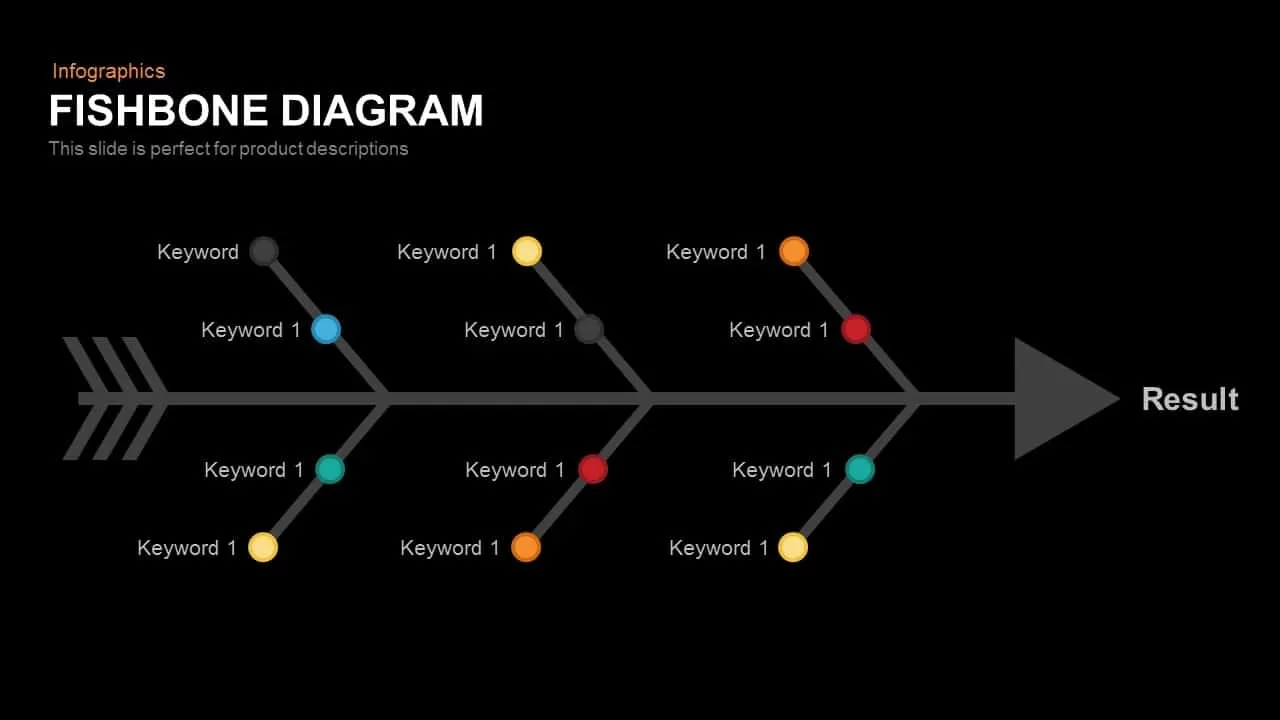
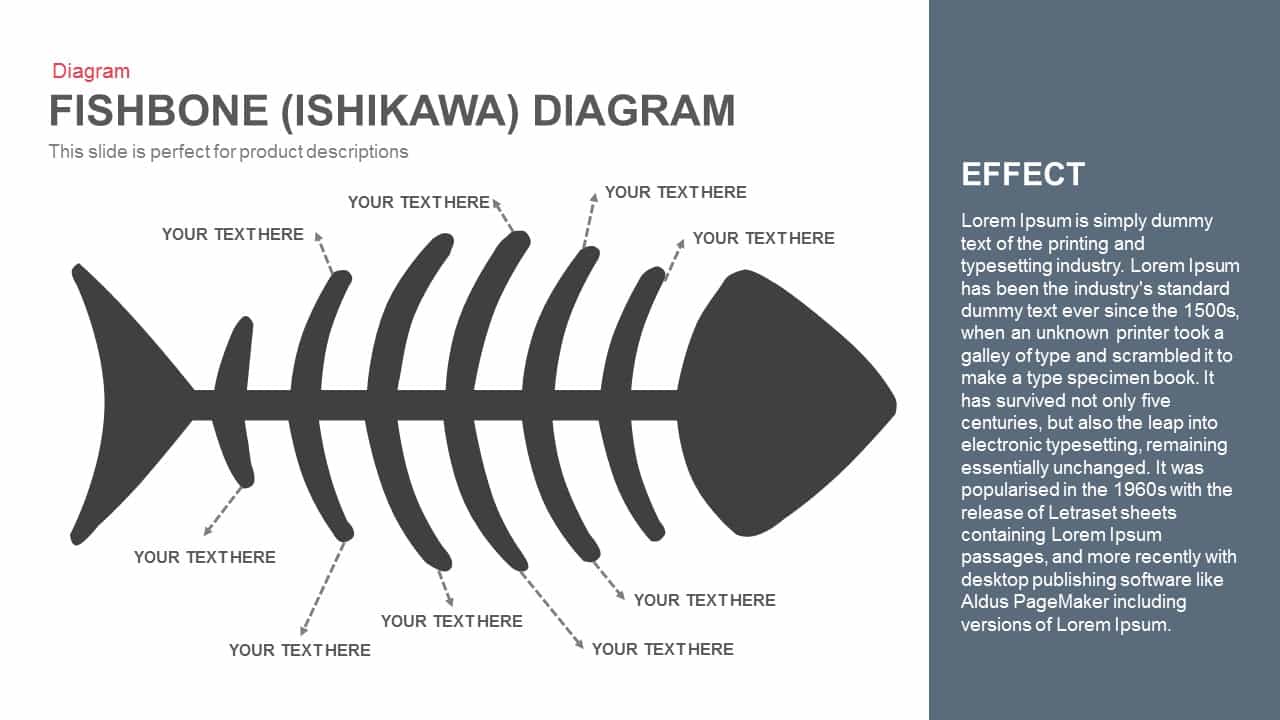
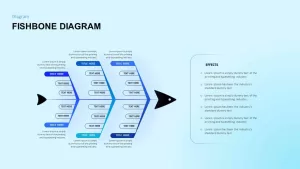
Elevate your root-cause investigations with this dynamic Fishbone Cause Analysis diagram template. Featuring a classic Ishikawa layout, the slide showcases three gradient-shaded backbone segments branching into labeled sub-causes, all converging on a bold arrow-head “effect” box. Crisp typography, vibrant blue-to-cyan gradations, and subtle drop shadows ensure each cause category and its four callouts stand out with clarity and visual hierarchy. The dark-mode background enhances contrast, making text and connectors pop on any screen.
Built on fully editable master slides, this template uses vector shapes and smart placeholders for seamless customization. Swap gradient fills to match corporate palettes, replace icons to suit specific problem domains, or relabel segments to reflect your organization’s terminology. Flexible text boxes and connector paths automatically realign as you add or remove sub-causes, minimizing manual adjustments. Linked data placeholders support live integration with Excel or Google Sheets, so you can present up-to-date failure rates, incident counts, or quality metrics directly within the diagram.
Optimized for both PowerPoint and Google Slides, the slide maintains full resolution clarity in webinars, boardroom presentations, and printable reports. Collaboration-friendly features—shared masters, version histories, and layout locking—help teams iterate without formatting errors. Use this visual asset to accelerate problem-solving workshops, quality-control reviews, compliance audits, or process-improvement sessions, transforming complex cause-and-effect relationships into a clear, actionable roadmap.
Who is it for
Quality managers, process engineers, project leads, and continuous-improvement professionals will benefit from this slide when conducting root-cause analyses, risk assessments, or corrective-action planning.
Other Uses
Repurpose this fishbone layout for risk-factor mapping, failure-mode analysis, product-development retrospectives, customer-experience diagnostics, or strategic brainstorming exercises.
Login to download this file

Item ID
SB01569
Related Templates

Free Root Cause Analysis PowerPoint Template
Process
Free
5 Why Fishbone Diagram for Root Cause Analysis in PowerPoint & Google Slides
Process
Fishbone Diagram Cause-and-Effect Template for PowerPoint & Google Slides
Process
Cause and Effect Diagram Template for PowerPoint and Google Slide
Process
Fishbone Infographic PowerPoint Template
Process
Fishbone Cause and Effect Infographic Template for PowerPoint & Google Slides
Infographics
Fishbone Diagram Analysis Template for PowerPoint & Google Slides
Flow Charts
Root Cause Analysis Template PowerPoint and Google Slides
Business Strategy
Sky and Tree Root Cause Analysis Deck Template for PowerPoint & Google Slides
Opportunities Challenges
Root Cause Analysis Infographic Pack Template for PowerPoint & Google Slides
Process
Three-Section Fishbone Process Diagram template for PowerPoint & Google Slides
Process
Fishbone RCA Diagram Template for PowerPoint & Google Slides
Business Strategy
Fishbone Diagram Overview template for PowerPoint & Google Slides
Infographics
Free Fishbone Diagram PowerPoint Template
Project
Free
Fishbone Template for PowerPoint Presentation
Infographics
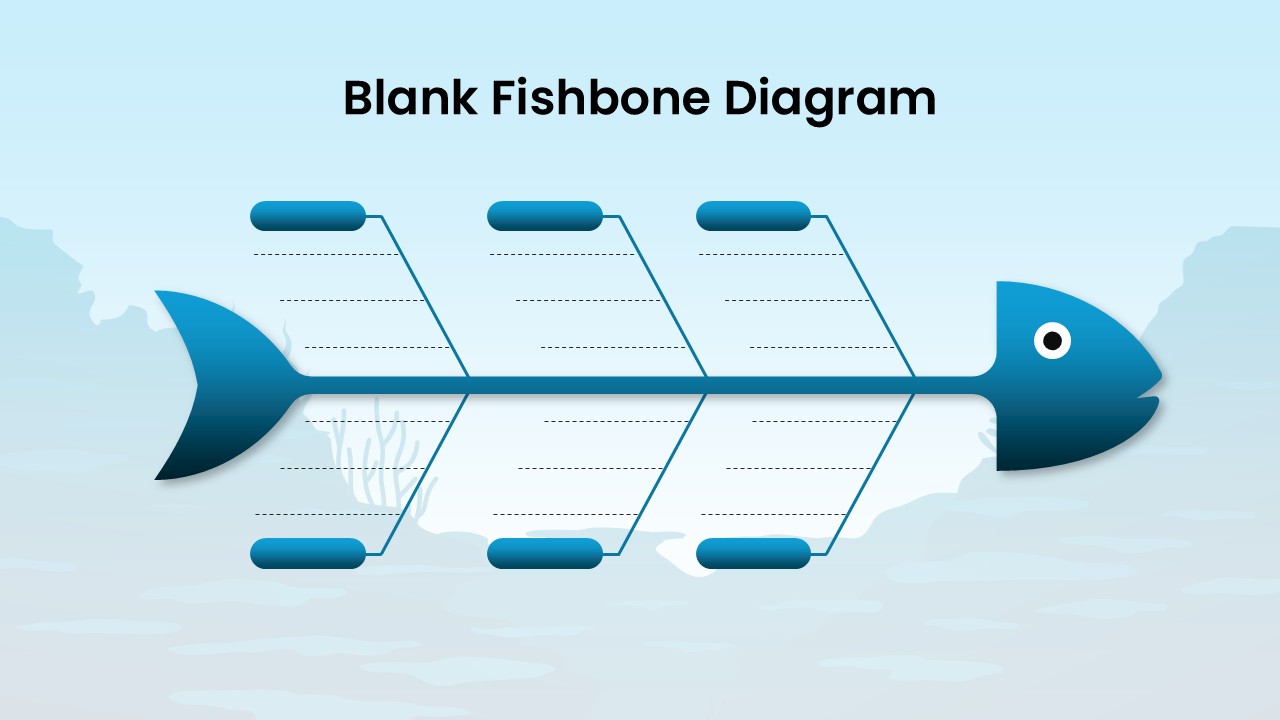
Blank Fishbone Diagram Template for PowerPoint & Google Slides
Process

Cause and Effect Diagram Infographic Template for PowerPoint & Google Slides
Bar/Column
Cause and Effect Template for PowerPoint & Google Slides
Arrow
Fishbone (Ishikawa) Diagram for PowerPoint & Google Slides
Process
Fishbone Timeline Template
Manufacturing
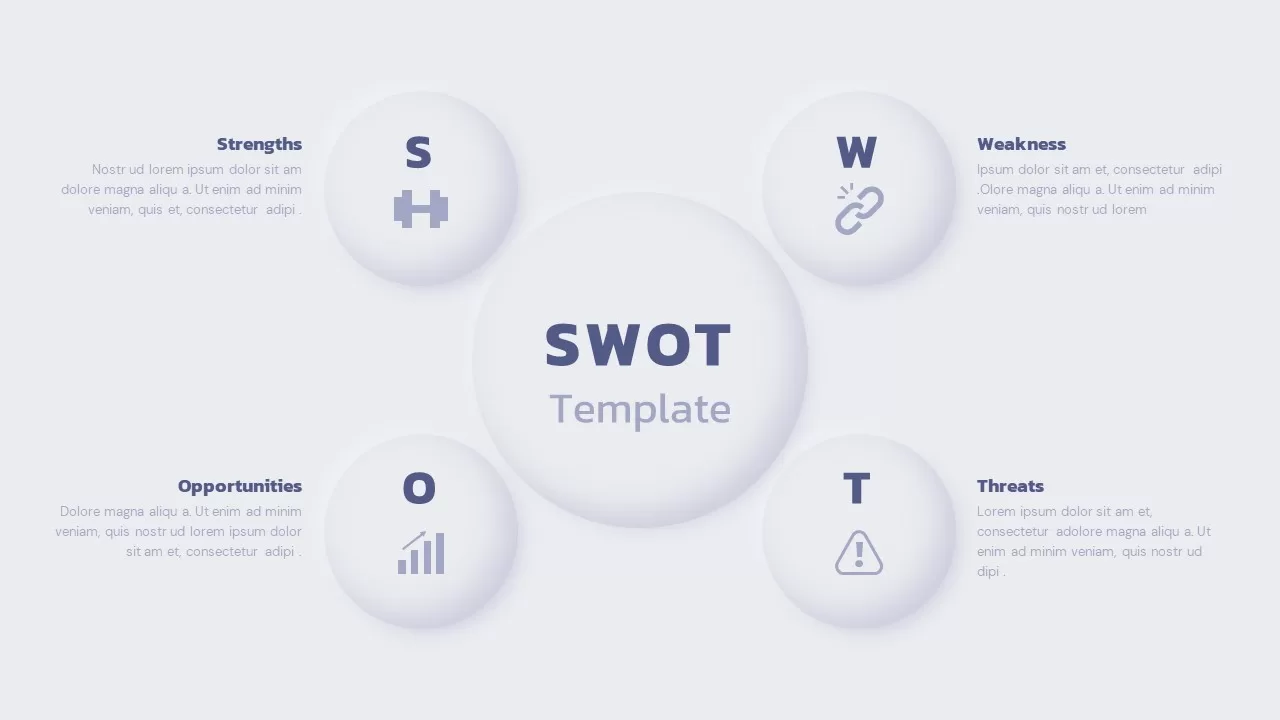
Modern Circle SWOT Analysis Diagram Template for PowerPoint & Google Slides
SWOT
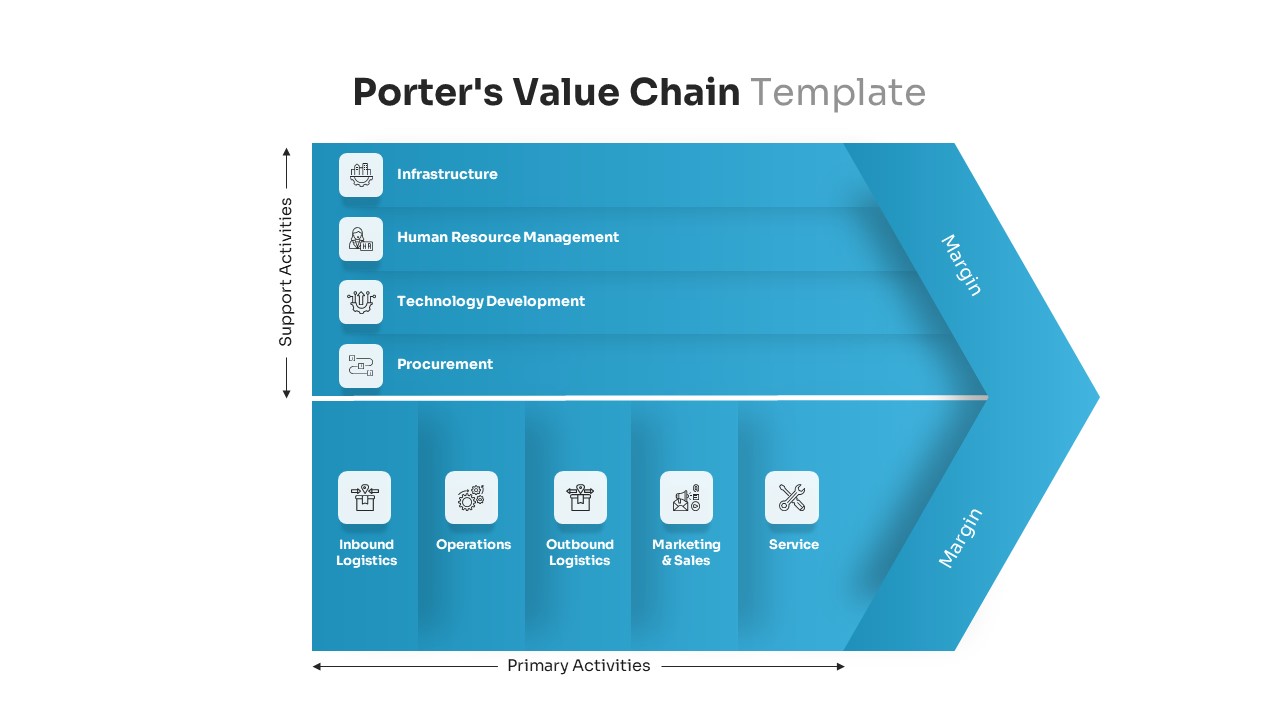
Porter’s Value Chain Analysis Diagram Template for PowerPoint & Google Slides
Business Strategy
Editable Force Field Analysis Diagram Template for PowerPoint & Google Slides
Business Plan
Professional PESTEL Analysis Diagram Template for PowerPoint & Google Slides
PEST
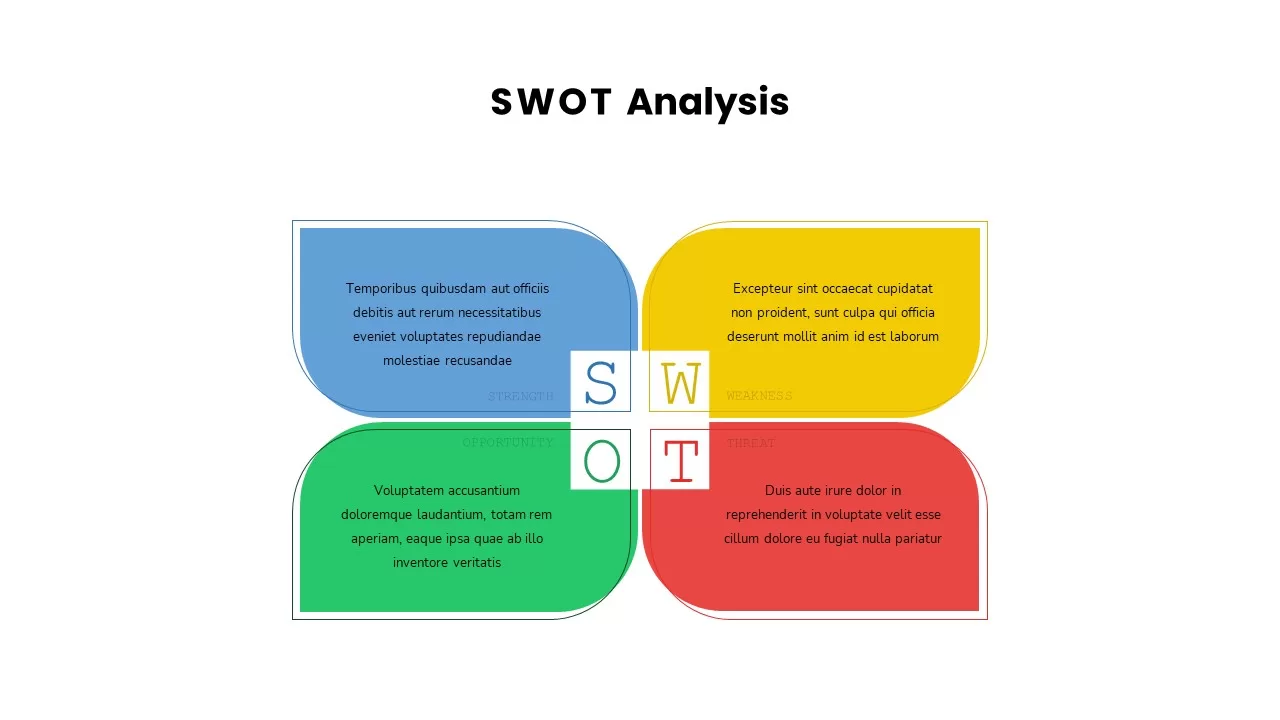
Puzzle-Style SWOT Analysis Table Diagram Template for PowerPoint & Google Slides
SWOT
PEST Analysis Circular Diagram Template for PowerPoint & Google Slides
PEST
Pestle Analysis PowerPoint Template and Slides
PEST
SWOT Analysis Gear Diagram Slide Template for PowerPoint & Google Slides
SWOT

Interactive Gap Analysis Puzzle Diagram Template for PowerPoint & Google Slides
Gap
Cluster Analysis Infographic Diagram Template for PowerPoint & Google Slides
Business
Four-Quadrant SWOT Analysis Diagram Template for PowerPoint & Google Slides
SWOT
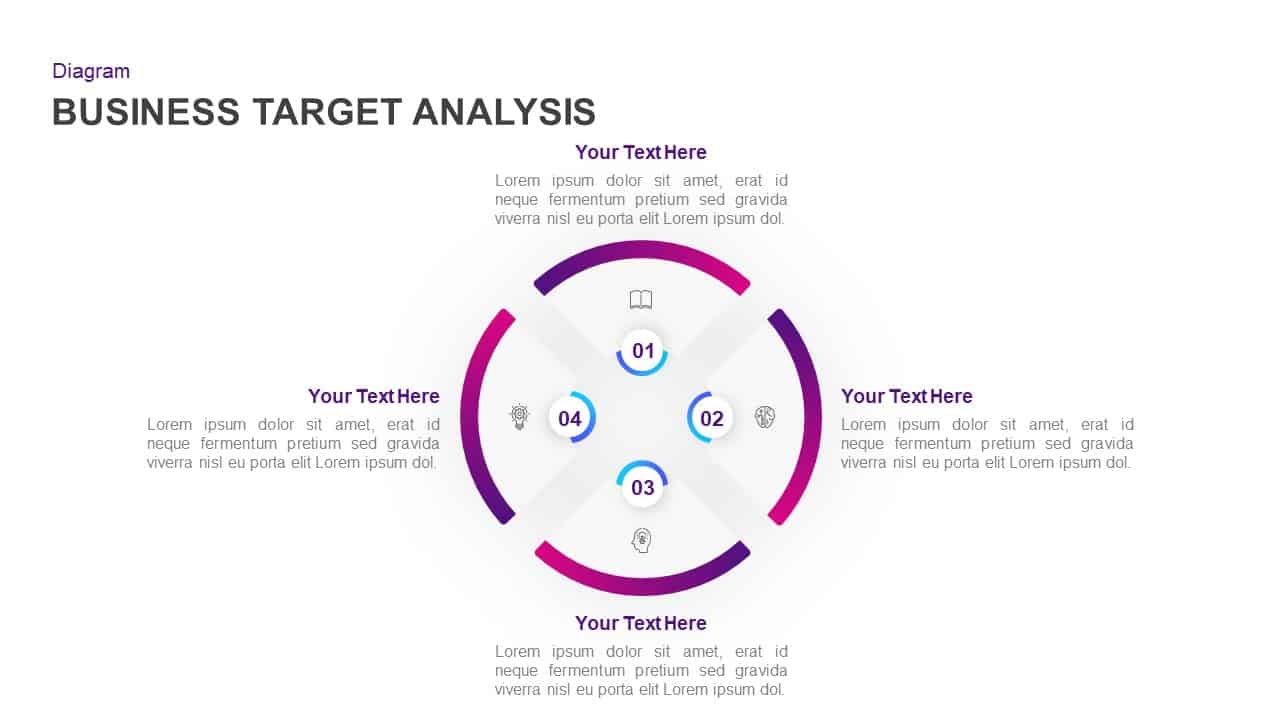
Business Target Analysis Diagram Template for PowerPoint & Google Slides
Circular
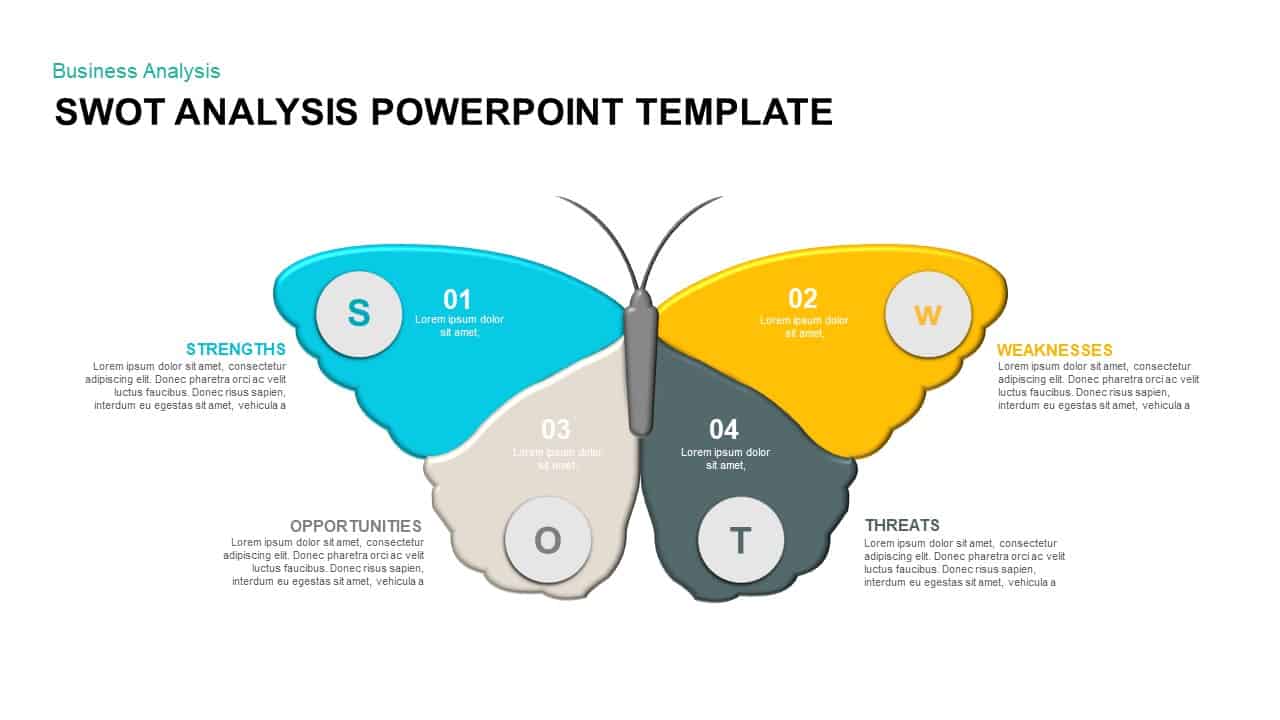
Butterfly SWOT Analysis Diagram Template for PowerPoint & Google Slides
SWOT
Four-Part SWOT Analysis Diagram Template for PowerPoint & Google Slides
SWOT

SWOT Analysis PowerPoint Slide
SWOT
IQ Scale Analysis Diagram template for PowerPoint & Google Slides
Employee Performance
SWOT Analysis Editable Template Infographics
Opportunities Challenges
Six-Step Business Analysis Diagram template for PowerPoint & Google Slides
Circular
Business Process Analysis Cycle Diagram Template for PowerPoint & Google Slides
Business Strategy
Experience Curve Analysis Diagram Template for PowerPoint & Google Slides
Business Strategy
Cost-Volume-Profit Analysis Diagram Template for PowerPoint & Google Slides
Finance

Colorful SWOT Analysis Diagram Template for PowerPoint & Google Slides
SWOT
Bottleneck PowerPoint Template
Process
Fundamental Analysis Circular Diagram Template for PowerPoint & Google Slides
Circular
Cultural Web Analysis Circular Diagram Template for PowerPoint & Google Slides
Circular
DESTEP Marketing Analysis Diagram Template for PowerPoint & Google Slides
Circular
Banking Industry PESTLE Analysis Diagram Template for PowerPoint & Google Slides
PEST
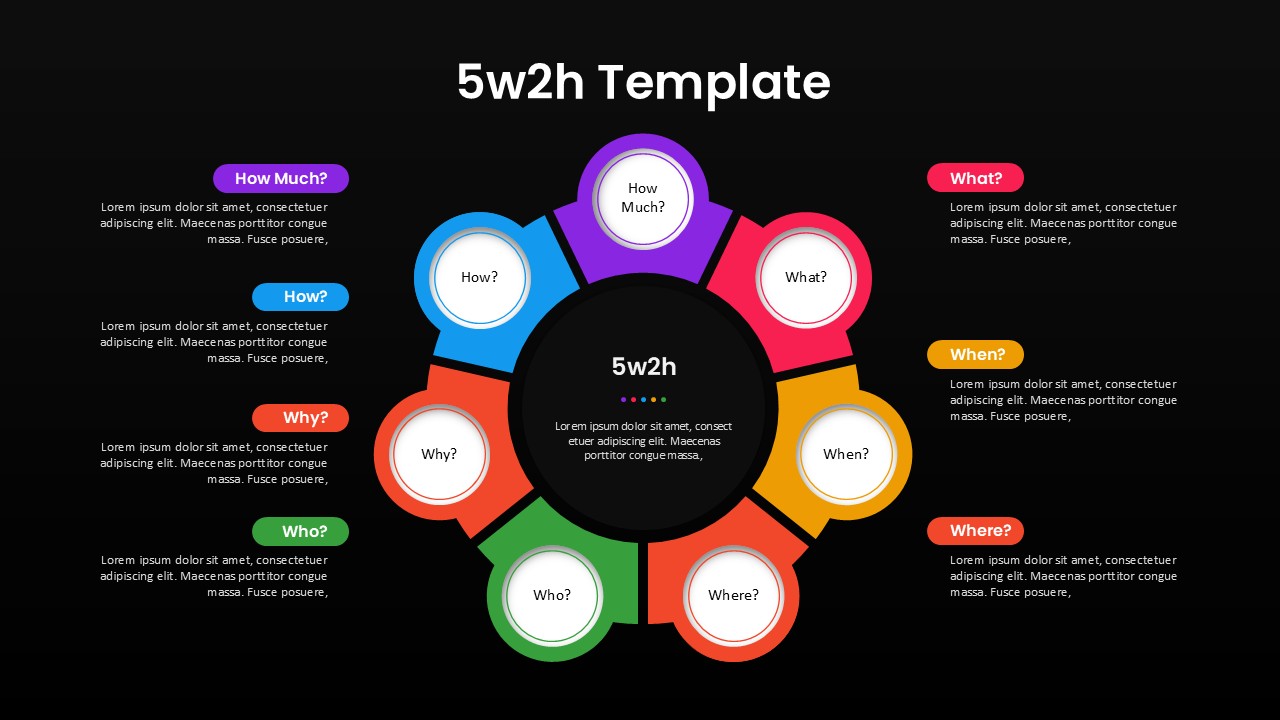
5W2H Analysis Radial Diagram Template for PowerPoint & Google Slides
Decision Tree
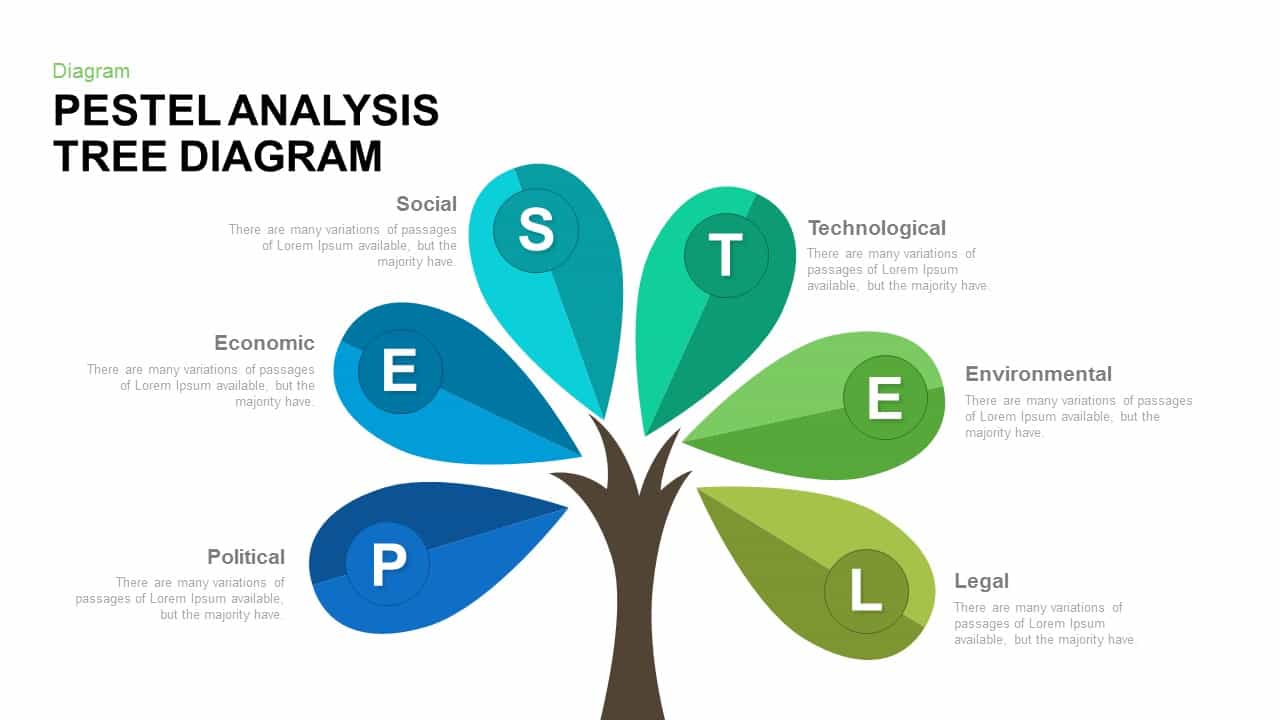
PESTEL Analysis Tree Diagram PowerPoint Template and Google Slides
Process
PEST Analysis PowerPoint Template for PowerPoint & Google Slides
Business Strategy

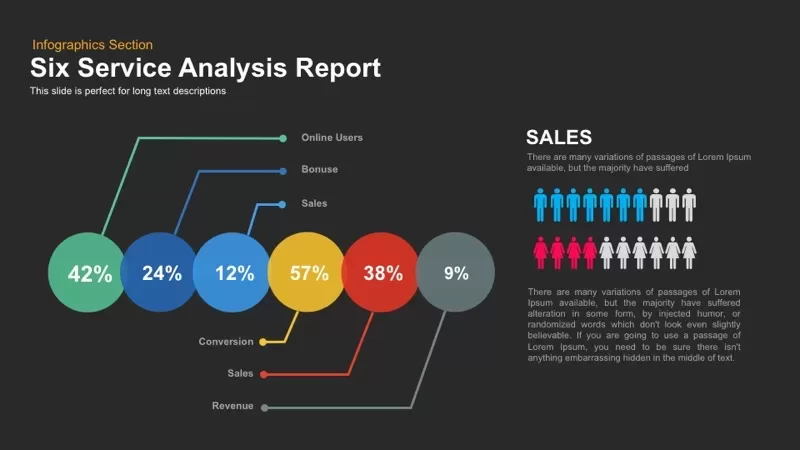
Six Service Analysis Report template for PowerPoint & Google Slides
Infographics
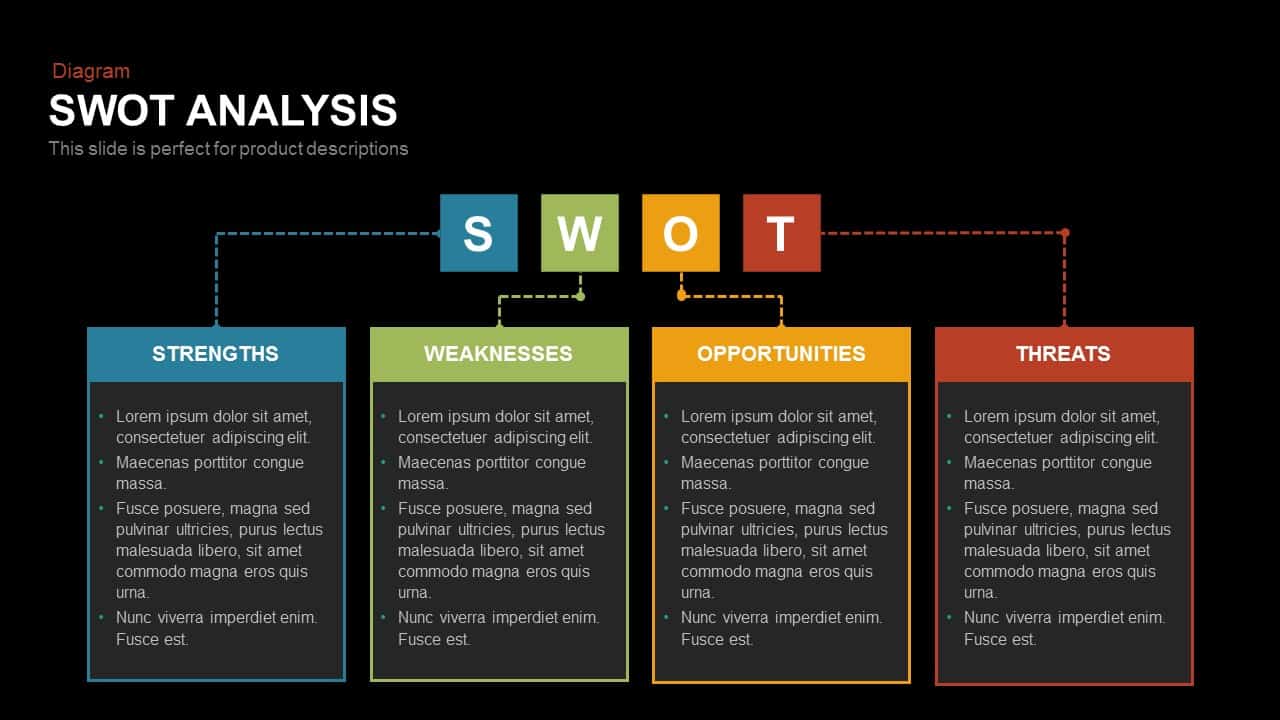
SWOT Analysis template for PowerPoint & Google Slides
SWOT
Employee Skill Analysis Dashboard Template for PowerPoint & Google Slides
Employee Performance
Interactive 3D Puzzle SWOT Analysis Slide Template for PowerPoint & Google Slides
SWOT
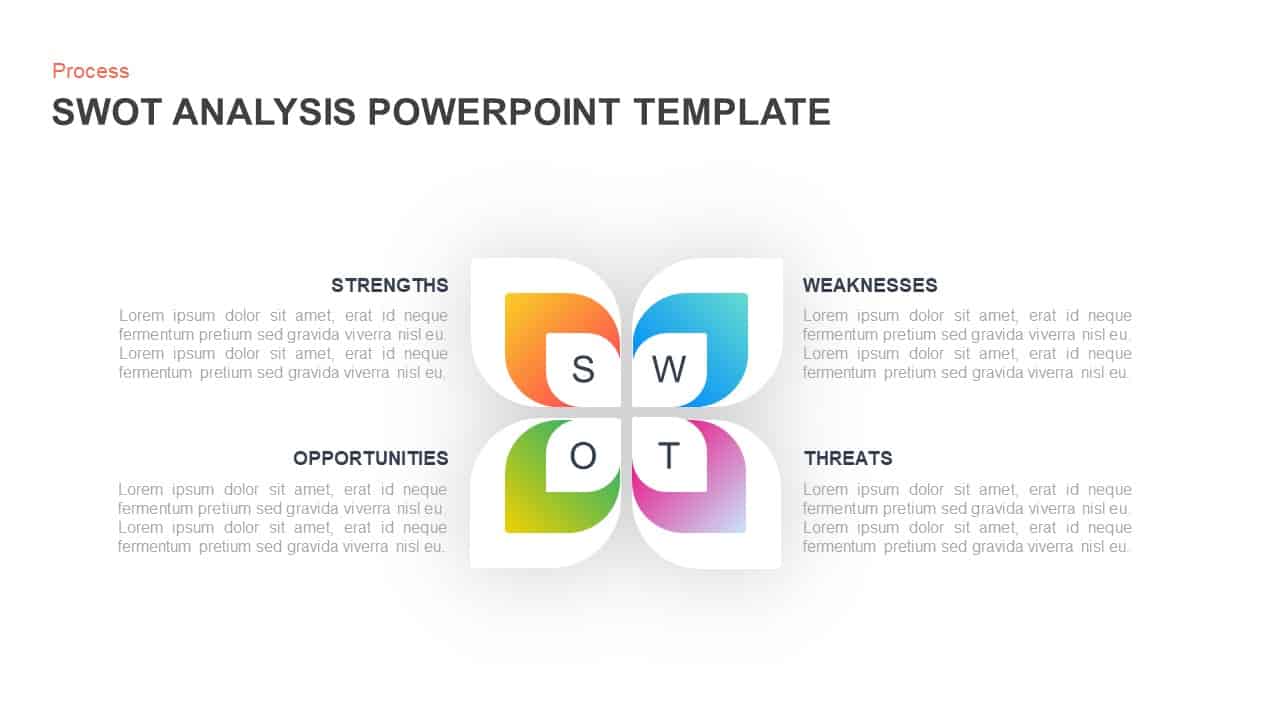
Gradient Petal SWOT Analysis Quadrant Template for PowerPoint & Google Slides
SWOT
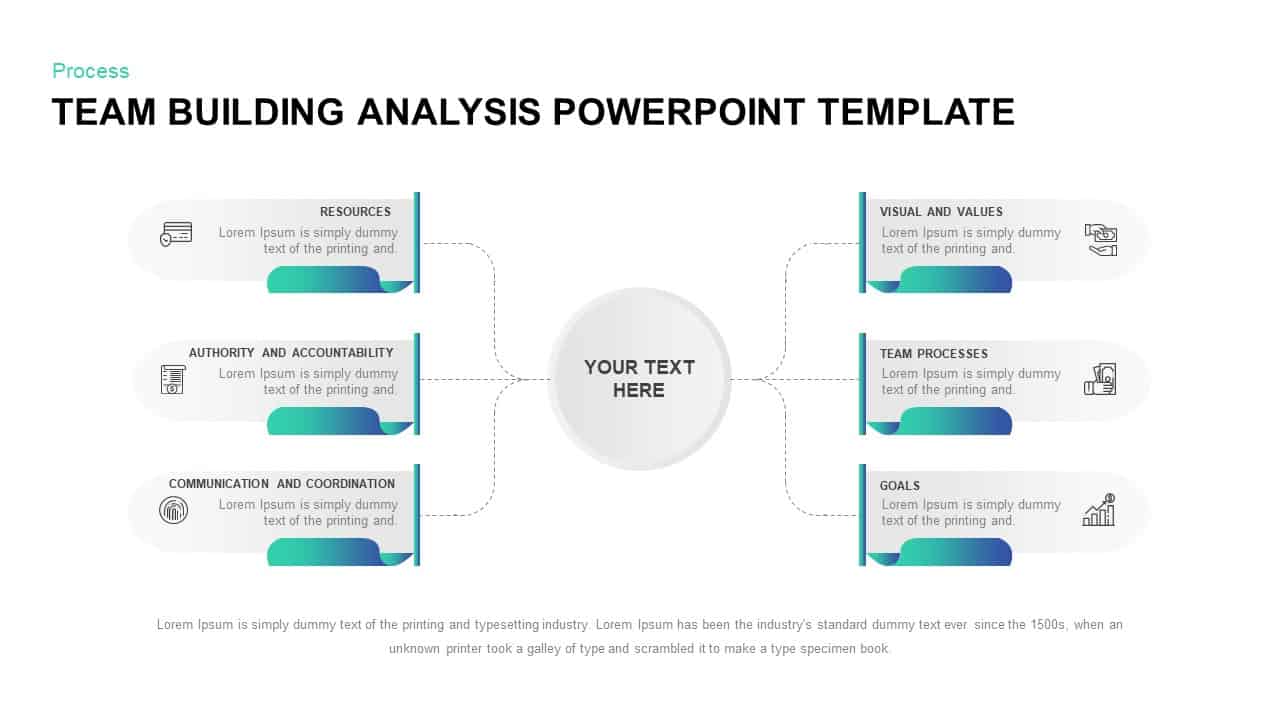
Team Building Hub-and-Spoke Analysis Template for PowerPoint & Google Slides
Process
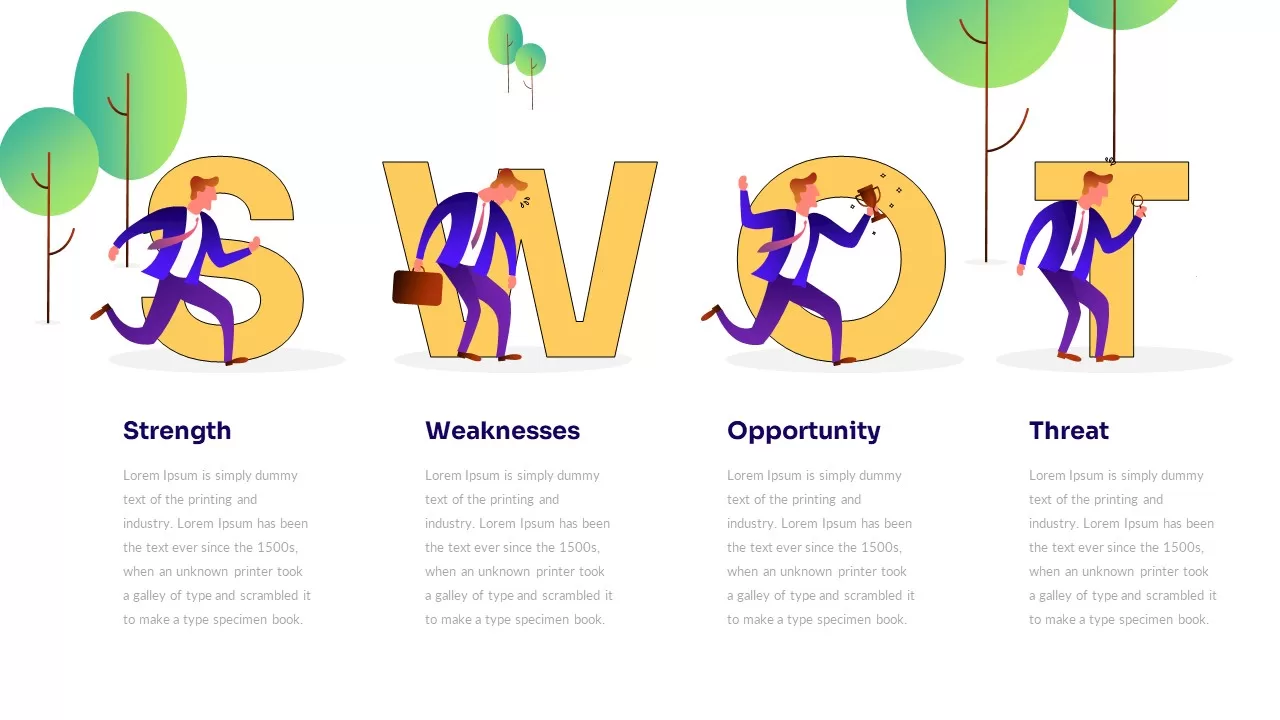
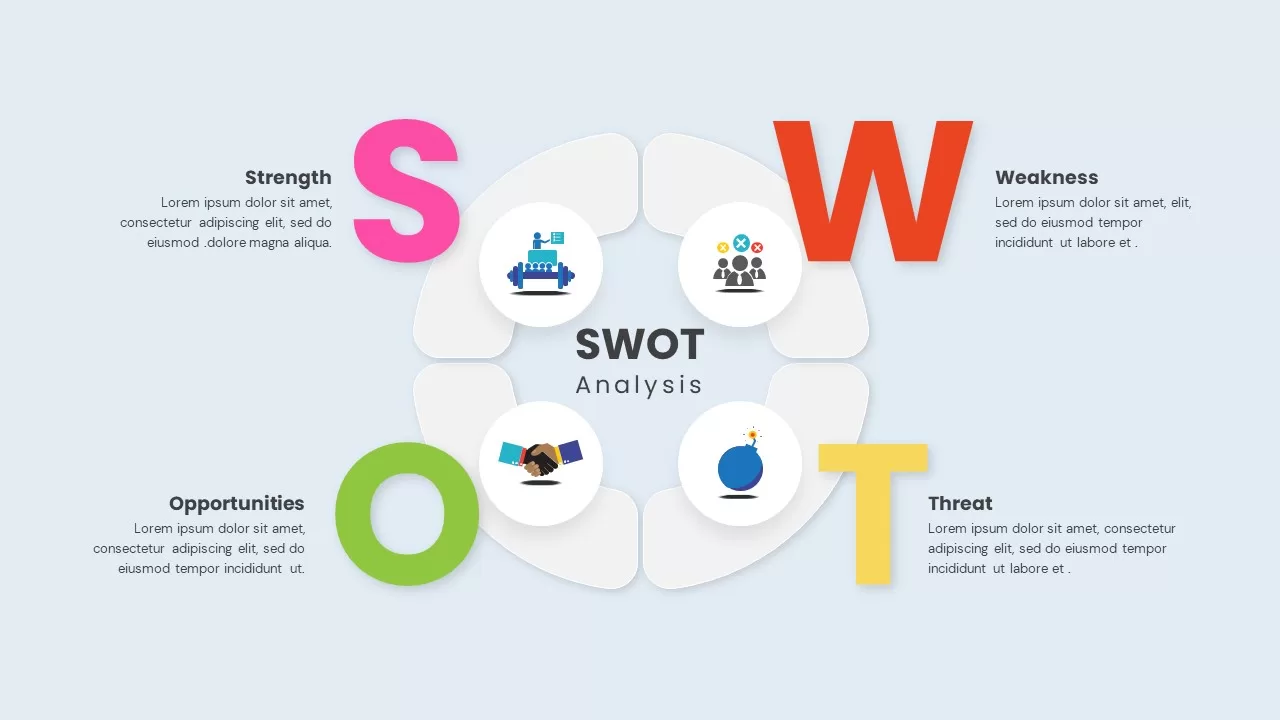
Illustrated Business SWOT Analysis Template for PowerPoint & Google Slides
SWOT
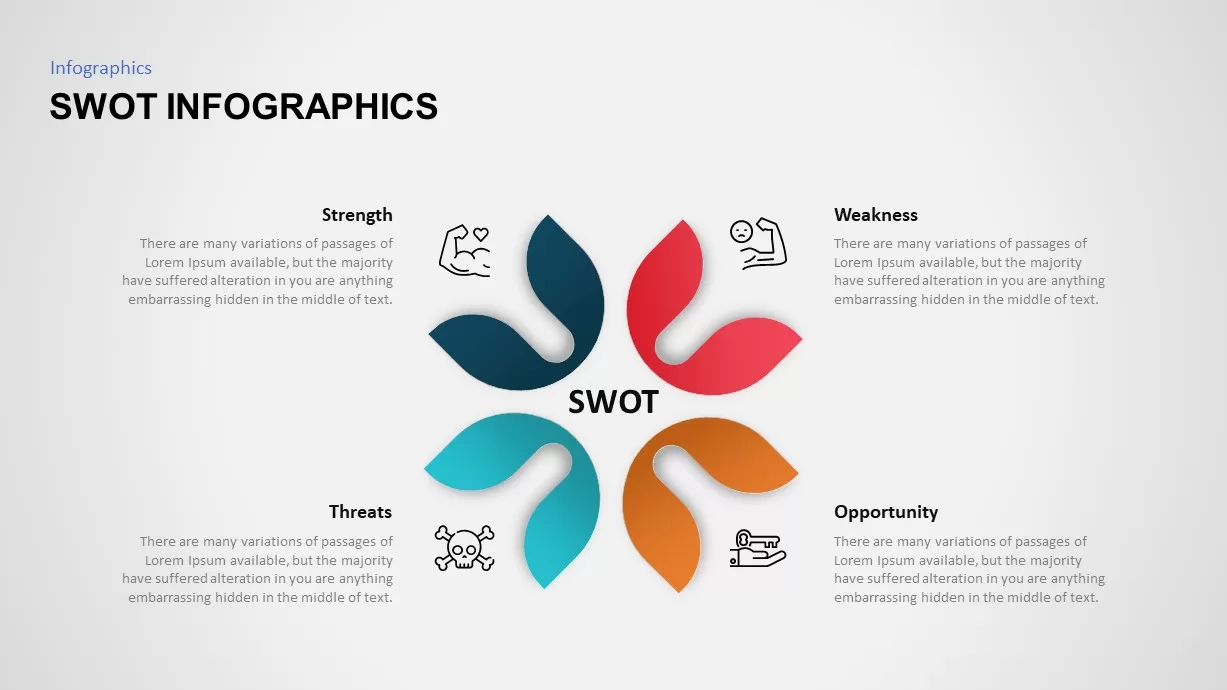
SWOT Analysis Petal Infographic Template for PowerPoint & Google Slides
SWOT
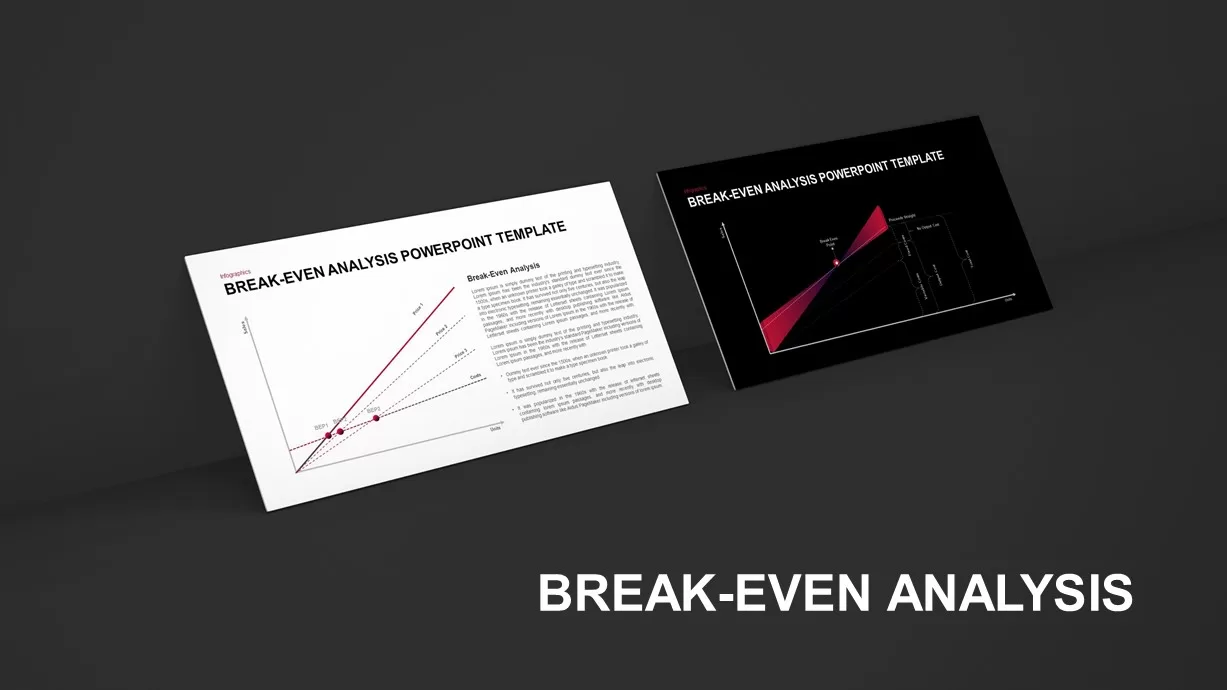
Break-Even Analysis template for PowerPoint & Google Slides
Process
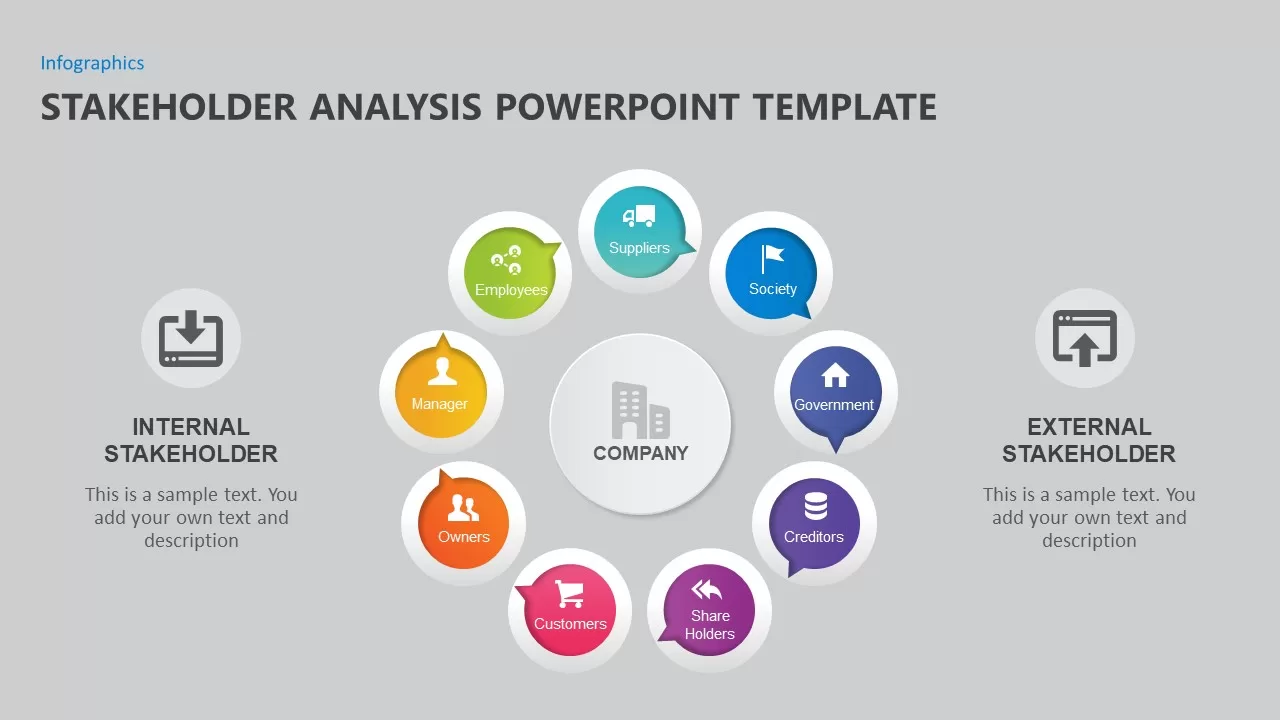
Stakeholder Analysis Template for PowerPoint
Business
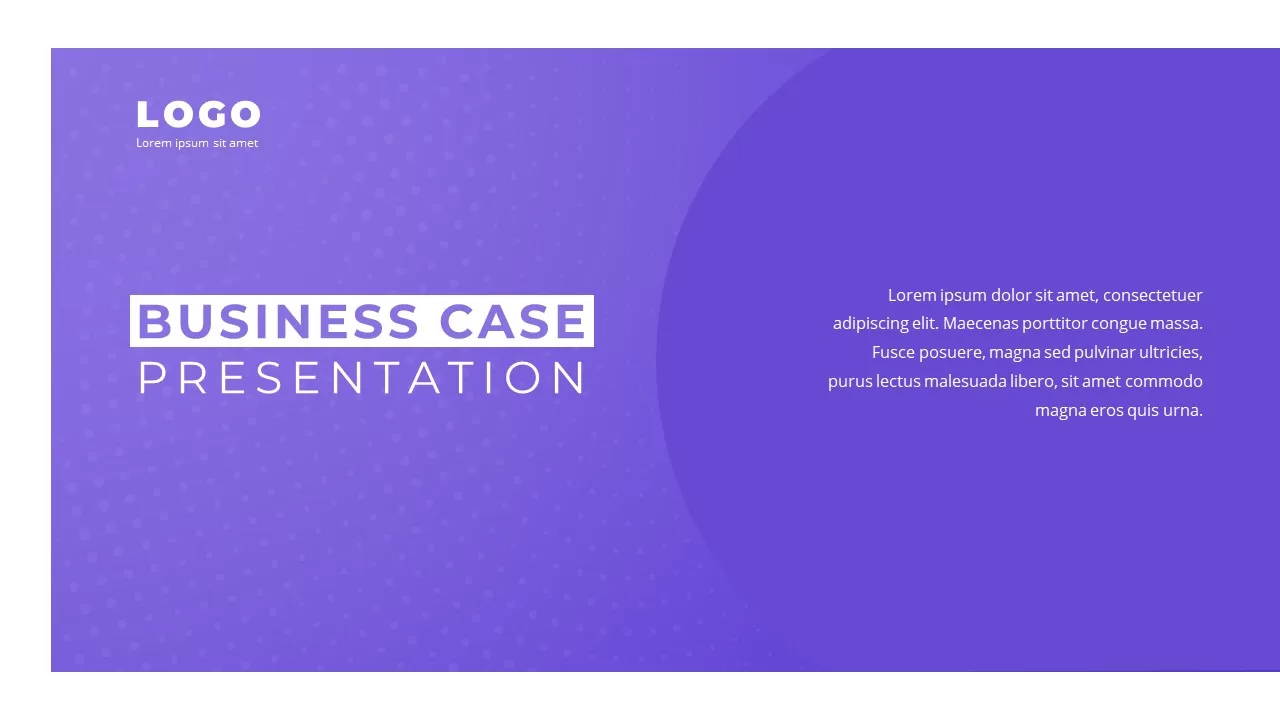
Business Case Deck with Market Analysis Template for PowerPoint & Google Slides
Business Report
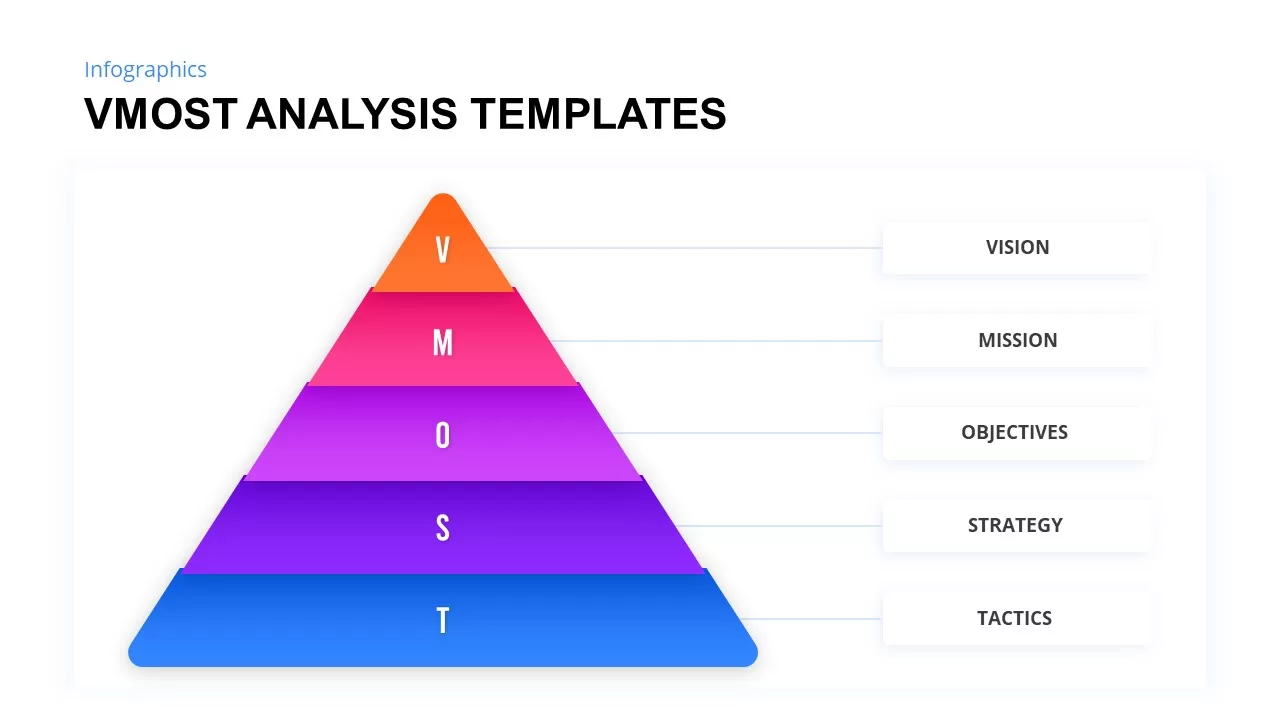
VMOST Analysis Template for PowerPoint & Google Slides
Business Strategy
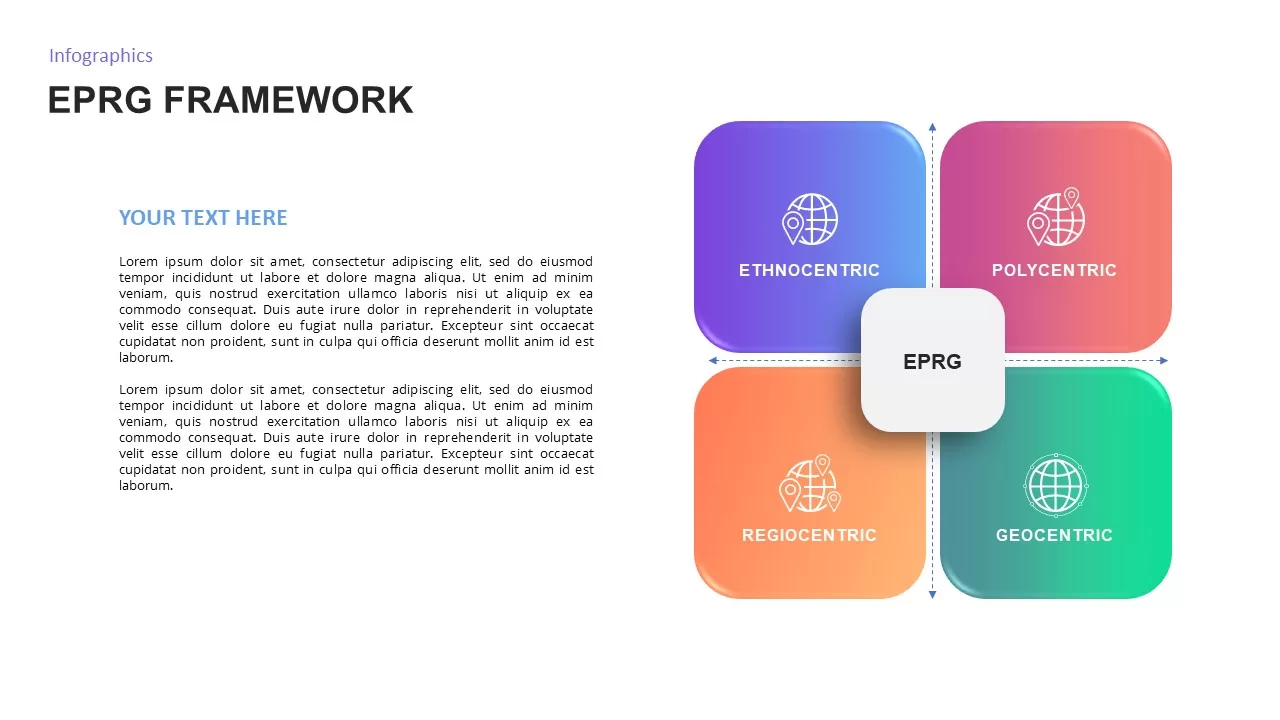
EPRG Framework Analysis template for PowerPoint & Google Slides
Business Strategy
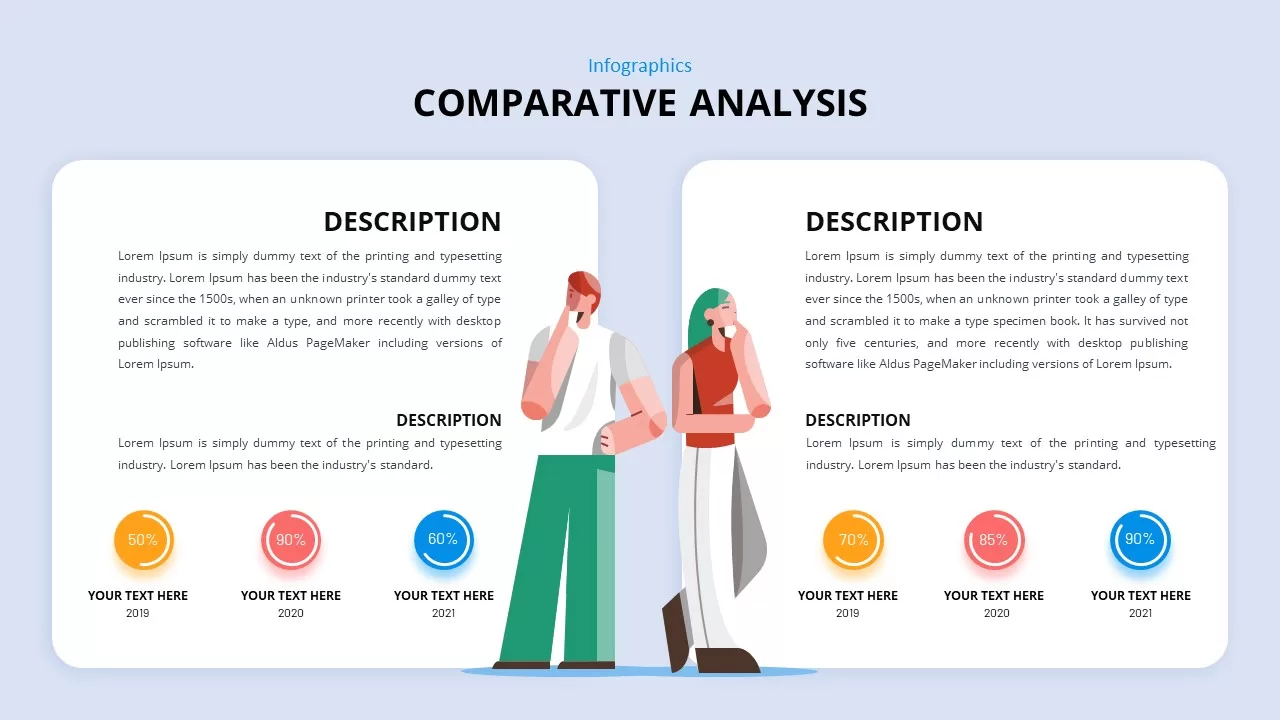
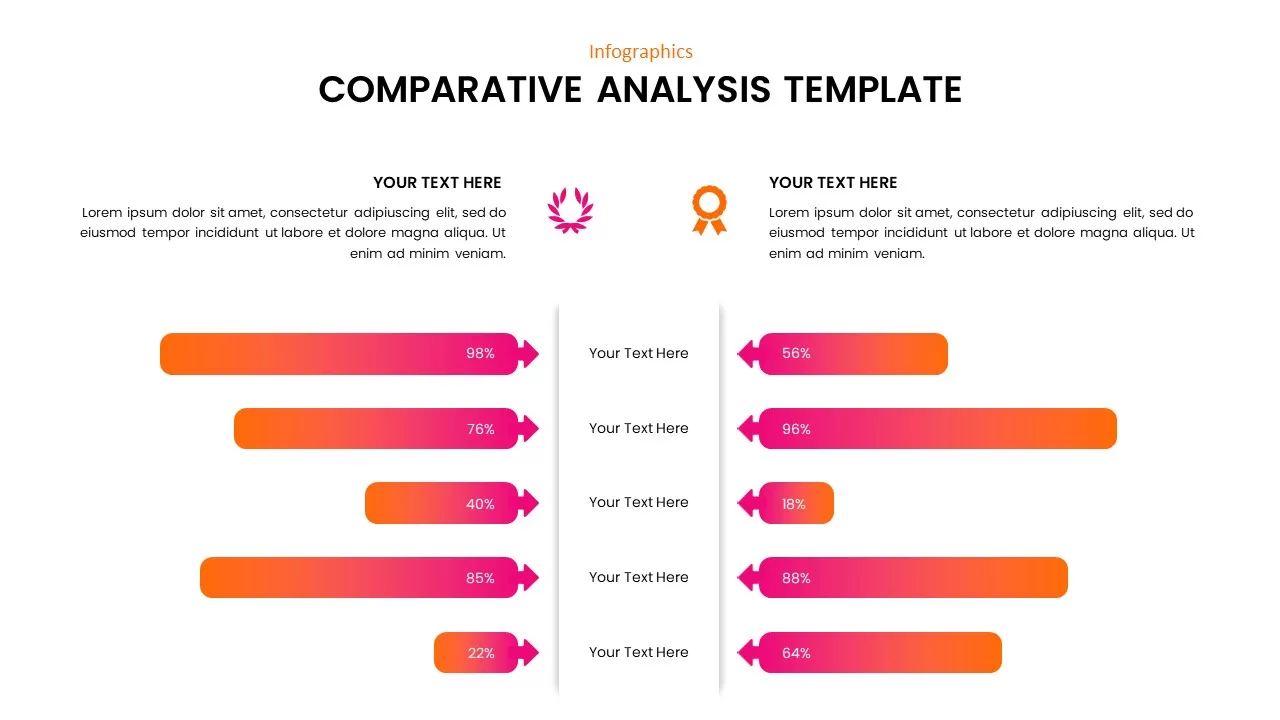
Comparative Analysis PowerPoint Template
Comparison
Problem Statement Infographic PowerPoint Template
Business Strategy
Comparative Analysis template for PowerPoint & Google Slides
Business Report
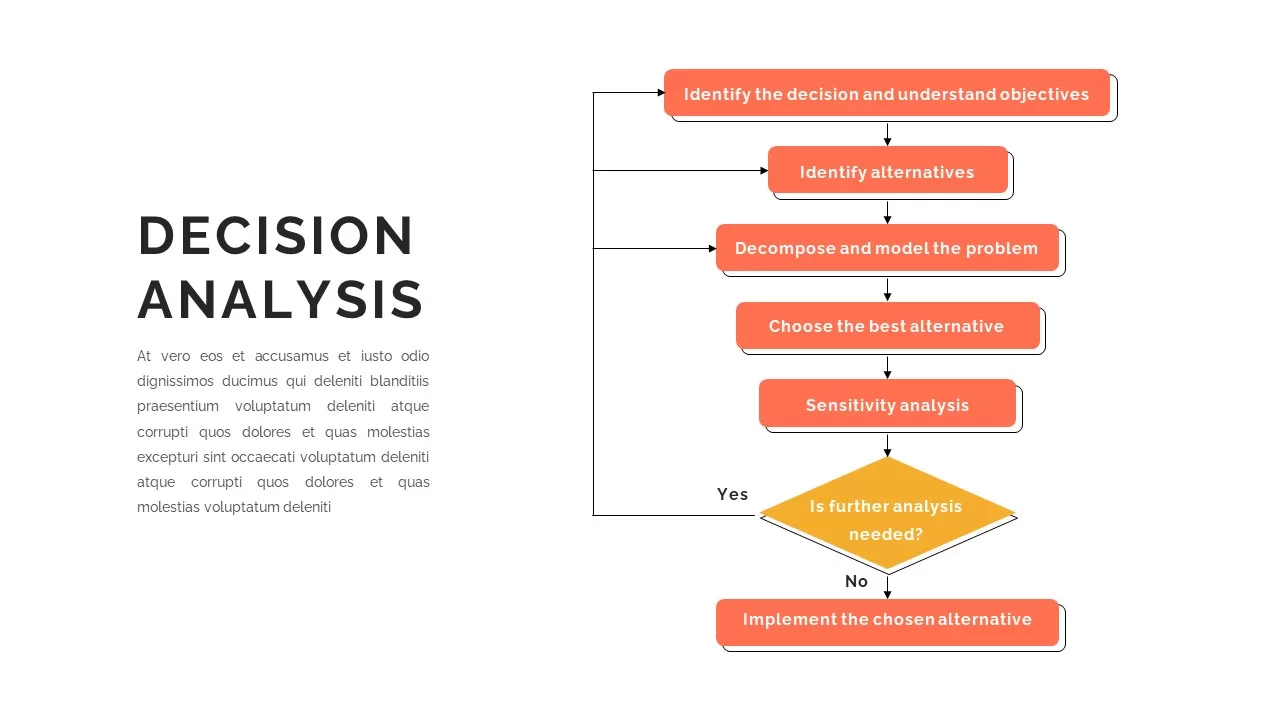
Decision Analysis Process Flowchart Template for PowerPoint & Google Slides
Flow Charts
SWOT Analysis Infographics PowerPoint Template
Business
SWOT Analysis Visual Overview template for PowerPoint & Google Slides
Business Strategy
SWOT Analysis template for PowerPoint & Google Slides
SWOT
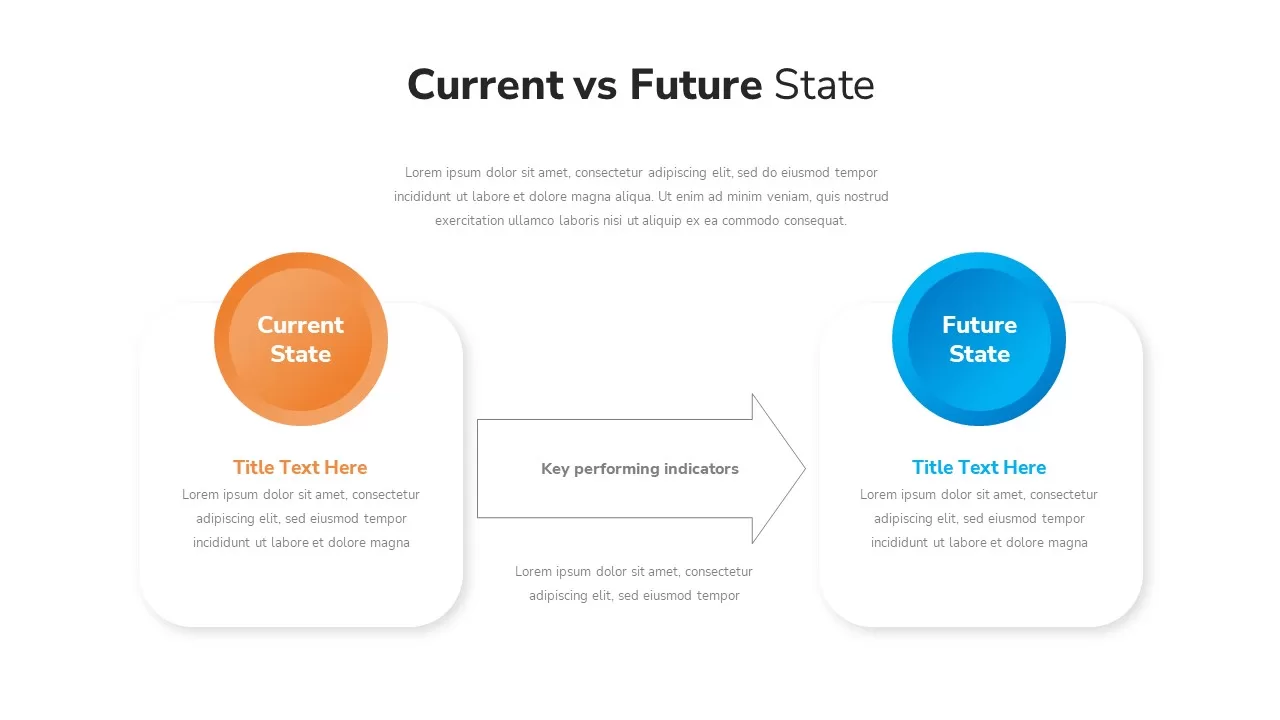
Current vs Future State Analysis template for PowerPoint & Google Slides
Comparison
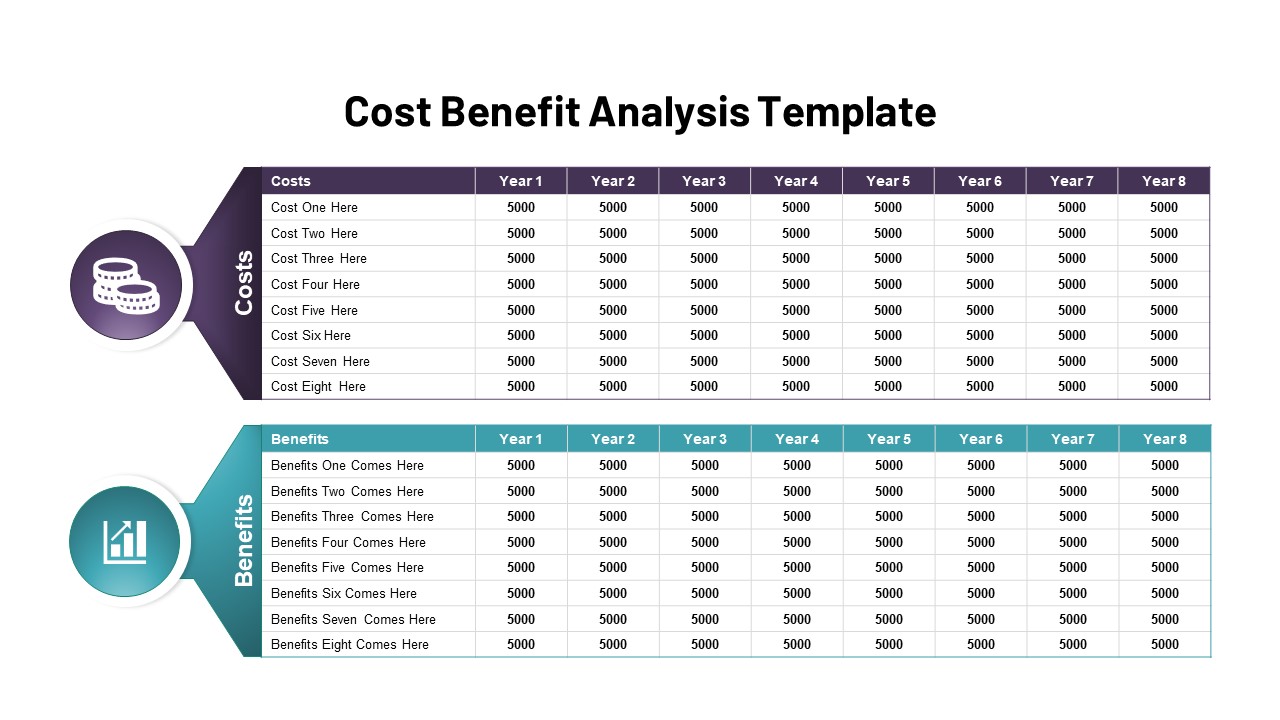
Cost Benefit Analysis Template PowerPoint and Google Slides
Comparison
Cost Benefit Analysis PowerPoint Template
Comparison
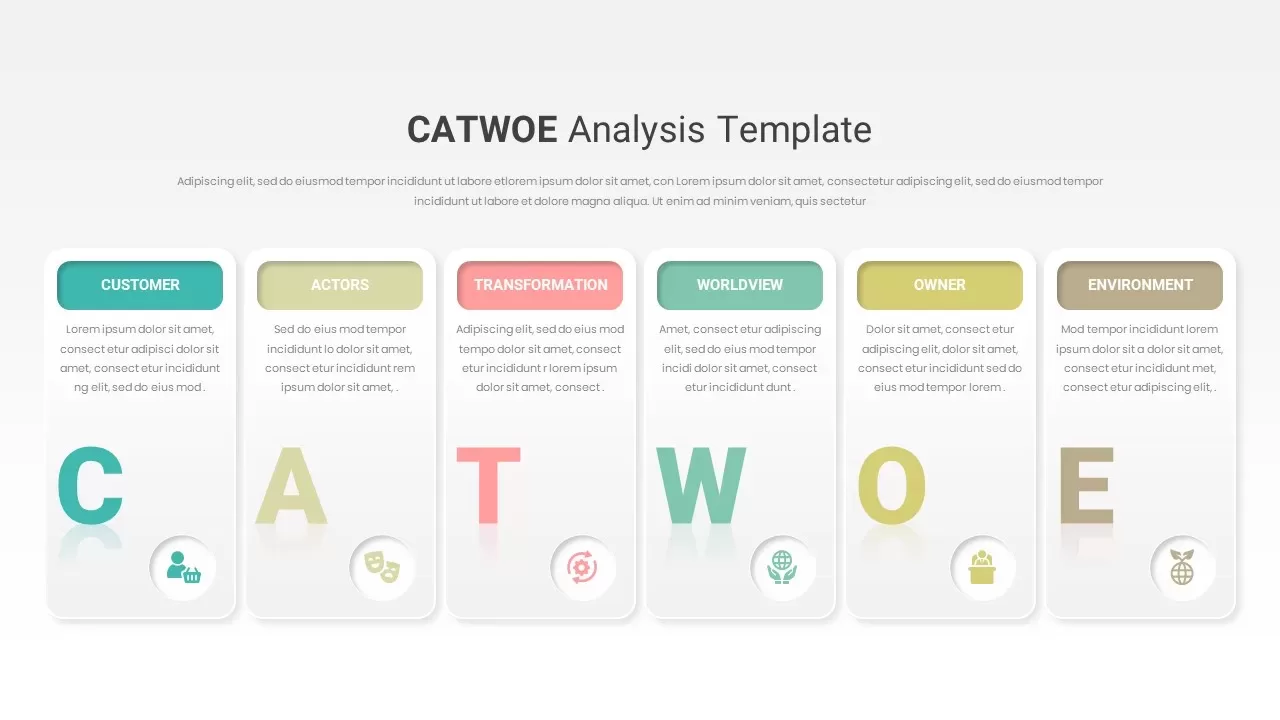
CATWOE Analysis Template for PowerPoint & Google Slides
Process
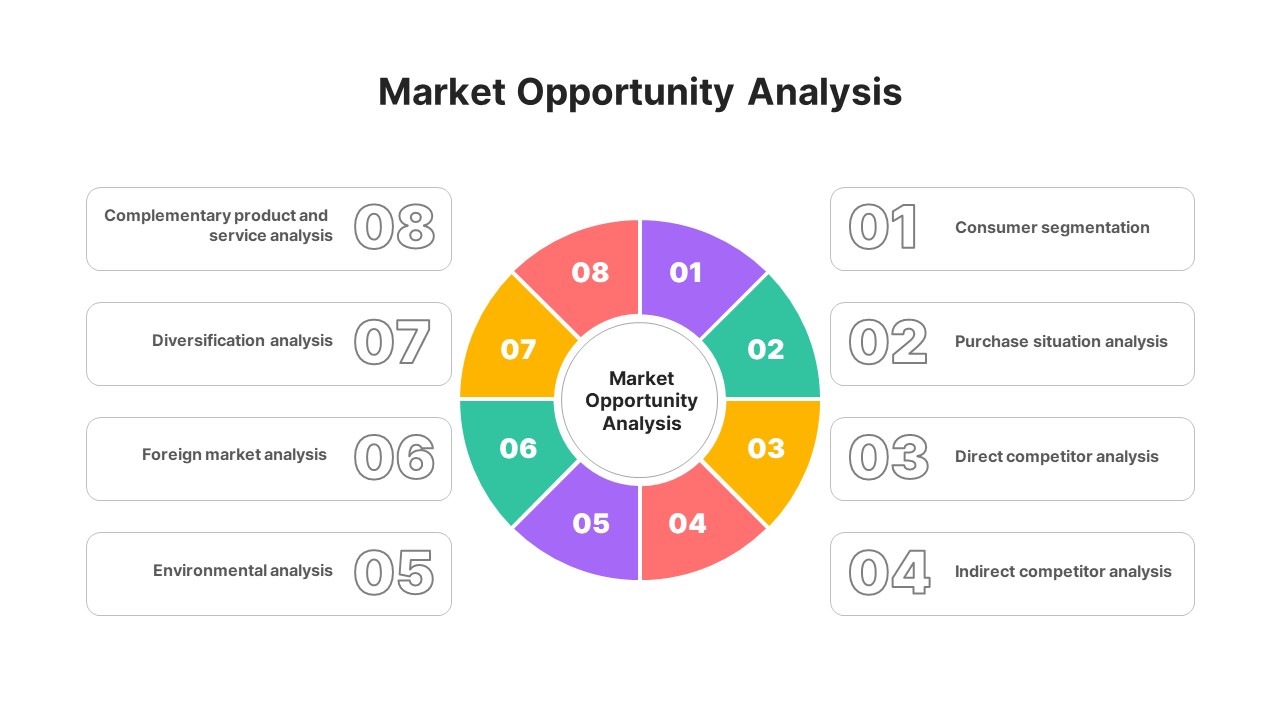
Market Opportunity Analysis Wheel template for PowerPoint & Google Slides
Business Strategy
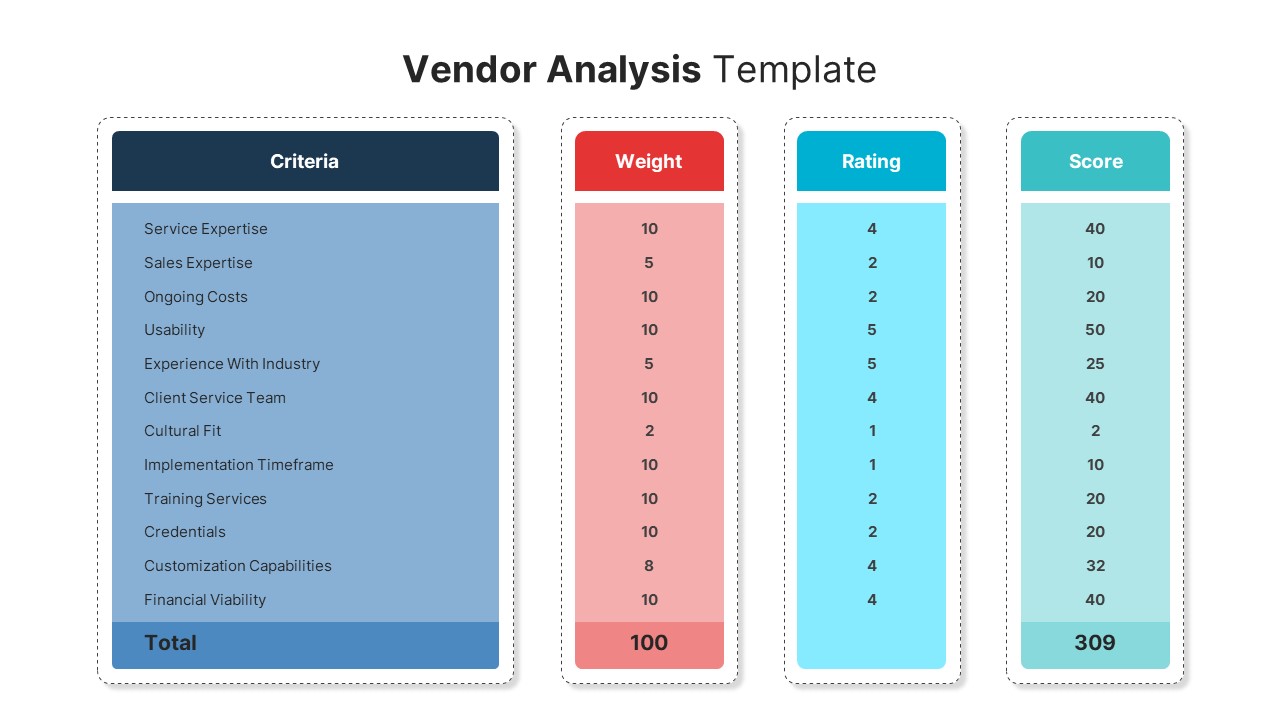
Vendor Analysis Criteria and Scoring template for PowerPoint & Google Slides
Business
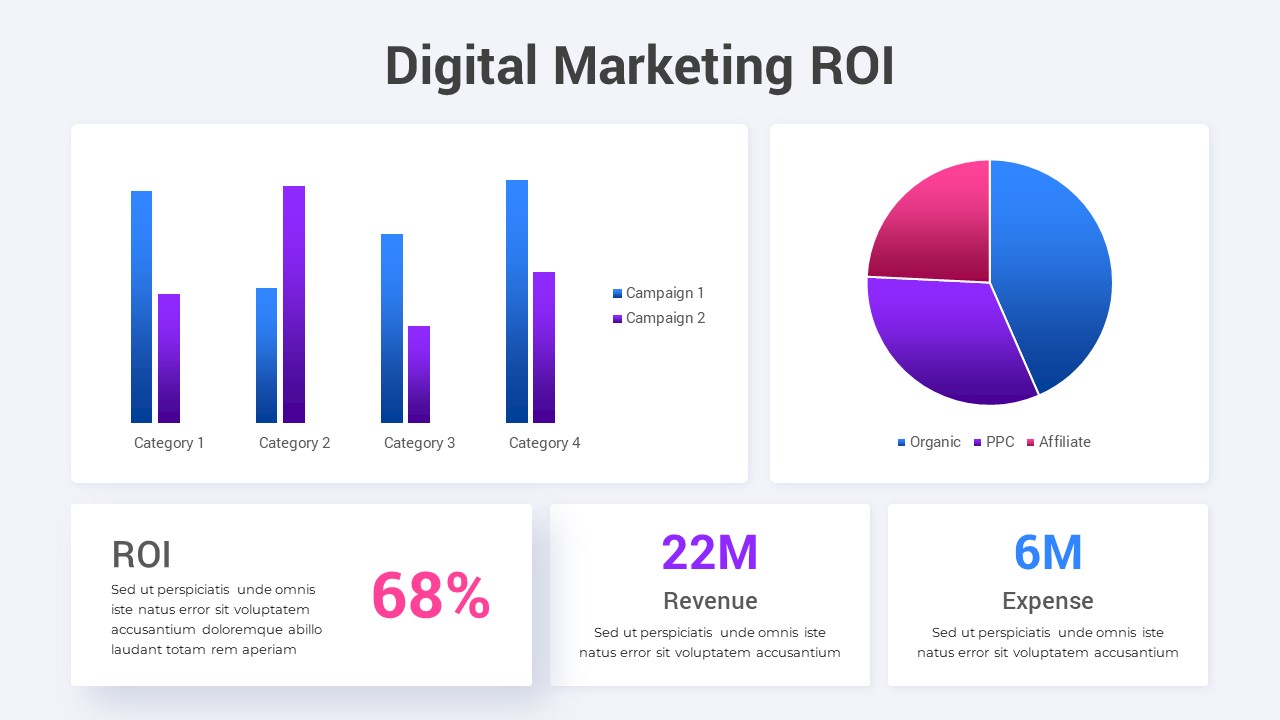
Digital Marketing ROI Analysis template for PowerPoint & Google Slides
Digital Marketing
Population Pyramid Chart Analysis Template for PowerPoint & Google Slides
Bar/Column
Waterfall Bar Chart Analysis Template for PowerPoint & Google Slides
Bar/Column
Four Quadrant Scatter Chart Powerpoint Template
Comparison Chart
Proportional Area Chart Analysis Template for PowerPoint & Google Slides
Comparison Chart
Free Stock Market PowerPoint Template
Pitch Deck
Free
Expanding Margins Analysis Bar Chart Template for PowerPoint & Google Slides
Charts
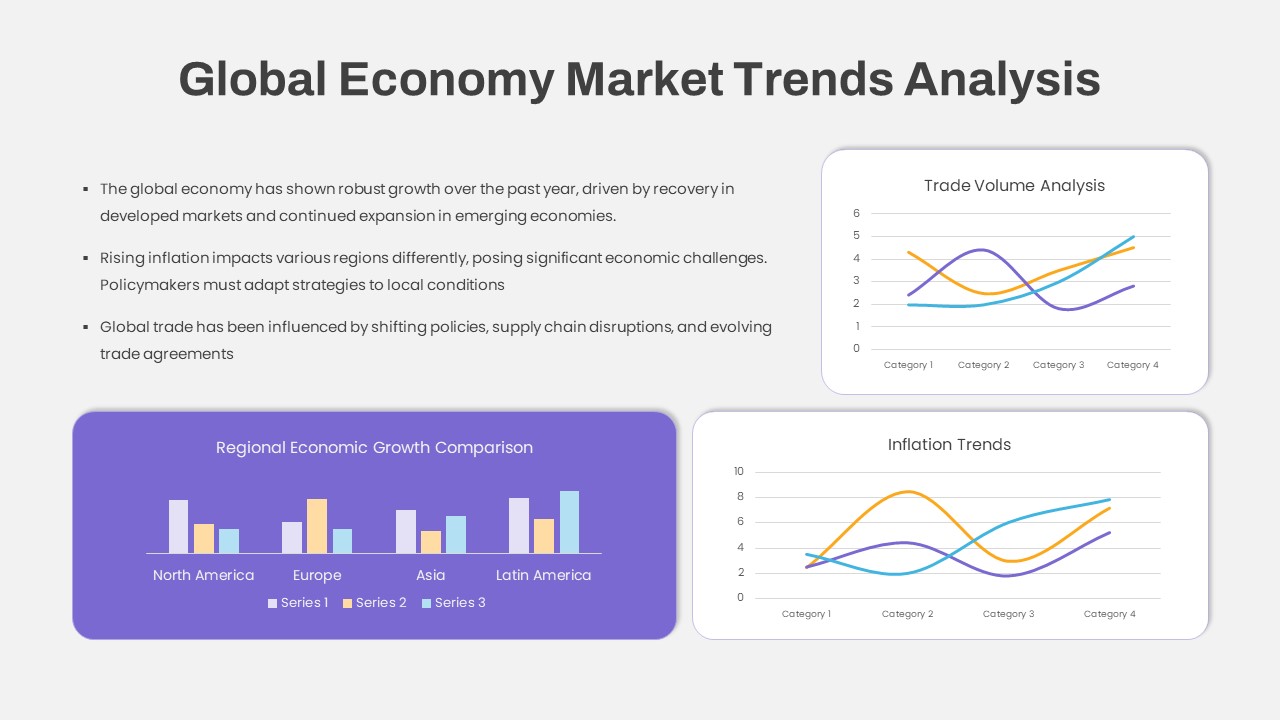
Global Economy Market Trends Analysis Template for PowerPoint & Google Slides
Comparison Chart
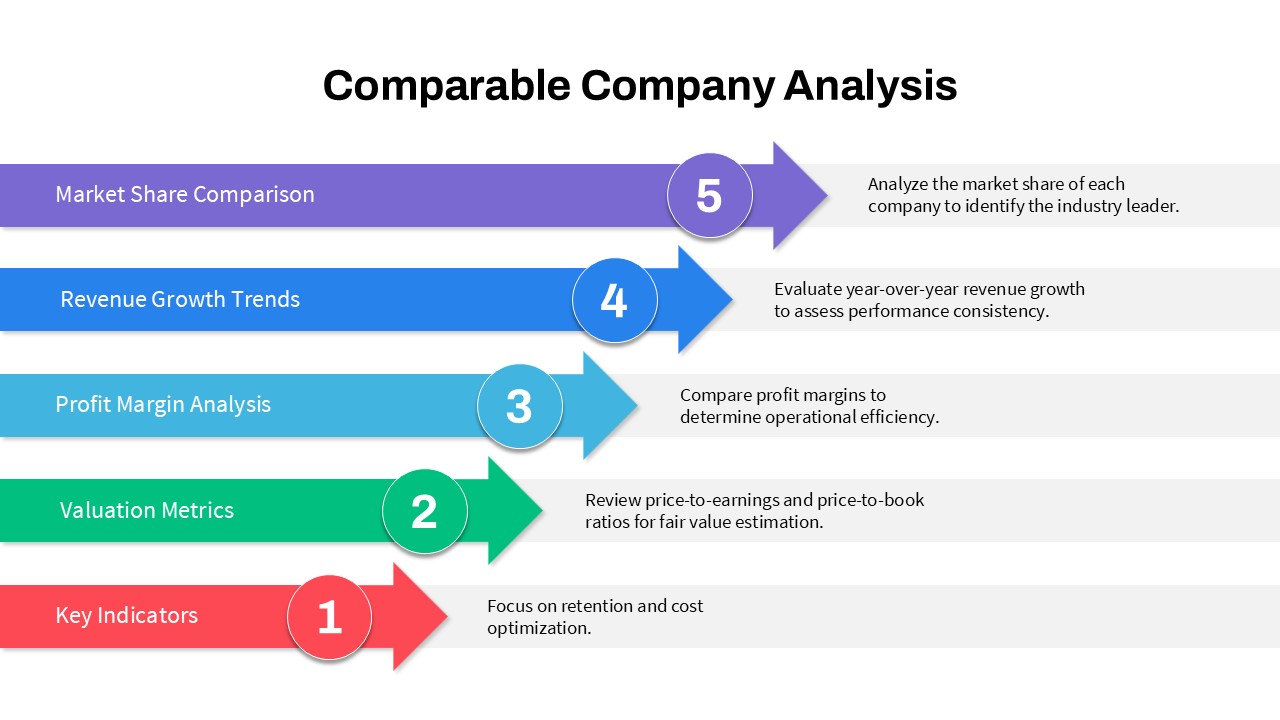
5-Step Comparable Company Analysis Template for PowerPoint & Google Slides
Arrow
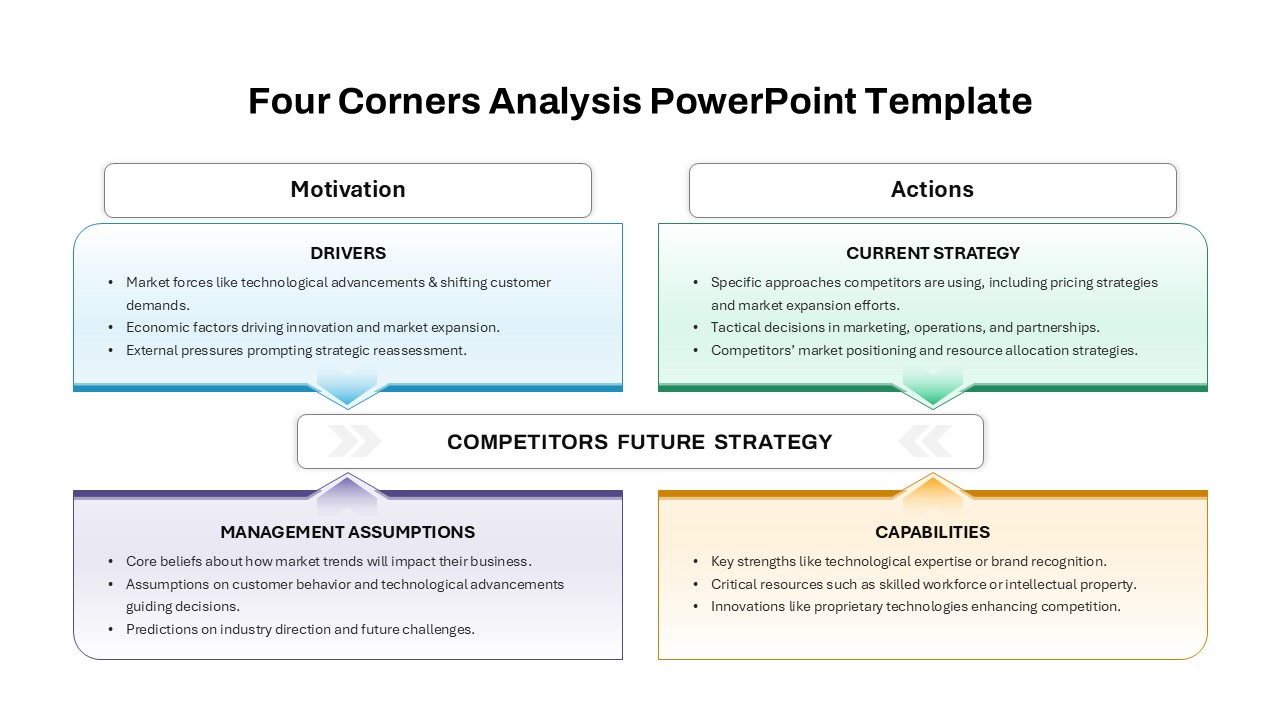
Four-Corners Strategic Analysis Quadrant Template for PowerPoint & Google Slides
SWOT
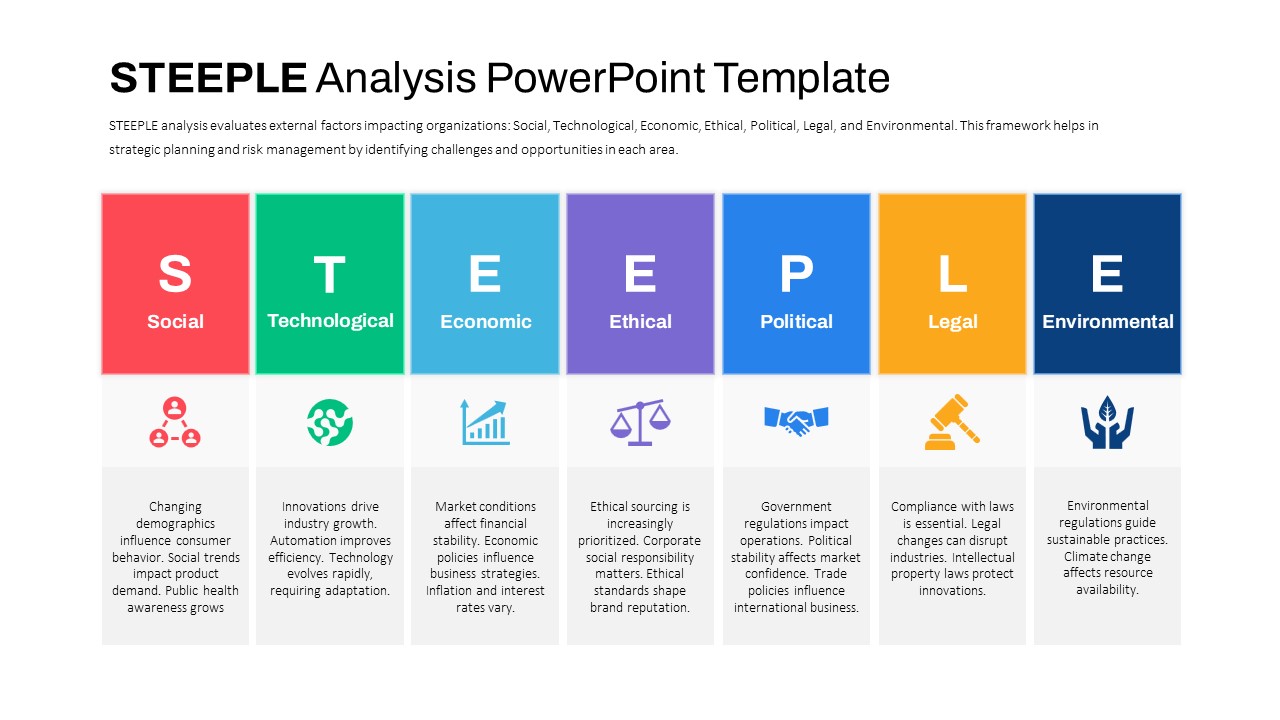
STEEPLE Analysis framework template for PowerPoint & Google Slides
Business Strategy
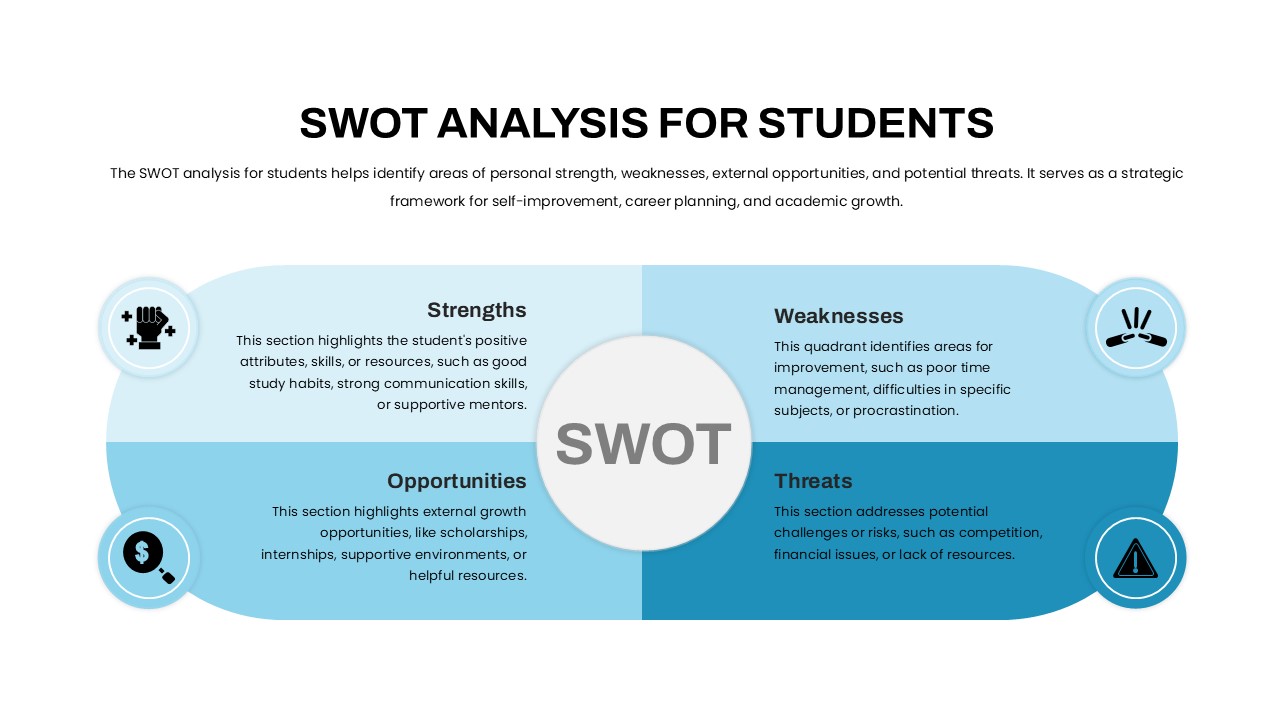
Student SWOT Analysis Framework Template for PowerPoint & Google Slides
SWOT
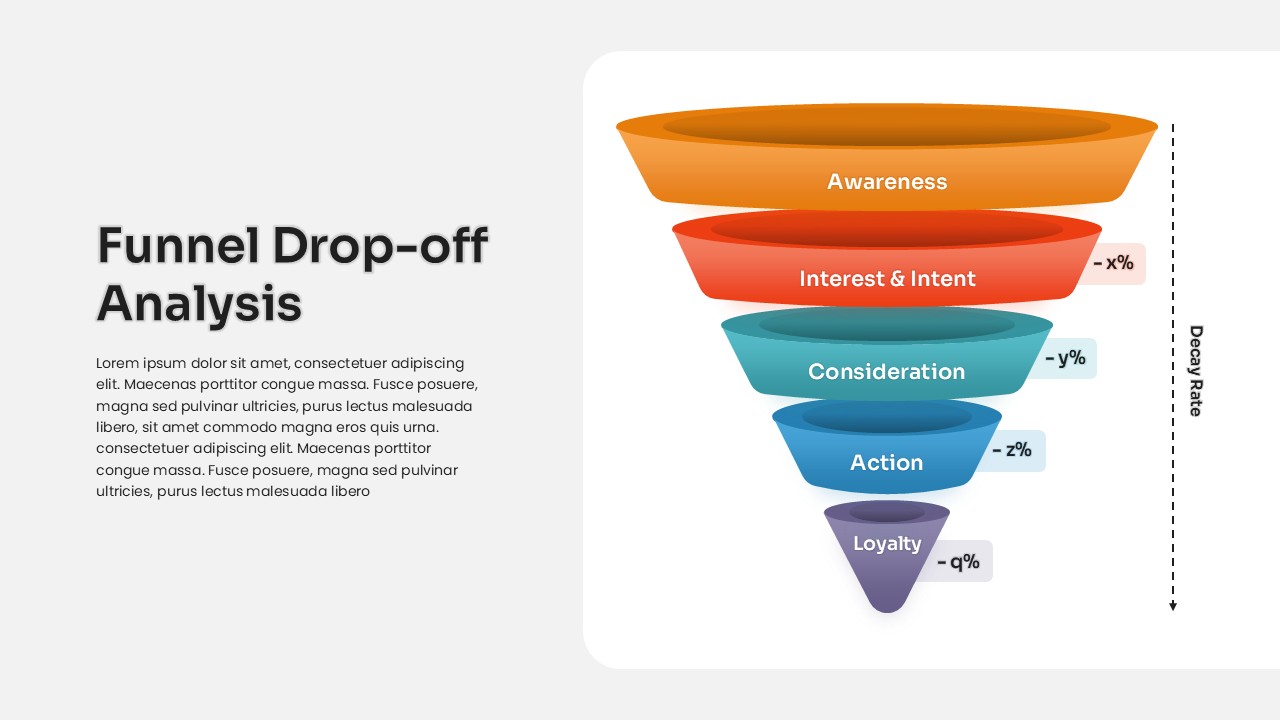
Funnel Drop-off Analysis template for PowerPoint & Google Slides
Business
Skills Gap Analysis Comparison Chart Template for PowerPoint & Google Slides
Gap
Category Analysis Comparison Infographic Template for PowerPoint & Google Slides
Comparison
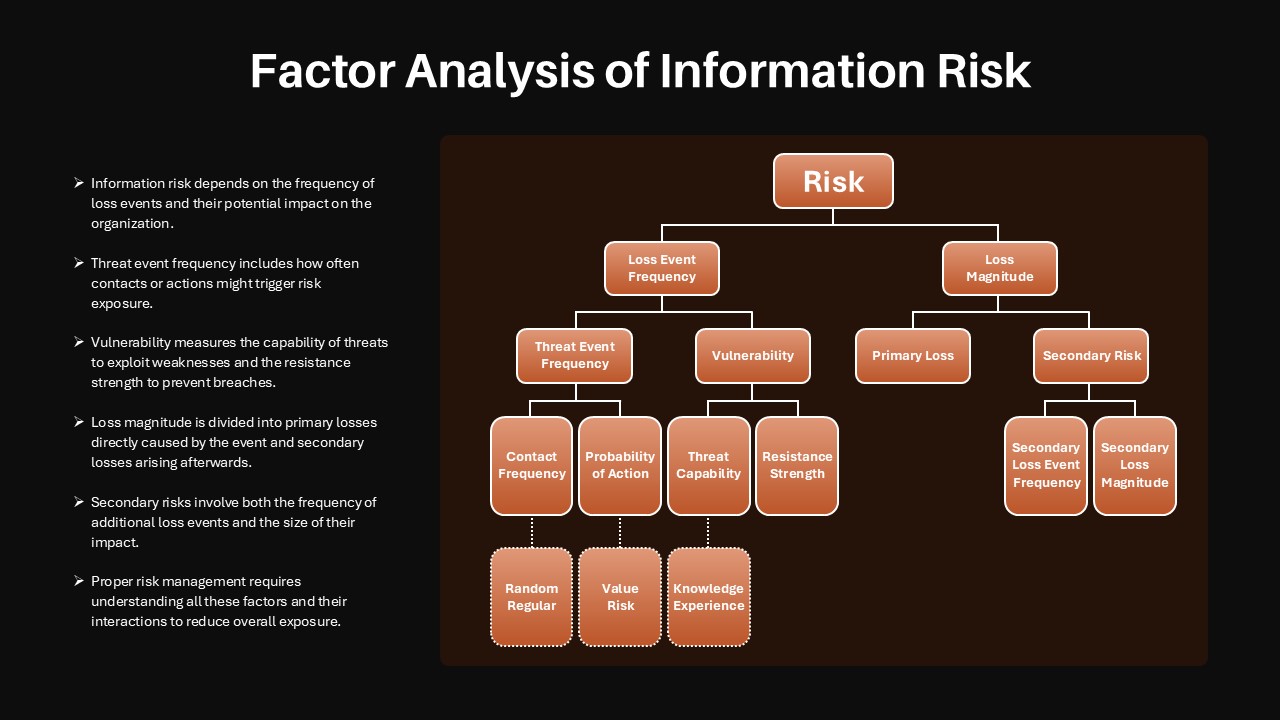
Factor Analysis of Information Risk Template for PowerPoint & Google Slides
Risk Management
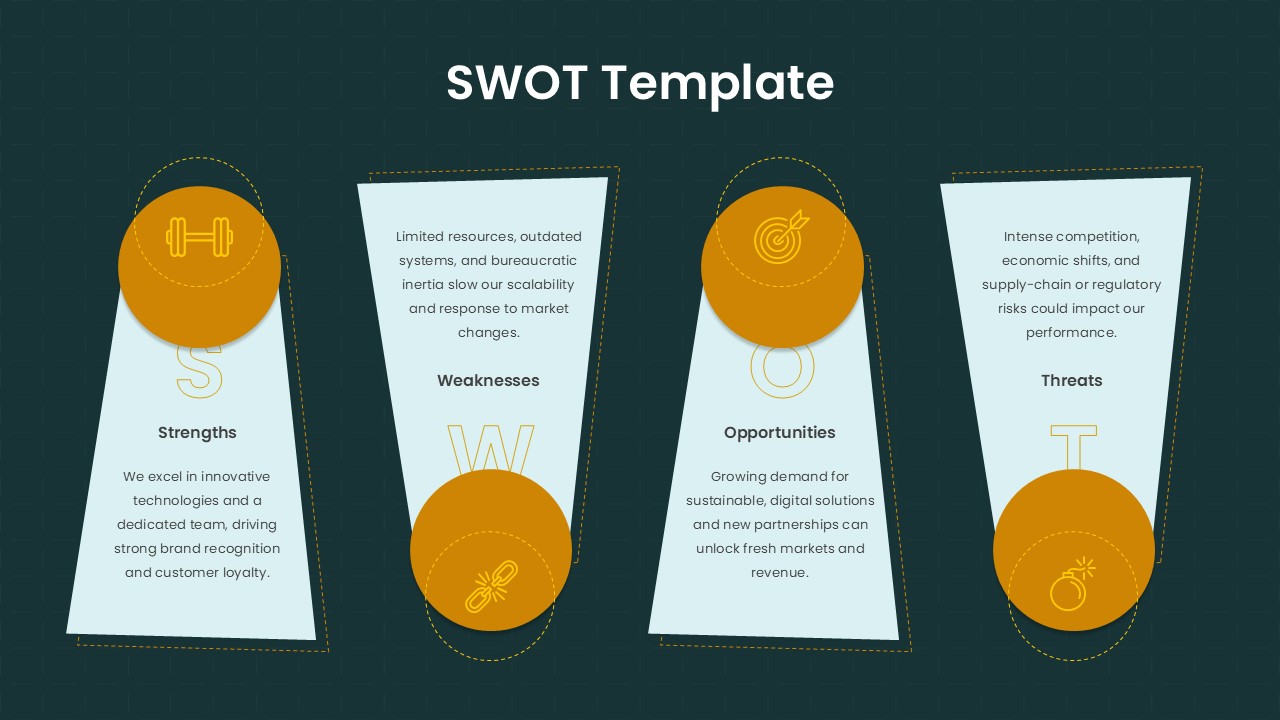
Trapezoid SWOT Analysis Template for PowerPoint & Google Slides
SWOT
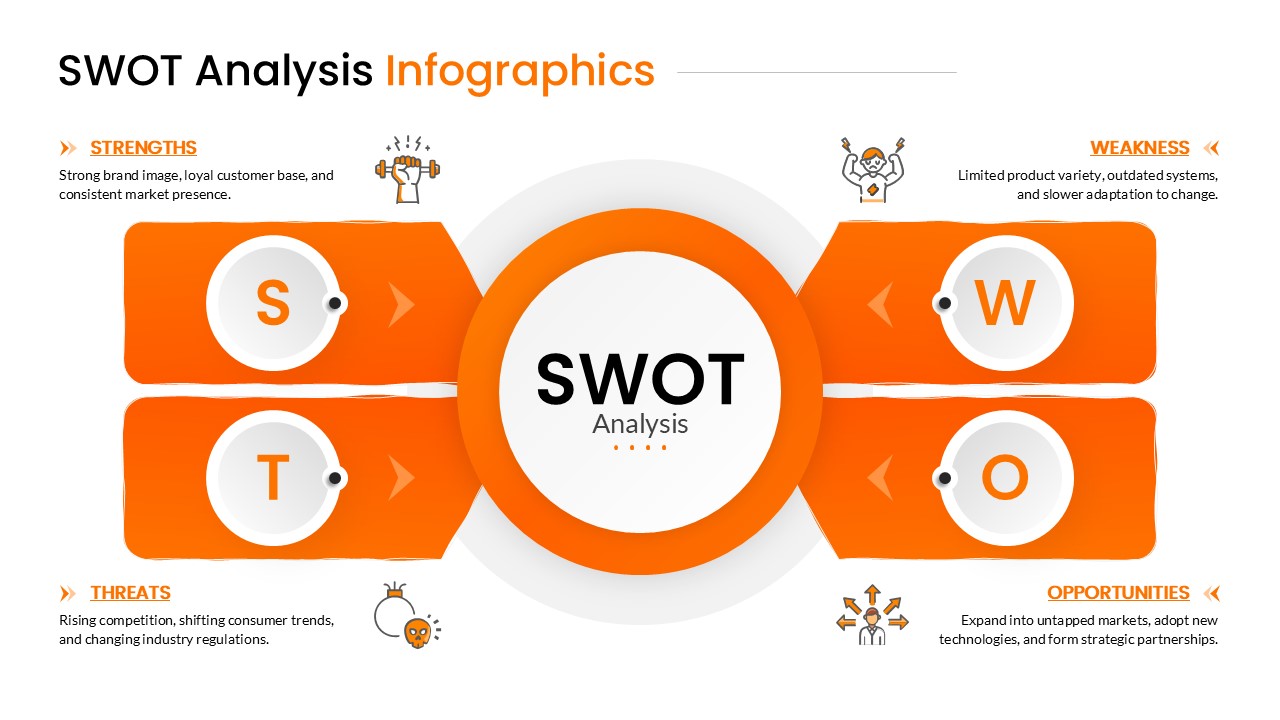
Orange SWOT Analysis Infographic Template for PowerPoint & Google Slides
SWOT
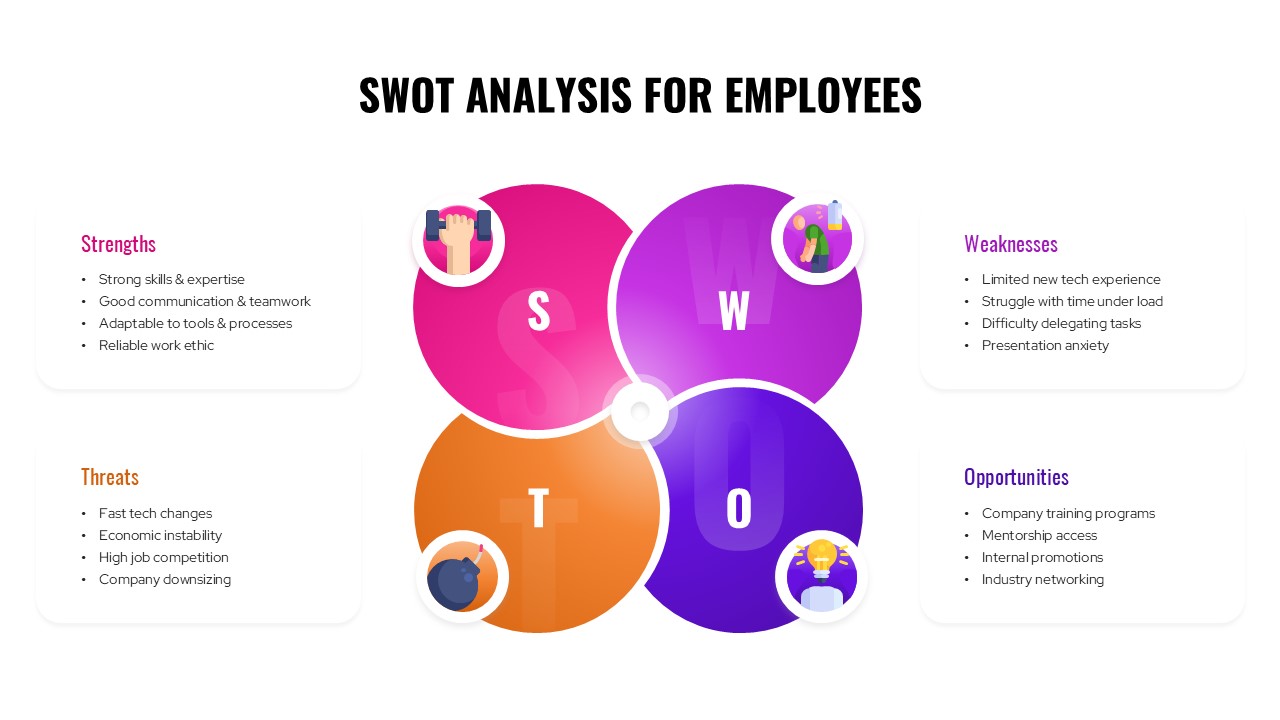
SWOT Analysis For Employees Template for PowerPoint & Google Slides
SWOT
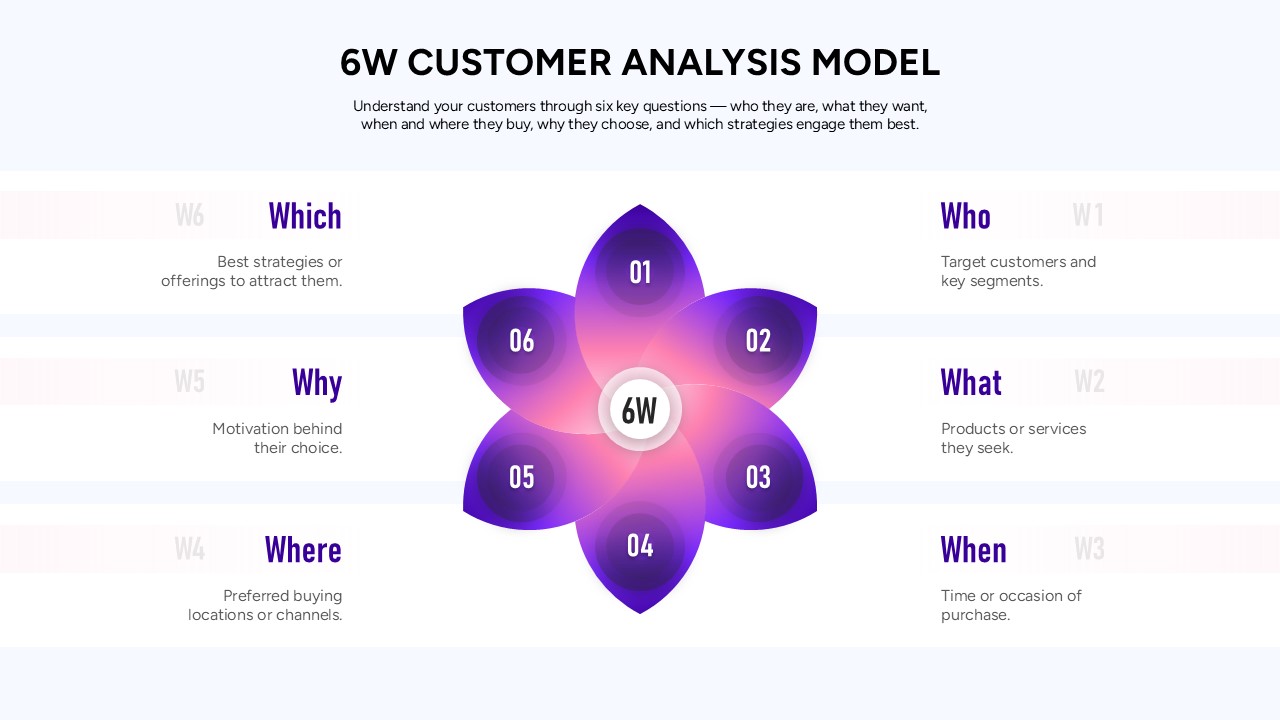
6W Customer Analysis Model Template for PowerPoint & Google Slides
Customer Experience
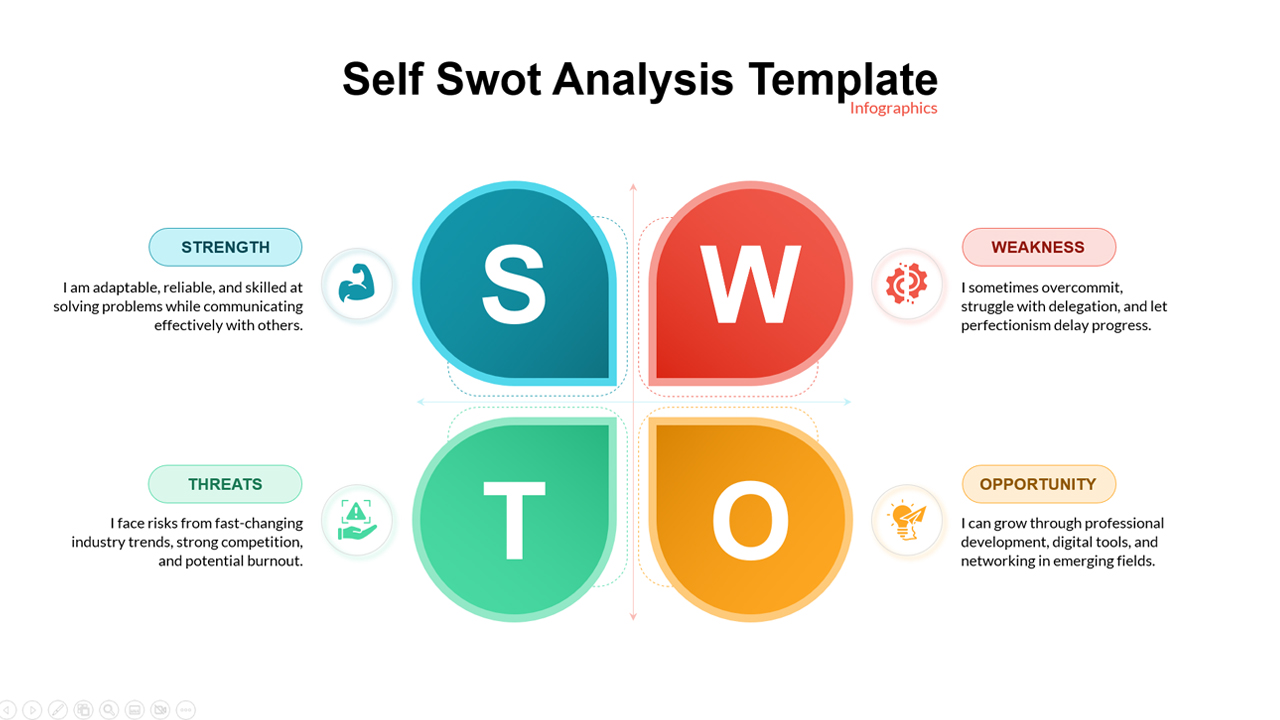
Self SWOT Analysis Template for PowerPoint & Google Slides
SWOT
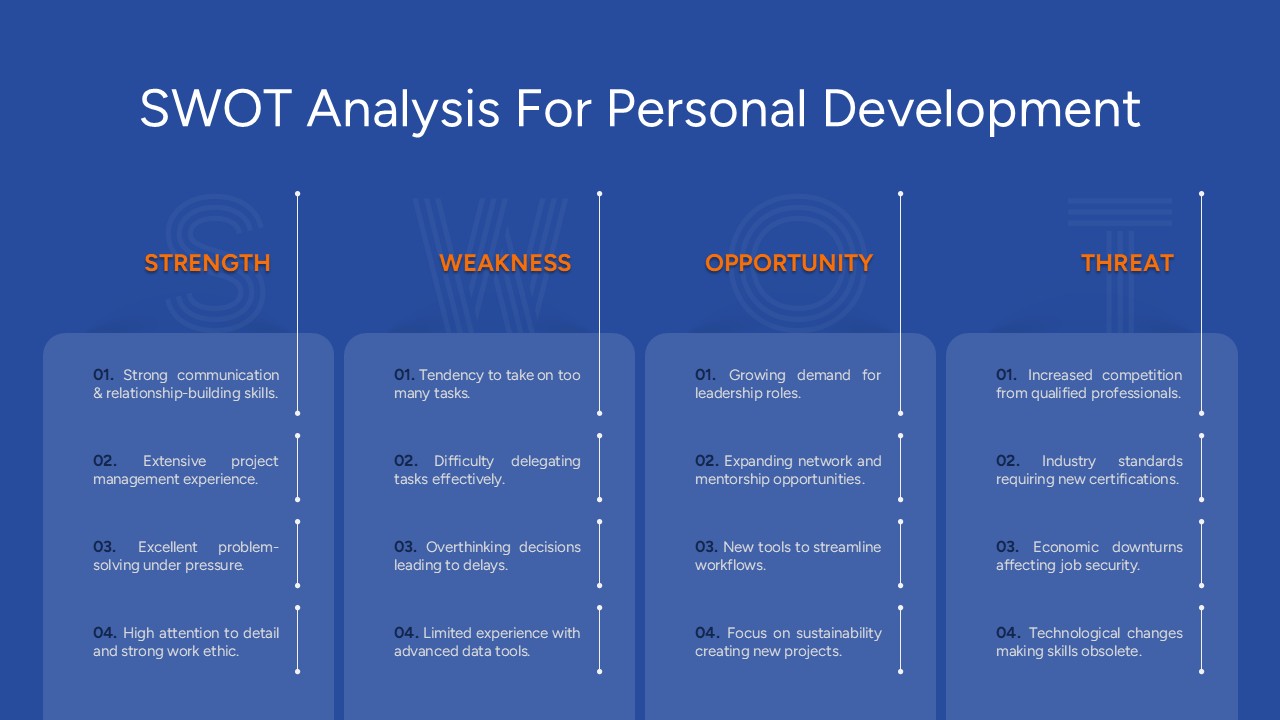
Free SWOT Analysis for Personal Development Template for PowerPoint & Google Slides
SWOT
Free
Financial Gap Analysis Framework Template for PowerPoint & Google Slides
Finance
IT Gap Analysis Assessment Matrix Template for PowerPoint & Google Slides
Information Technology