Fishbone (Ishikawa) Diagram for PowerPoint & Google Slides
Description
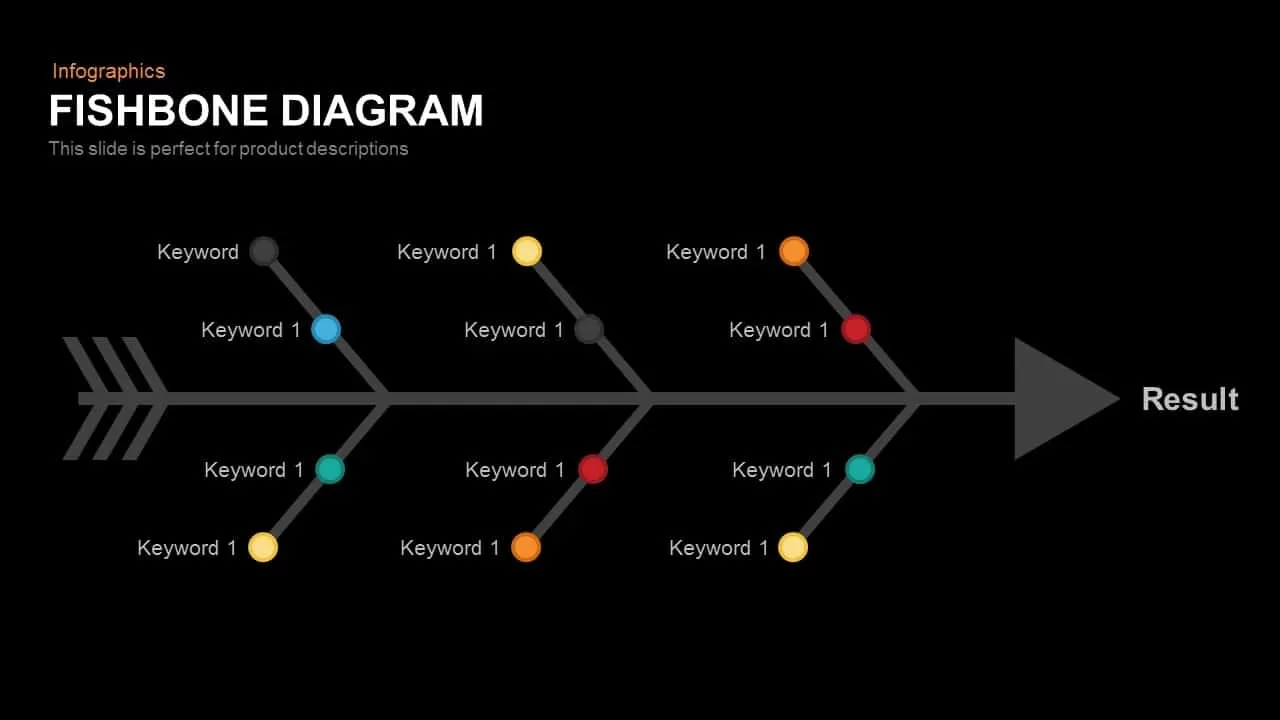
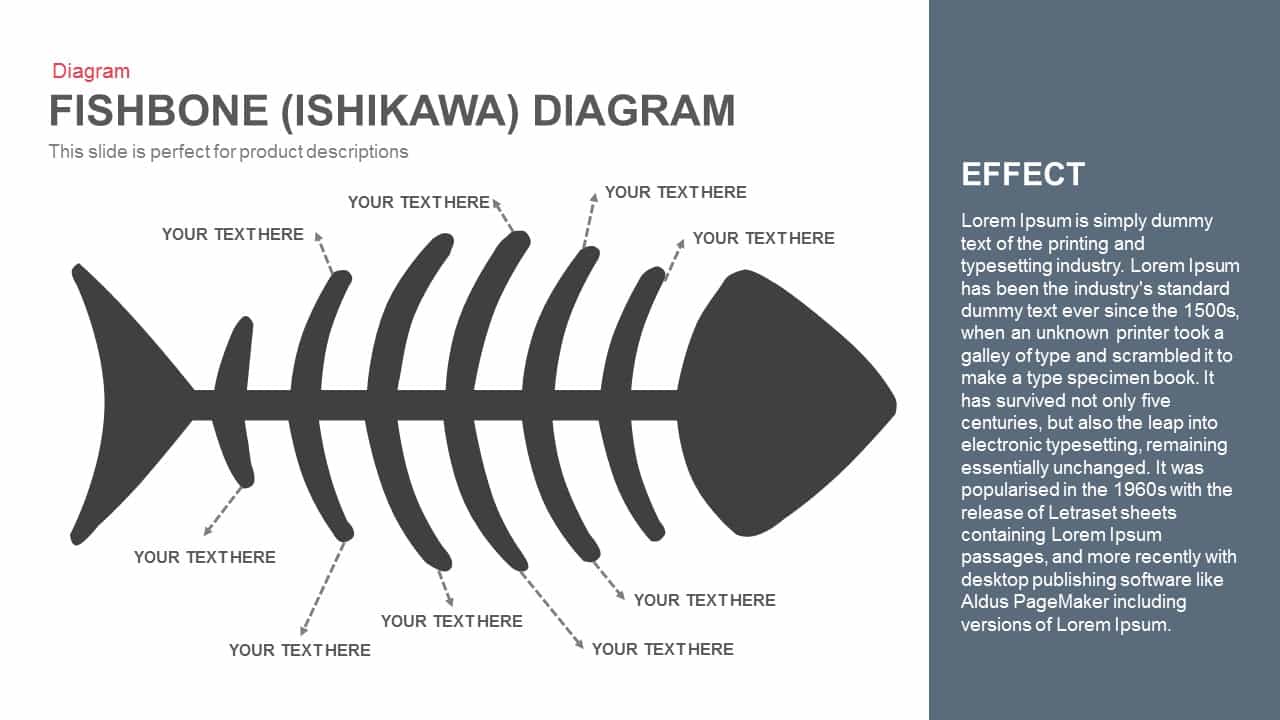
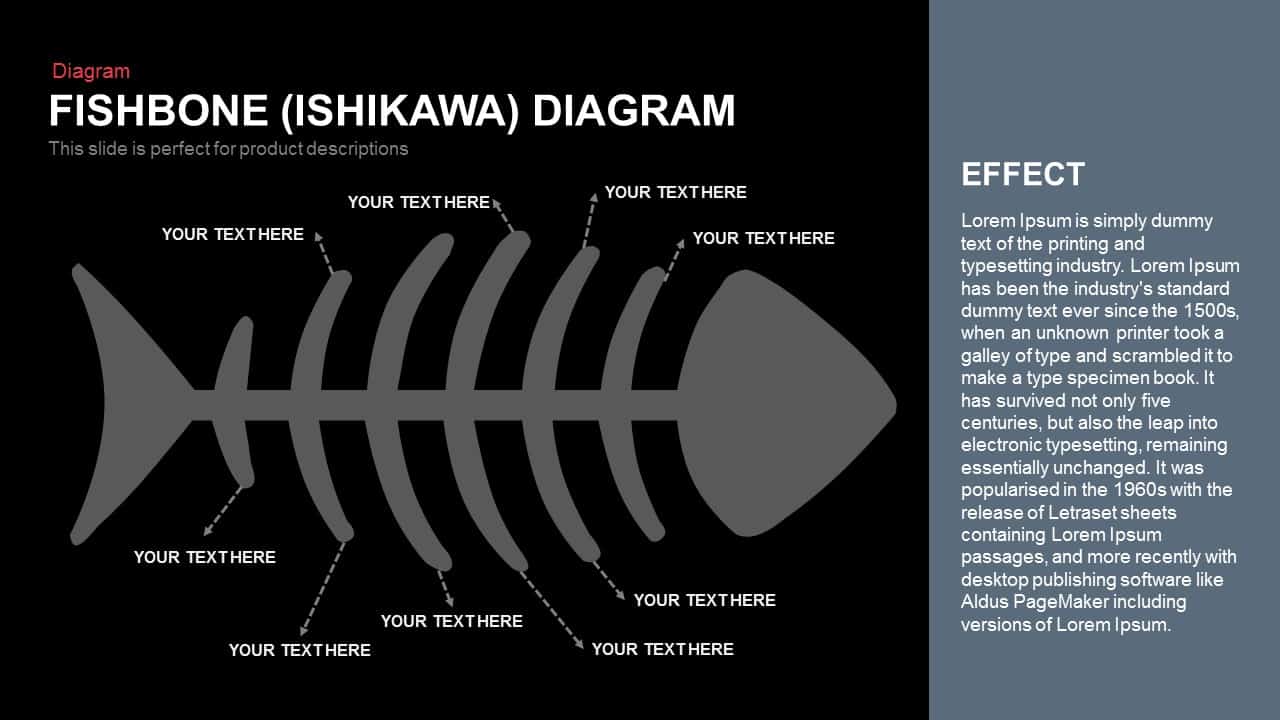
The Fishbone (Ishikawa) Diagram is a powerful tool for identifying and analyzing the root causes of a problem. This slide layout features a central “spine” with branching “bones” representing different categories or factors that contribute to the issue being examined. Each bone is customizable to show specific causes, such as people, processes, materials, or environment. This type of diagram is ideal for brainstorming sessions, root cause analysis, and continuous improvement efforts. The clean design and clear structure allow for easy customization, ensuring your content is presented in a visually appealing and accessible way.
Who is it for
This diagram is perfect for business analysts, project managers, quality control teams, and problem-solving groups who need to visually represent the causes of an issue. It is especially useful for teams conducting root cause analysis in manufacturing, service industries, or project management. It also benefits educators and students who are learning or teaching problem-solving techniques.
Other Uses
Beyond root cause analysis, this diagram can be adapted for various other purposes. It can be used in strategic planning, process analysis, risk assessment, and operational reviews to visually dissect a complex problem into manageable components. Additionally, it can be used to break down multiple factors or categories affecting an outcome, helping teams prioritize issues to address.
Login to download this file

Item ID
SB00383
Related Templates

Three-Section Fishbone Process Diagram template for PowerPoint & Google Slides
Process
Fishbone RCA Diagram Template for PowerPoint & Google Slides
Business Strategy
Fishbone Diagram Overview template for PowerPoint & Google Slides
Infographics
Fishbone Diagram Cause-and-Effect Template for PowerPoint & Google Slides
Process
Free Fishbone Diagram PowerPoint Template
Project
Free
Cause and Effect Diagram Template for PowerPoint and Google Slide
Process
Fishbone Diagram Analysis Template for PowerPoint & Google Slides
Flow Charts
Fishbone Cause Analysis Diagram Template for PowerPoint & Google Slides
Process
Underwater Fishbone Cause-Effect Diagram Template for PowerPoint & Google Slides
Process
Fishbone Process Diagram template for PowerPoint & Google Slides
Infographics
Free Root Cause Analysis PowerPoint Template
Process
Free
5 Why Fishbone Diagram for Root Cause Analysis in PowerPoint & Google Slides
Process
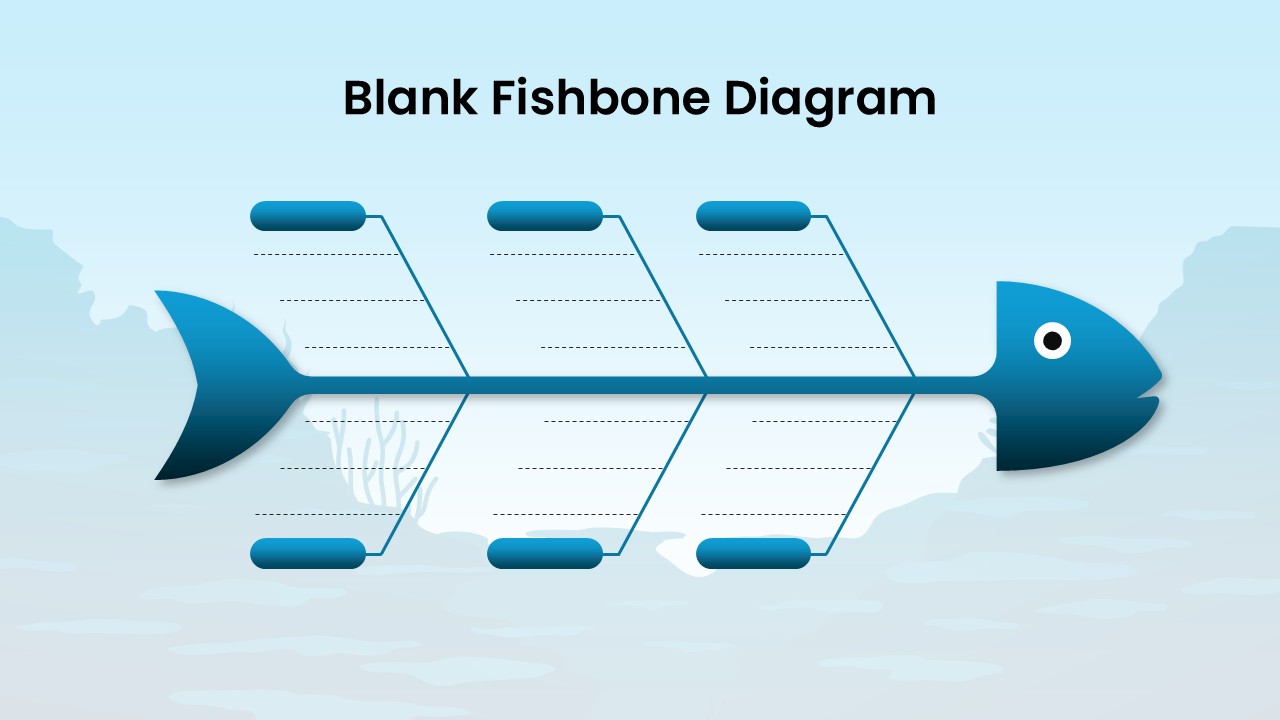
Blank Fishbone Diagram Template for PowerPoint & Google Slides
Process
Fishbone Cause and Effect Infographic Template for PowerPoint & Google Slides
Infographics
Fishbone Timeline Template
Manufacturing
Snake Diagram PowerPoint Template and Google Slide Template
Process
Gear Process Diagram PowerPoint Template for PowerPoint & Google Slides
Process
Sales Process Workflow Funnel Diagram PowerPoint Template for PowerPoint & Google Slides
Funnel
Puzzle Diagram PowerPoint Template for PowerPoint & Google Slides
Process
Transportation Logistics PowerPoint Diagram template for PowerPoint & Google Slides
Process
Emoji Scale PowerPoint Diagram for PowerPoint & Google Slides
Infographics
4 Step Problem Solving PowerPoint Diagram for PowerPoint & Google Slides
Process
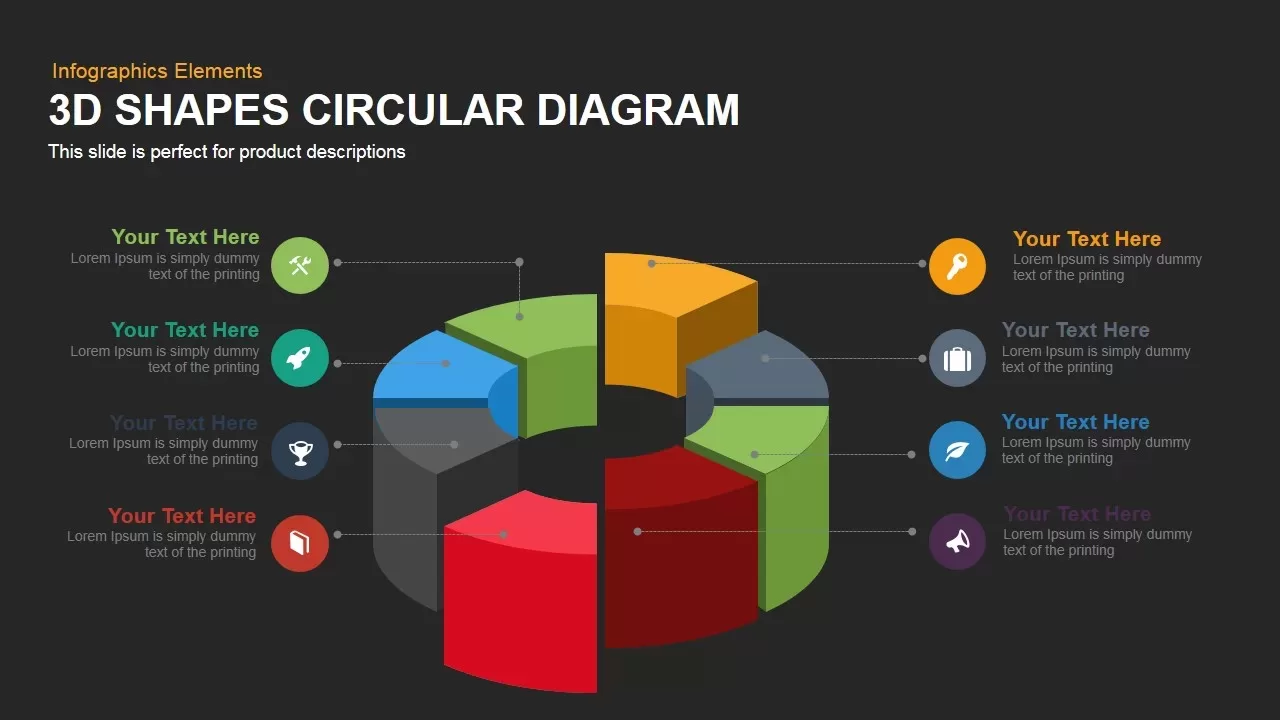
3D Circular Diagram template for PowerPoint & Google Slides
Circular
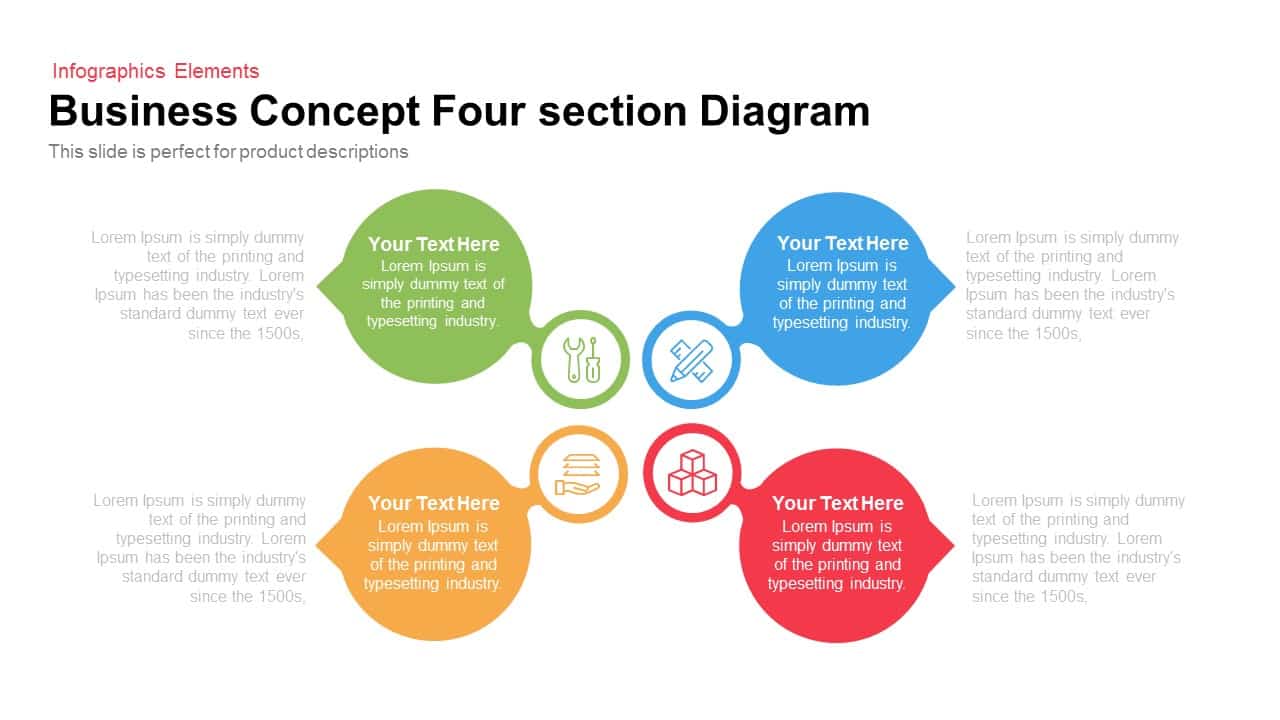
Business Concept 4 section Diagram template for PowerPoint & Google Slides
Infographics
Modern Nine Circle Network Diagram Template for PowerPoint & Google Slides
Circular
6-Step Arrow Process Diagram Template for PowerPoint & Google Slides
Process
Ribbon Diagram Flow template for PowerPoint & Google Slides
Process
Colorful Decision Tree Diagram template for PowerPoint & Google Slides
Decision Tree

Technology Cluster Diagram for PowerPoint & Google Slides
Infographics
Bulb Puzzle Diagram template for PowerPoint & Google Slides
Process
Multi-layout Circle Spoke Diagram Template for PowerPoint & Google Slides
Circular
Roadmap Six-Step Process Diagram Template for PowerPoint & Google Slides
Roadmap
Editable Force Field Analysis Diagram Template for PowerPoint & Google Slides
Business Plan
Colorful Modern CRM Gear Diagram Template for PowerPoint & Google Slides
Customer Experience
Traffic Cone Funnel Diagram Slide Template for PowerPoint & Google Slides
Funnel

Operation Process Metaphor Diagram Template for PowerPoint & Google Slides
Process
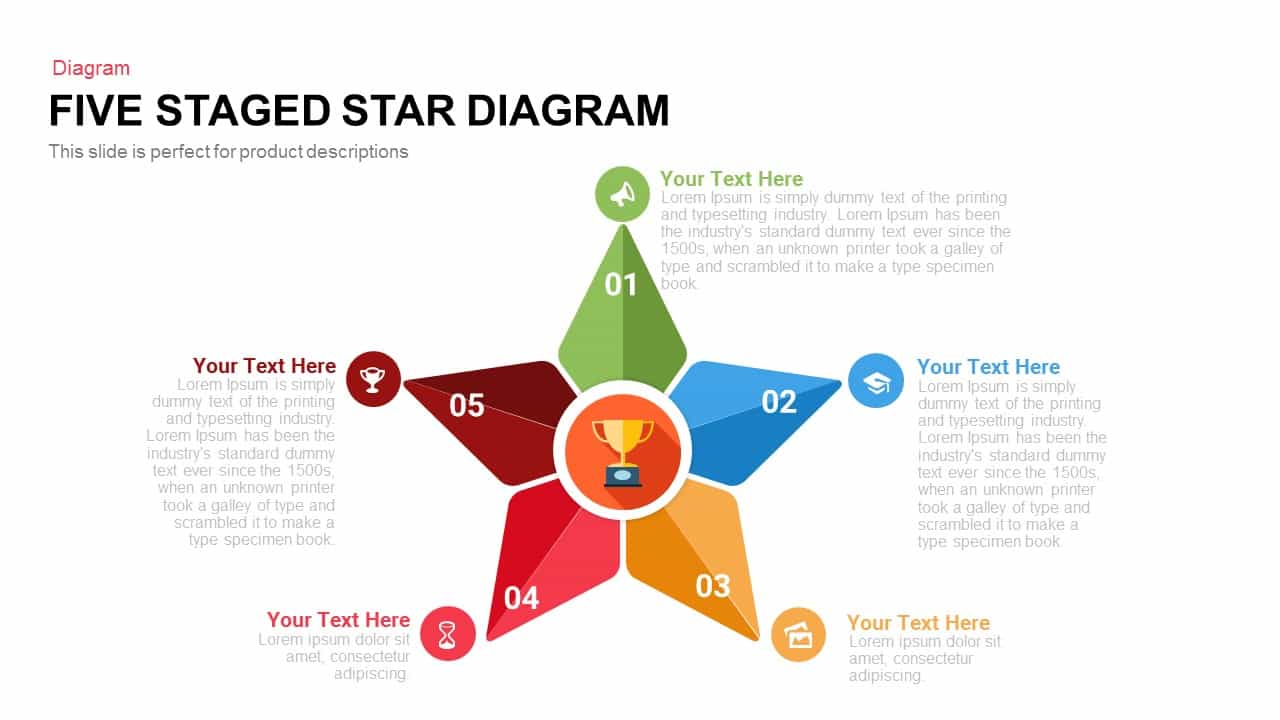
Five-Stage Star Diagram for Milestones Template for PowerPoint & Google Slides
Process
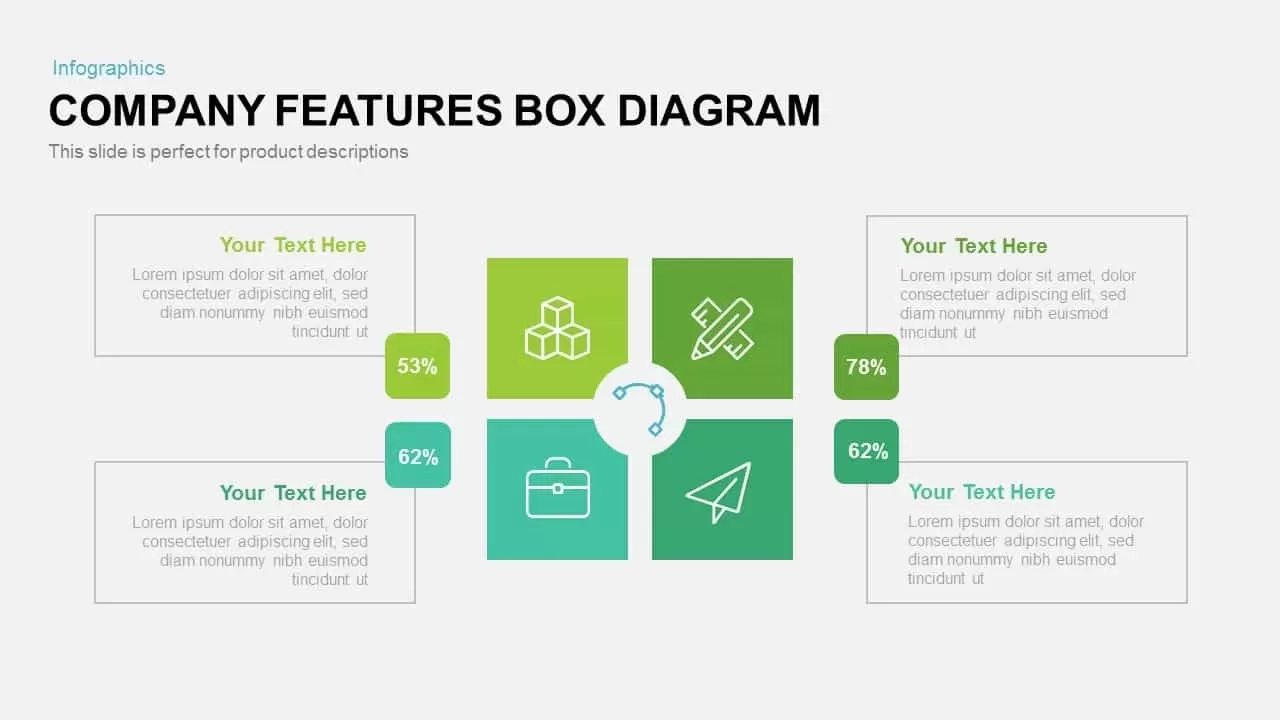
Custom Company Features Box Diagram Template for PowerPoint & Google Slides
Comparison
Gear Pie Diagram Data Visualization Template for PowerPoint & Google Slides
Pie/Donut
Four-Circle Hub and Spoke Diagram Template for PowerPoint & Google Slides
Process
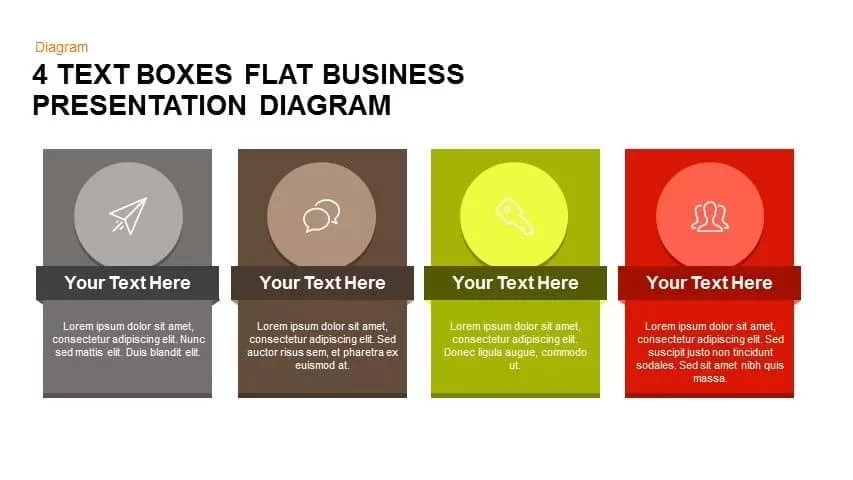
Flat Four-Box Business Layout Diagram Template for PowerPoint & Google Slides
Process
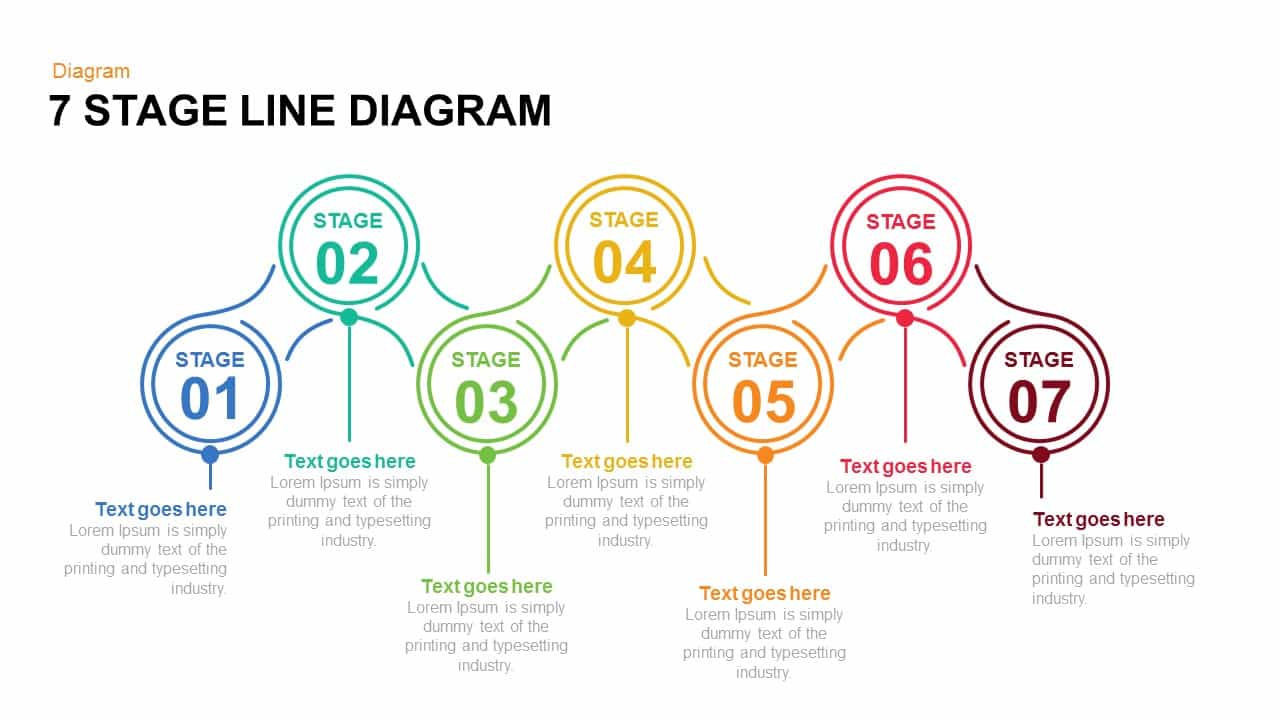
7 and 6 Stage Line Diagram Overview for PowerPoint & Google Slides
Infographics
8 Steps Arrow Process Diagram Template
Process
Arrow Process Diagram for PowerPoint & Google Slides
Process

Elegant Process Support Arrow Diagram Template for PowerPoint & Google Slides
Arrow

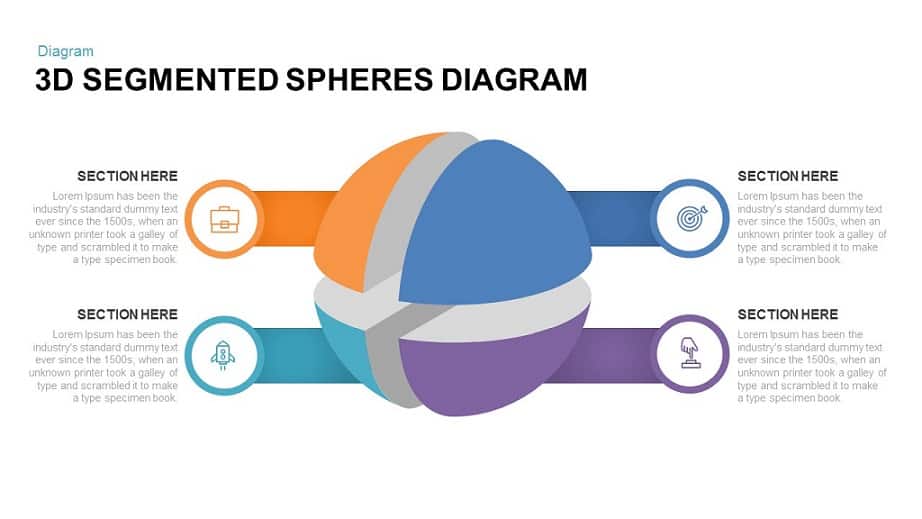
3D Segmented Spheres Diagram template for PowerPoint & Google Slides
Infographics
Six-Step Two-Sided Arrow Diagram Template for PowerPoint & Google Slides
Process

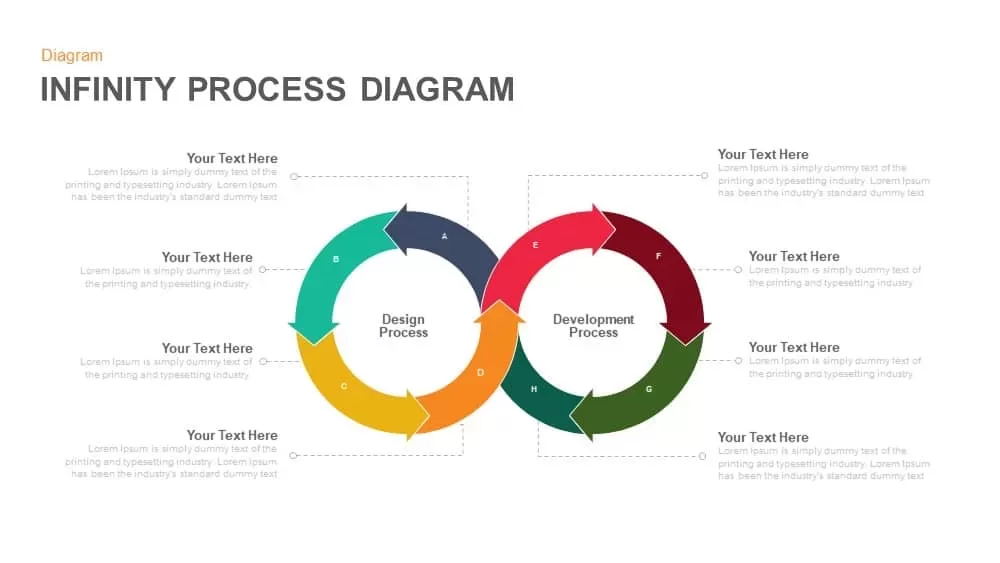
Infinity Process Diagram Template for PowerPoint & Google Slides
Process
PEST Analysis Circular Diagram Template for PowerPoint & Google Slides
PEST
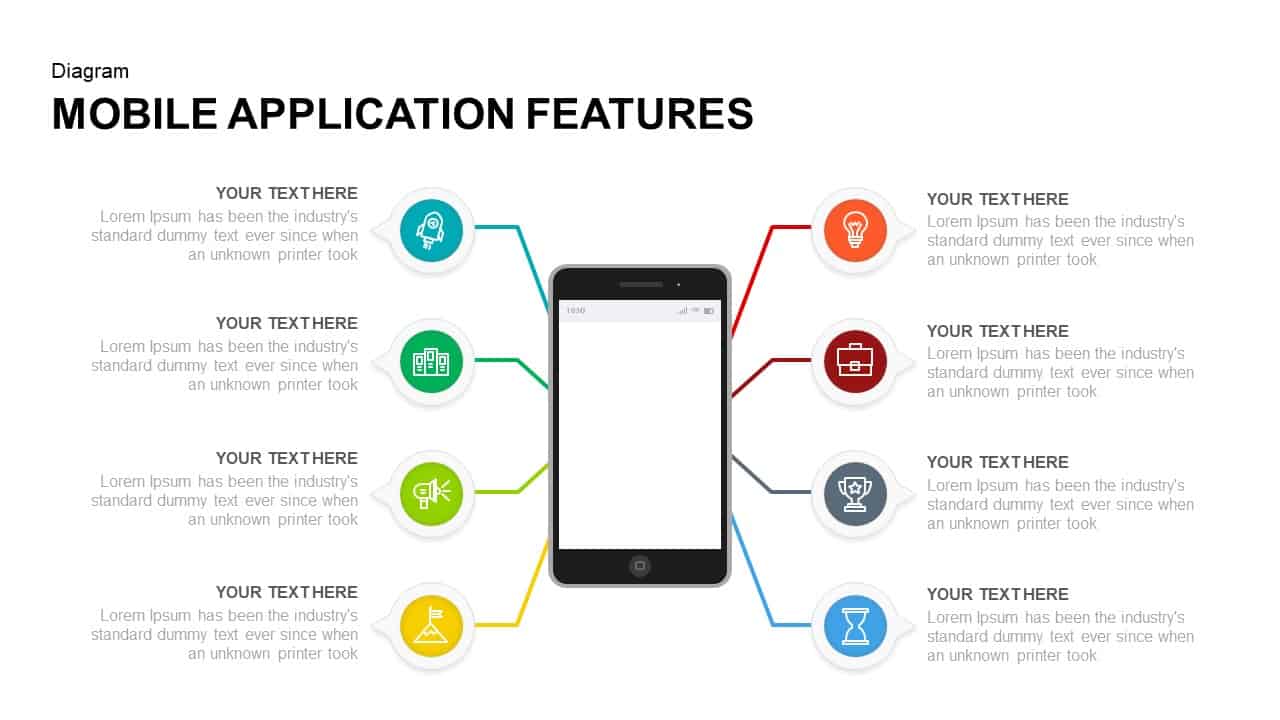
Mobile Application Features Presentation Template
Technology
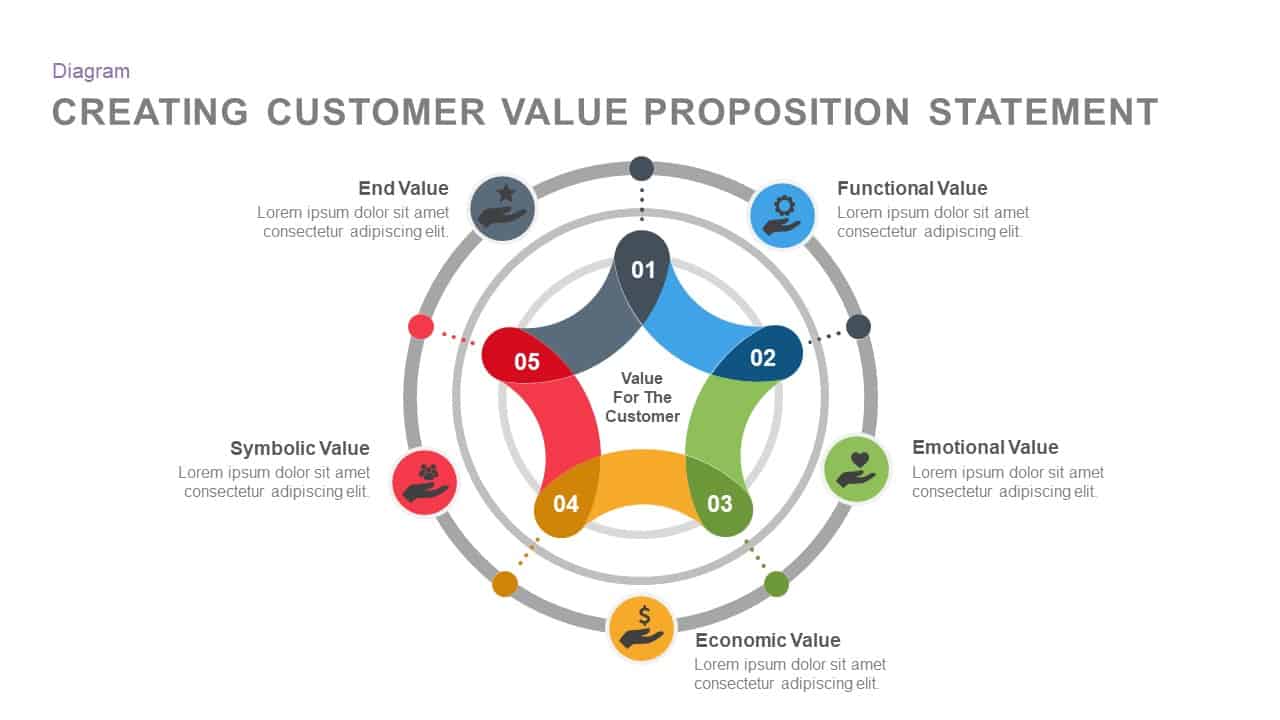
Customer Value Proposition Diagram Template for PowerPoint & Google Slides
Circular
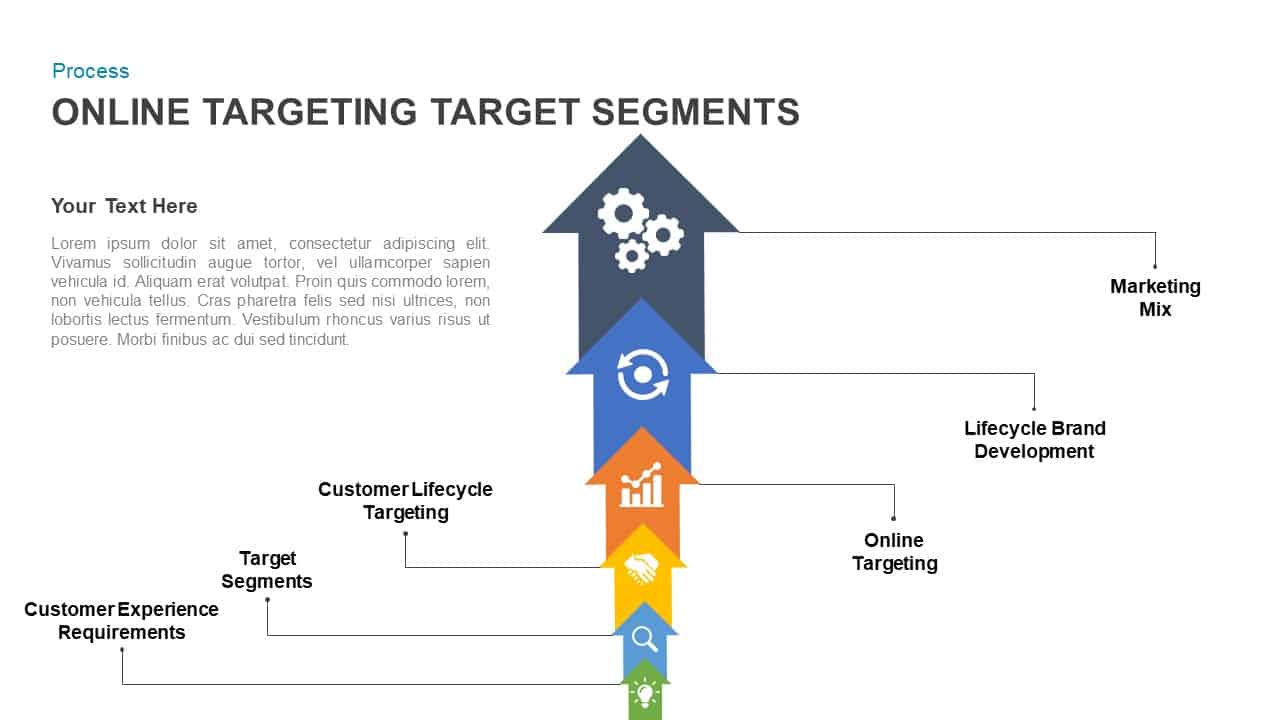
Online Targeting & Segmentation Diagram Template for PowerPoint & Google Slides
Process
Five-Stage Linear Process Flow Diagram Template for PowerPoint & Google Slides
Process
Five Stage Circular Arrow Diagram Template for PowerPoint & Google Slides
Process
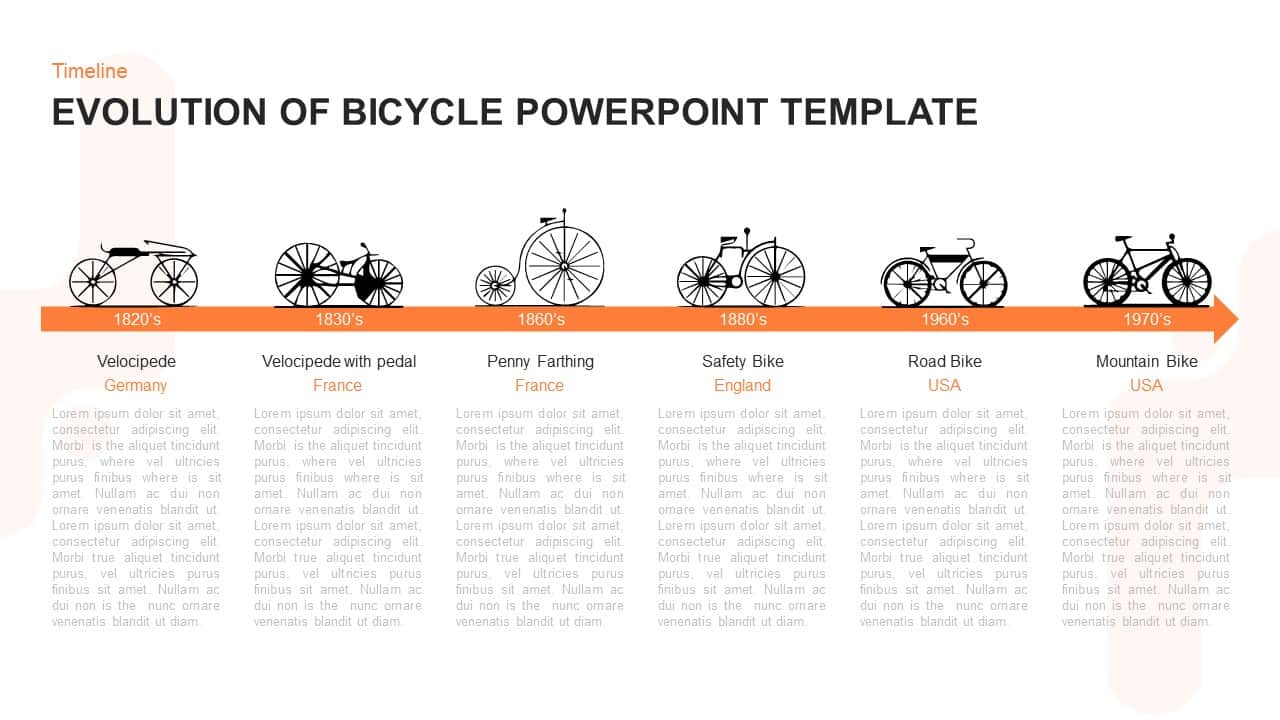
Evolution of Bicycle – Timeline Template for PowerPoint & Google Slides
Timeline
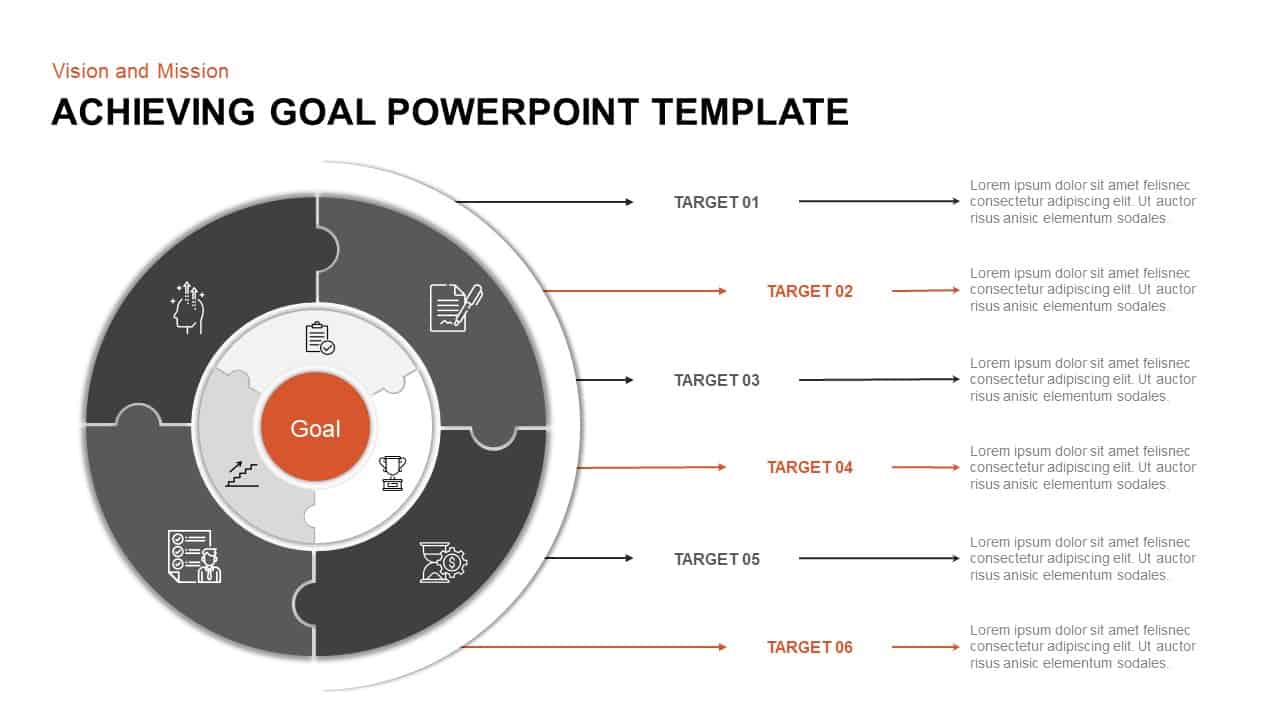
Puzzle Diagram for Goal Achievement Template for PowerPoint & Google Slides
Circular
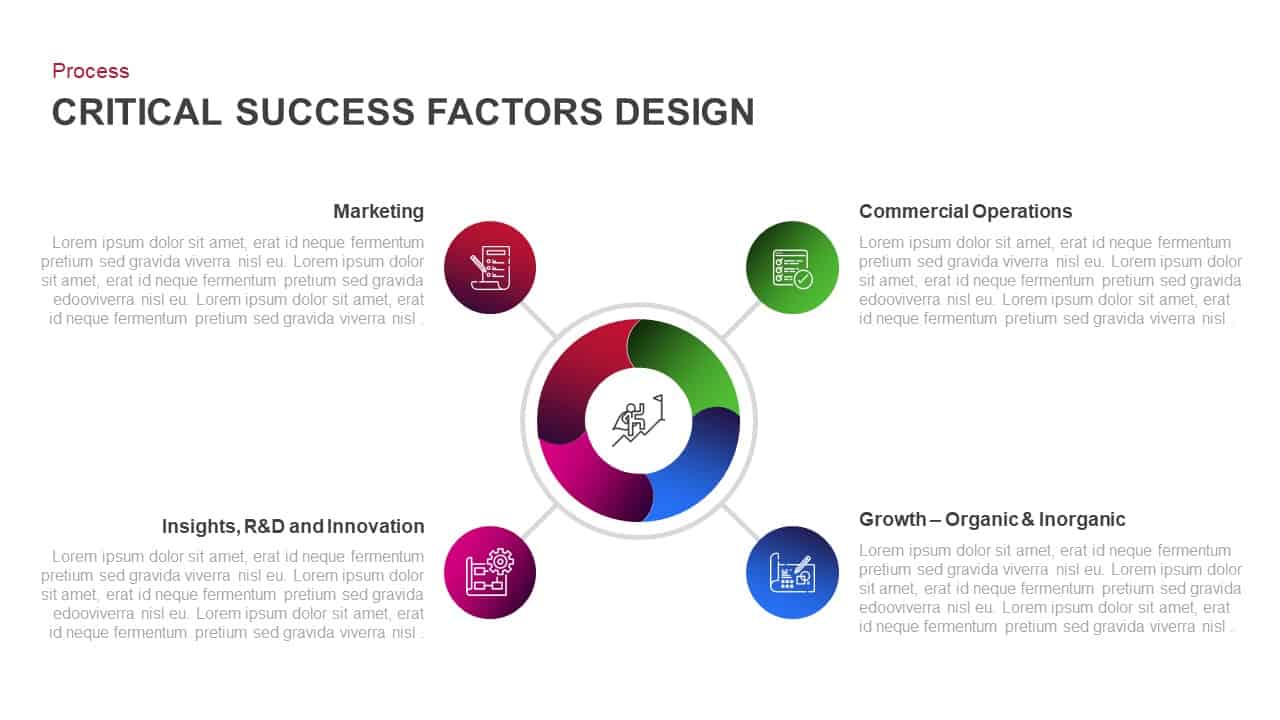
Critical Success Factors Diagram Template for PowerPoint & Google Slides
Infographics
Four-Stage Funnel Diagram Infographic Template for PowerPoint & Google Slides
Funnel
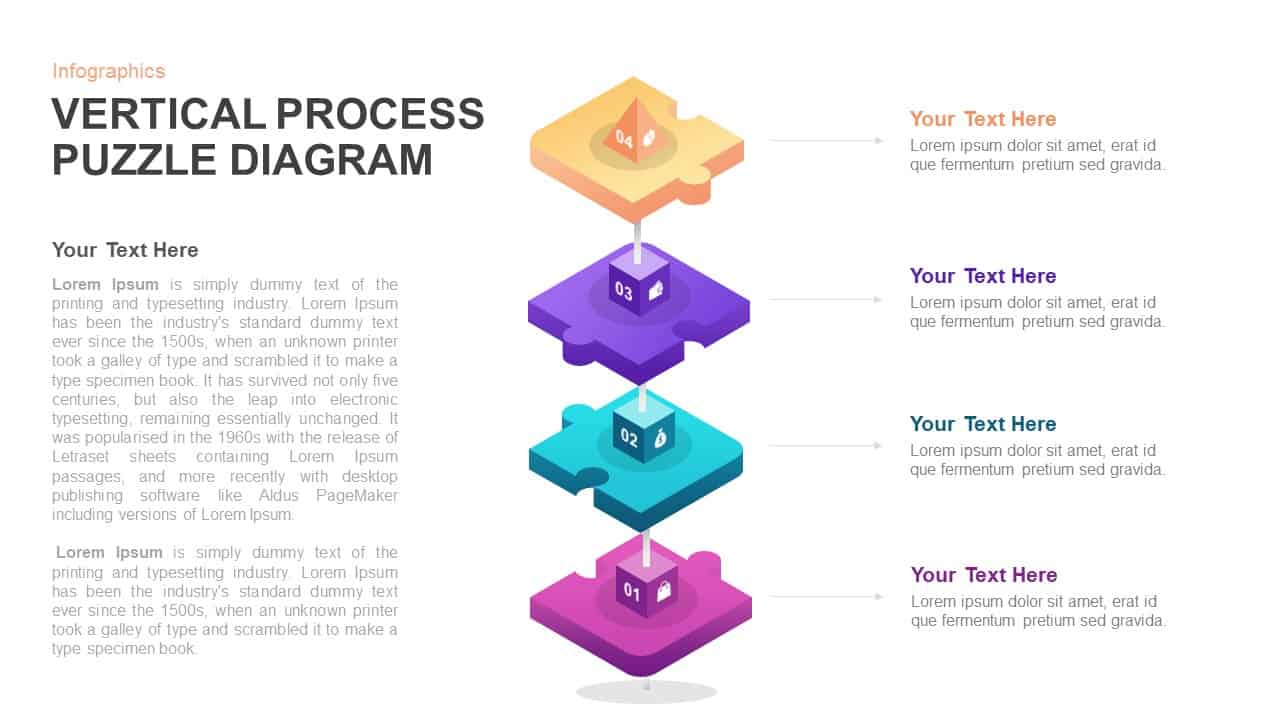
Vertical 4-Step Puzzle Process Diagram Template for PowerPoint & Google Slides
Process

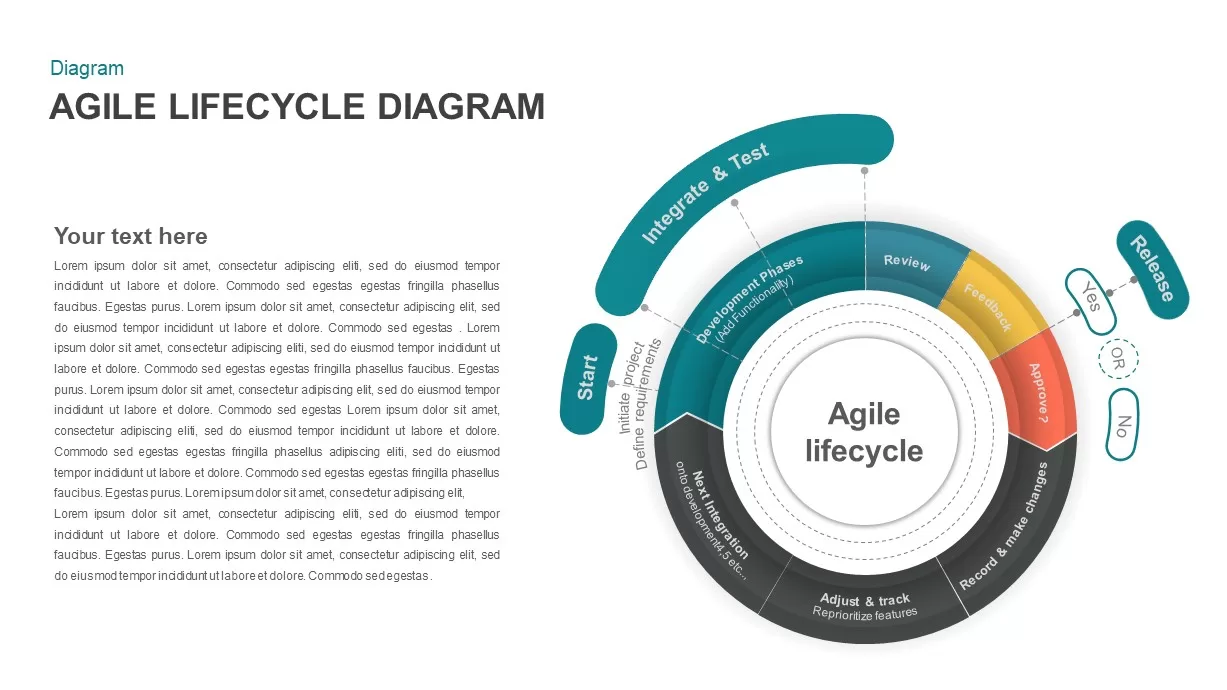
Agile Lifecycle Circular Diagram Template for PowerPoint & Google Slides
Circular
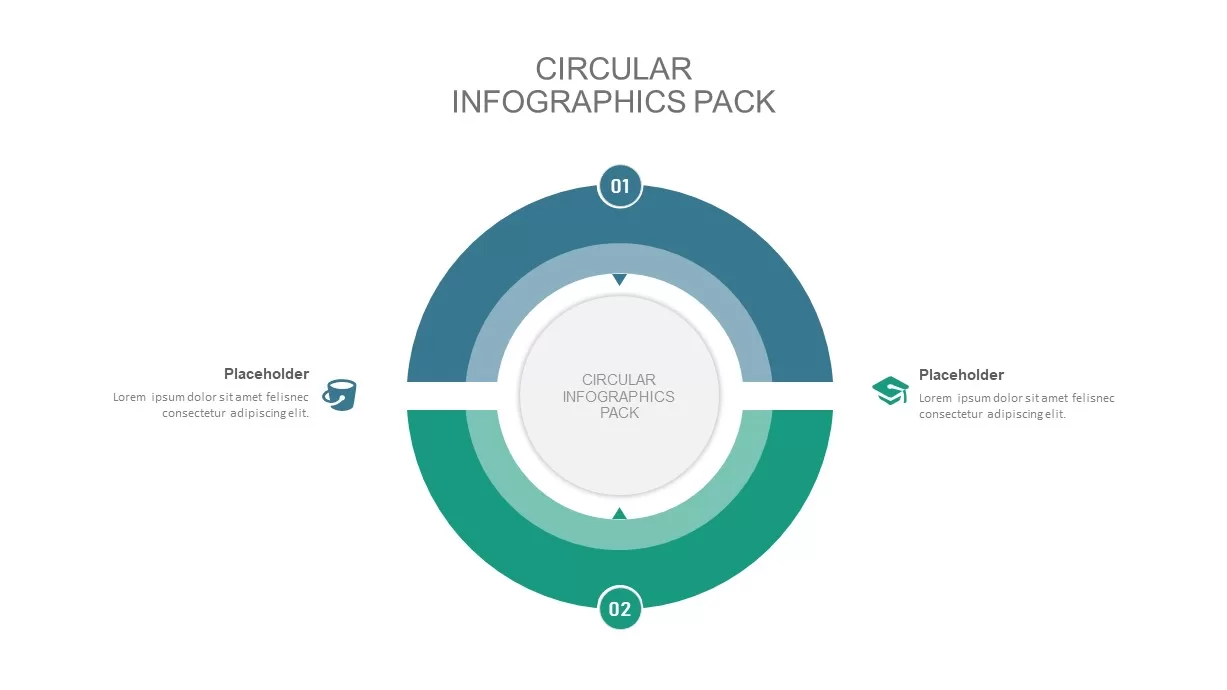
2-8 Step Circular Diagram Template for PowerPoint & Google Slides
Infographics
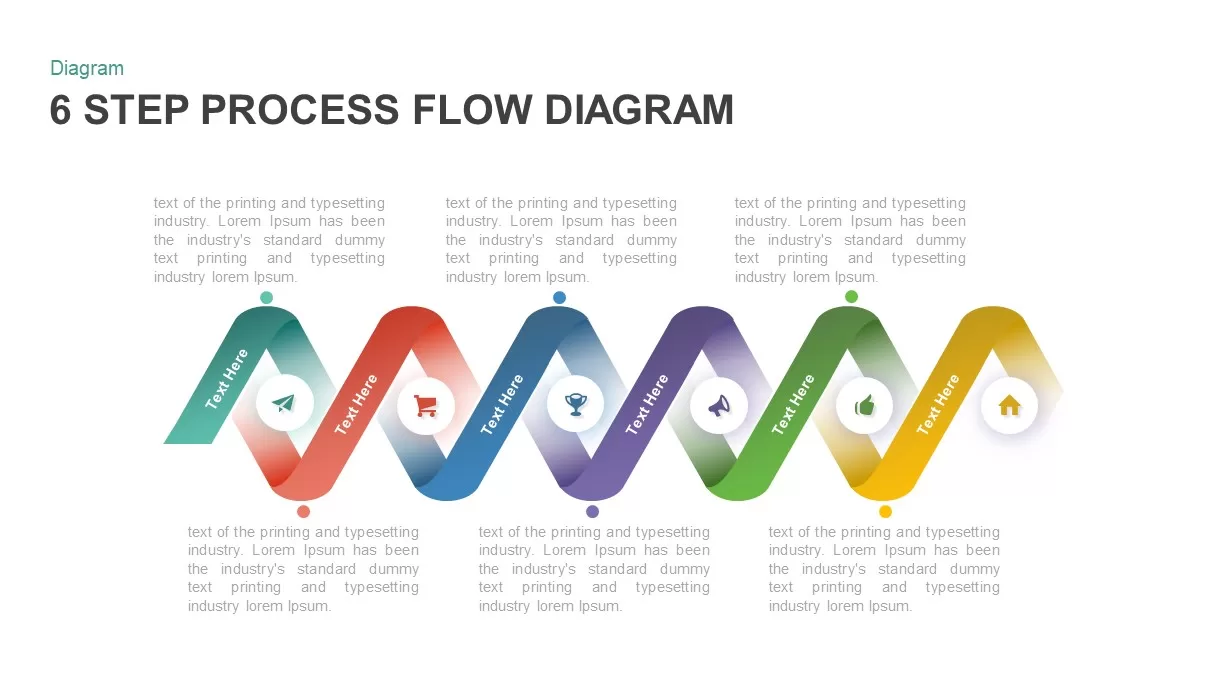
6 Step Process Flow Diagram for PowerPoint & Google Slides
Charts
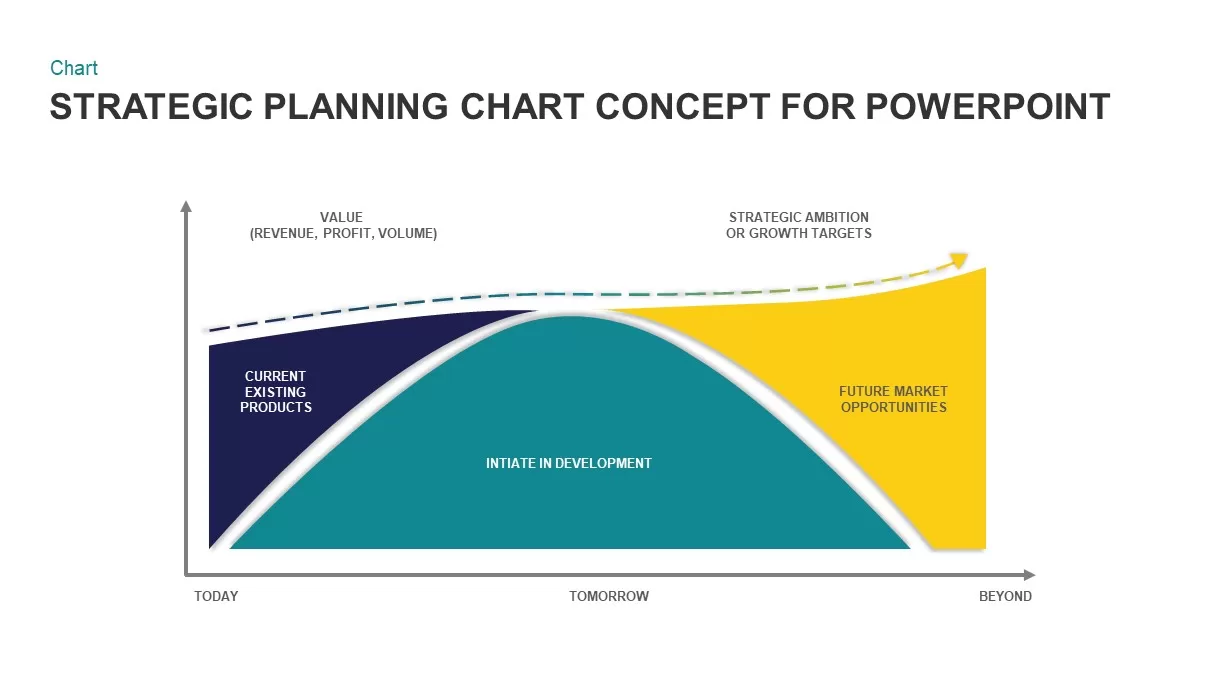
Strategic Planning Curve Diagram Template for PowerPoint & Google Slides
Charts
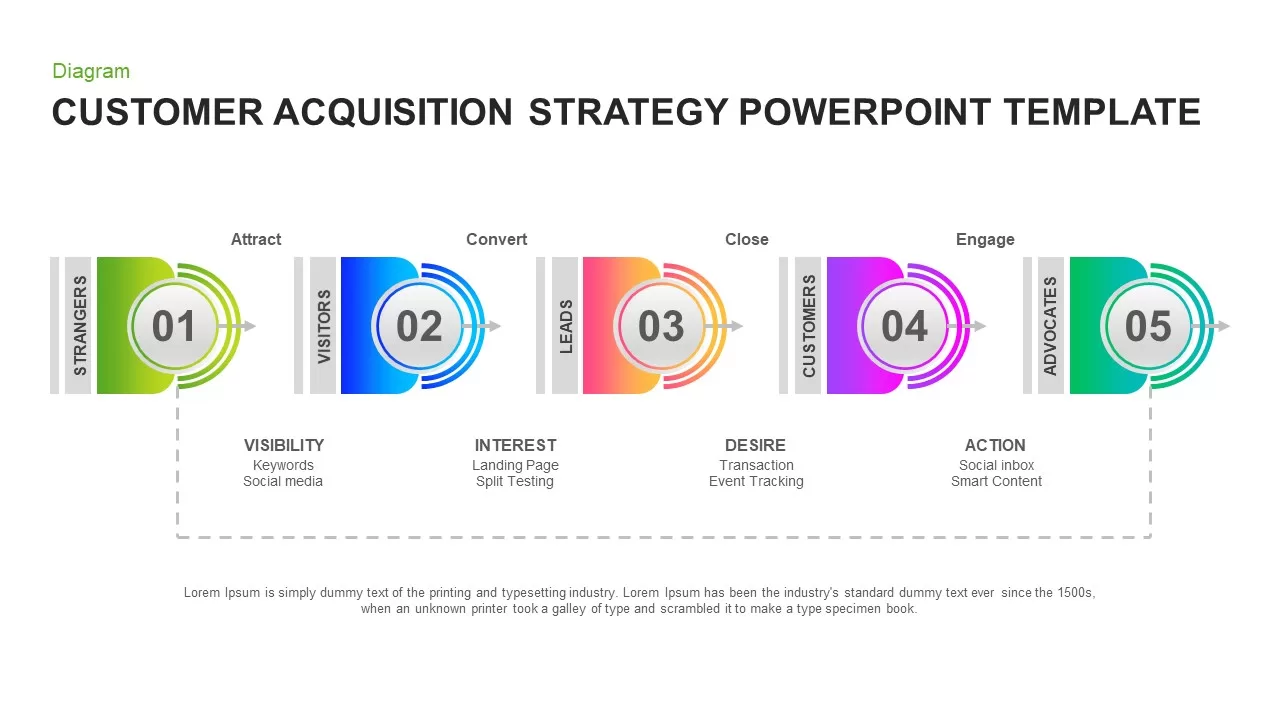
Customer Acquisition Strategy Diagram Template for PowerPoint & Google Slides
Customer Journey
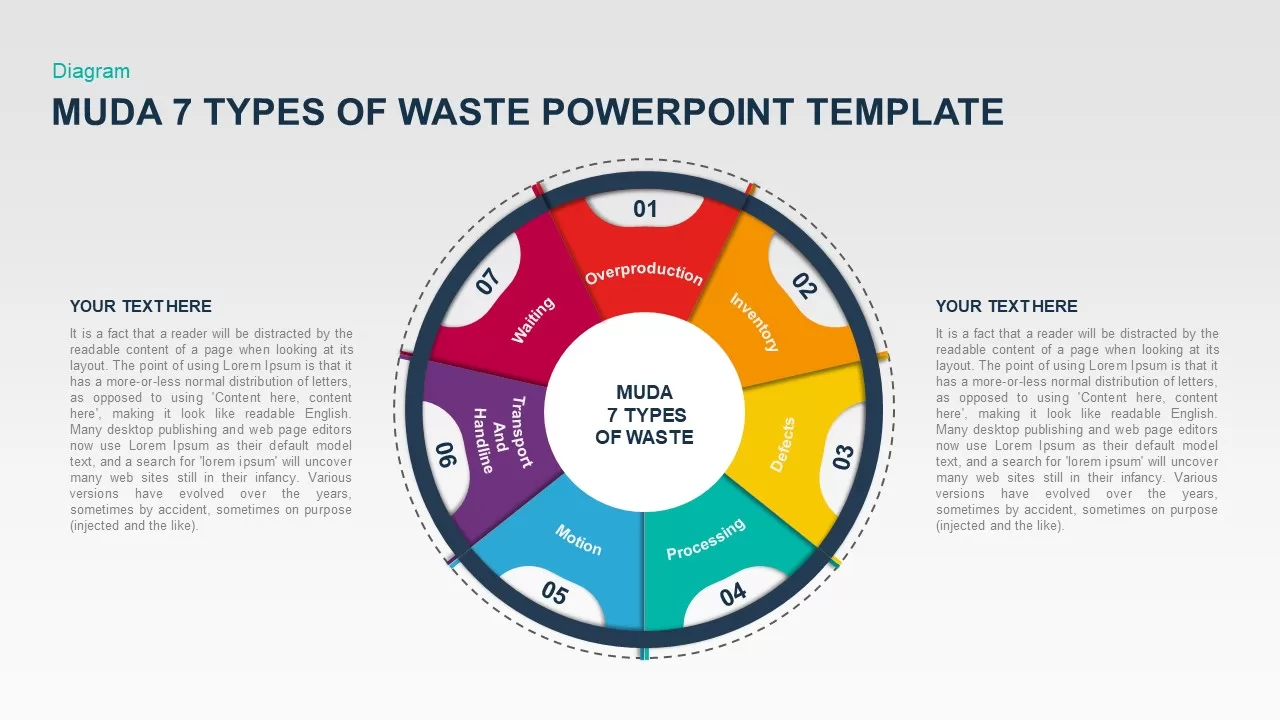
MUDA Seven Types of Waste Diagram Template for PowerPoint & Google Slides
Circular
Creative Strategy Diagram Template for PowerPoint & Google Slides
Business Strategy
4 Business Data Infographics Diagram for PowerPoint & Google Slides
Process
Creative Tree Diagram Infographic Template for PowerPoint & Google Slides
Decision Tree
Stacked Cubes Pyramid Six-Option Diagram Template for PowerPoint & Google Slides
Pyramid
3D Triangle Diagram Infographic Template for PowerPoint & Google Slides
Pyramid
Product Marketing Tree Diagram Template for PowerPoint & Google Slides
Marketing
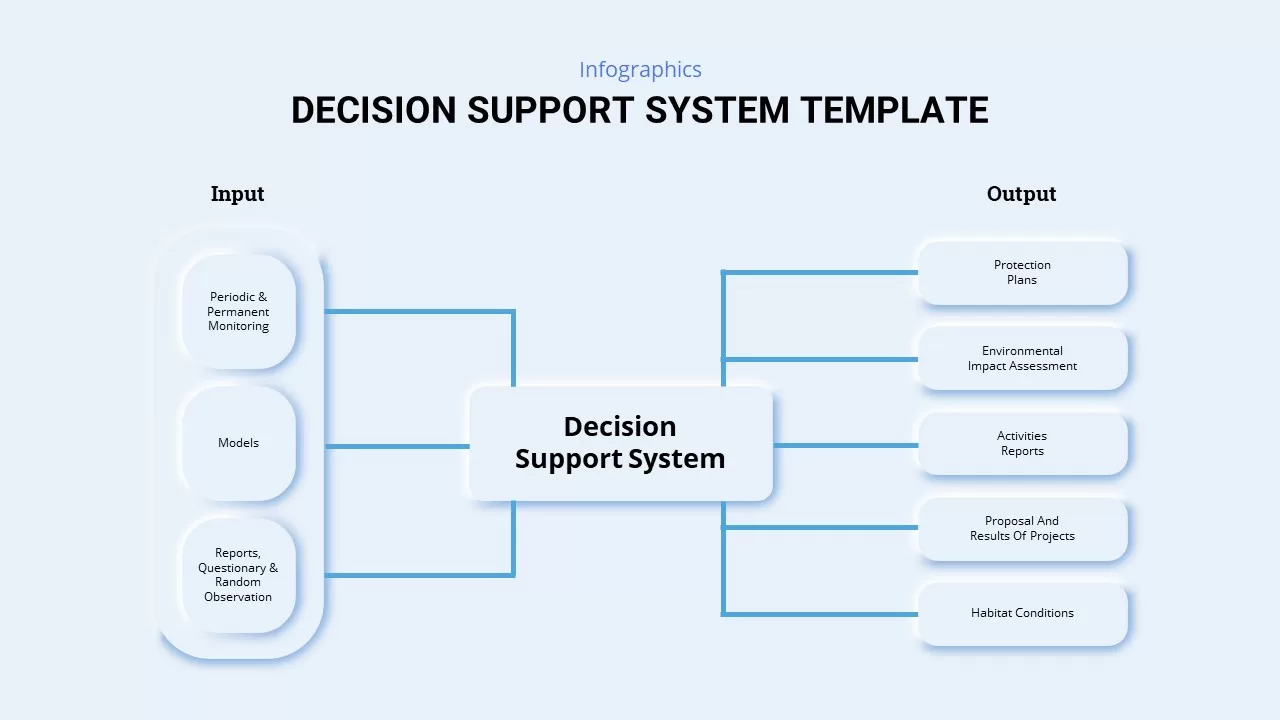
Decision Support System Diagram Template for PowerPoint & Google Slides
Process
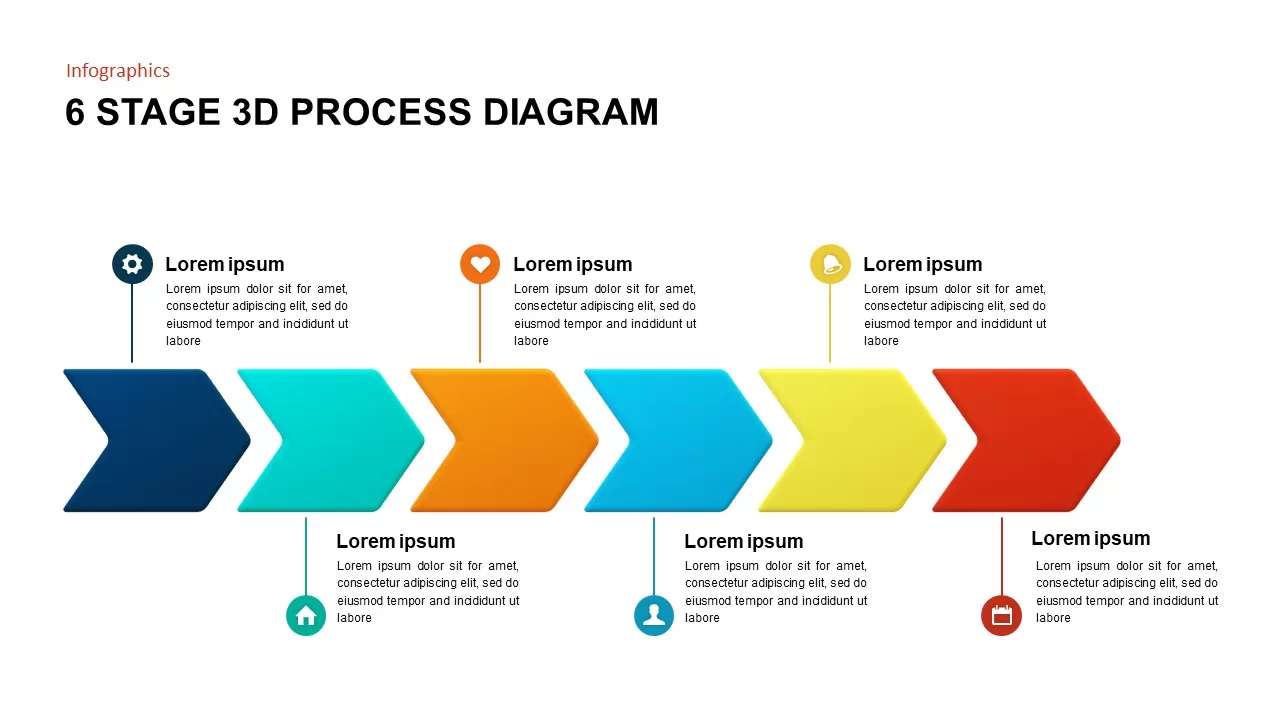
Animated Six-Stage 3D Process Diagram Template for PowerPoint & Google Slides
Arrow
Snake Shaped Curve Diagram template for PowerPoint & Google Slides
Business
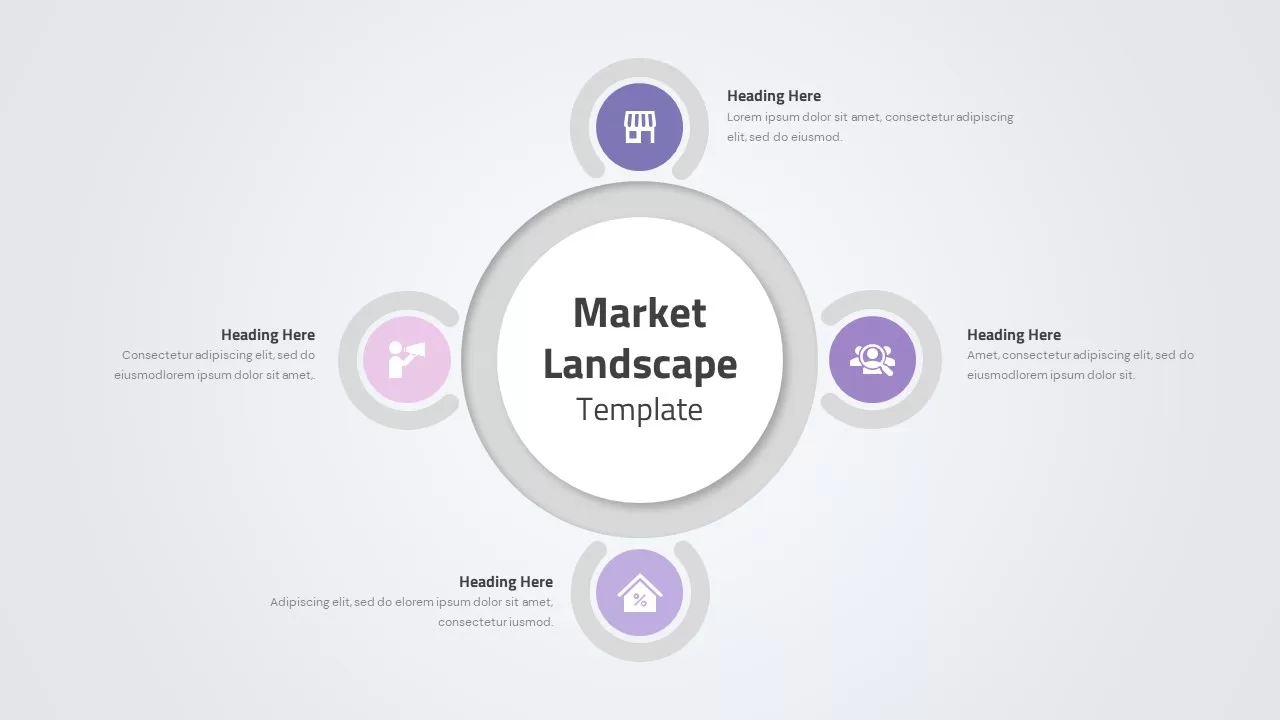
Market Landscape Hub and Spoke Diagram Template for PowerPoint & Google Slides
Infographics
Chain Link Process Infographic Diagram Template for PowerPoint & Google Slides
Process
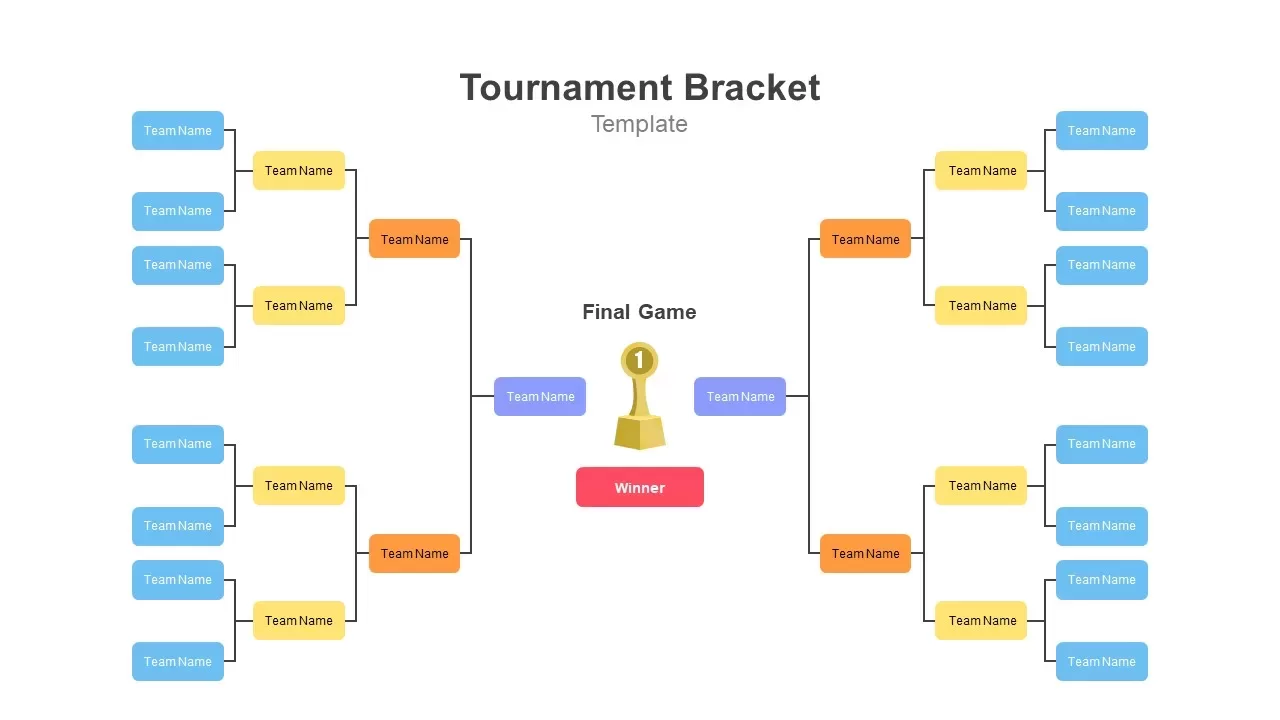
Tournament Bracket Template for PowerPoint & Google Slides
Process
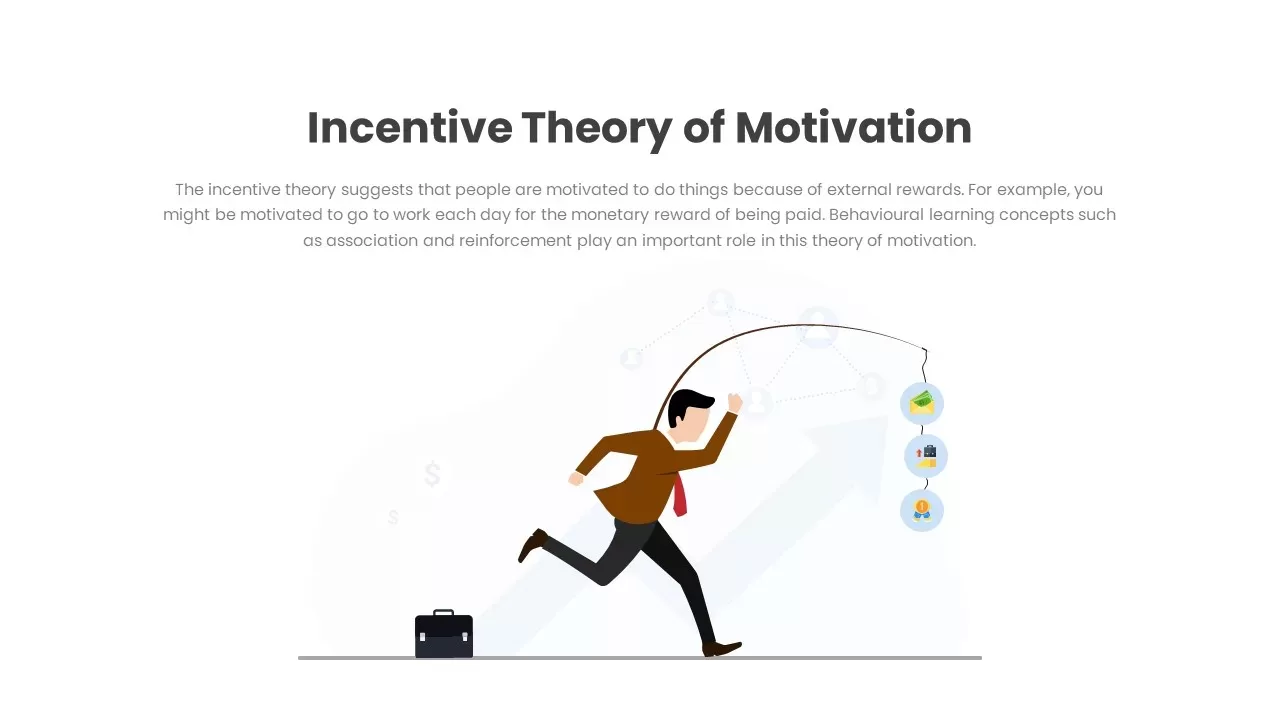
Incentive Theory of Motivation Diagram Template for PowerPoint & Google Slides
Employee Performance
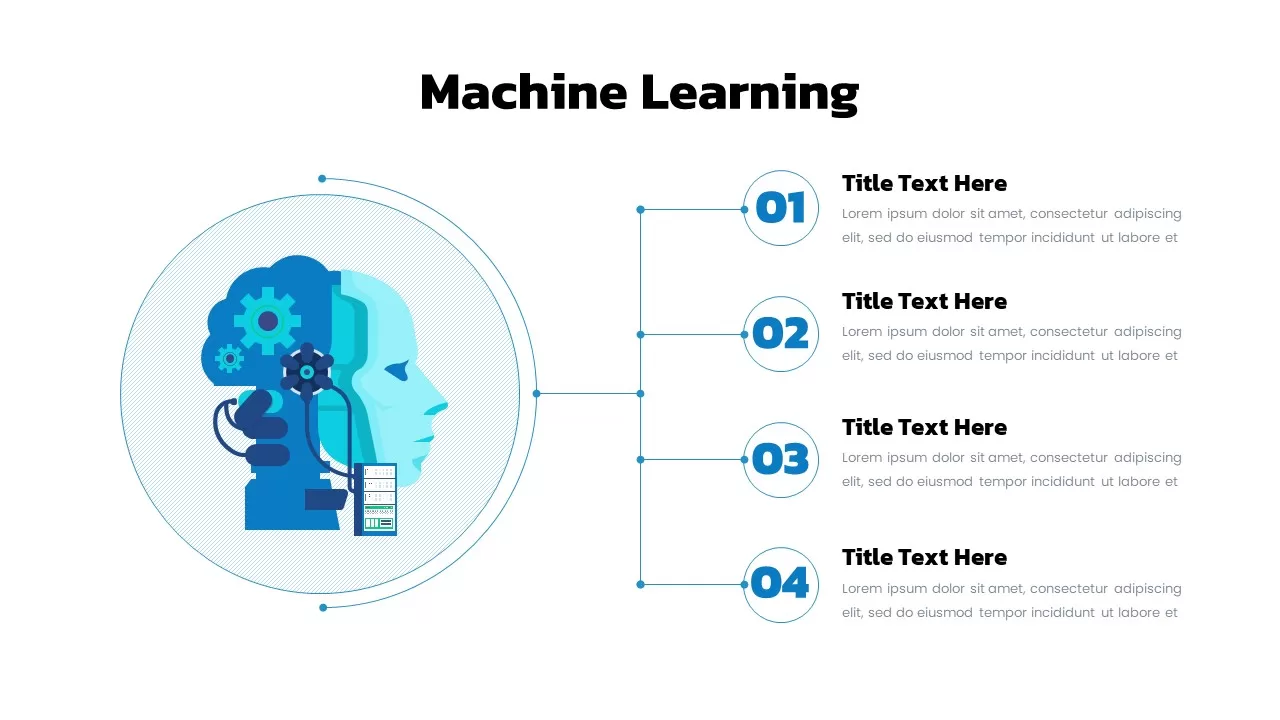
Machine Learning Template
Process
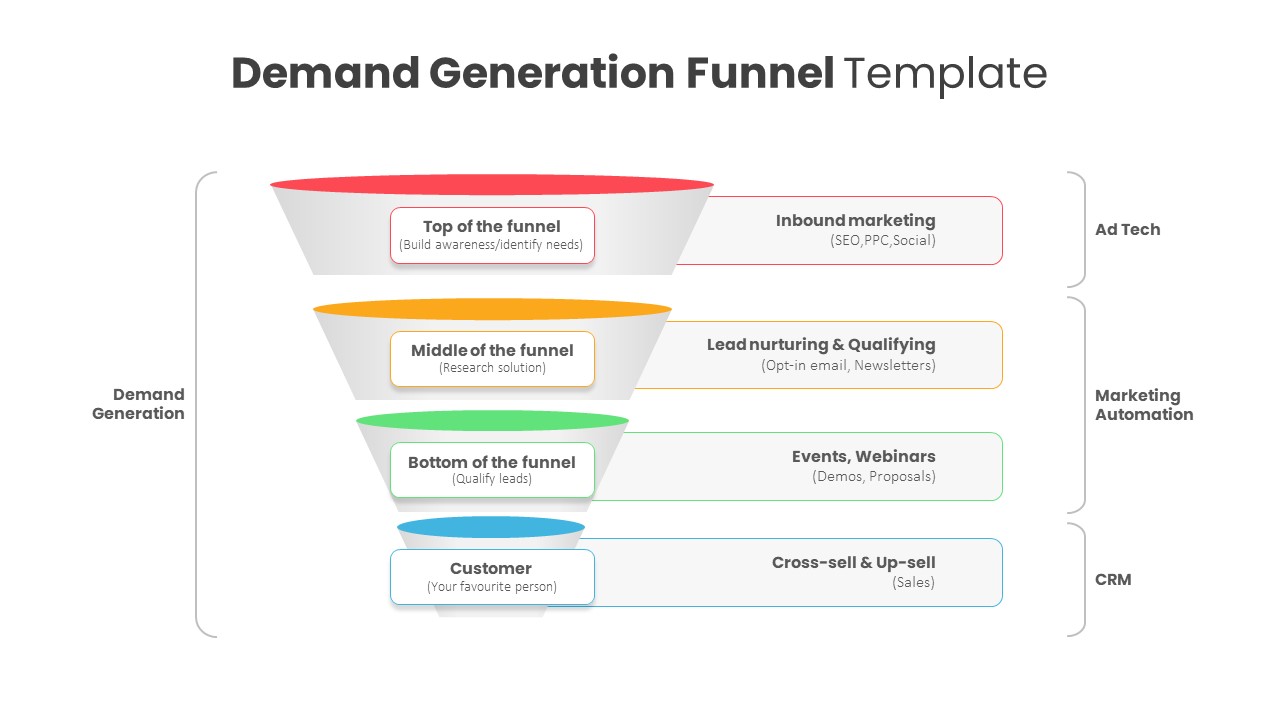
Demand Generation Funnel Diagram Template for PowerPoint & Google Slides
Funnel
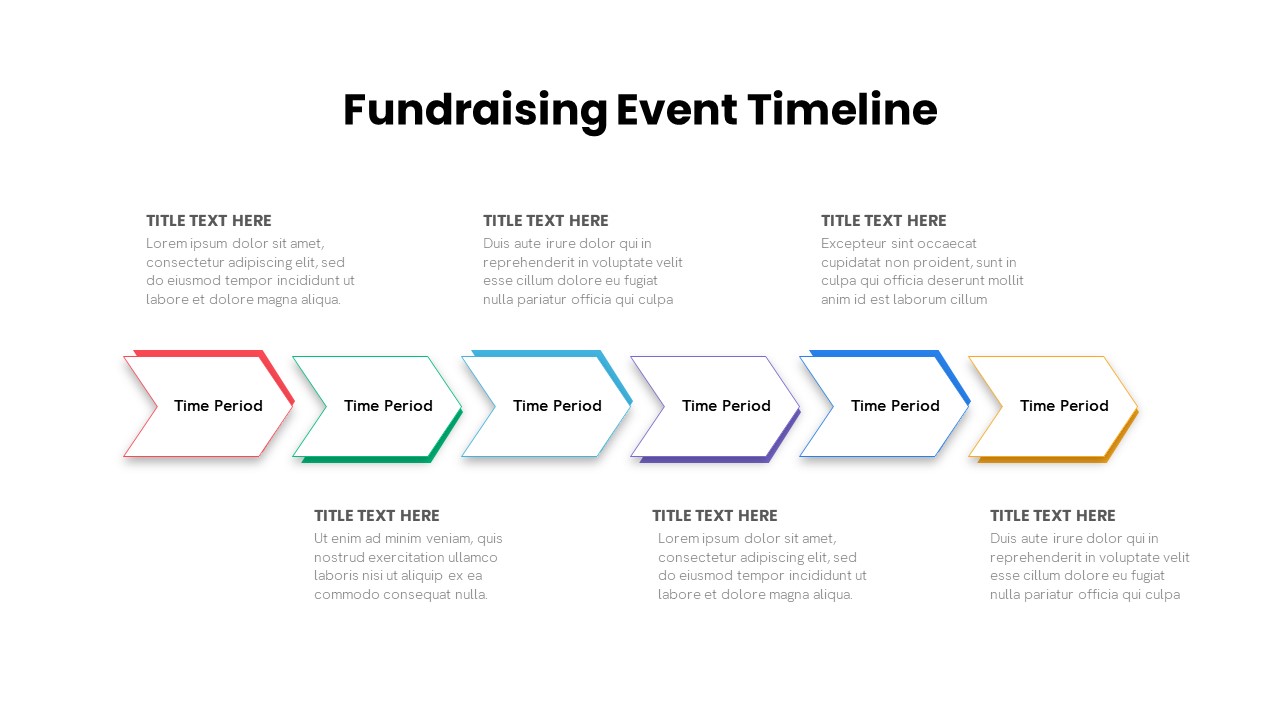
Fundraising Event Timeline Diagram Template for PowerPoint & Google Slides
Timeline
Multi-Style Clock Chart Diagram Template for PowerPoint & Google Slides
Circular
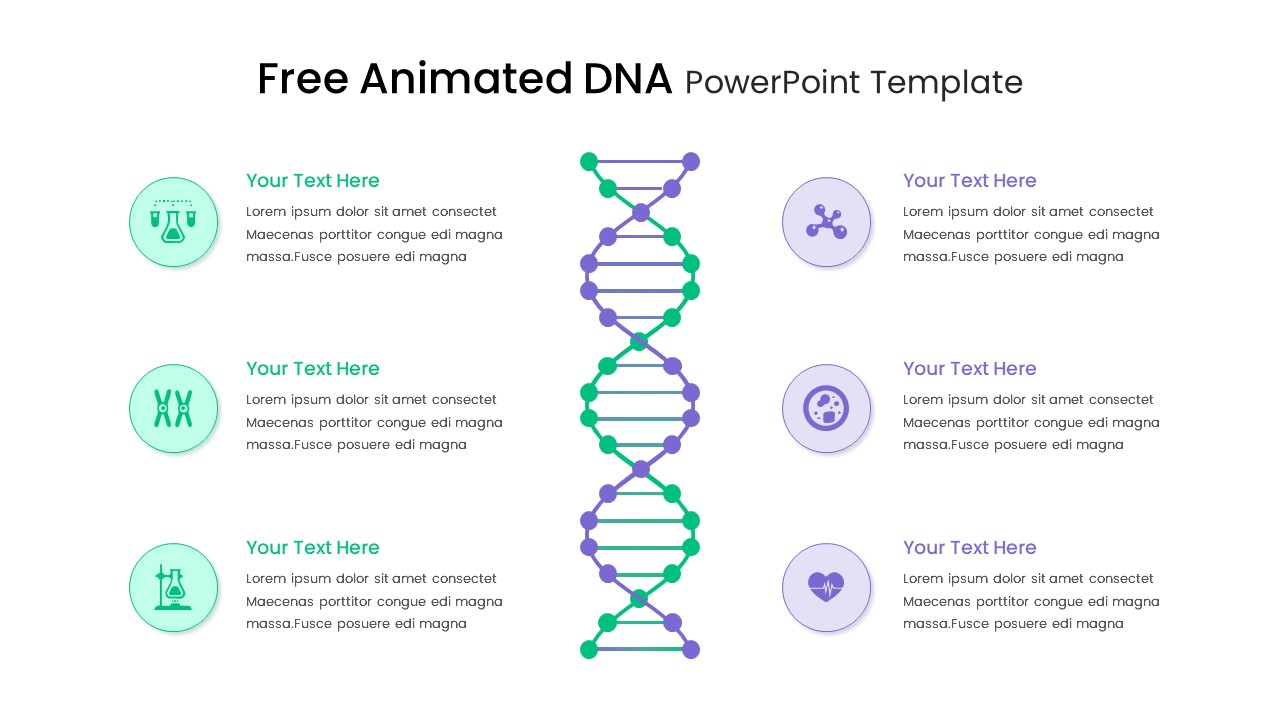
Free Animated DNA Infographic Diagram Template for PowerPoint & Google Slides
Infographics
Free
Bubble Chart Scatter, Diagram & Matrix Template for PowerPoint & Google Slides
Comparison Chart
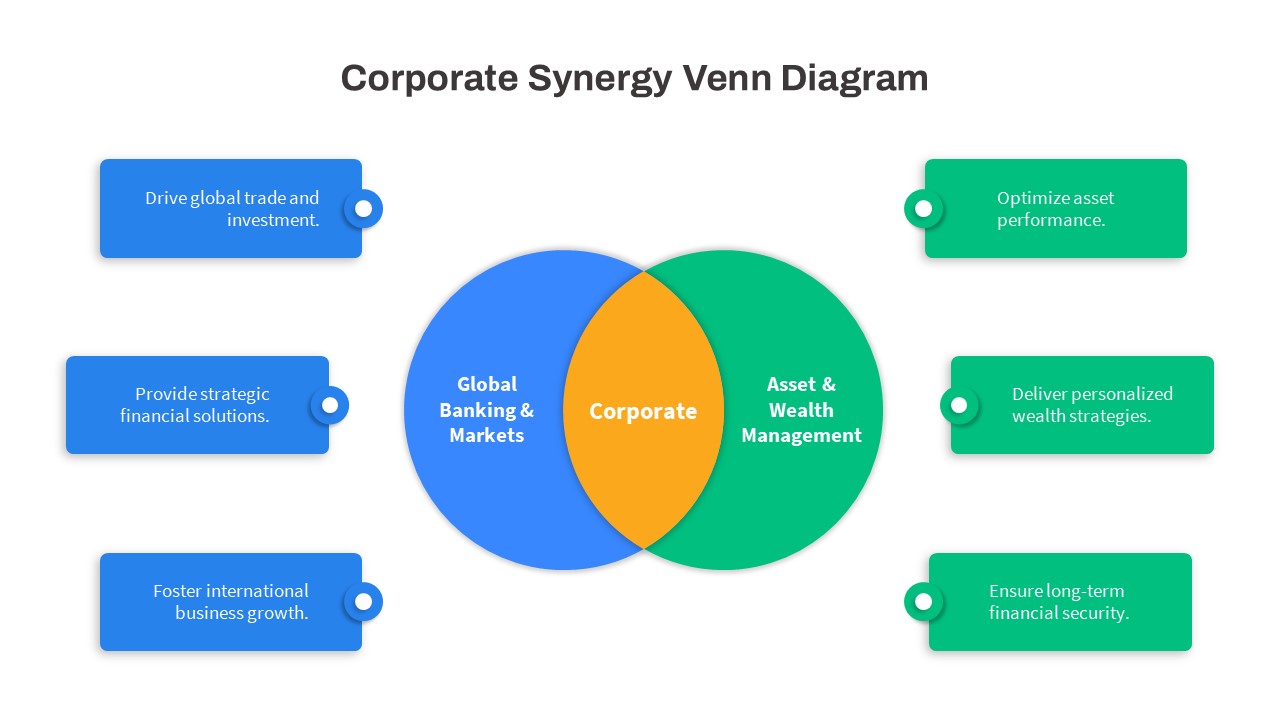
Corporate Synergy Venn Diagram Template for PowerPoint & Google Slides
Comparison
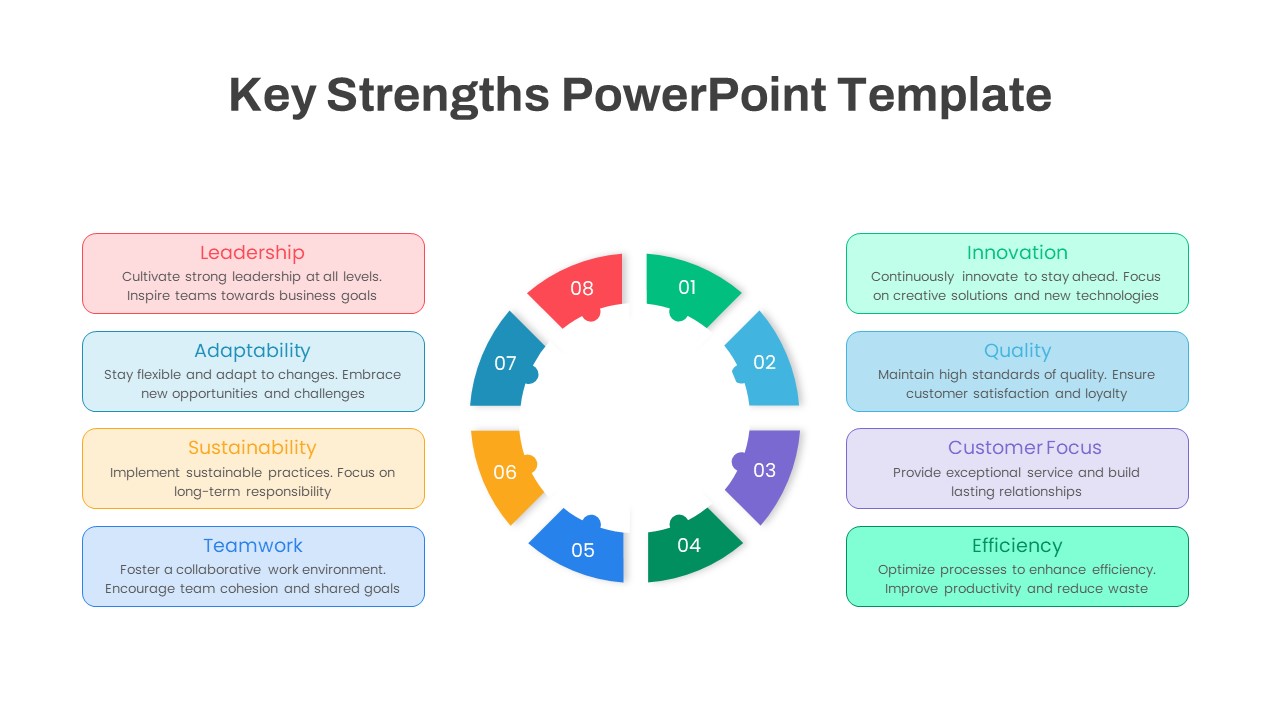
Eight-Segment Key Strengths Diagram Template for PowerPoint & Google Slides
Circular
Bottleneck PowerPoint Template
Process
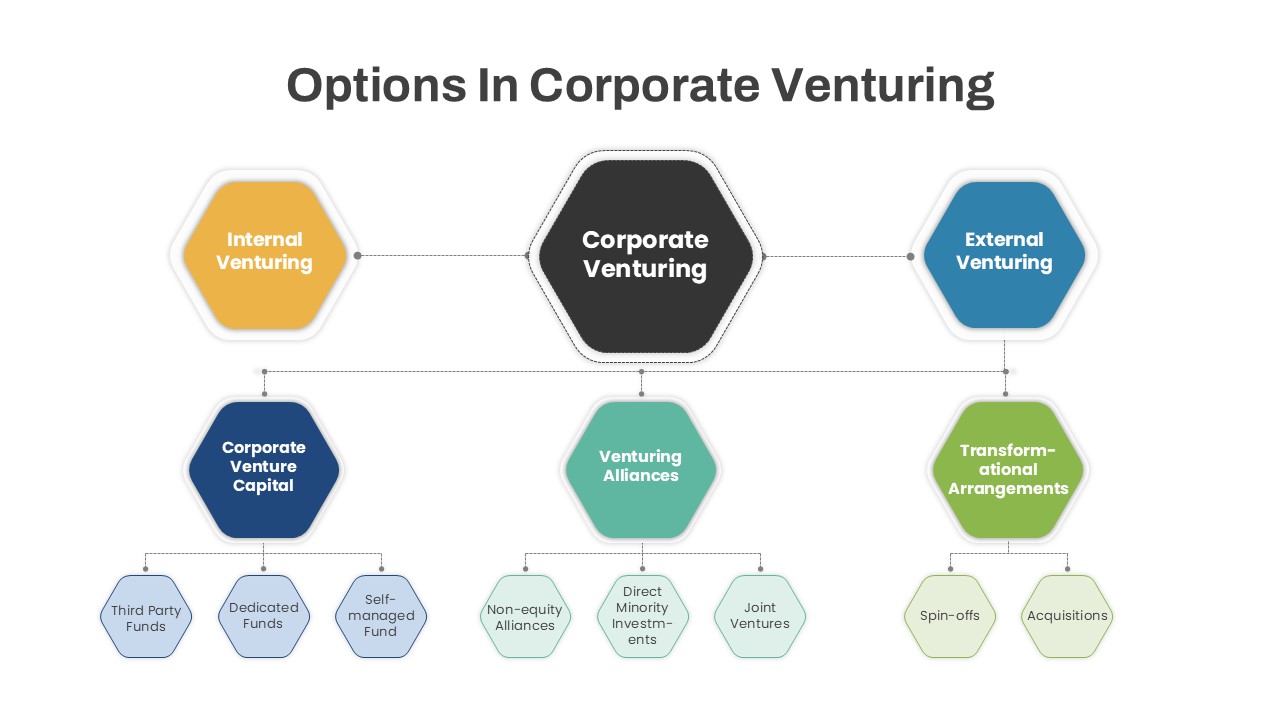
Venturing Diagram Template for PowerPoint & Google Slides
Infographics
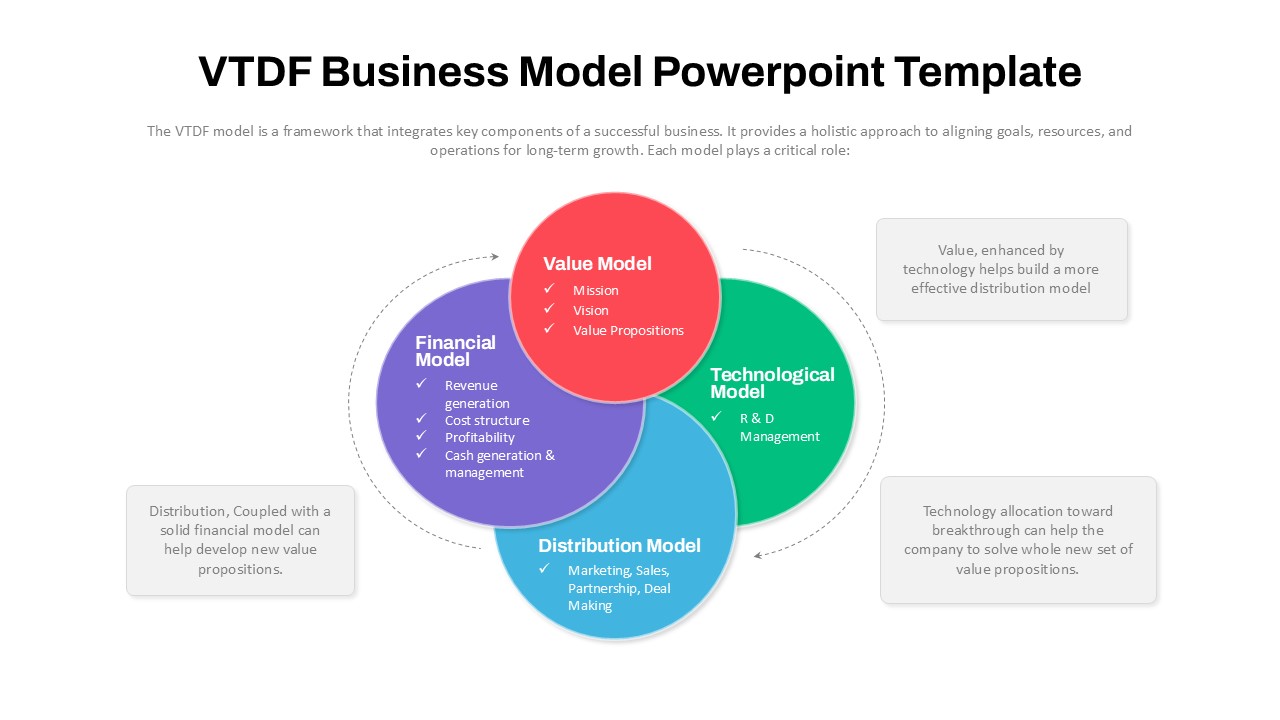
VTDF Business Model Framework Diagram Template for PowerPoint & Google Slides
Business Models
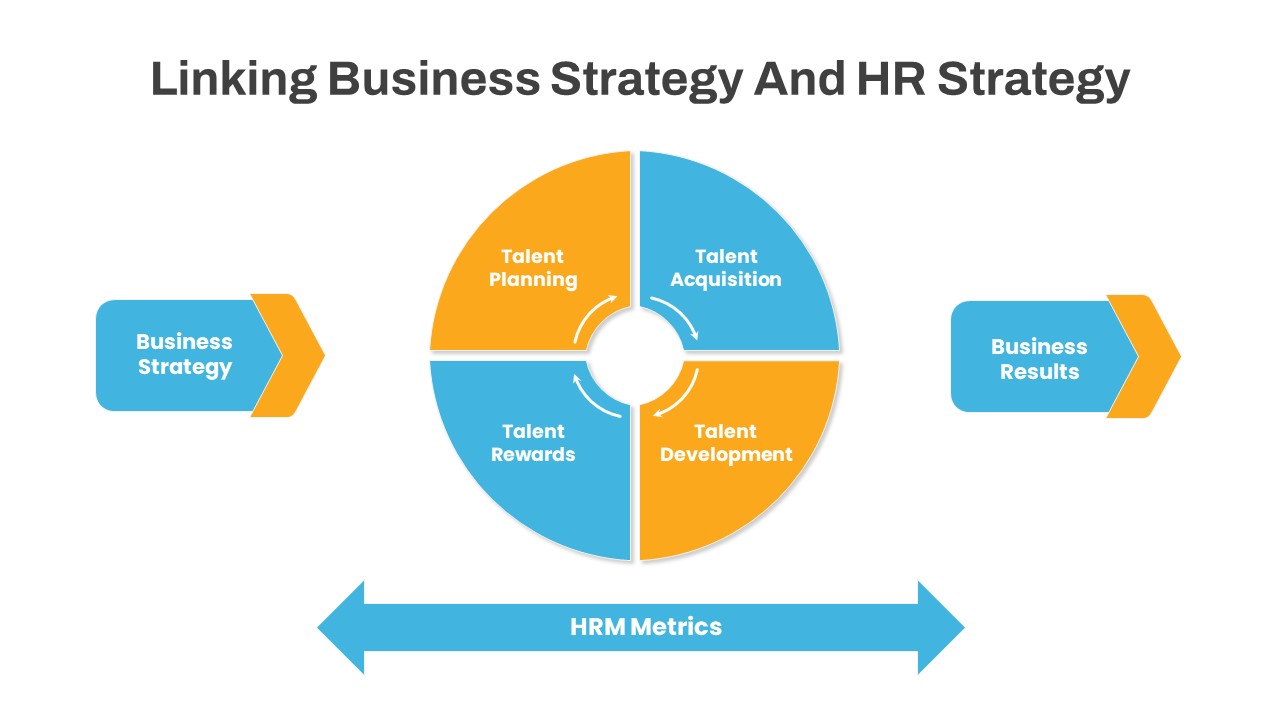
Linking Business HR Strategy Circular Diagram Template for PowerPoint & Google Slides
Business Strategy
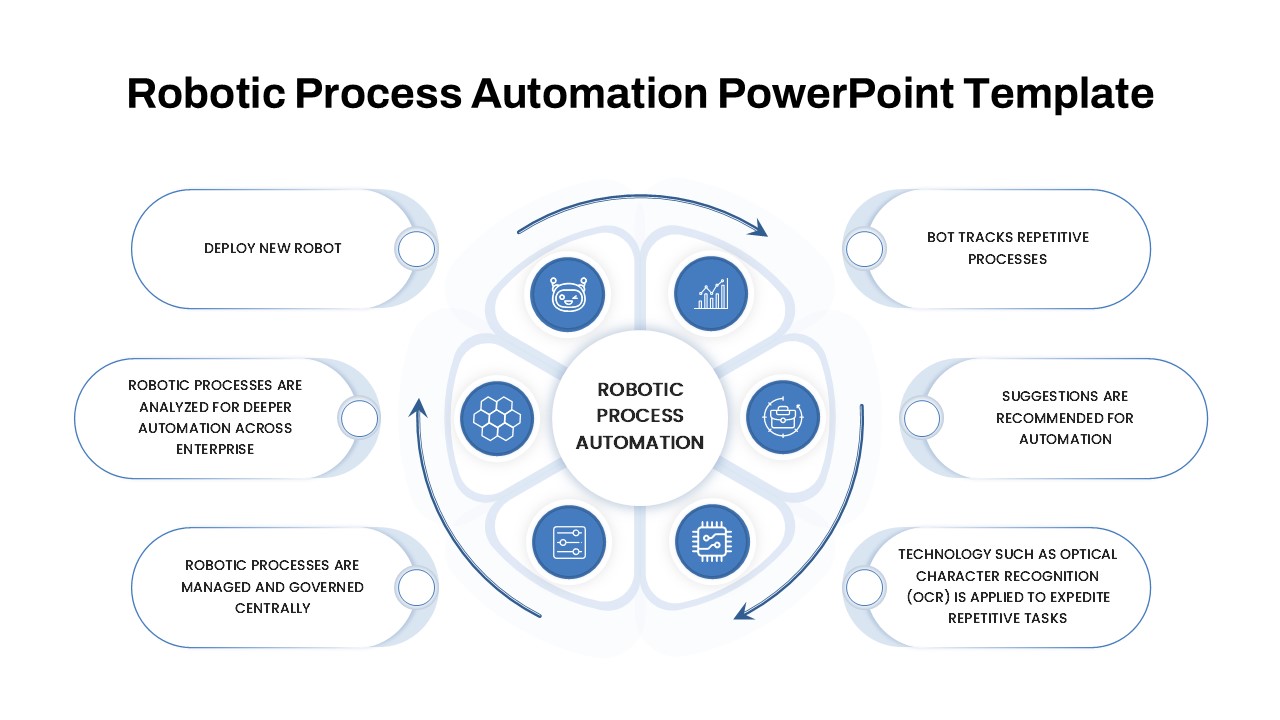
Robotic Process Automation Diagram Template for PowerPoint & Google Slides
Process
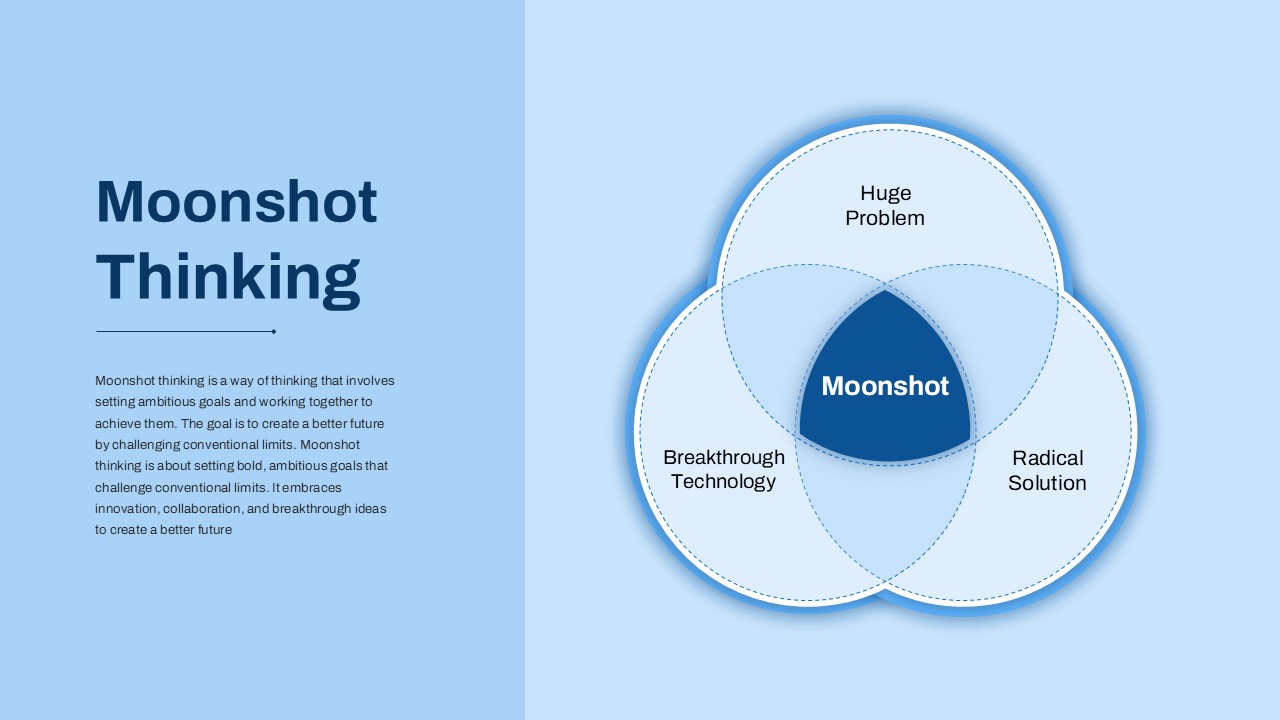
Bold Moonshot Thinking Venn Diagram Template for PowerPoint & Google Slides
Circular
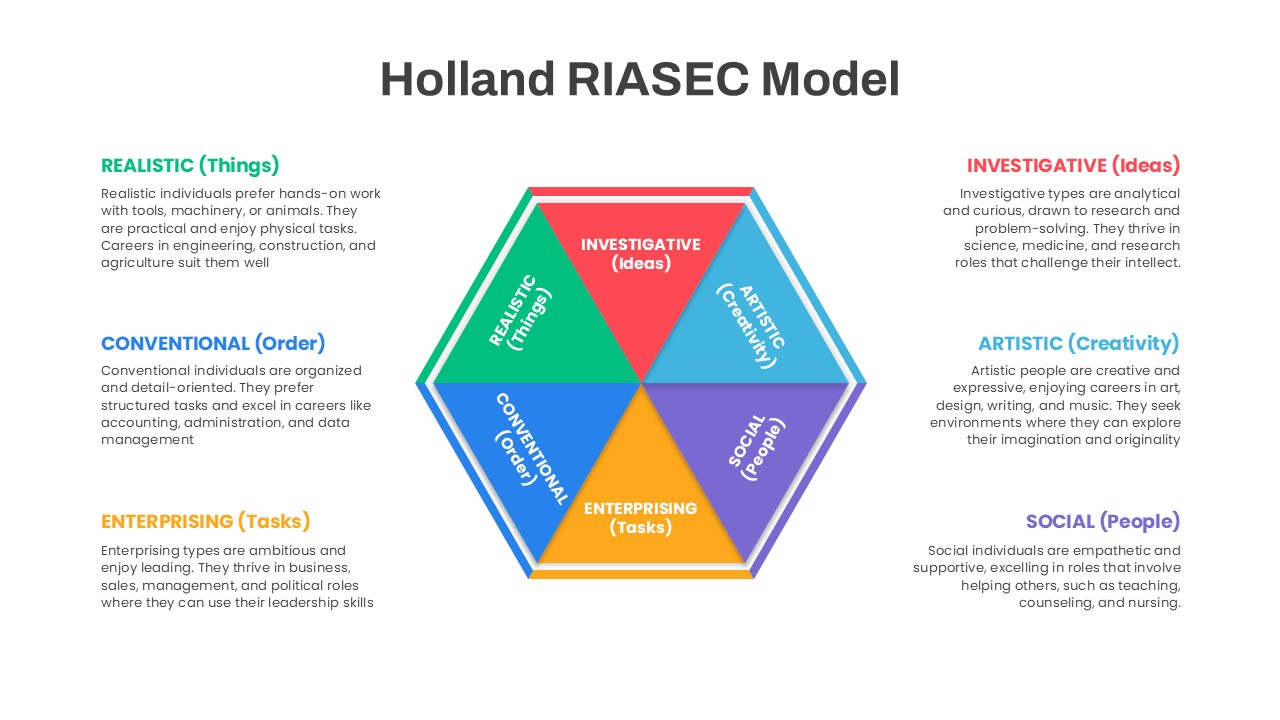
Holland RIASEC Hexagon Diagram Template for PowerPoint & Google Slides
Circular
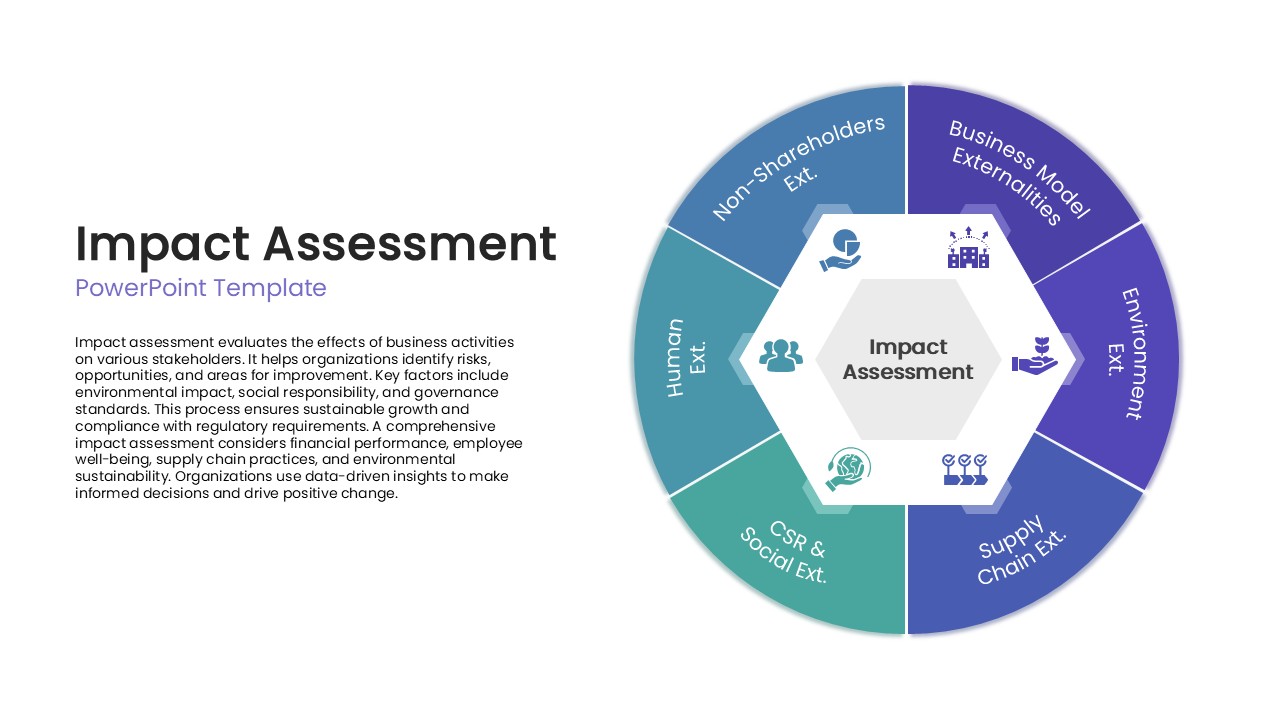
Impact Assessment Circular Diagram Template for PowerPoint & Google Slides
Circular
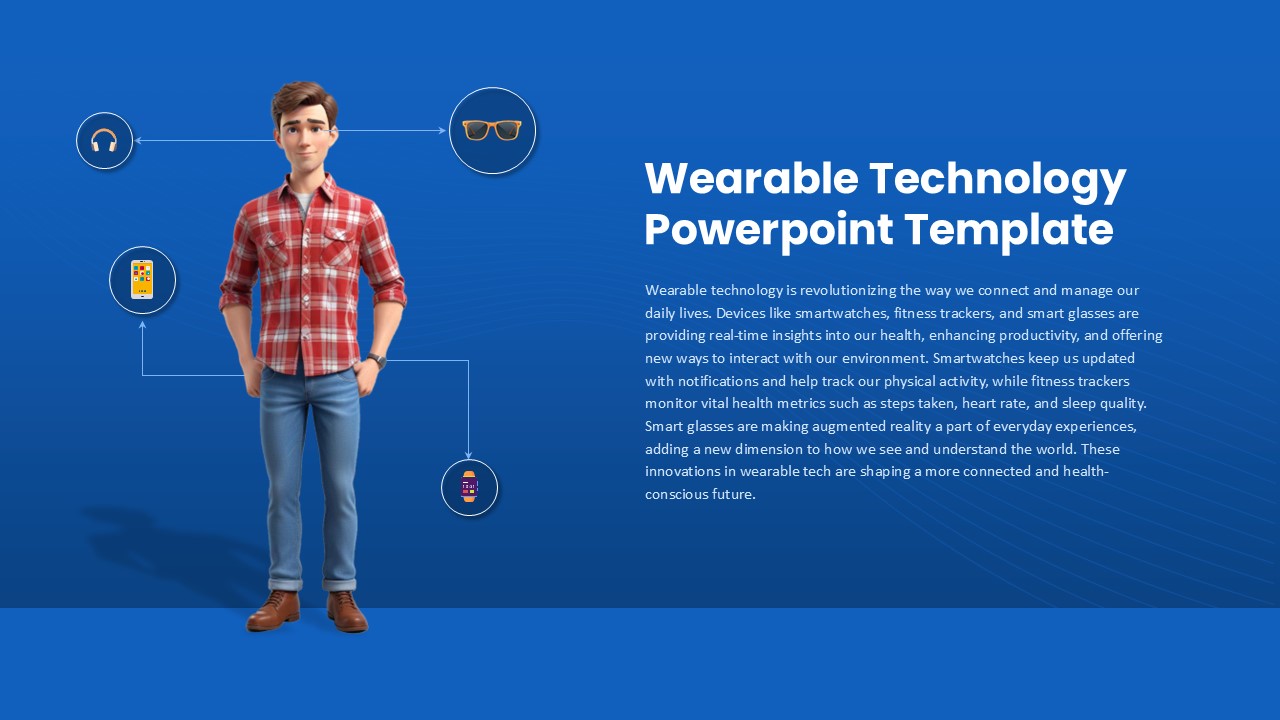
Wearable Technology Connectivity Diagram Template for PowerPoint & Google Slides
Information Technology
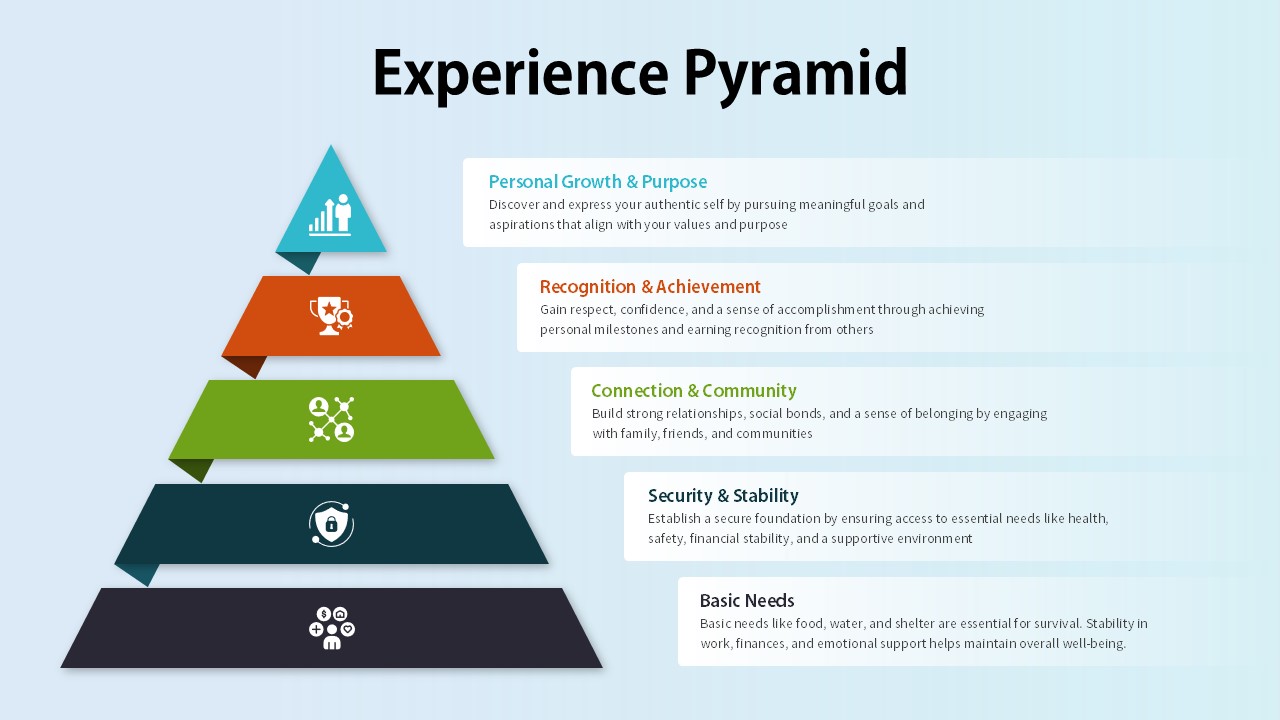
Experience Pyramid Hierarchy Diagram Template for PowerPoint & Google Slides
Pyramid
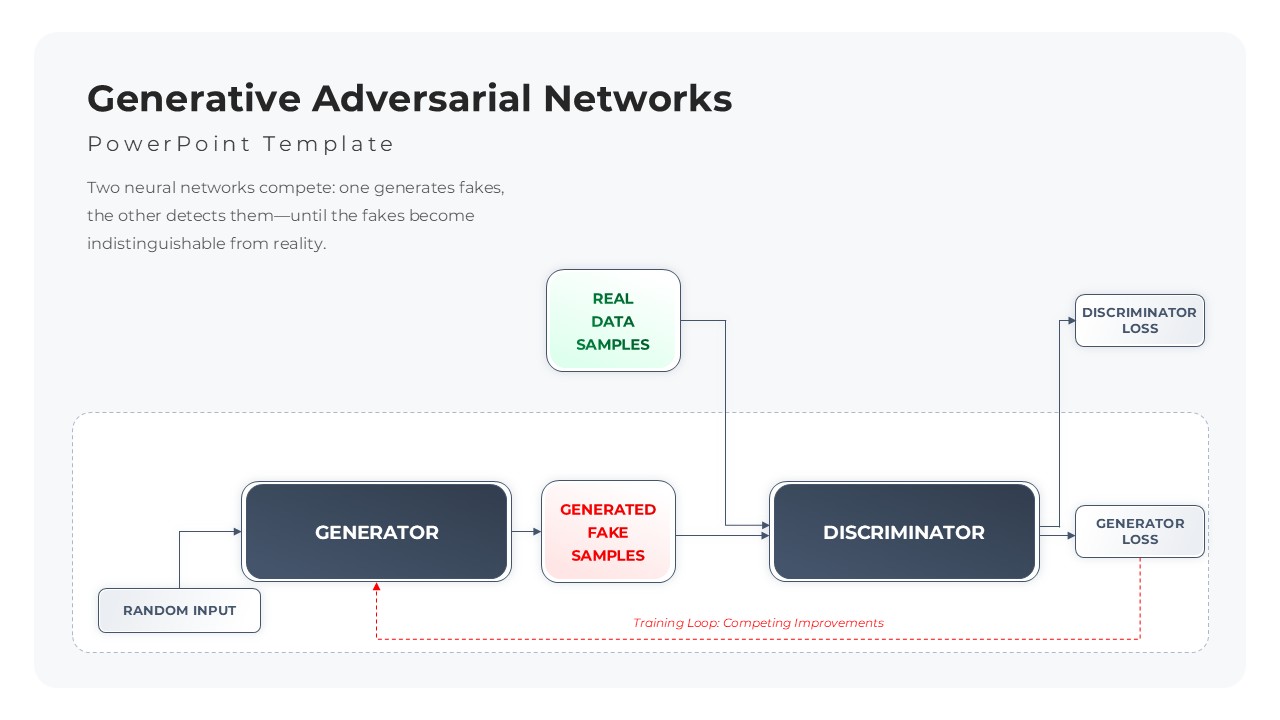
Generative Adversarial Networks Diagram Template for PowerPoint & Google Slides
Process
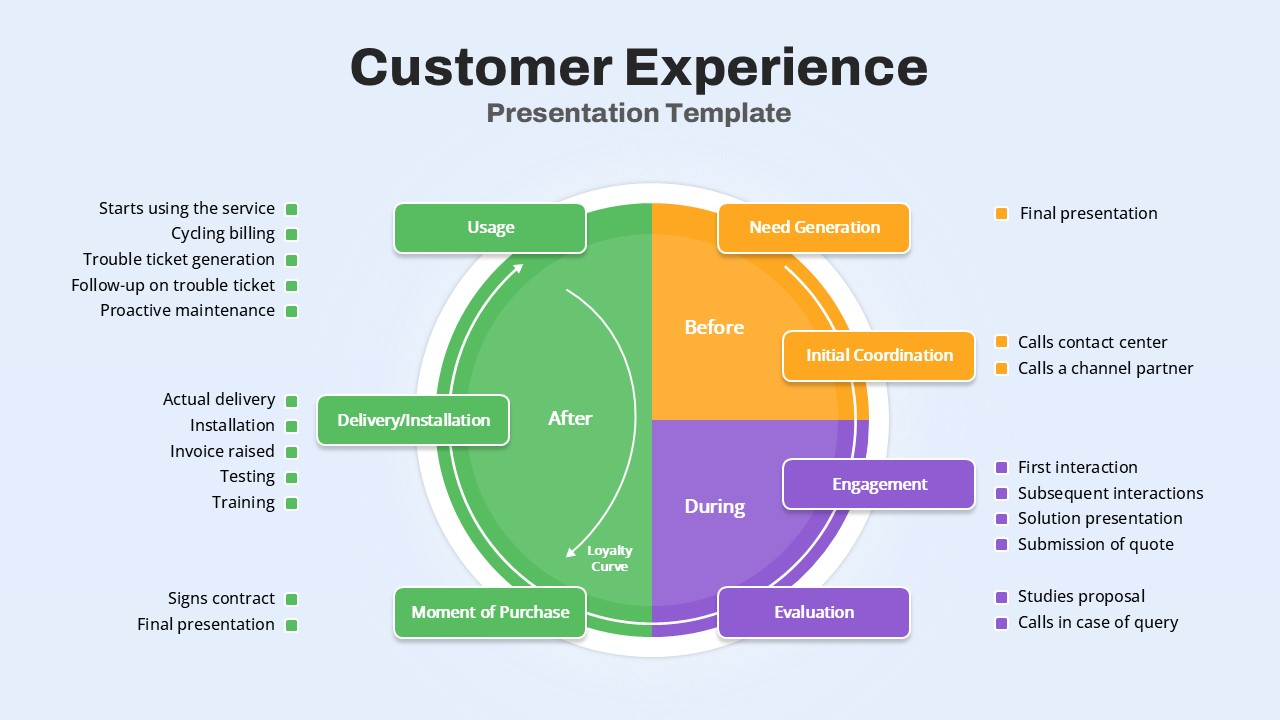
Customer Experience Journey Diagram Template for PowerPoint & Google Slides
Customer Journey
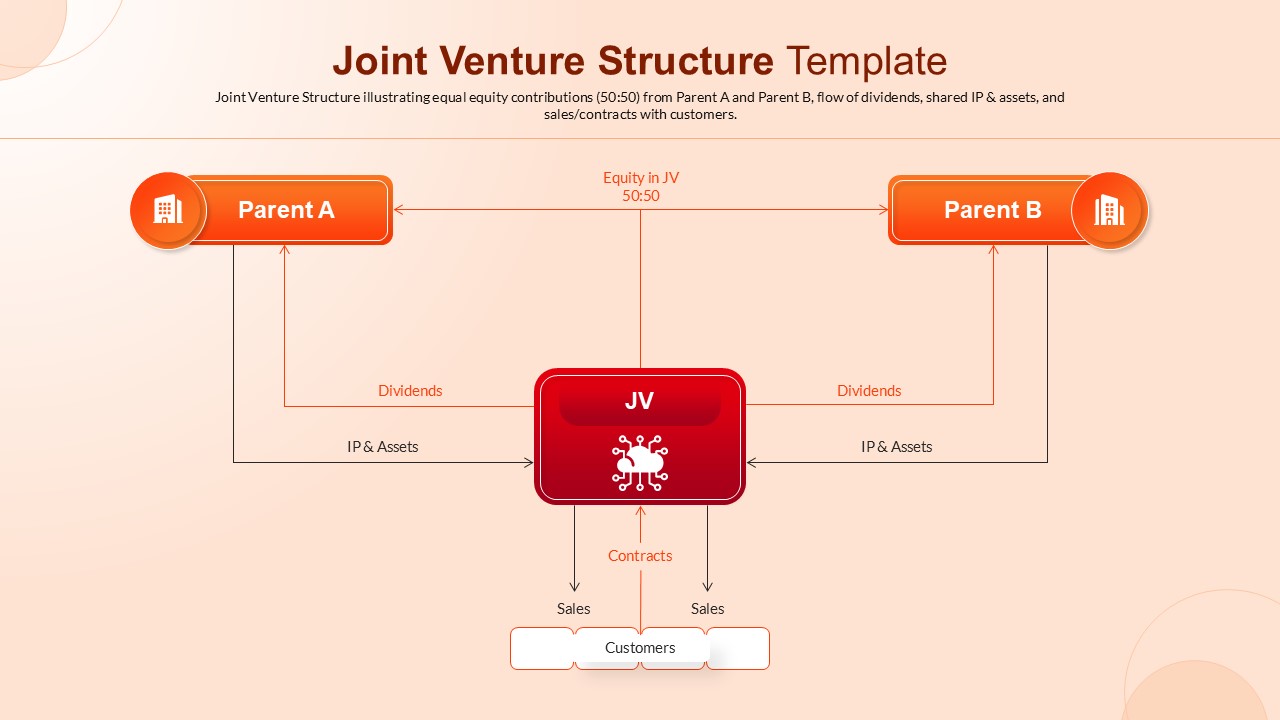
Joint Venture Structure Diagram Template for PowerPoint & Google Slides
Flow Charts
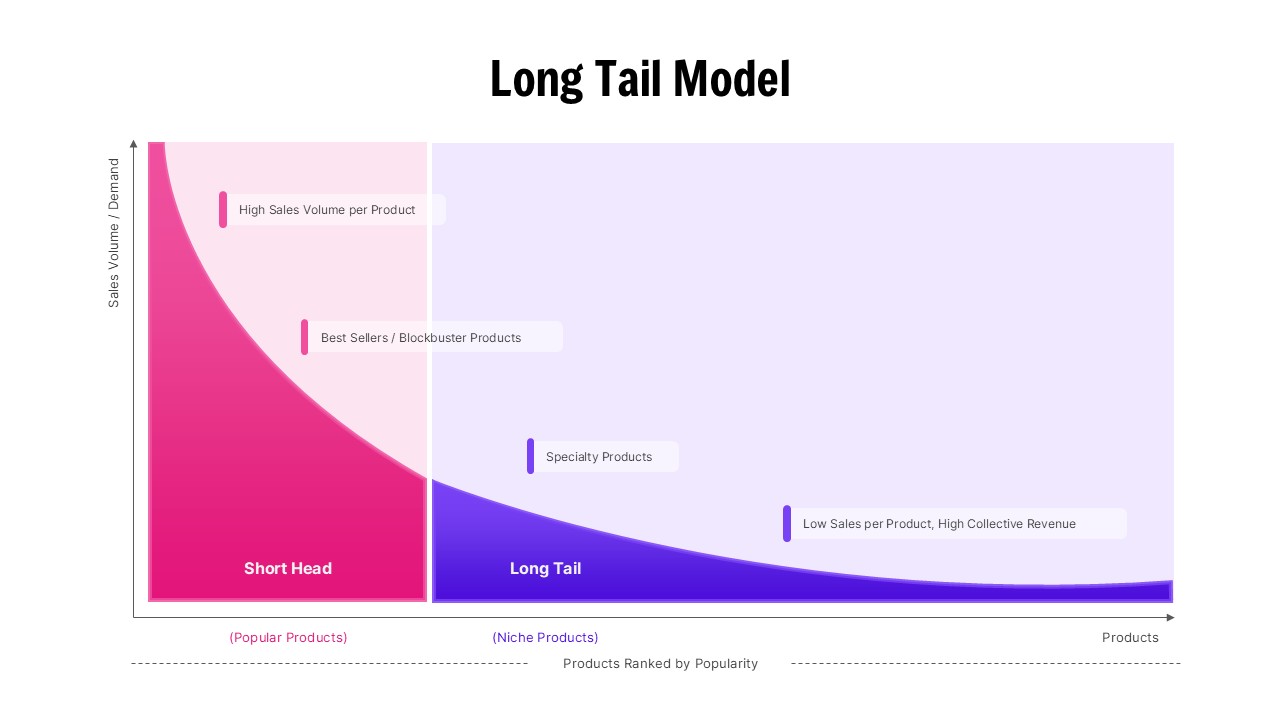
Long Tail Model Business Strategy Diagram Template for PowerPoint & Google Slides
Business