Fishbone Cause and Effect Diagram Template for PowerPoint & Google Slides

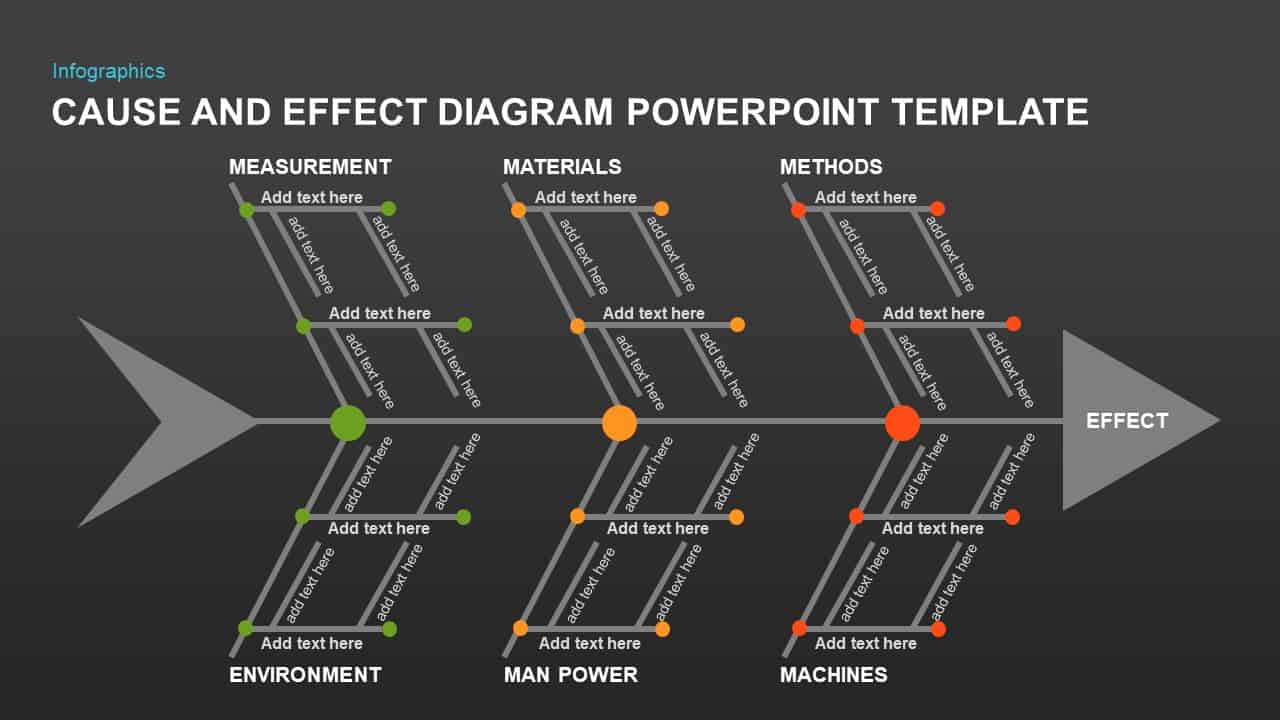
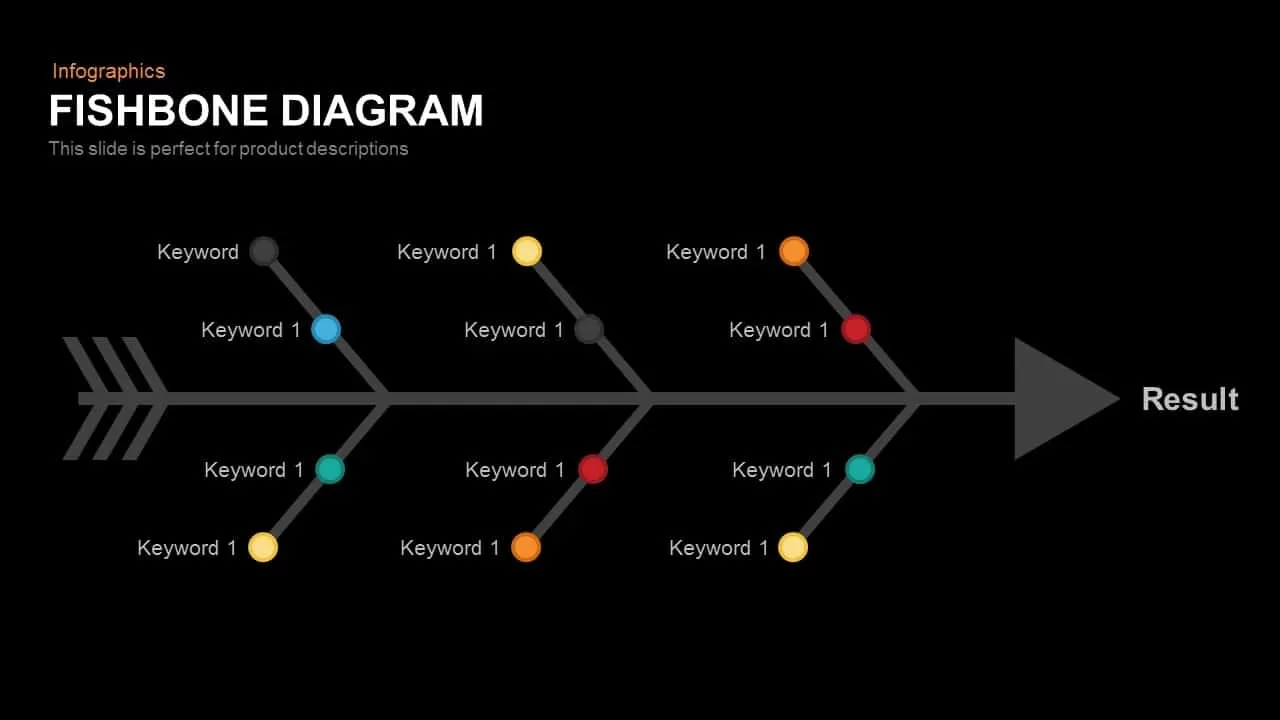
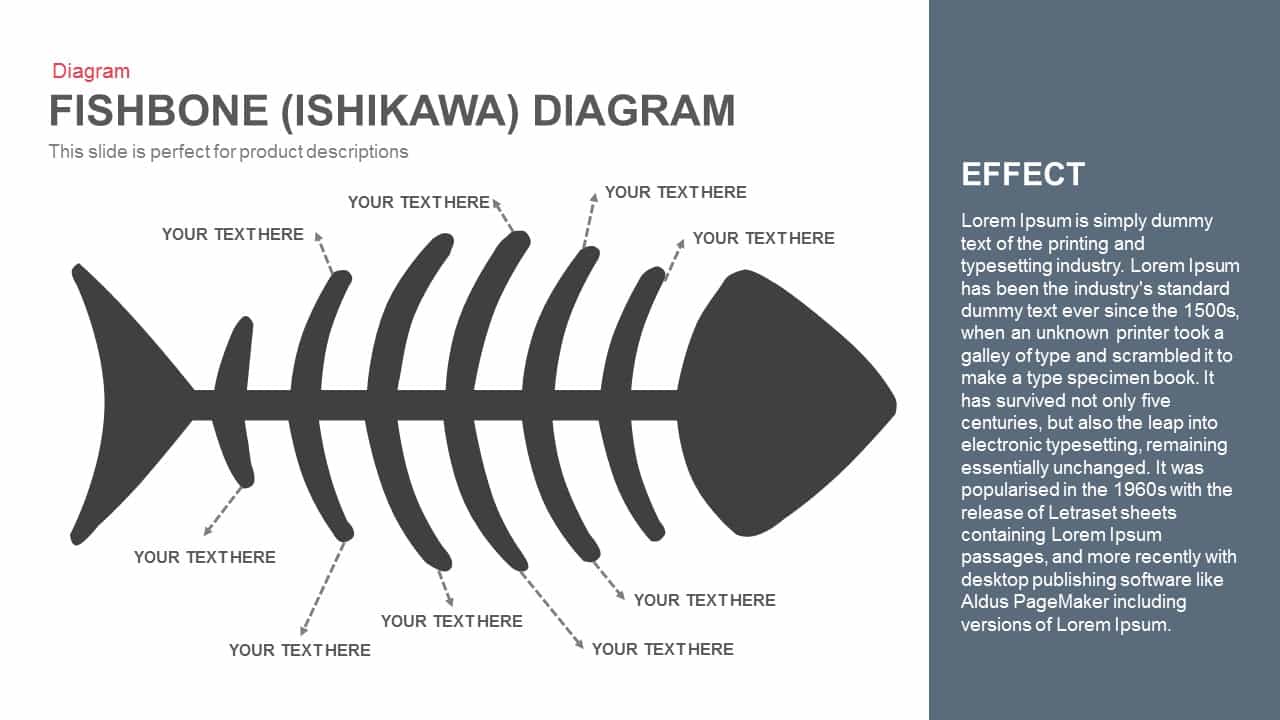
Analyze complex root causes and drive continuous improvement with this professional fishbone (Ishikawa) diagram slide. The sleek horizontal backbone features a bold left-pointing arrow labeled “Effect,” while six editable angled ribs represent core cause categories—Measurement, Materials, Methods, Machines, Man Power, and Environment—each with dual text placeholders along upper and lower branches. Small circular markers highlight junctions, and clean text fields allow for clear annotation of contributing factors without clutter. The minimalist layout balances white space with precise alignment, guiding audiences through each causal path to the central outcome.
Built entirely with vector shapes and integrated into master slides, every bone, node, and text field is fully editable in seconds. Adjust colors, swap category labels, reposition branches, or change marker styles to match your branding. The flat design aesthetic, crisp sans-serif typography, and subtle drop shadows ensure a modern, professional look across PowerPoint and Google Slides. Scalable graphics maintain clarity from HD projectors to printed handouts, eliminating formatting headaches and preserving layout integrity during rapid updates.
Ideal for quality managers, process engineers, and project teams, this template streamlines root cause analysis, defect investigations, and risk assessments by providing a structured visual framework. Use it during Kaizen workshops, Six Sigma reports, or stakeholder briefings to identify bottlenecks and prioritize action plans. Duplicate or remove ribs to expand beyond six categories, overlay icon callouts for quantitative insights, or merge bone segments to explore sub-cause relationships. Its intuitive bone structure also adapts well to brainstorming sessions, training modules, and performance reviews, turning intricate data into an actionable visual narrative that engages stakeholders and drives consensus.
Who is it for
Quality assurance managers, process engineers, and project teams will benefit from this slide when conducting root cause analyses, defect investigations, and risk assessments. Continuous improvement leaders and operations directors can also leverage the fishbone framework to facilitate structured problem-solving sessions and workshop activities.
Other Uses
Beyond root cause analysis, repurpose this template for risk-assessment matrices, compliance audits, or feature-prioritization charts. Swap labels to represent project drivers, duplicate ribs for additional categories, or recolor nodes to highlight high-priority issues and corrective actions.
Login to download this file

Item ID
SB01154
Related Templates

Fishbone Diagram Cause-and-Effect Template for PowerPoint & Google Slides
Process
Underwater Fishbone Cause-Effect Diagram Template for PowerPoint & Google Slides
Process
Fishbone Cause and Effect Infographic Template for PowerPoint & Google Slides
Infographics

Cause and Effect Diagram Infographic Template for PowerPoint & Google Slides
Bar/Column
Cause and Effect Template for PowerPoint & Google Slides
Arrow
Fishbone Cause Analysis Diagram Template for PowerPoint & Google Slides
Process
Free Root Cause Analysis PowerPoint Template
Process
Free
5 Why Fishbone Diagram for Root Cause Analysis in PowerPoint & Google Slides
Process
Snowball Effect Process Diagram Template for PowerPoint & Google Slides
Process
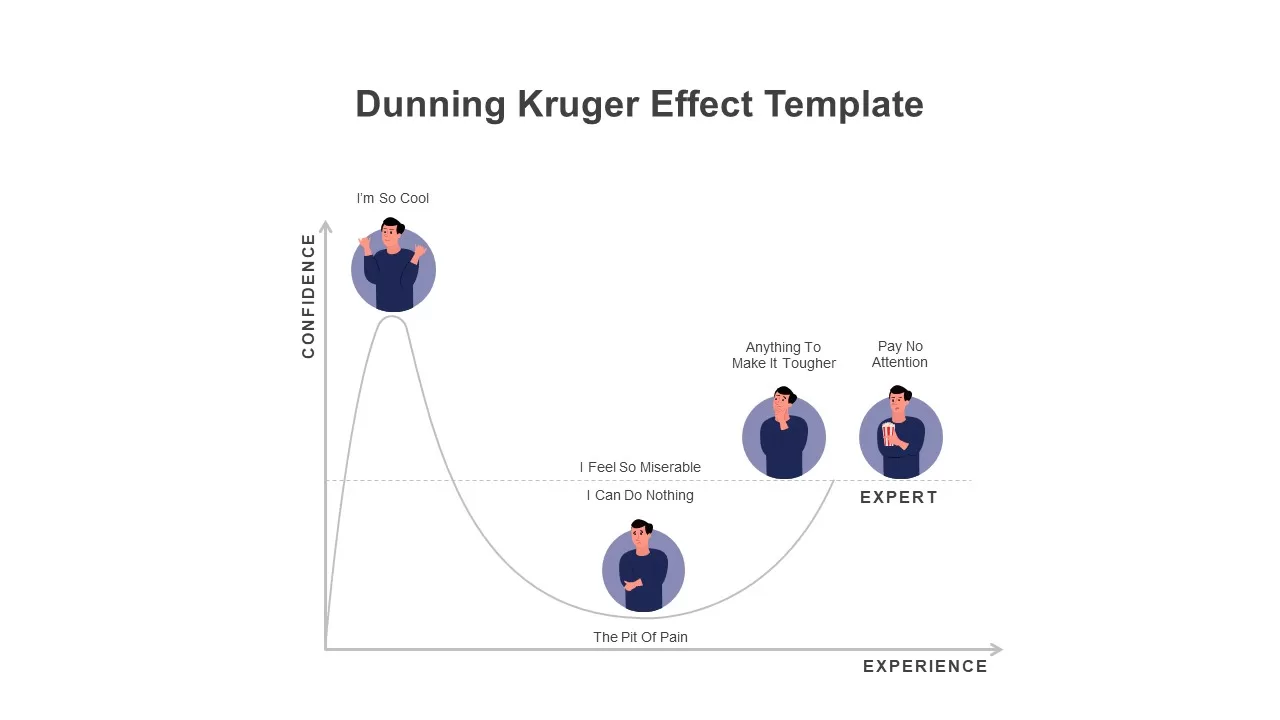
Modern Dunning Kruger Effect Diagram Template for PowerPoint & Google Slides
Business
5Cs of Network Effect Circular Diagram Template for PowerPoint & Google Slides
Circular
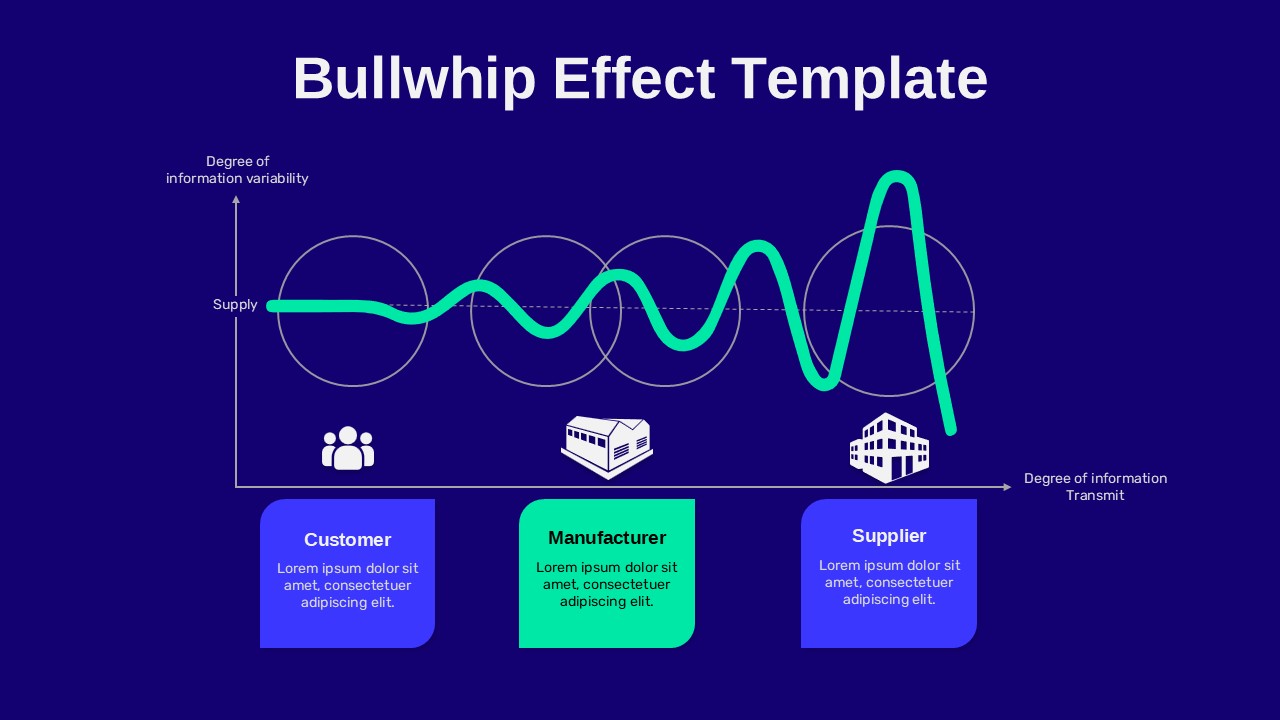
Bullwhip Effect Supply Chain Variability Diagram Template for PowerPoint & Google Slides
Business Models
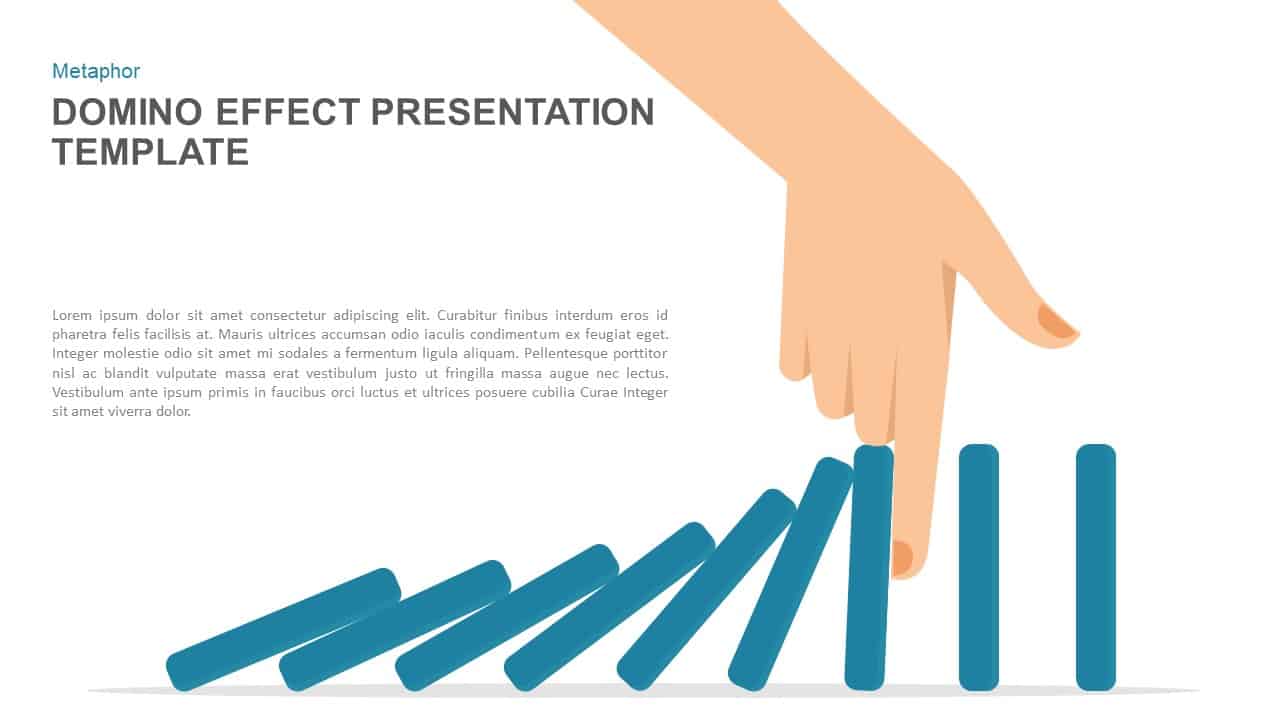
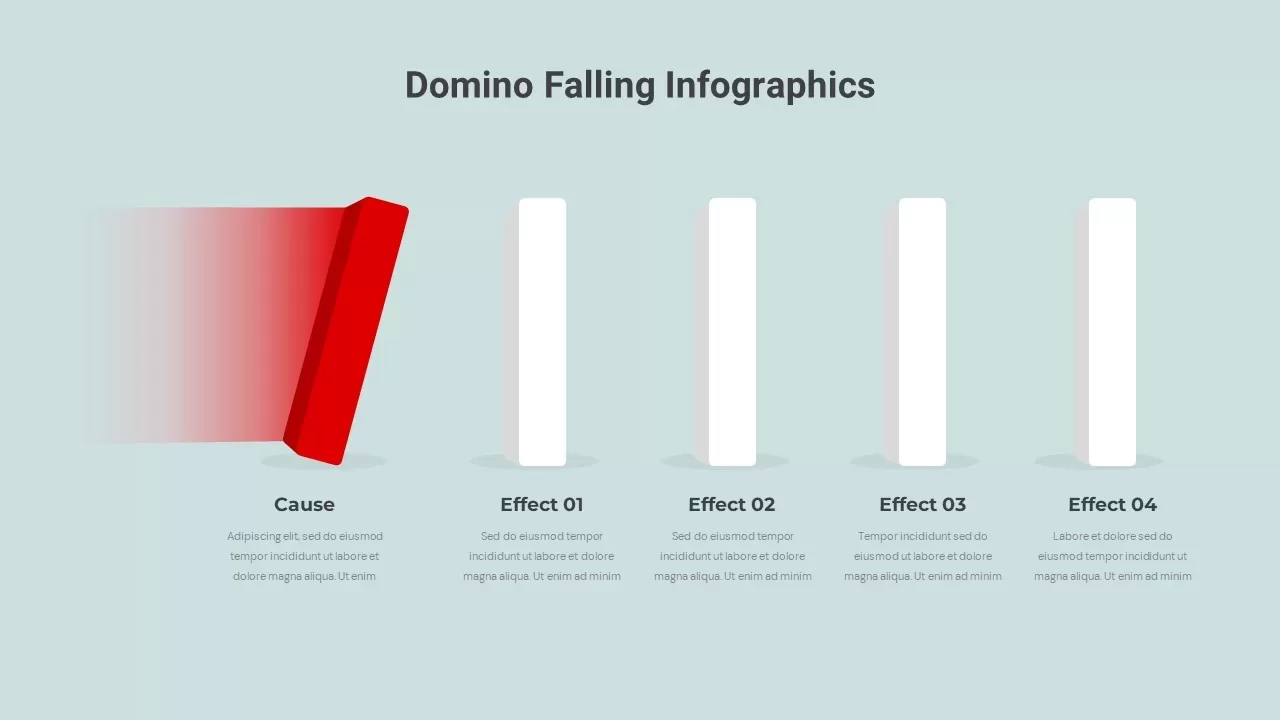
Domino Effect Prevention Presentation Template for PowerPoint & Google Slides
Process
Domino Effect Sequential Infographics Template for PowerPoint & Google Slides
Process
Three-Section Fishbone Process Diagram template for PowerPoint & Google Slides
Process
Fishbone RCA Diagram Template for PowerPoint & Google Slides
Business Strategy
Fishbone Diagram Overview template for PowerPoint & Google Slides
Infographics
Free Fishbone Diagram PowerPoint Template
Project
Free
Fishbone Diagram Analysis Template for PowerPoint & Google Slides
Flow Charts
Fishbone Process Diagram template for PowerPoint & Google Slides
Infographics
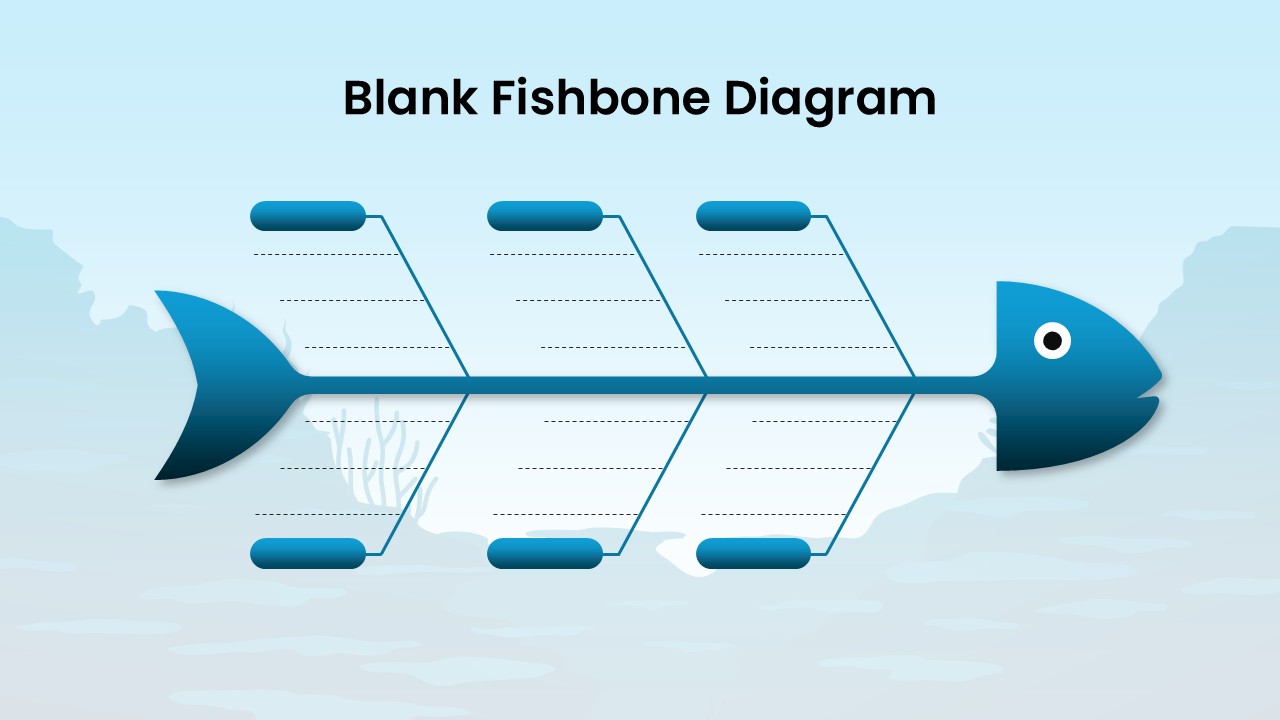
Blank Fishbone Diagram Template for PowerPoint & Google Slides
Process
Fishbone (Ishikawa) Diagram for PowerPoint & Google Slides
Process
Fishbone Timeline Template
Manufacturing
Root Cause Analysis PowerPoint & Google Slides Template for Presentations
Business Strategy
Sky and Tree Root Cause Analysis Deck Template for PowerPoint & Google Slides
Opportunities Challenges
Root Cause Analysis Infographic Pack Template for PowerPoint & Google Slides
Process
Snake Diagram PowerPoint Template and Google Slide Template
Process
Gear Process Diagram PowerPoint Template for PowerPoint & Google Slides
Process
Sales Process Workflow Funnel Diagram PowerPoint Template for PowerPoint & Google Slides
Funnel
Puzzle Diagram PowerPoint Template for PowerPoint & Google Slides
Process
Transportation Logistics PowerPoint Diagram template for PowerPoint & Google Slides
Process
Emoji Scale PowerPoint Diagram for PowerPoint & Google Slides
Infographics
4 Step Problem Solving PowerPoint Diagram for PowerPoint & Google Slides
Process

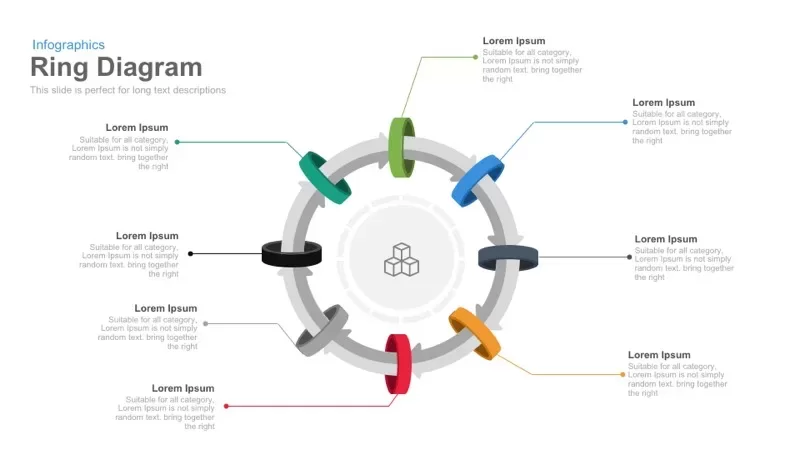
8 Circular Ring Diagram template for PowerPoint & Google Slides
Infographics
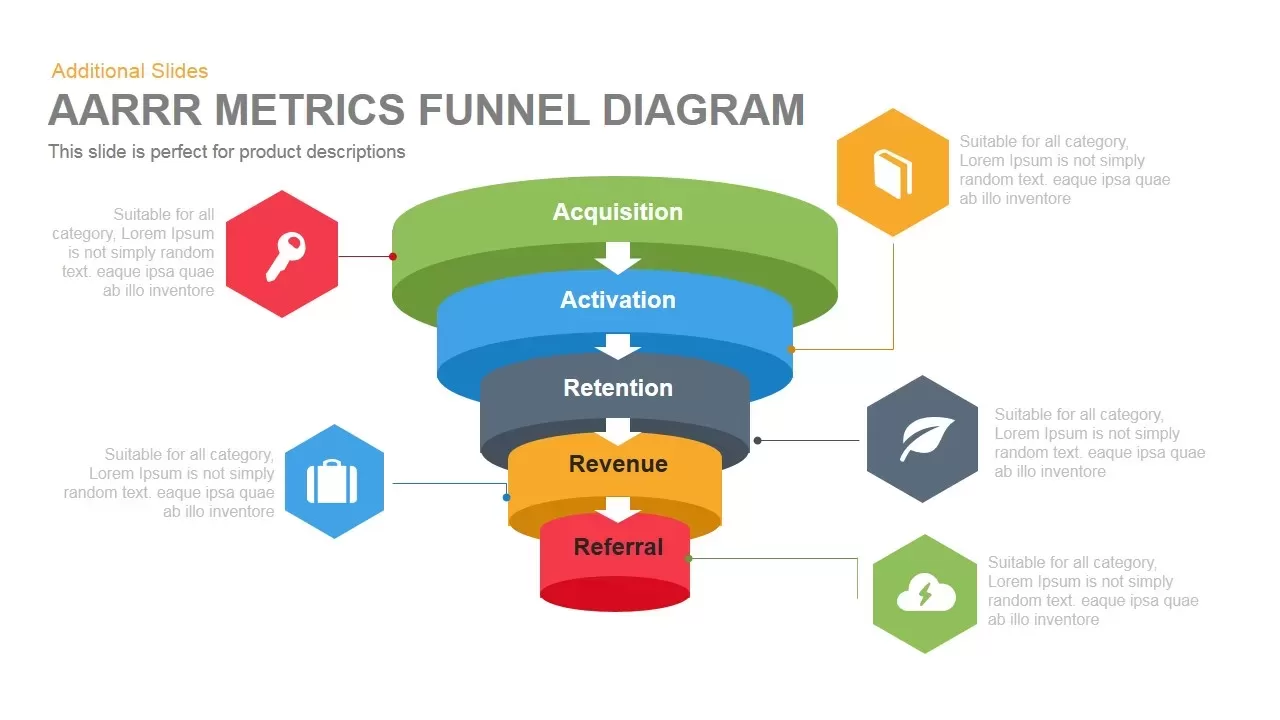
AARRR Funnel Diagram template for PowerPoint & Google Slides
Funnel
Diamond Mind Map Diagram Four Branches Template for PowerPoint & Google Slides
Mind Maps
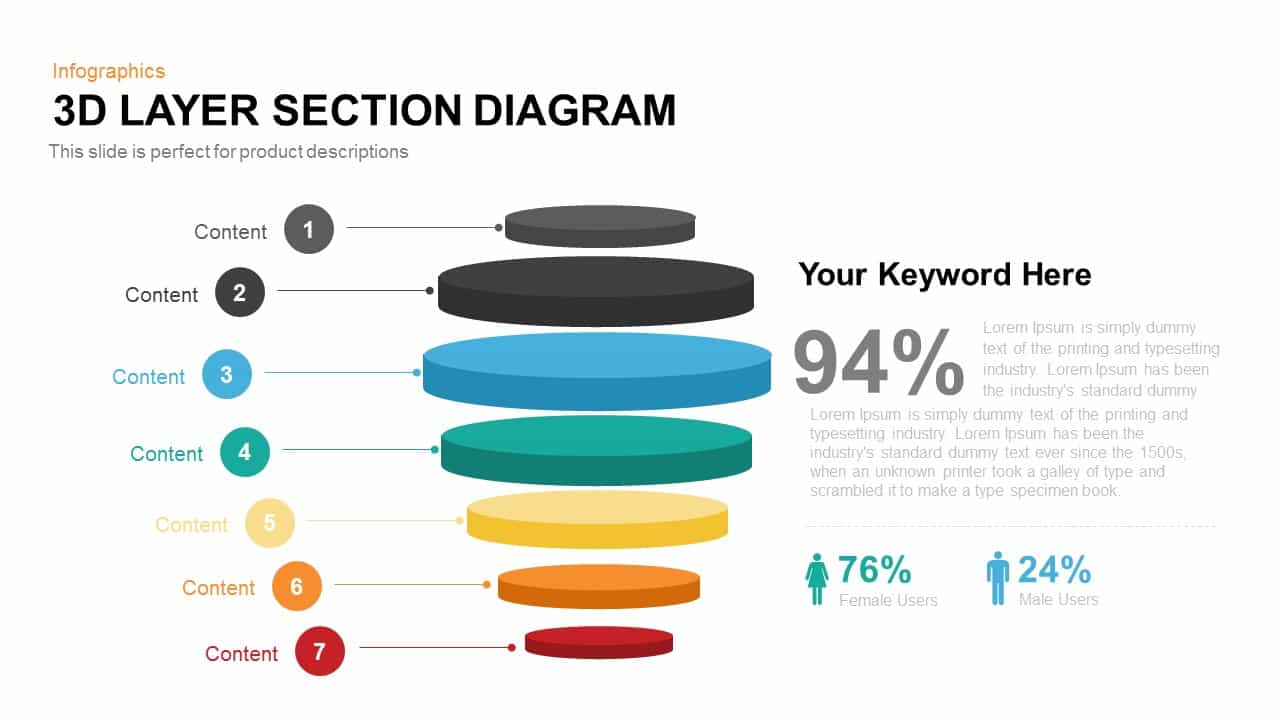
Modern 3D Layer Section Diagram Template for PowerPoint & Google Slides
Circular
Six Section Circular Infographic Diagram Template for PowerPoint & Google Slides
Circular
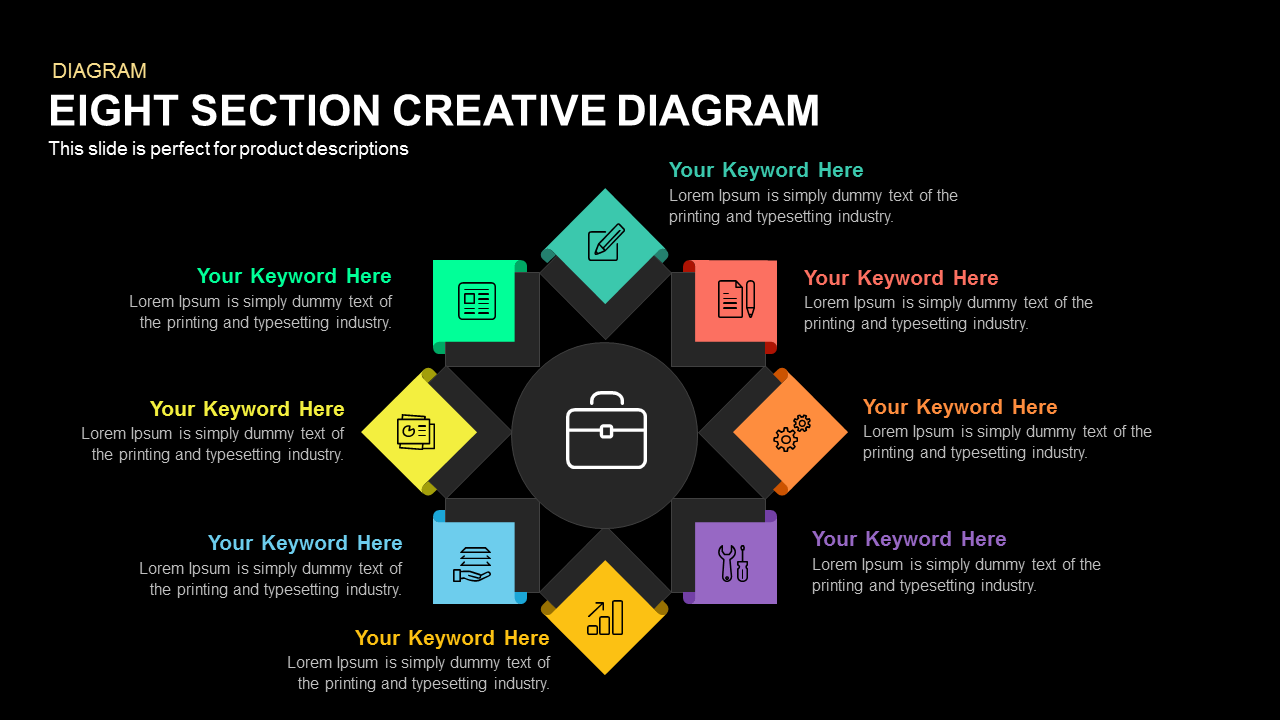
Eight-Section Circular Diagram template for PowerPoint & Google Slides
Circular
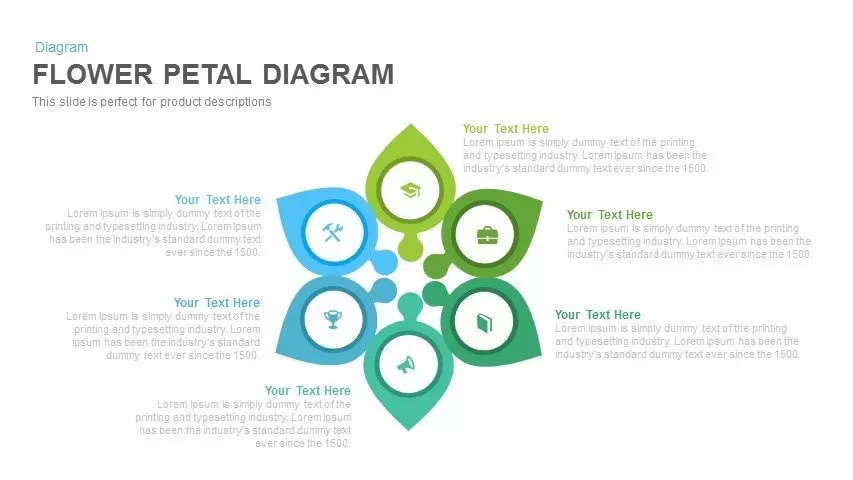
Six-Segment Flower Petal Diagram Template for PowerPoint & Google Slides
Circular

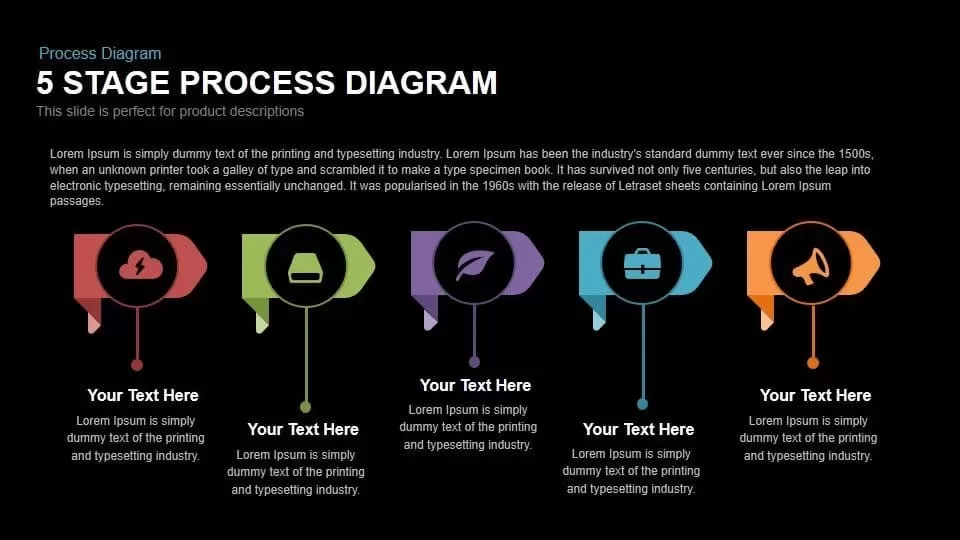
5 Stage Process Diagram Slide Overview Template for PowerPoint & Google Slides
Process
Pie Segment Diagram Four-Step Process Template for PowerPoint & Google Slides
Pie/Donut
Professional 4-Piece 3D Pyramid Diagram Template for PowerPoint & Google Slides
Pyramid
Four-Stage Linear Infographic Diagram Template for PowerPoint & Google Slides
Process
Business Section Diamond Process Diagram Template for PowerPoint & Google Slides
Process
Two-Stage Semi-Circle Diagram Overview Template for PowerPoint & Google Slides
Circular
Timeline Arrow Infographics Diagram Template for PowerPoint & Google Slides
Timeline
Multidirectional Process Diagram template for PowerPoint & Google Slides
Process
Cylinder Infographic Diagram template for PowerPoint & Google Slides
Process
Six Staged Circle Diagram template for PowerPoint & Google Slides
Circular

Ten-Piece Circular Puzzle Diagram Template for PowerPoint & Google Slides
Circular
Five-Level Staged Pyramid Diagram Template for PowerPoint & Google Slides
Pyramid
Eight-Step Circular Diagram Infographic Template for PowerPoint & Google Slides
Circular

Interactive Gap Analysis Puzzle Diagram Template for PowerPoint & Google Slides
Gap
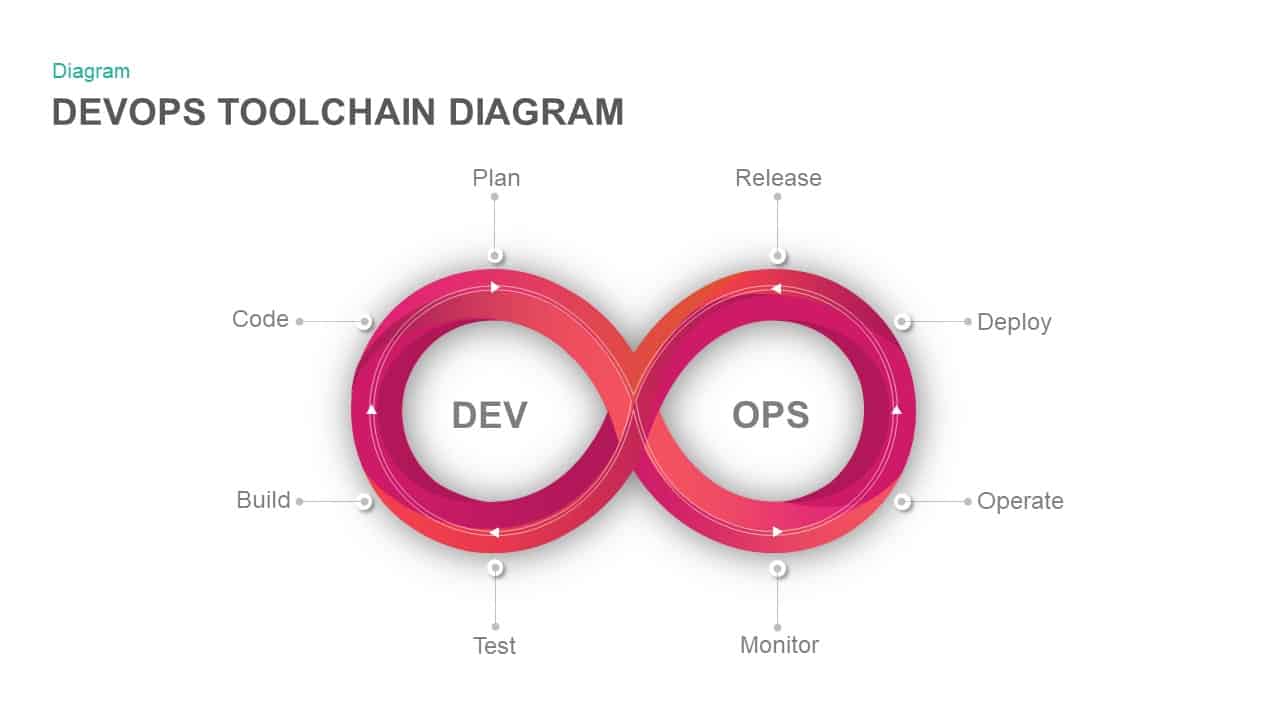
DevOps Infinity Loop Process Diagram Template for PowerPoint & Google Slides
Process
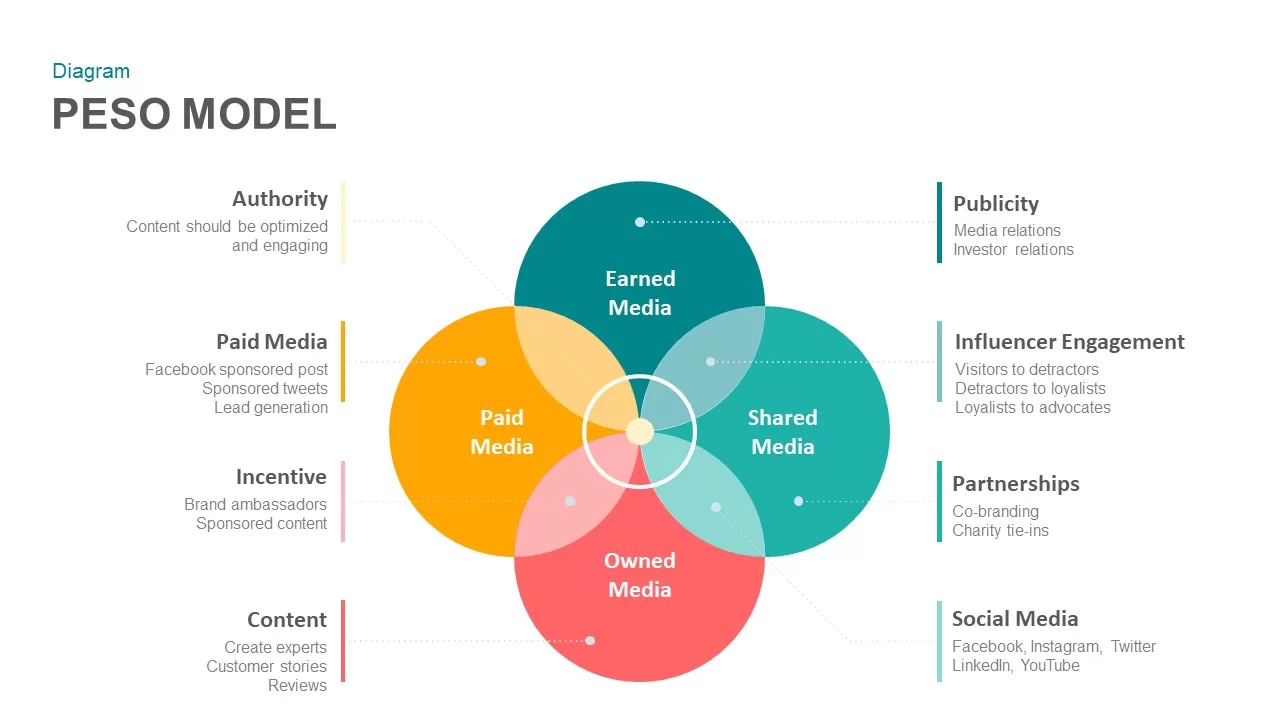
PESO Model PowerPoint Template
Digital Marketing
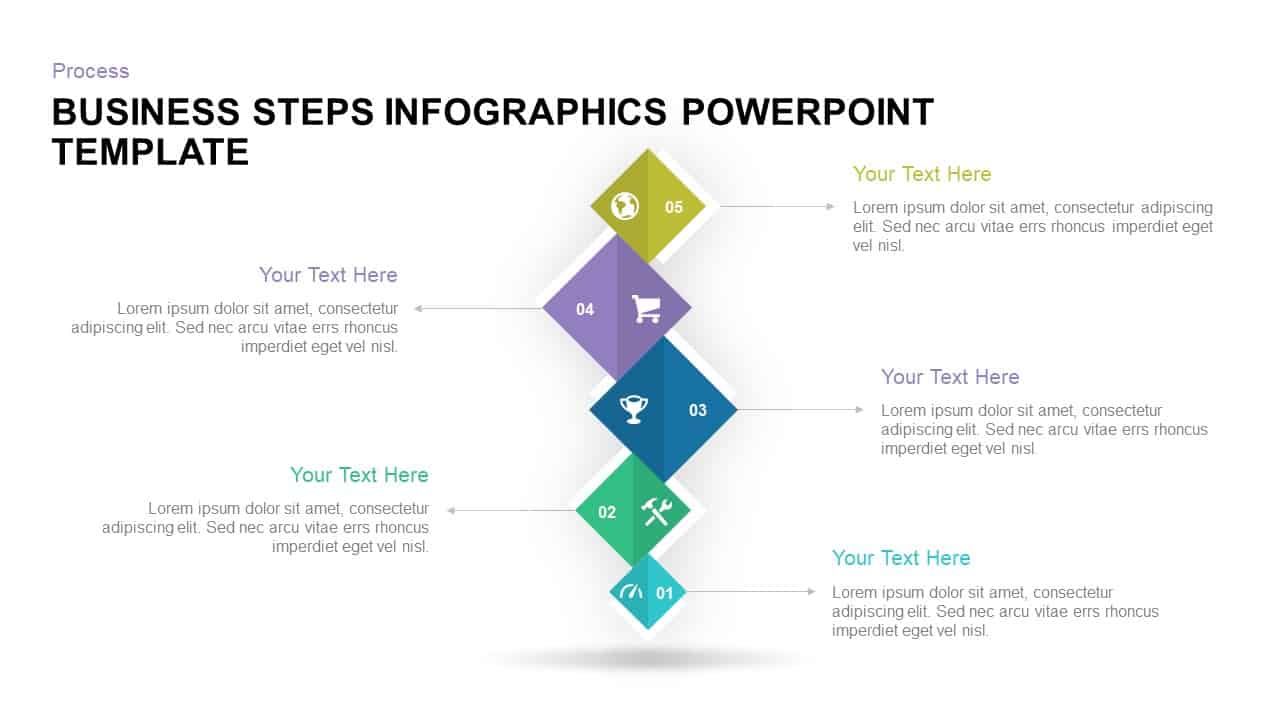
Five-Step Diamond Process Diagram Template for PowerPoint & Google Slides
Process
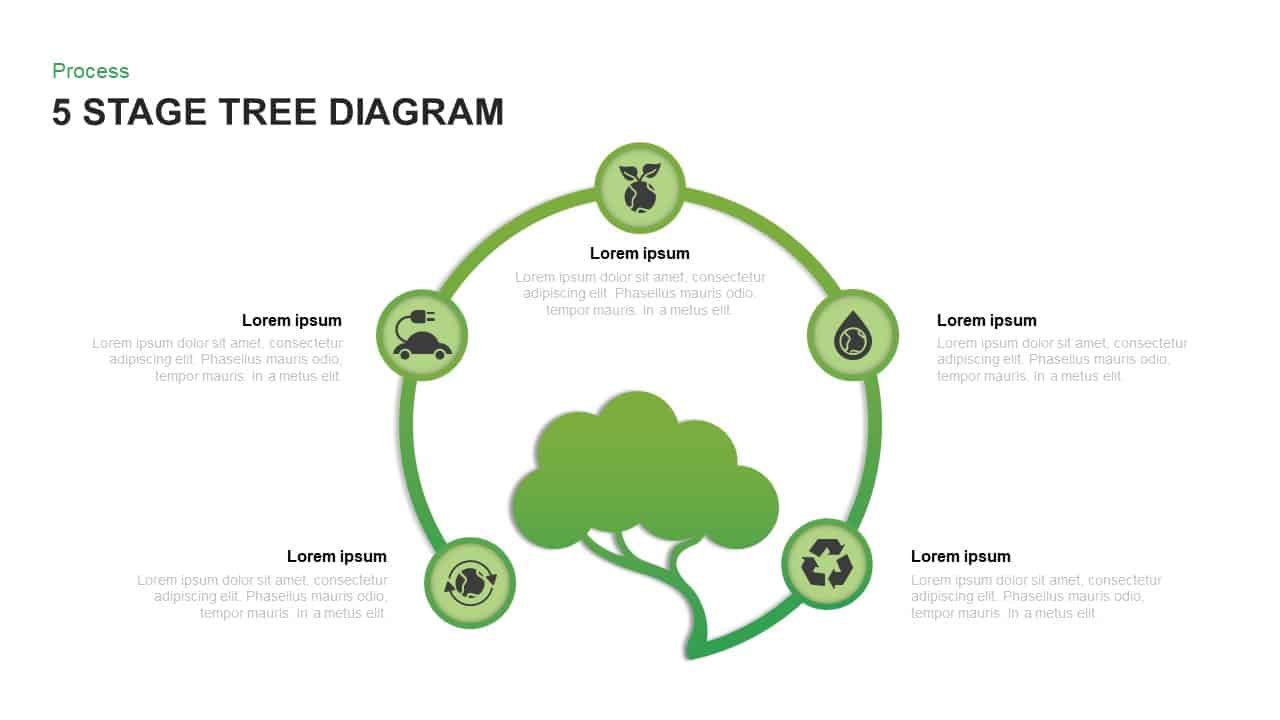
Five-Stage Eco Tree Process Diagram Template for PowerPoint & Google Slides
Process
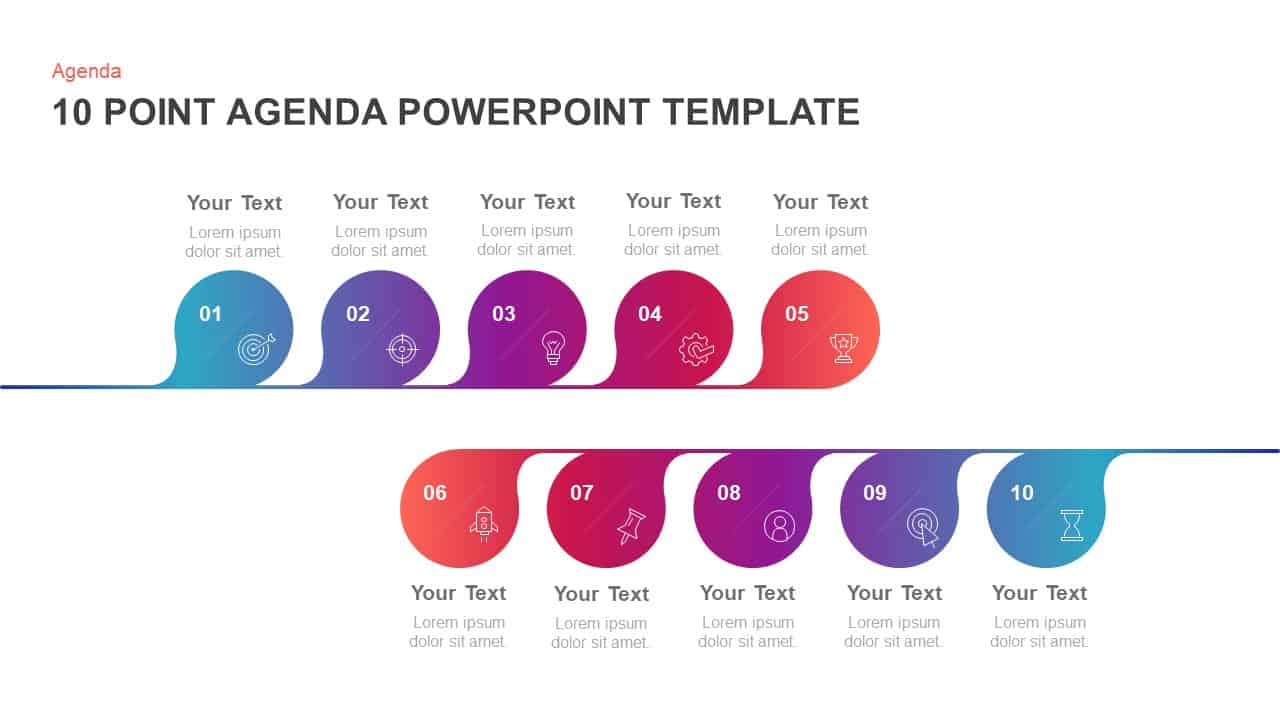
10-Point Gradient Agenda Flow Diagram Template for PowerPoint & Google Slides
Agenda
Business Services Infographic Diagram Template for PowerPoint & Google Slides
Infographics
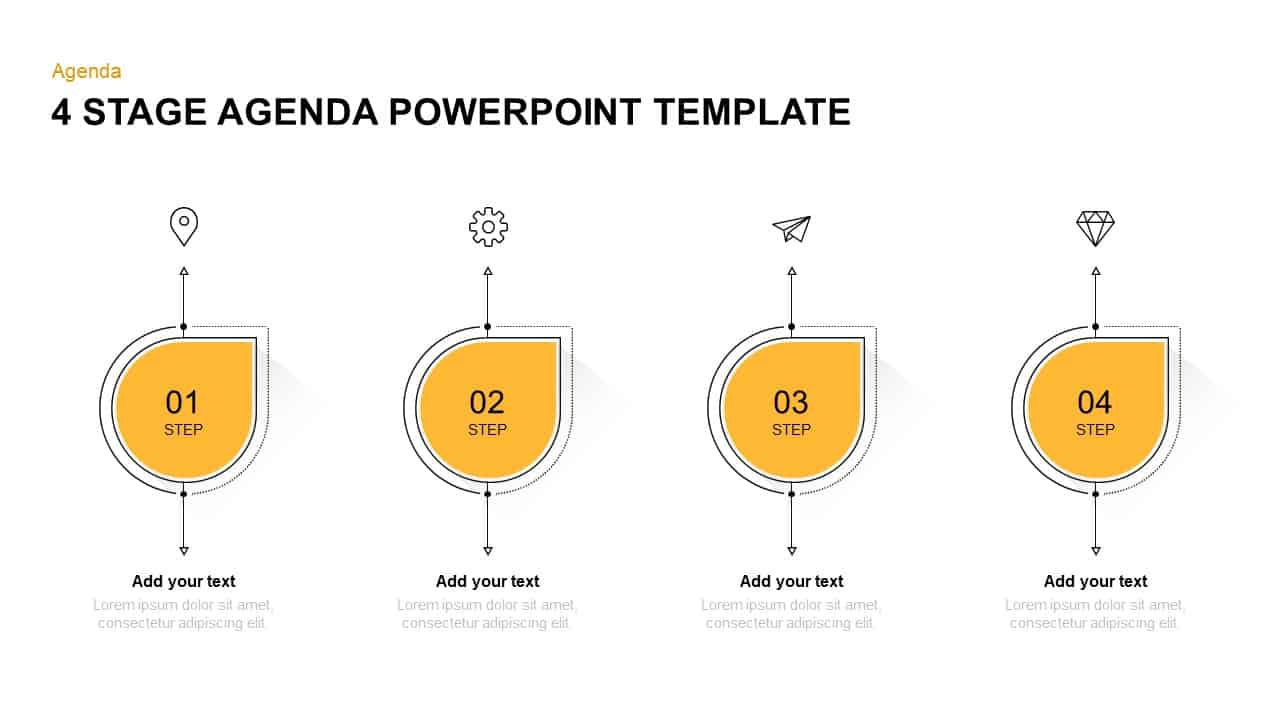
4-, 5- & 6-Stage Agenda Diagram Template for PowerPoint & Google Slides
Agenda
Circular Three-Step Infographic Diagram Template for PowerPoint & Google Slides
Circular
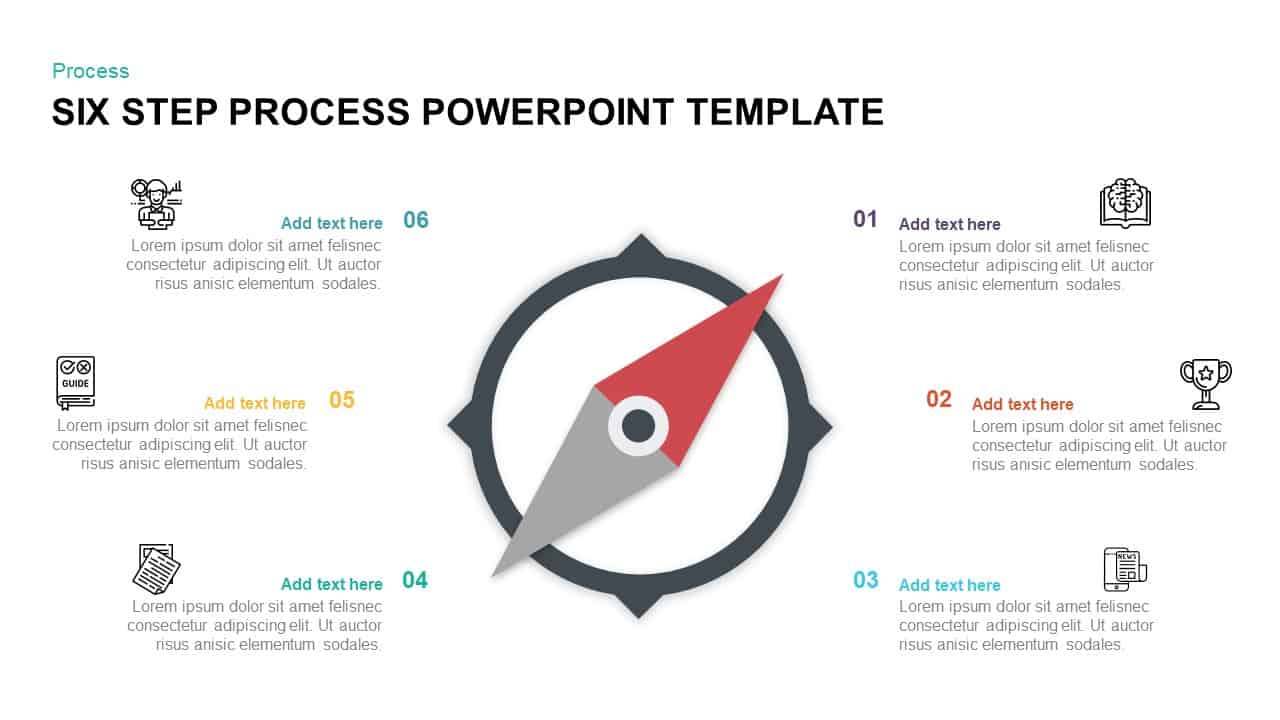
Compass-Themed Six-Step Process Diagram Template for PowerPoint & Google Slides
Process
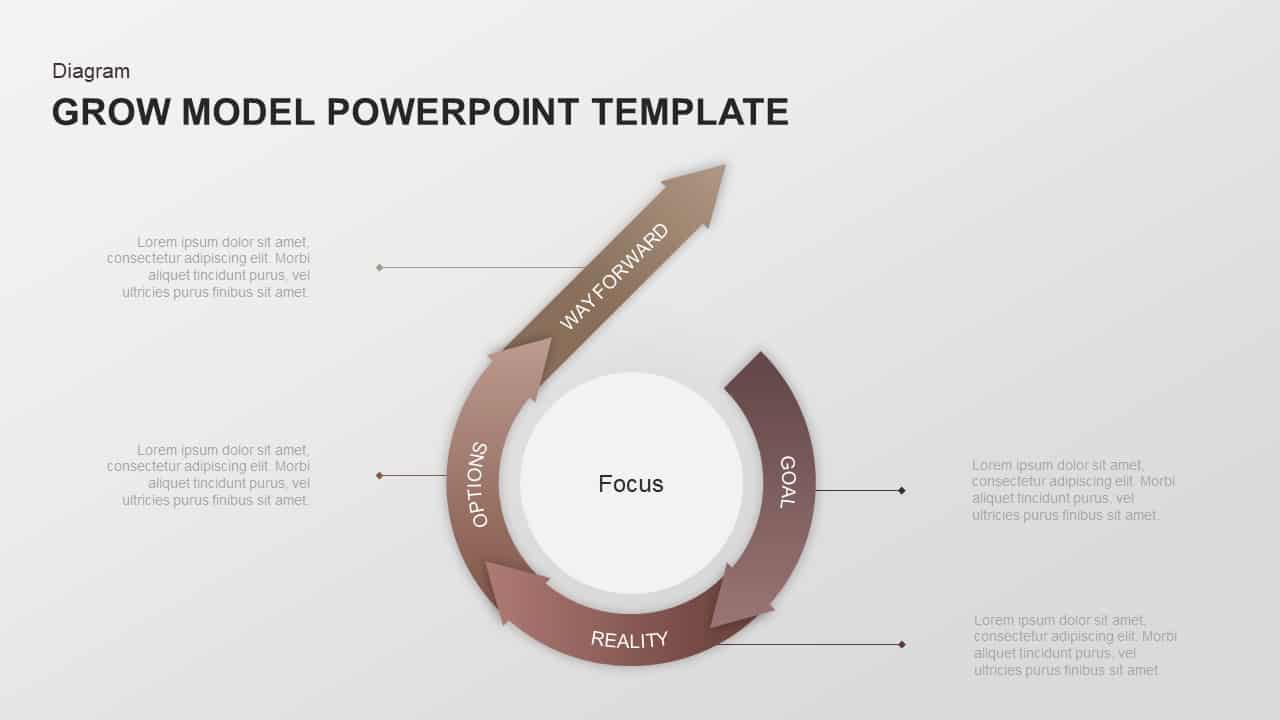
GROW Coaching Framework Diagram Template for PowerPoint & Google Slides
Process
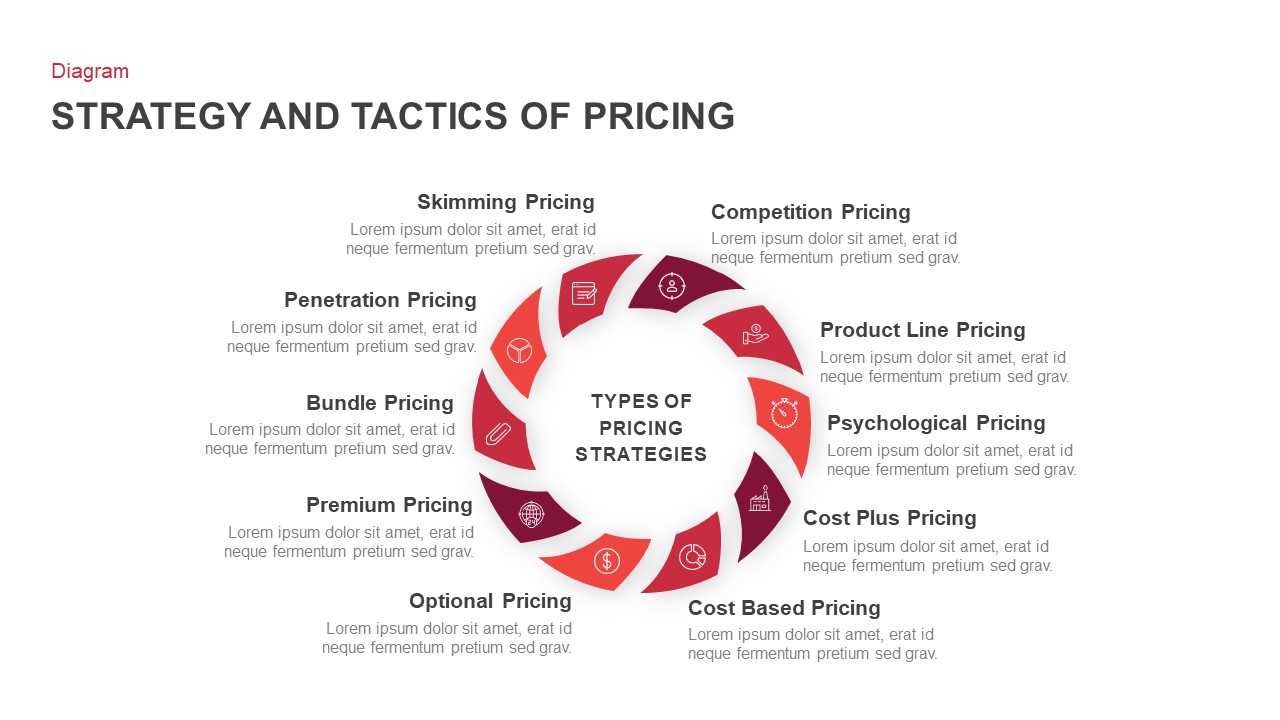
Pricing Strategy and Tactics Diagram Template for PowerPoint & Google Slides
Circular
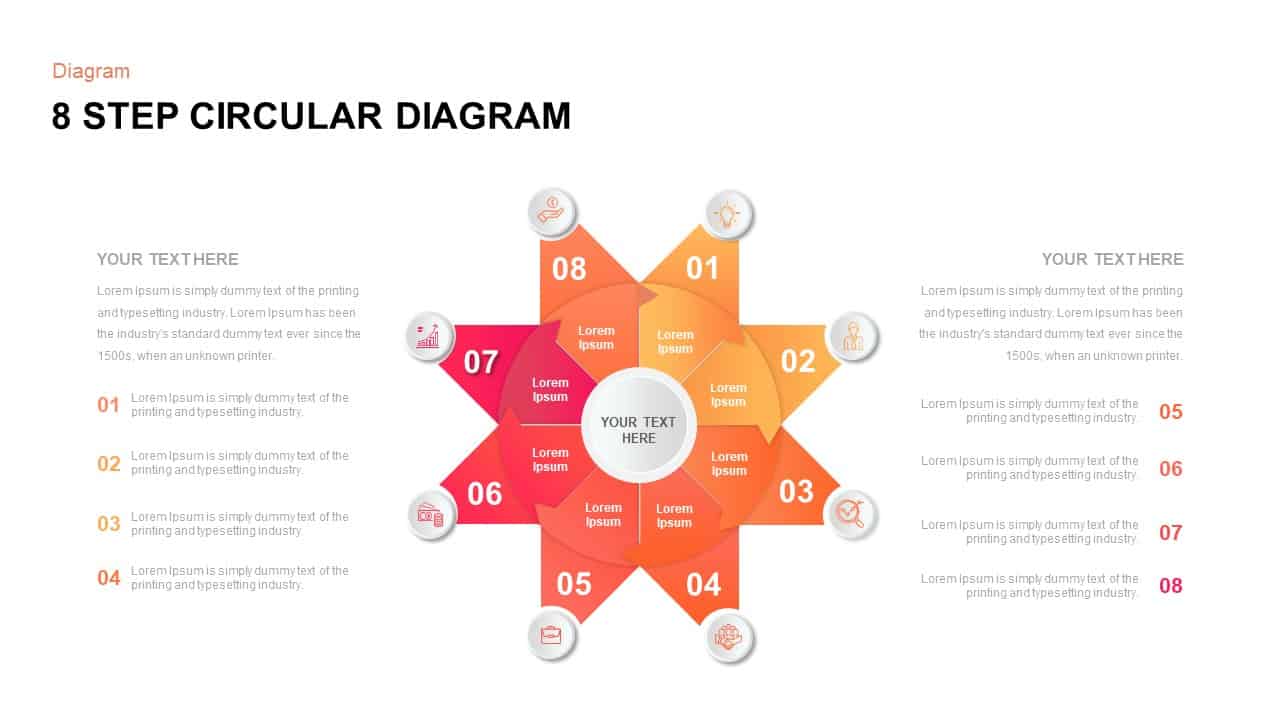
Eight Step Circular Diagram Template for PowerPoint & Google Slides
Circular
4-Step Linear Process Flow Diagram Template for PowerPoint & Google Slides
Process
Six Sigma 6S Process Infographic Diagram Template for PowerPoint & Google Slides
Process
Four Section Diagram Infographics template for PowerPoint & Google Slides
Process
4 Types of Business Structure PowerPoint Template
Business Strategy

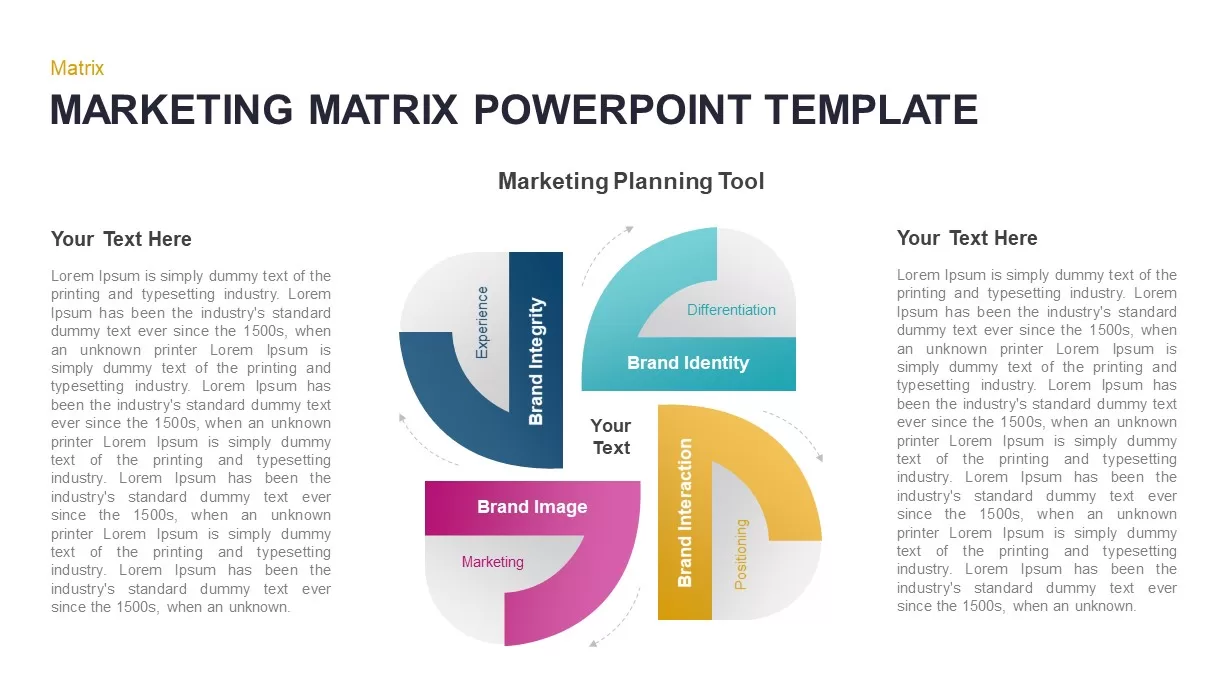
Marketing Matrix Brand Quadrant Diagram Template for PowerPoint & Google Slides
Process
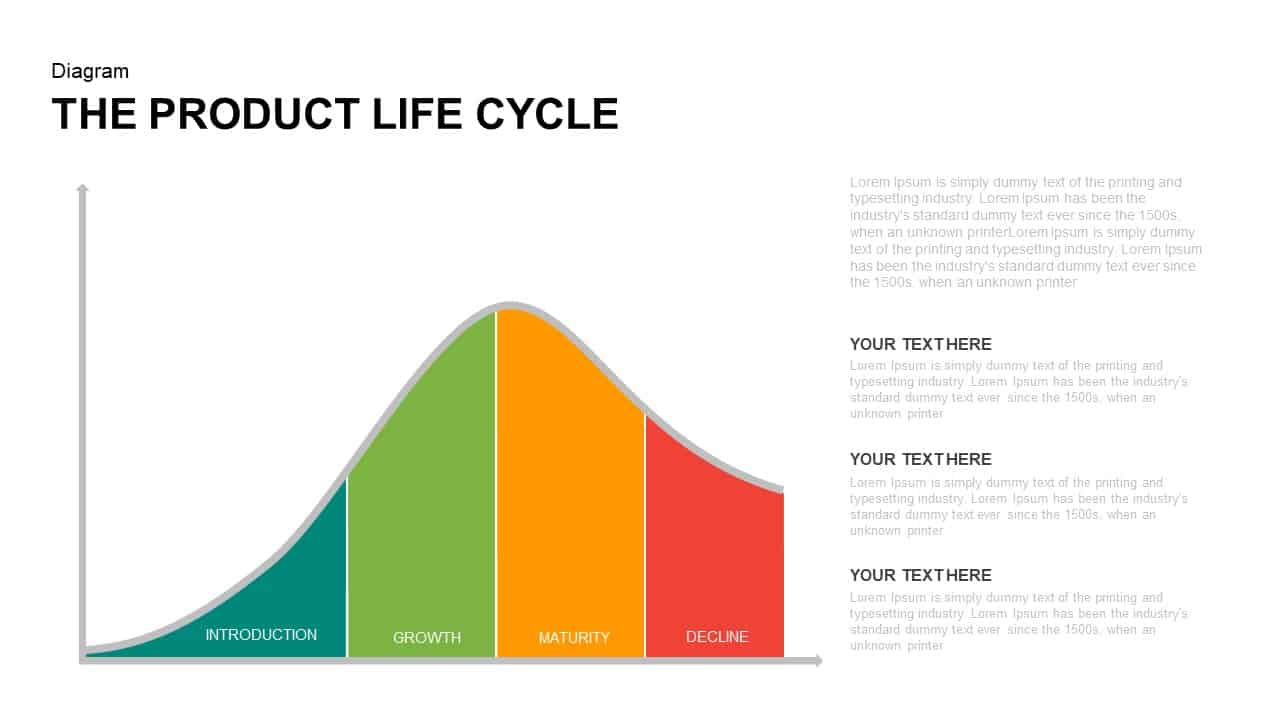
Corporate Product Life Cycle Diagram Template for PowerPoint & Google Slides
Process
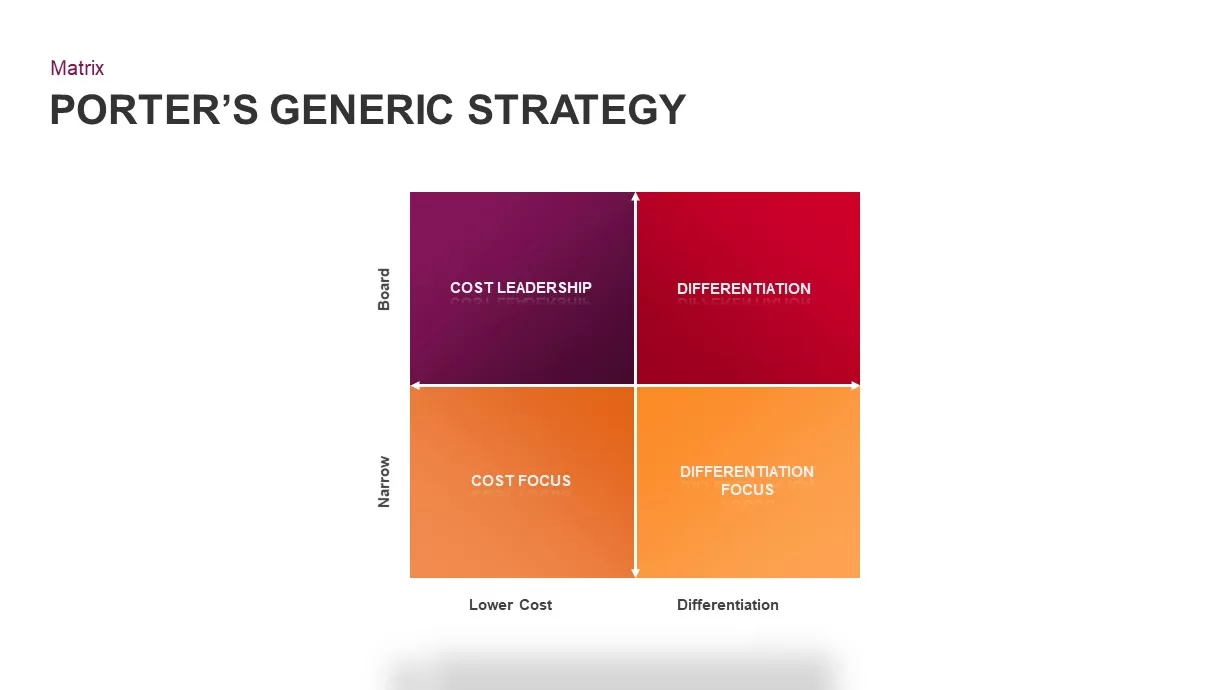
Porter’s Generic Strategy Matrix Diagram Template for PowerPoint & Google Slides
Competitor Analysis
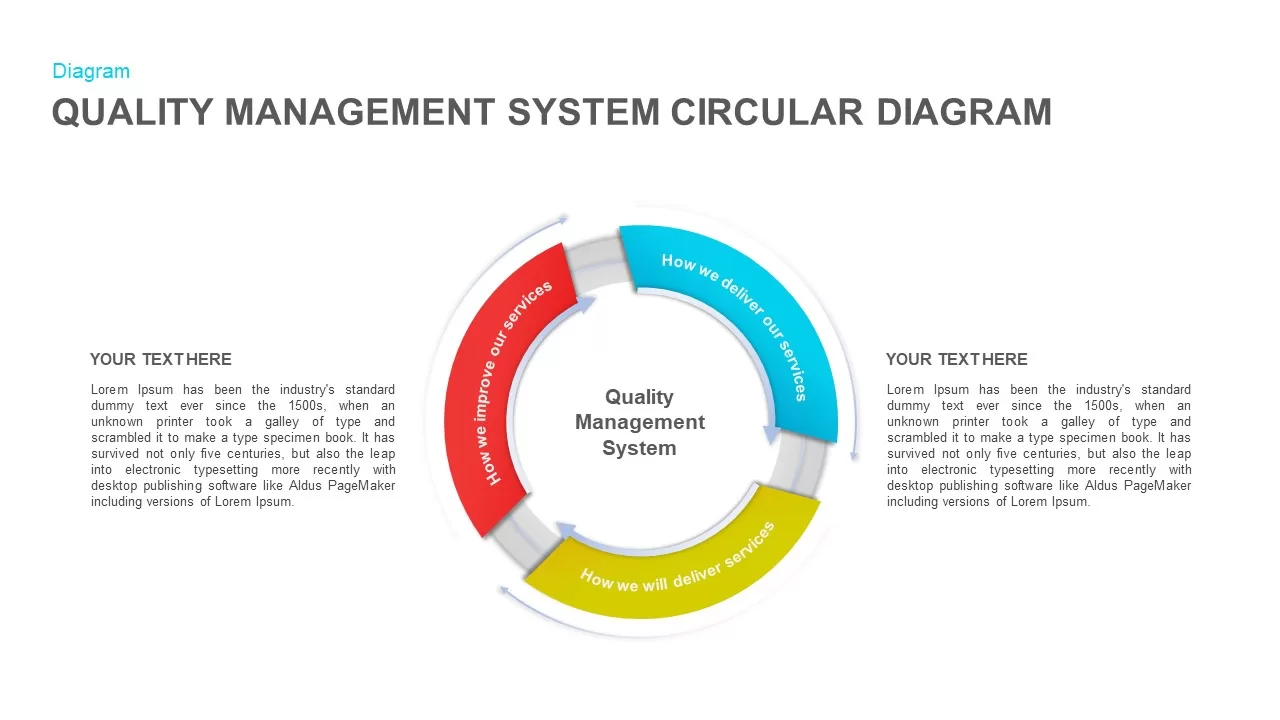
Quality Management System Circular Diagram template for PowerPoint & Google Slides
Process
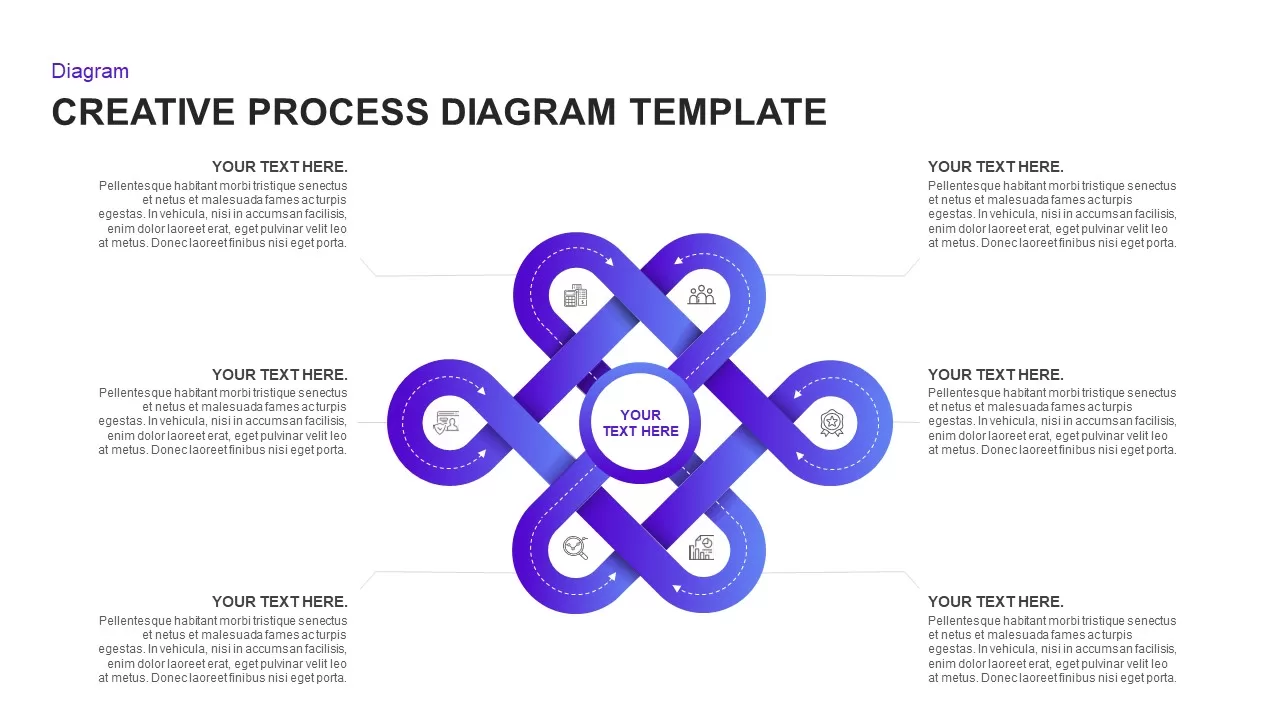
Creative Infinity Loop Process Diagram Template for PowerPoint & Google Slides
Process
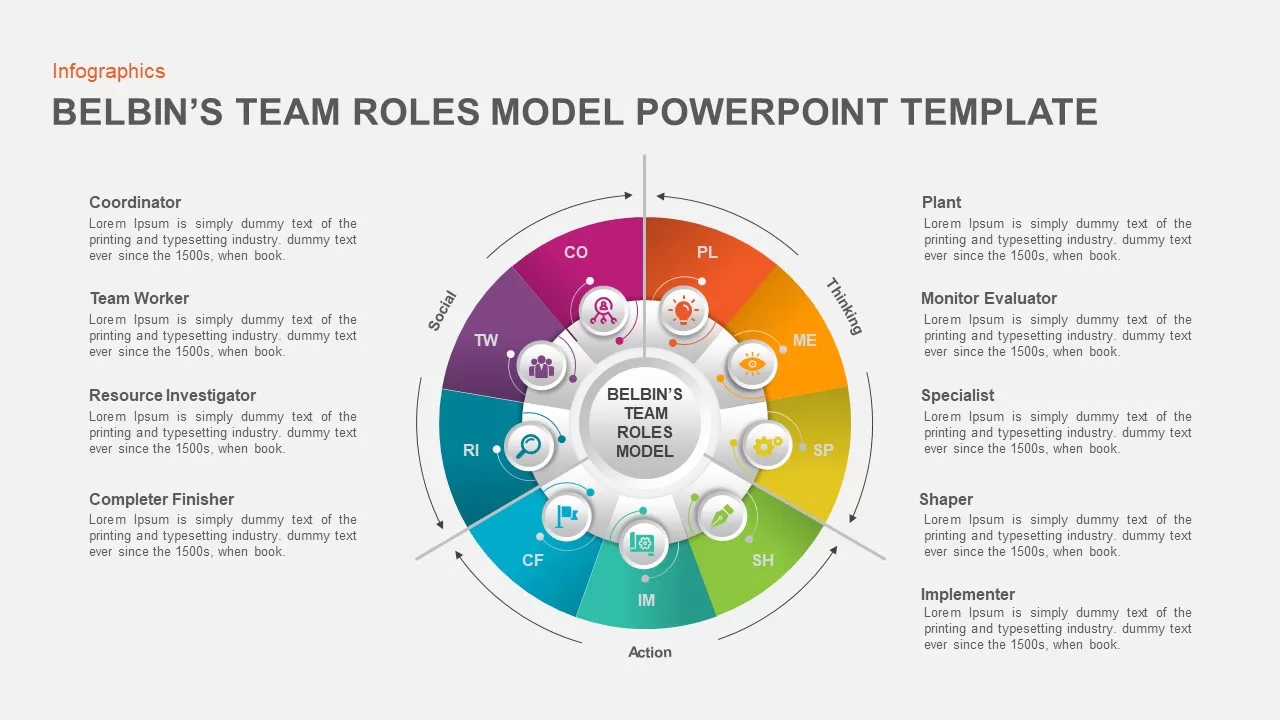
Belbin Team Roles Diagram for PowerPoint & Google Slides
HR
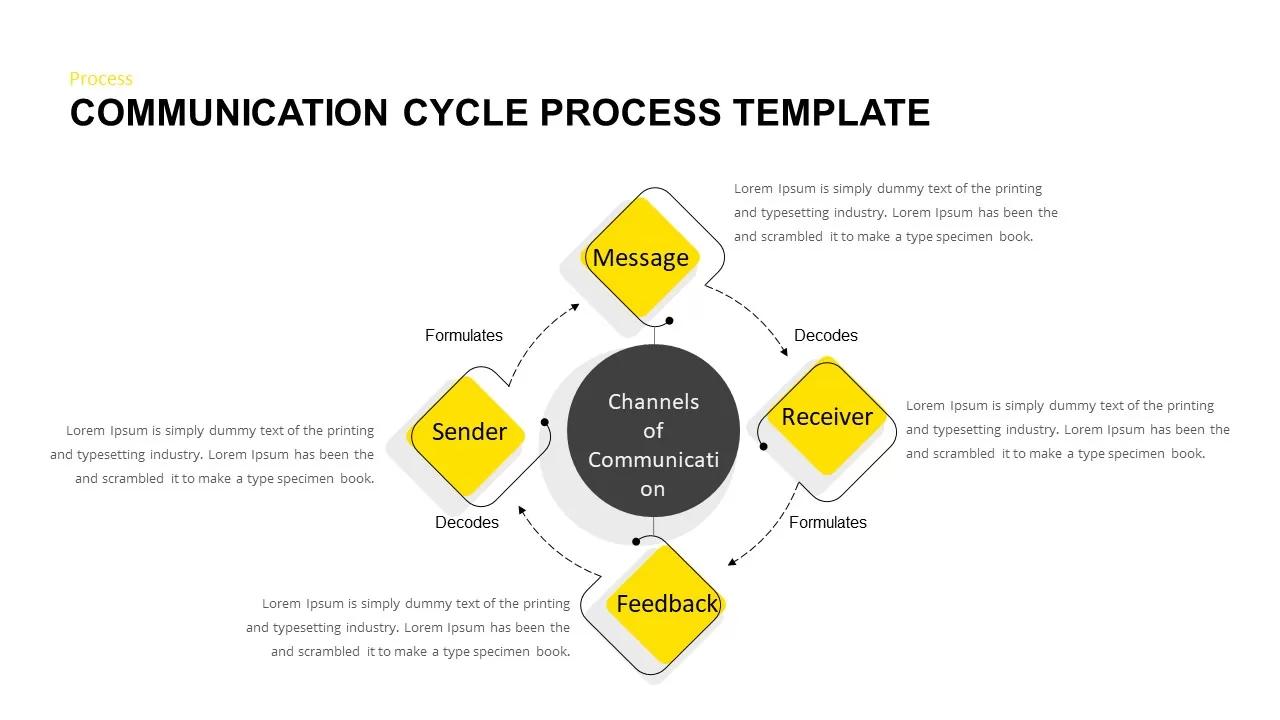
Communication Cycle Process Diagram template for PowerPoint & Google Slides
Business
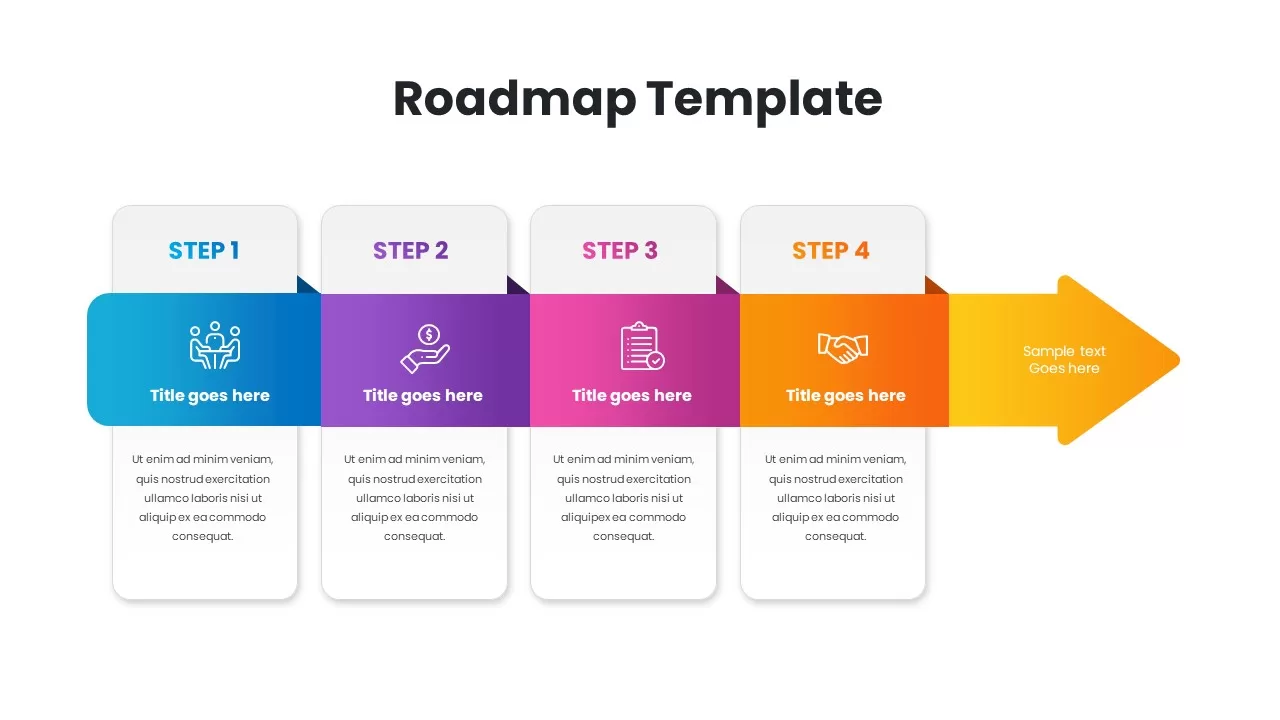
Gradient Four-Step Roadmap Diagram Template for PowerPoint & Google Slides
Roadmap
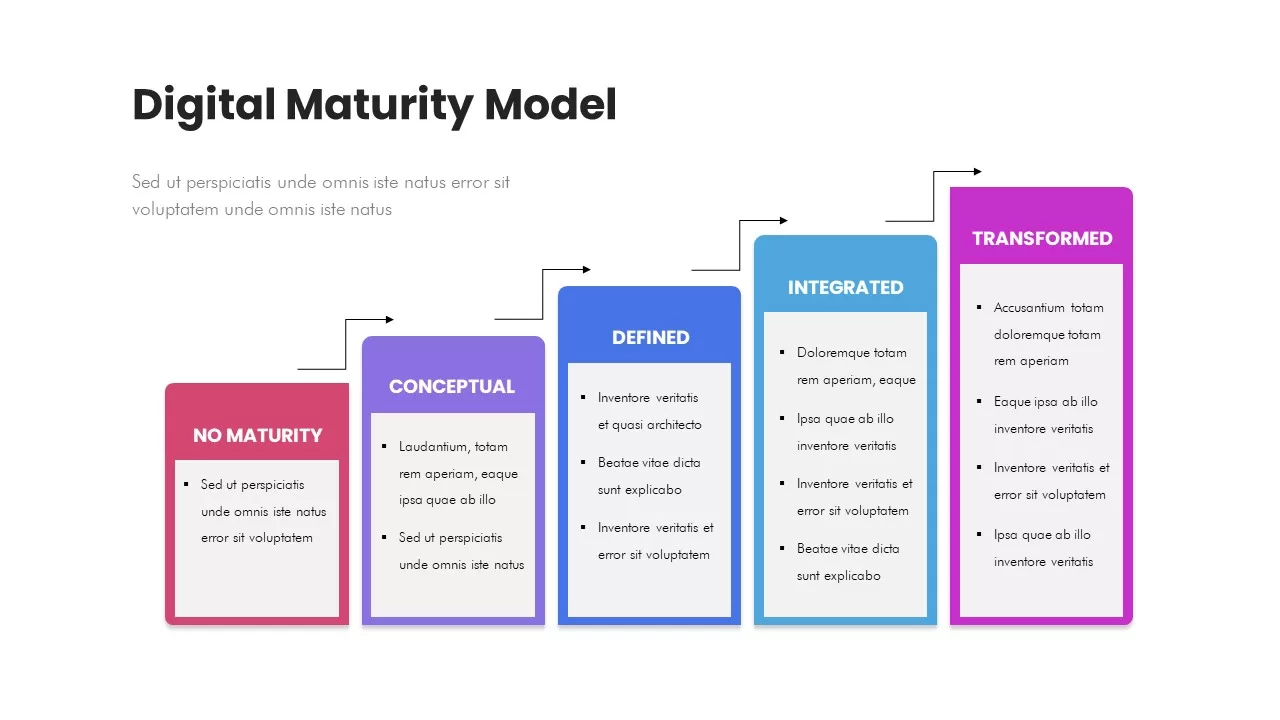
Digital Maturity Model Stages Diagram Template for PowerPoint & Google Slides
Process
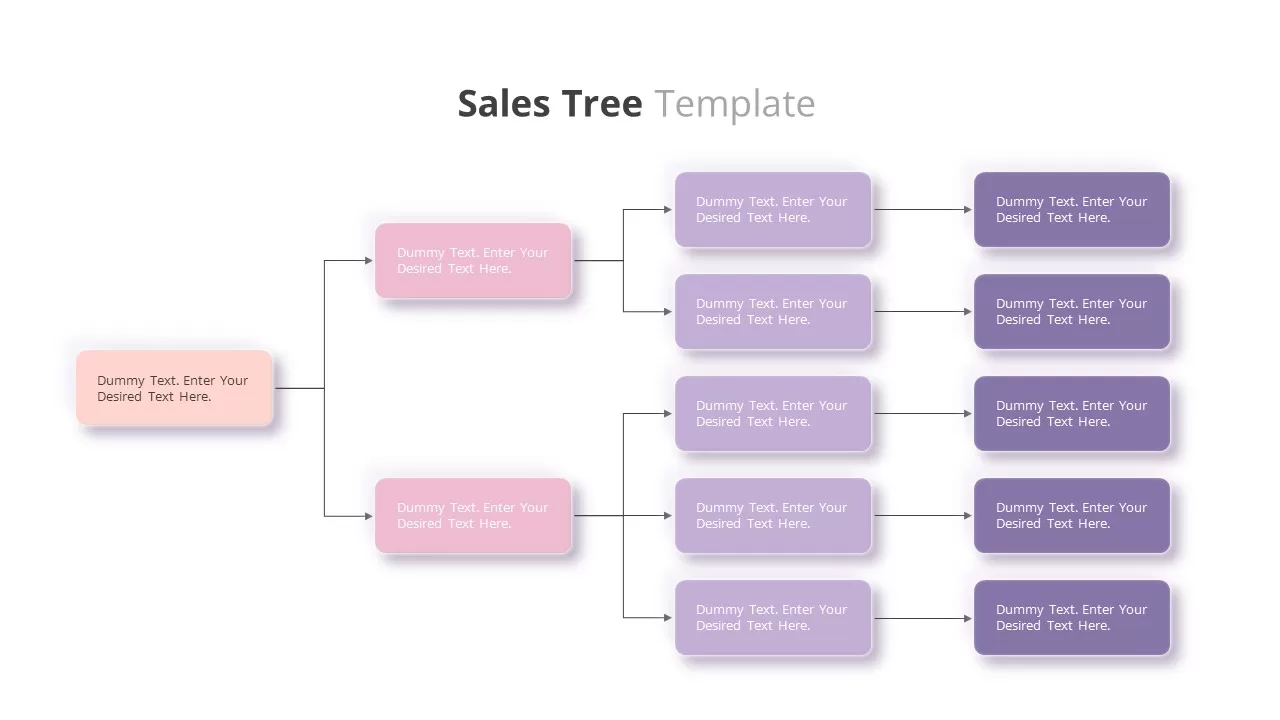
Customizable Sales Tree Diagram Template for PowerPoint & Google Slides
Org Chart
Hand-Drawn Four-Step Curved Arrow Diagram Template for PowerPoint & Google Slides
Arrow
Four-Step Curved Arrow Diagram Template for PowerPoint & Google Slides
Arrow
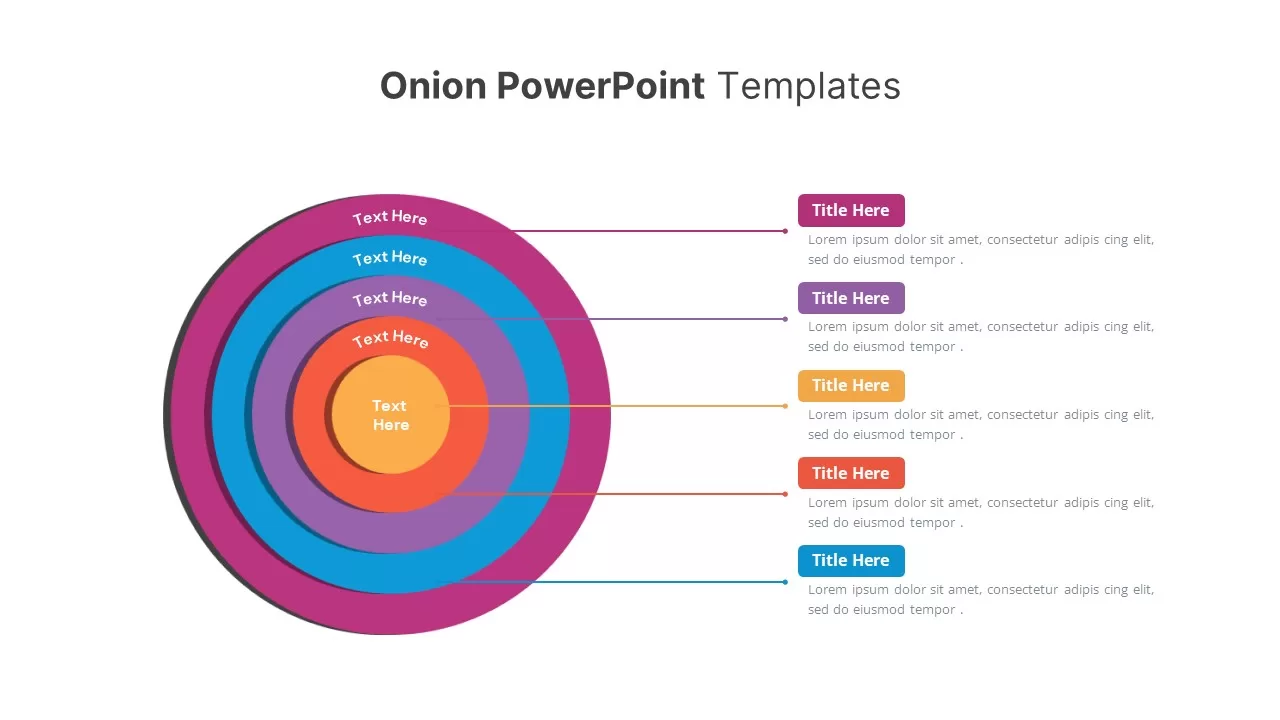
Onion Layer Infographic Diagram Template for PowerPoint & Google Slides
Process
E-Waste Management PowerPoint Template
Process
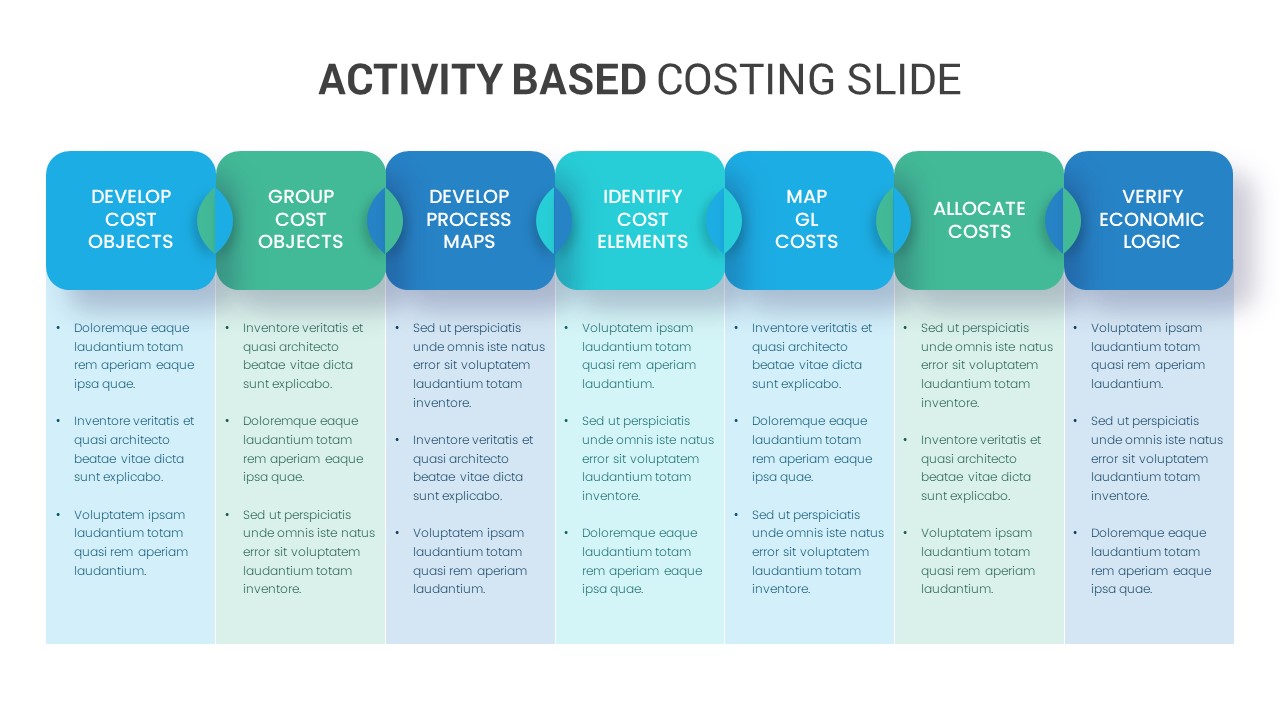
Activity Based Costing Process Diagram Template for PowerPoint & Google Slides
Process
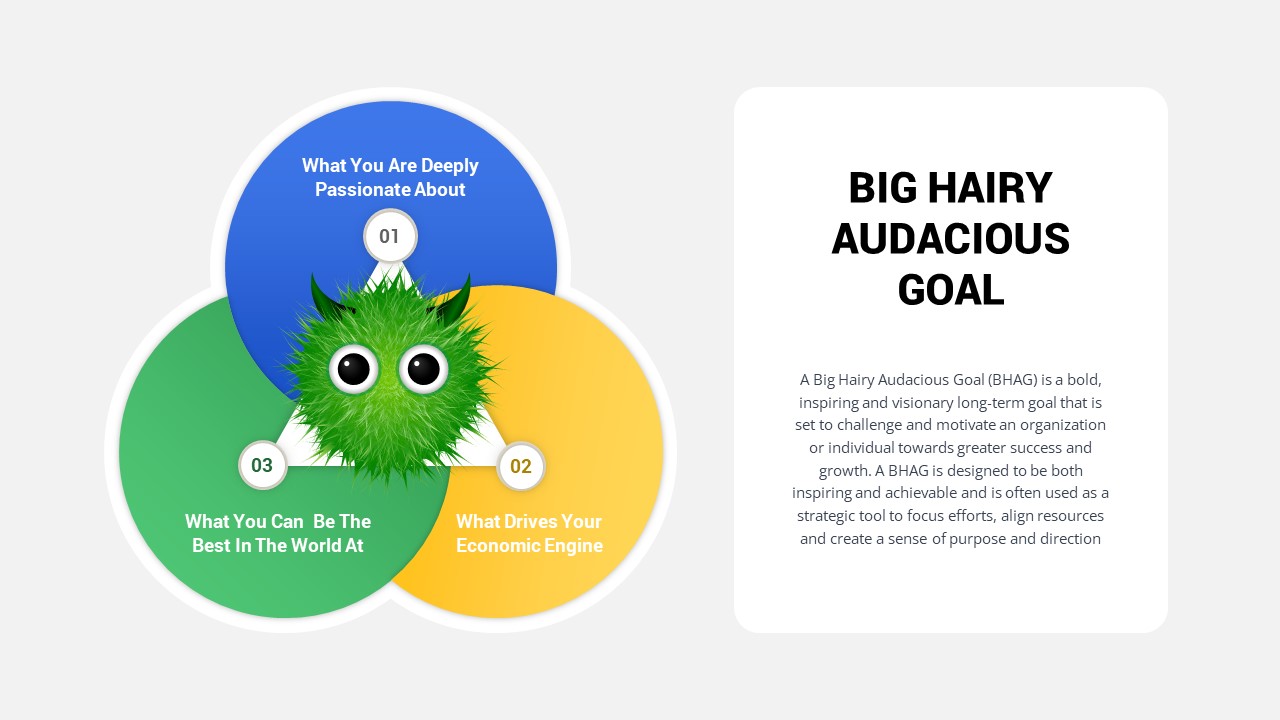
Big Hairy Audacious Goal Venn Diagram Template for PowerPoint & Google Slides
Circular
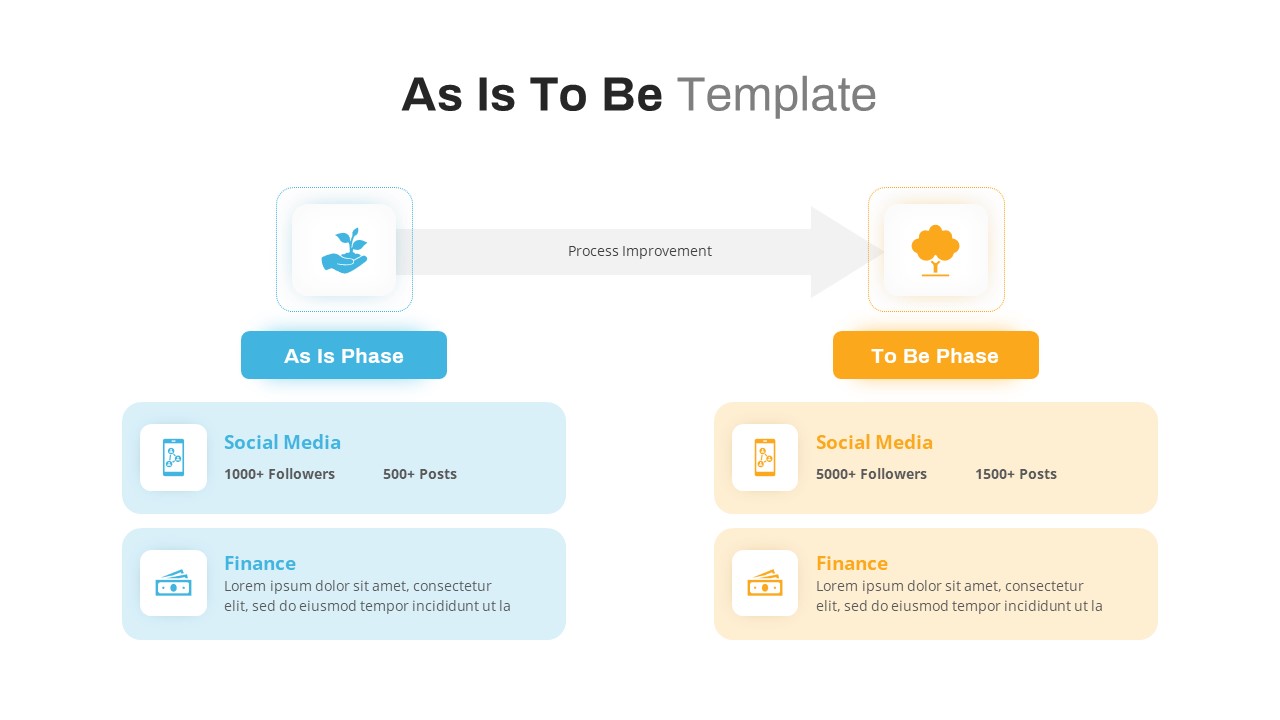
As Is To Be PowerPoint Slides Template
Business Strategy
Repeating Overlapping Process Diagram Template for PowerPoint & Google Slides
Process
Animated Hexagon Org Chart Diagram Template for PowerPoint & Google Slides
Org Chart
Red Brain Mind Map Diagram Template for PowerPoint & Google Slides
Mind Maps
AI Learning Methods Flowchart Diagram Template for PowerPoint & Google Slides
Flow Charts
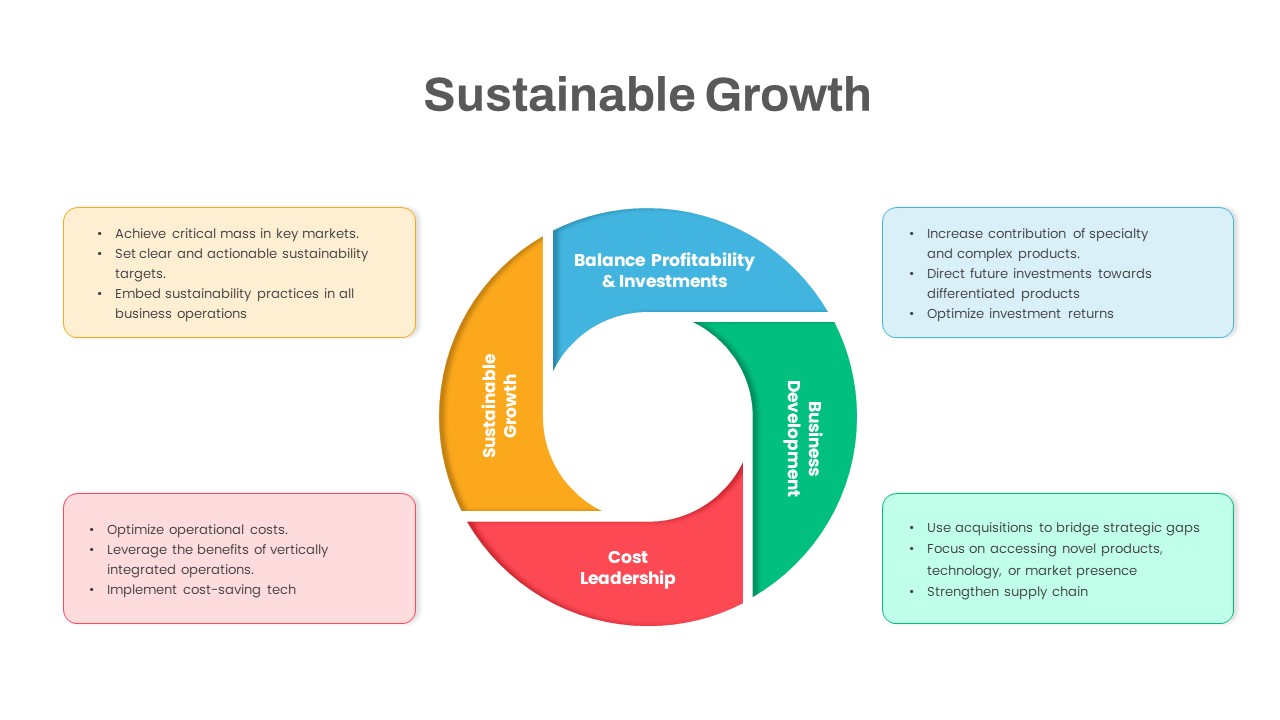
Sustainable Growth Circular Diagram Template for PowerPoint & Google Slides
Circular
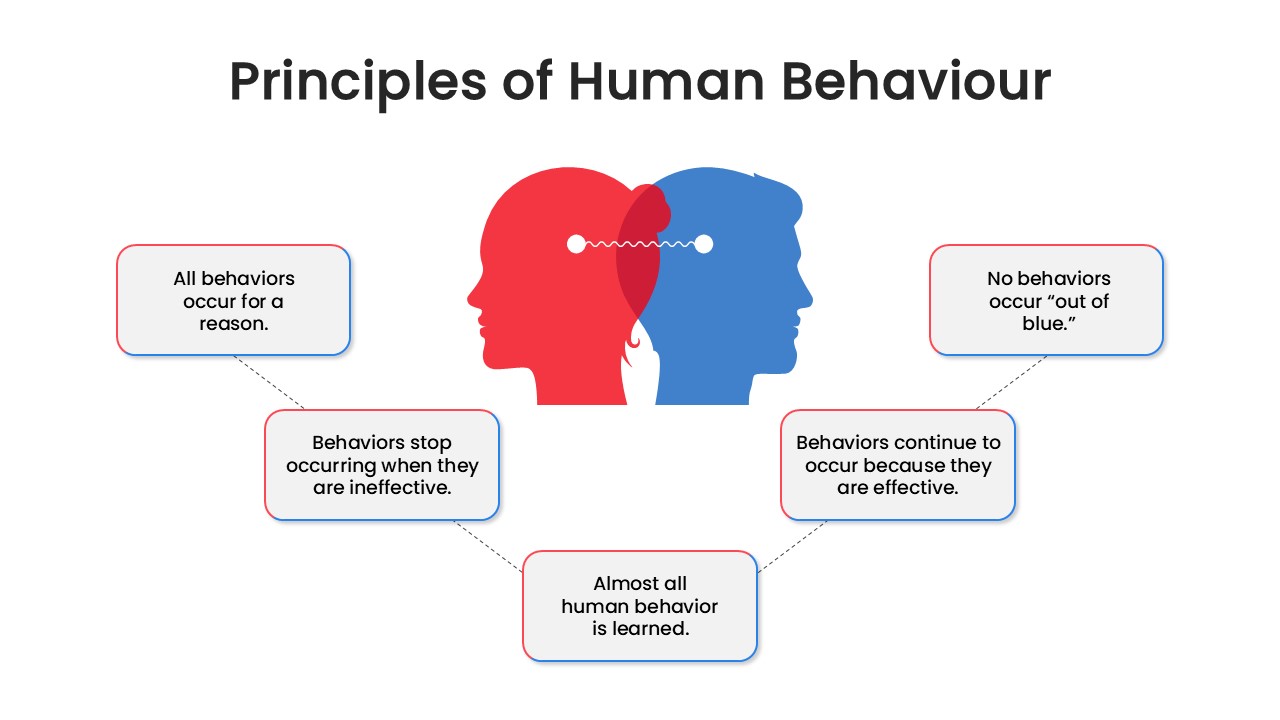
Human Behavior Principles Diagram Template for PowerPoint & Google Slides
Circular
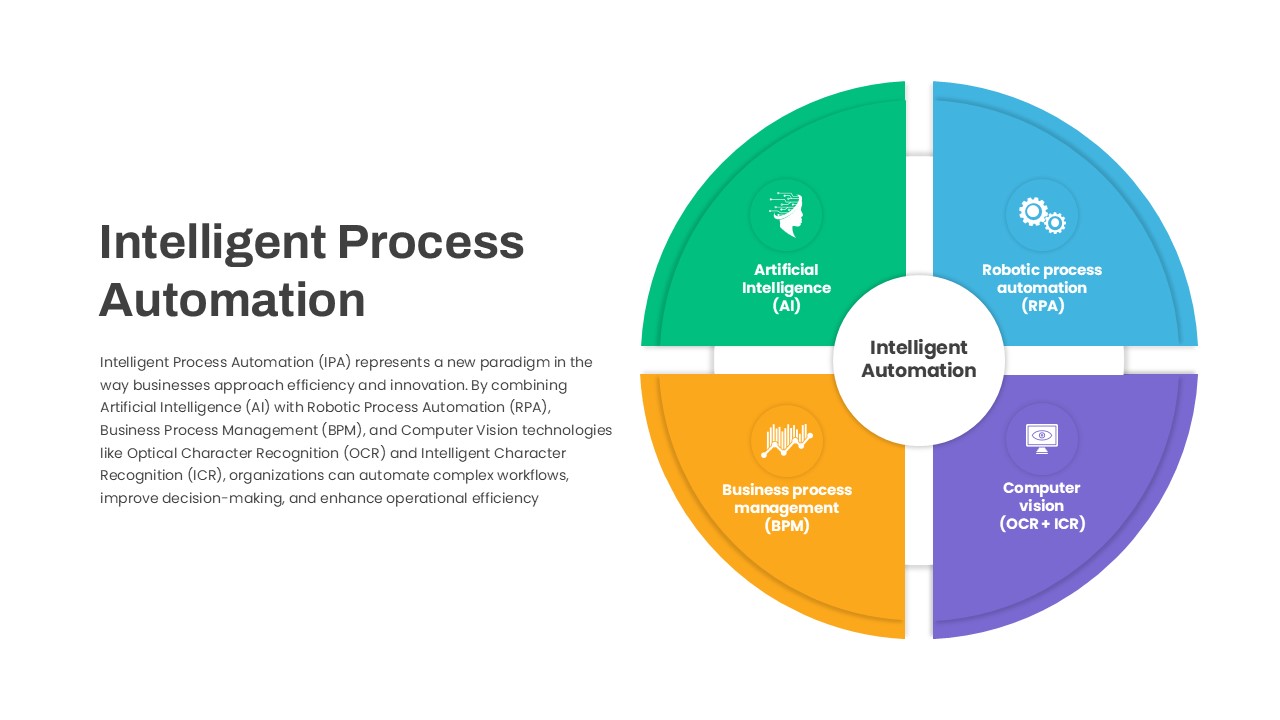
Intelligent Process Automation Diagram Template for PowerPoint & Google Slides
Circular
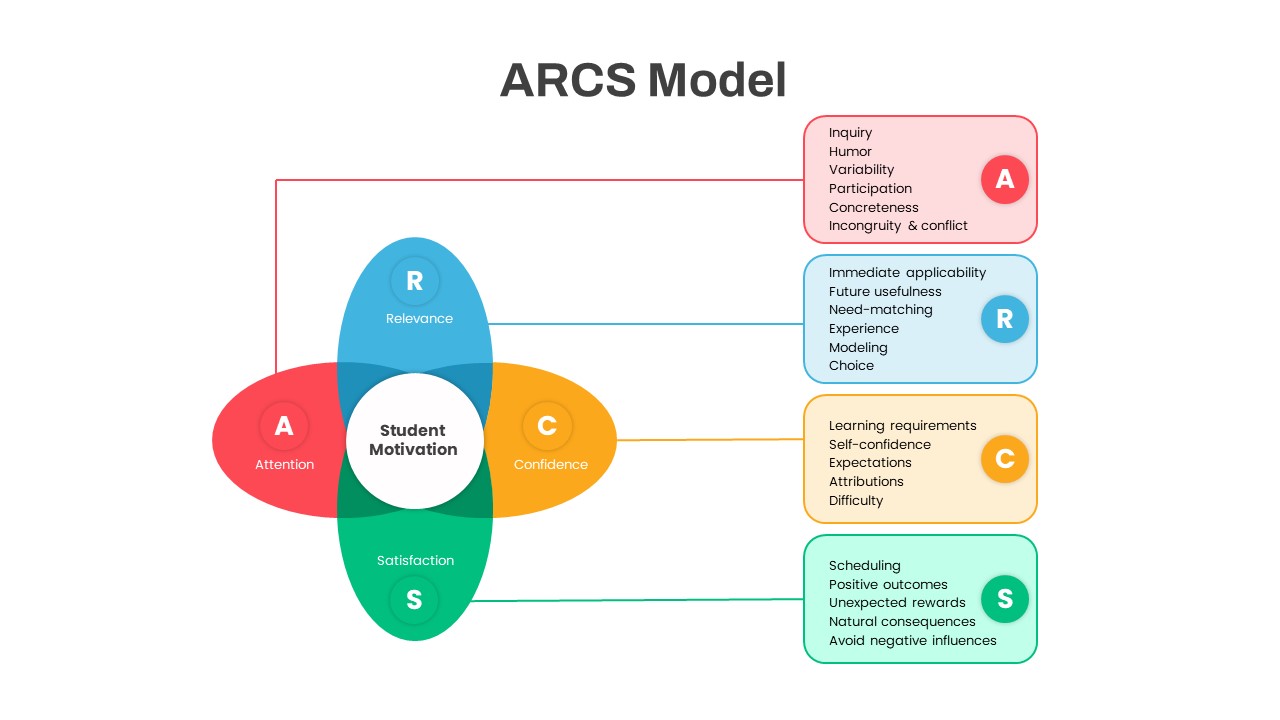
ARCS Student Motivation Model Diagram Template for PowerPoint & Google Slides
Process
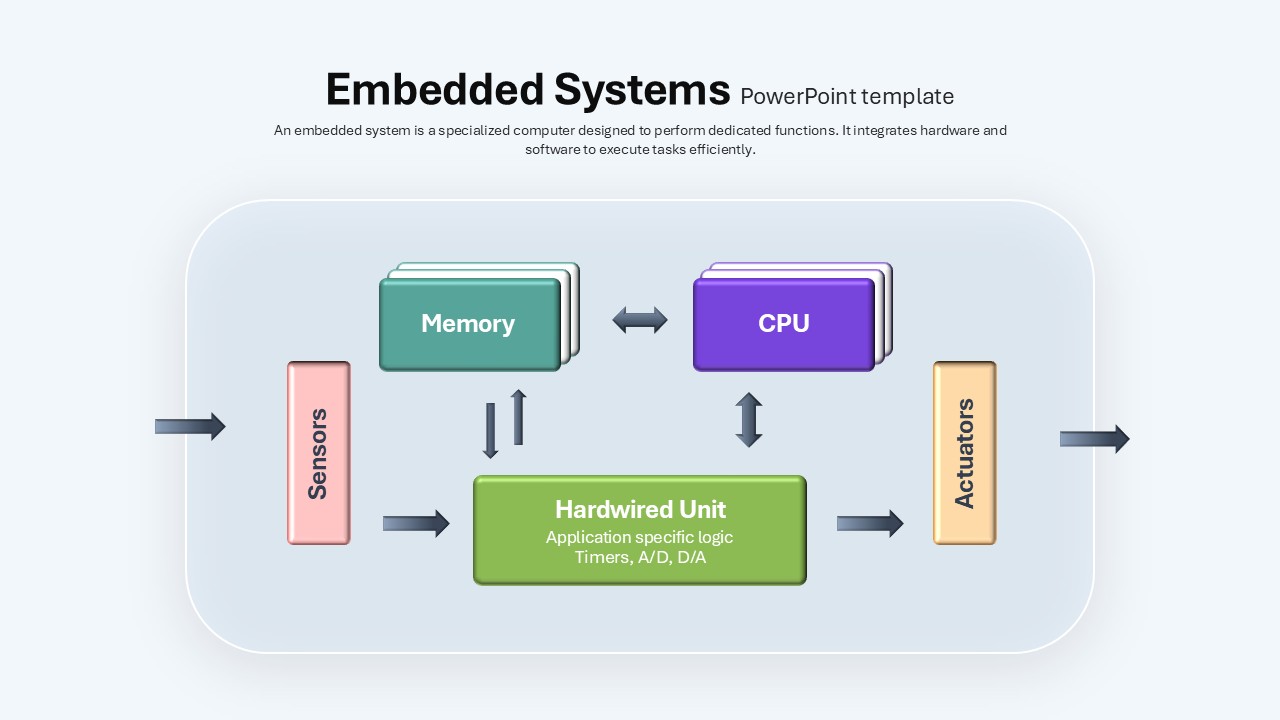
Embedded Systems Architecture Diagram Template for PowerPoint & Google Slides
Software Development
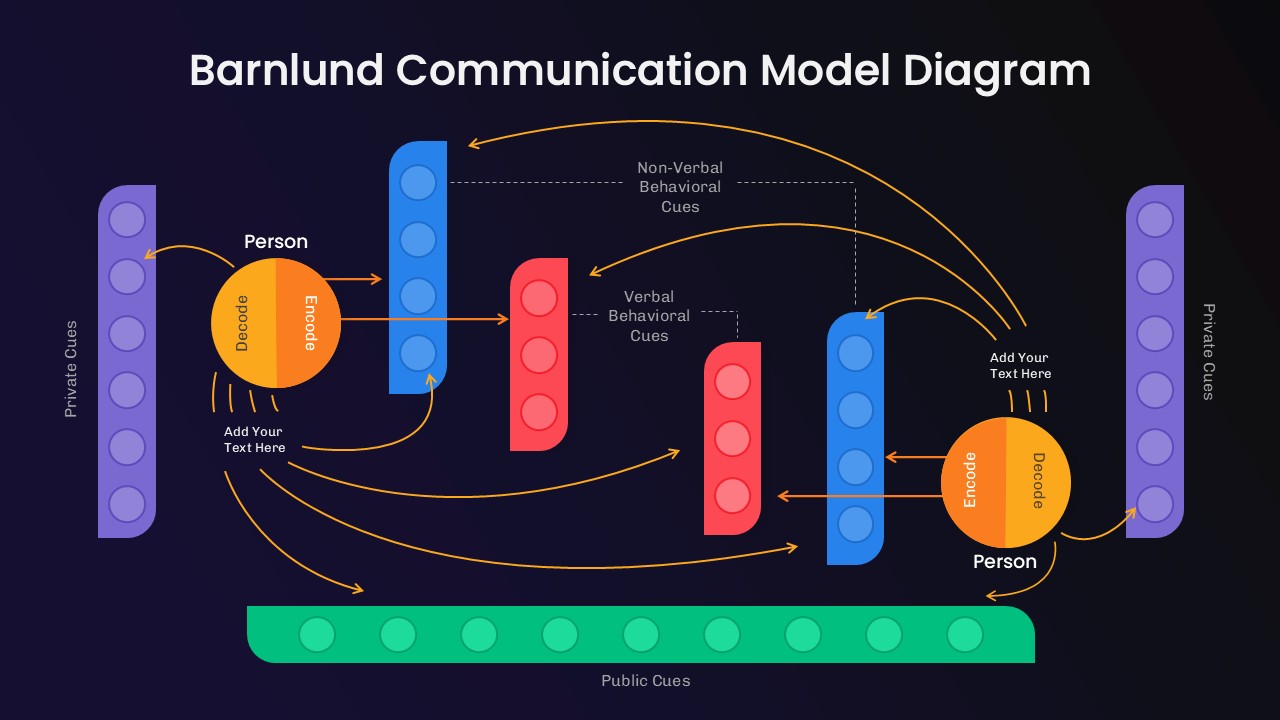
Barnlund Communication Model Diagram Template for PowerPoint & Google Slides
Process
Data-Driven Sales Strategy Diagram Template for PowerPoint & Google Slides
Marketing
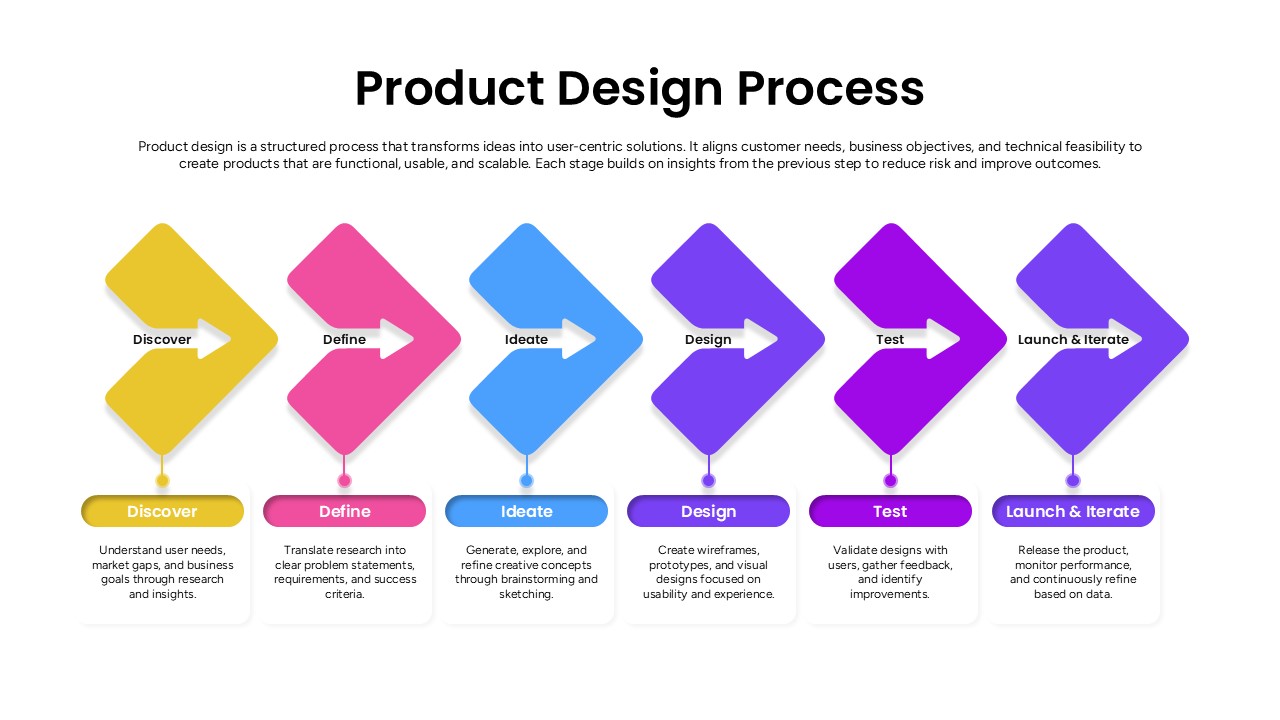
Product Design Process Flow Diagram Template for PowerPoint & Google Slides
Process
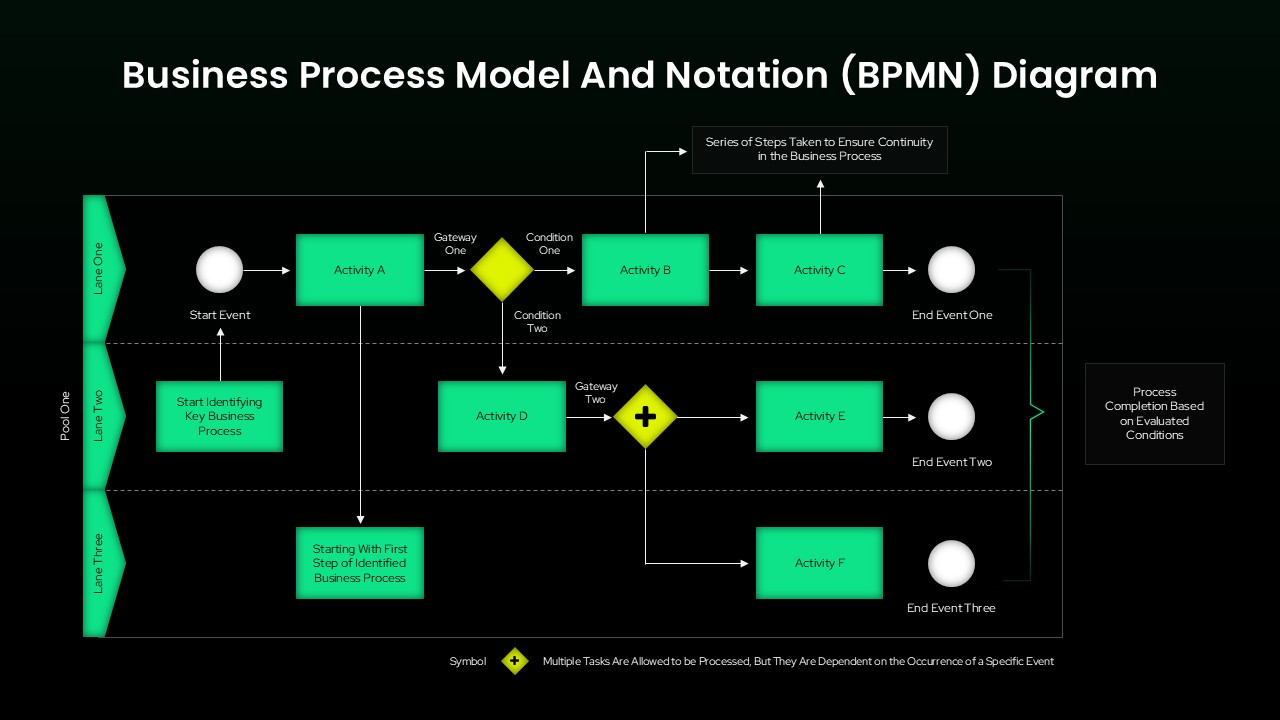
BPMN Diagram Template for PowerPoint & Google Slides
Business Strategy