
- Table of Contents:
- What is a fishbone diagram?
- How a fishbone diagram looks like
- Fishbone diagram example for business
- Guidelines for cause and effect analysis
- Example of fishbone diagram template with cause, sub causes, and effect
- Fishbone diagram example without sub causes
- More PowerPoint templates for fishbone examples
Fishbone Diagram Examples: Cause and Effect Analysis

Problems can occur in any business and will come in many different forms. Without knowing the causes, nobody can solve problems. So, it is important to be able to find the cause on time. Solving a problem needs a structured approach with the application of scientific methodologies. Where the relevance of the fishbone diagram comes in and where you can apply it, this article covers fishbone diagram examples and guidelines for creating a cause and effect analysis.
Table of Contents:
- Introduction
- What is a fishbone diagram?
- How a fishbone diagram looks like
- Fishbone example of climate change
- Causes of climate change caused by human activity.
- Fishbone diagram example for business
- Guidelines for cause and effect analysis
- Example of fishbone diagram template with cause, sub causes, and effect
- Fishbone diagram example without sub causes
- PowerPoint Templates for fishbone examples
- Conclusion
What is a fishbone diagram?
A fishbone diagram is a visual representation for categorizing the potential cause of a problem. A fishbone diagram is also known as a cause and effect diagram, Ishikawa diagram, or Herringbone diagram. It is used to identify a problem’s root causes. So, it is typically used to track down the reason for problem occurrences, defects, variations, or imperfections. Hence, a full fishbone diagram will provide a complete picture of the contributing factors in quick views.
How a fishbone diagram looks like
The diagram looks like a fish’s skeleton where the problem is placed on the head and the causes into the spine. The spine carries multiple bones indicating multiple causes of the problem. At the same time, the subbranches spurting out from the bone denote root causes. A horizontally divided chevron arrow design is the easiest way to outline a fishbone diagram. In this outline, you can draw multiple chevron arrows and leave the head without dividing.
Let’s have a look at the fishbone example of climate change
We all know the impending threats of climate change since experts in the field seriously discuss it. However, we haven’t taken it that much of seriously. But there are many things you can do to keep the world informed. You can lead your conversation and move on to actions using a fishbone diagram here, how you can address the problem of climate change with an example of a fishbone diagram.
For this, first, you should list out the causes and root causes of climate change (even without sub-causes, you can show the cause alone)
The cause of climate change caused by human activity are:
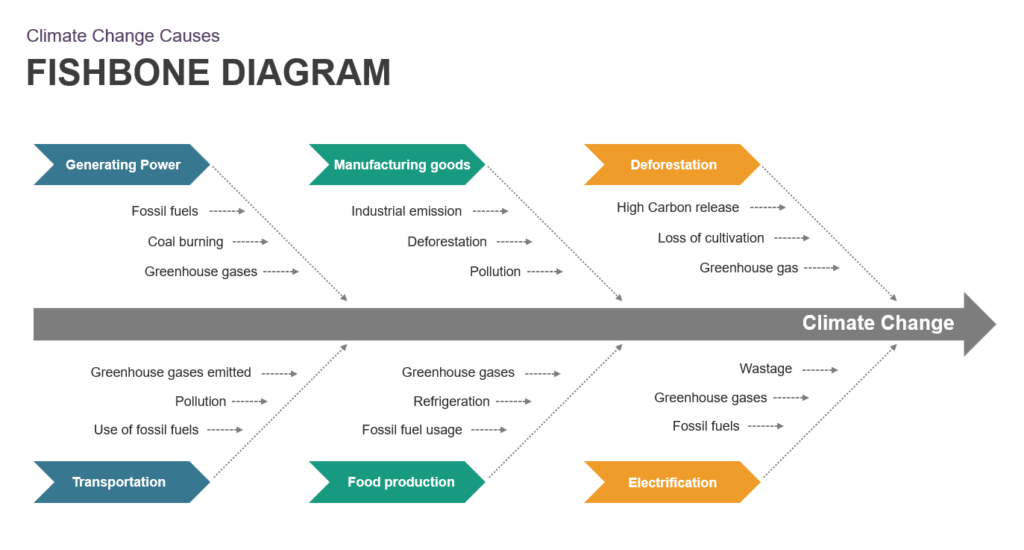
This diagram shows the causes at the bones and the sub-cause at the sub-branches spurting out from the bone. All these causes are the reason for the effect, i.e., climate change.
Fishbone diagram example for business
The fishbone diagram originated to solve business problems.
Dr. Kaoru Ishikawa, the quality control expert, shaped this diagram to create product designs that solve quality issues arising from manufacturing onwards. So, he combined the DMAIC approach (define, measure, analyze, improve, control) for problem-solving.
Let’s create another example of a fishbone diagram featuring the causes of low productivity in the workplace.
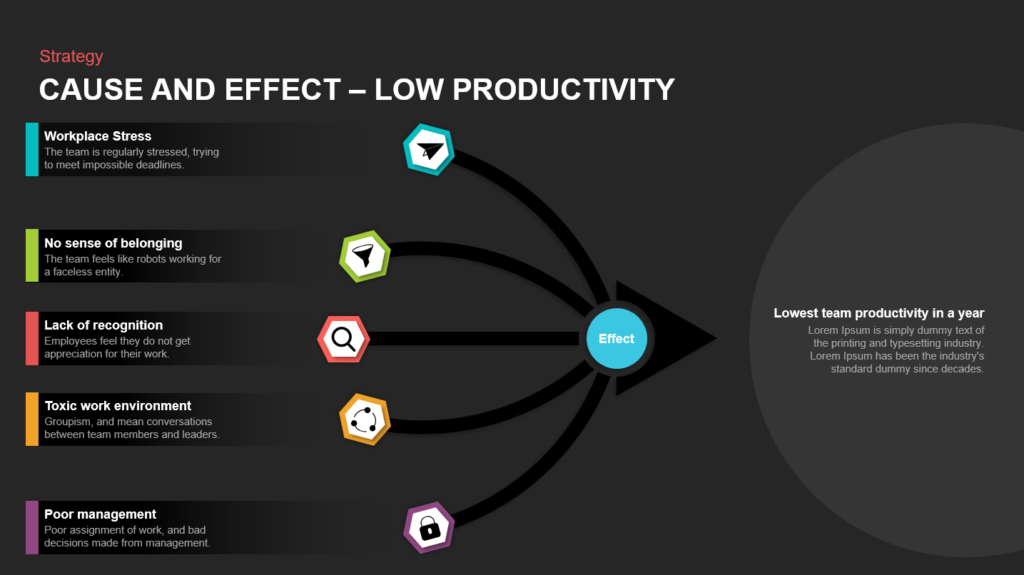
As you see, the fishbone analysis example above allows you to see many factors at once, making it a great visualization for sharing complex information.
Guidelines for cause and effect analysis
You can do a cause and effect analysis by combining brainstorming and mind mapping techniques to dig out the possible causes behind an issue. No matter the industry, many professionals in business and management uses this method to identify causes and solve the problem.
Step 1. Define the problem
When a problem is evidently defined, it is easier to identify causes. So, first, identify a general area of interest, then learn more about the problem; after collecting data, review the context of the information and then determine the relationship between cause and effect. These core processes help define the problem. Suppose the research problem is the high attrition rate of employees, define, analyze, and find the original causes.
Step 2 – identify key categories of causes
It means what areas of the problem are key to determining the actual cause. For example, if you strongly believe that lack of employee acknowledgment, poor workplace culture, and poor pay might be the reason, then you should decide to focus on that area.
Step 3. Determine the actual cause of the problem
Once the areas are categorized, go through each one to determine all the individual factors. If you look at the poor workplace culture, some possible causes to investigate are:
- Office gossip
- Overwork
- Hotheaded boss
- Unhealthy communication
- Lack of trust
Some causes may have multiple sub causes. In that case, expand your fishbone diagram to encompass all potential causes. You can better understand these via some of the following fishbone PowerPoint templates:
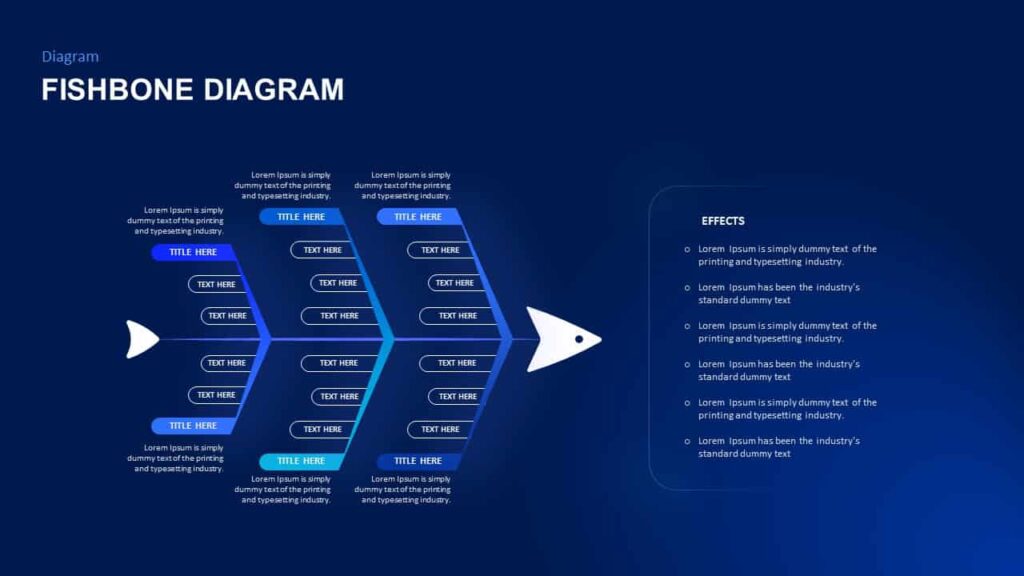
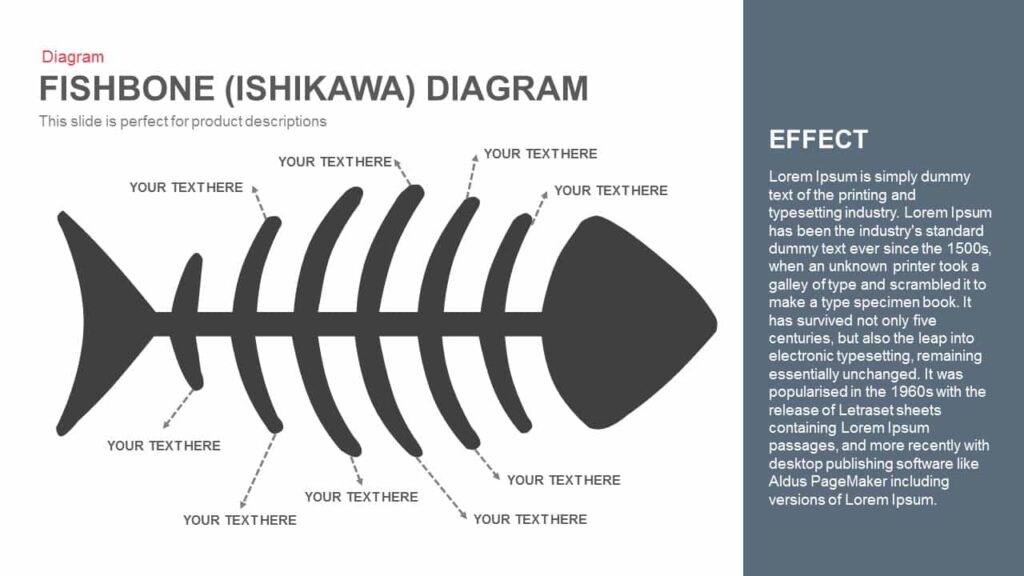
Example of fishbone diagram template with cause, sub causes, and effect
This perfect fishbone PowerPoint template was created to show multiple causes producing an effect. Here, the head will show the impact, while the bones in the spine can display core issues, and the subbranches allow inserting sub-causes. You can download the professional fishbone example for multipurpose presentations.
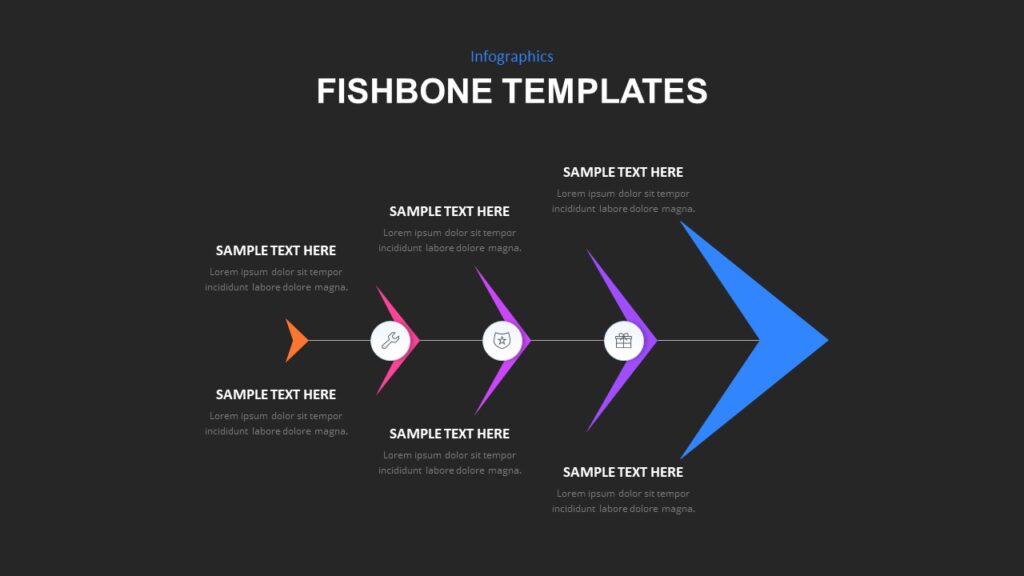
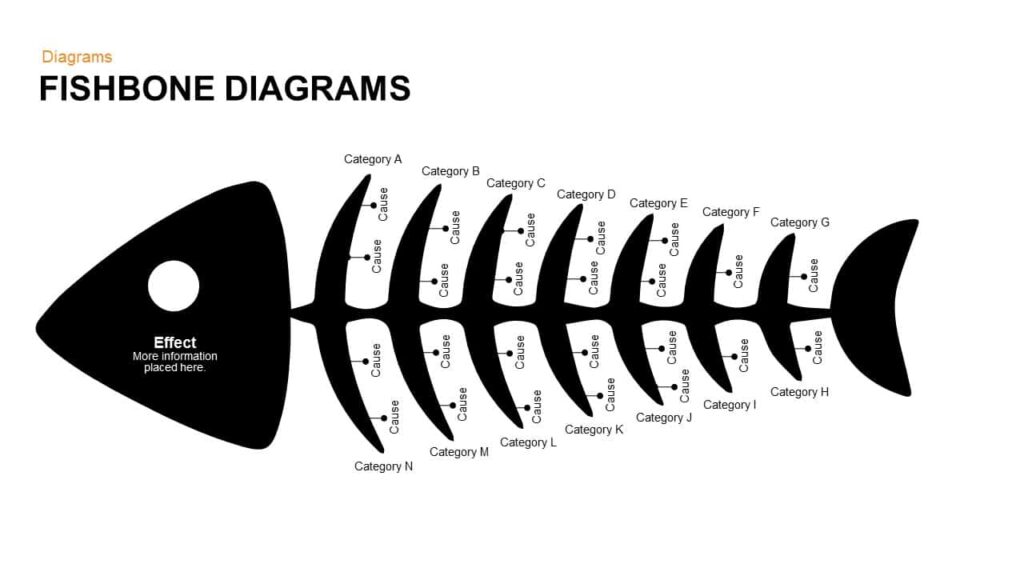
Fishbone diagram example without sub causes
This is a simple fishbone diagram for PowerPoint to display root causes only. If the problem no longer has sub-causes, you can use these types of fishbone templates.
More PowerPoint templates for fishbone examples
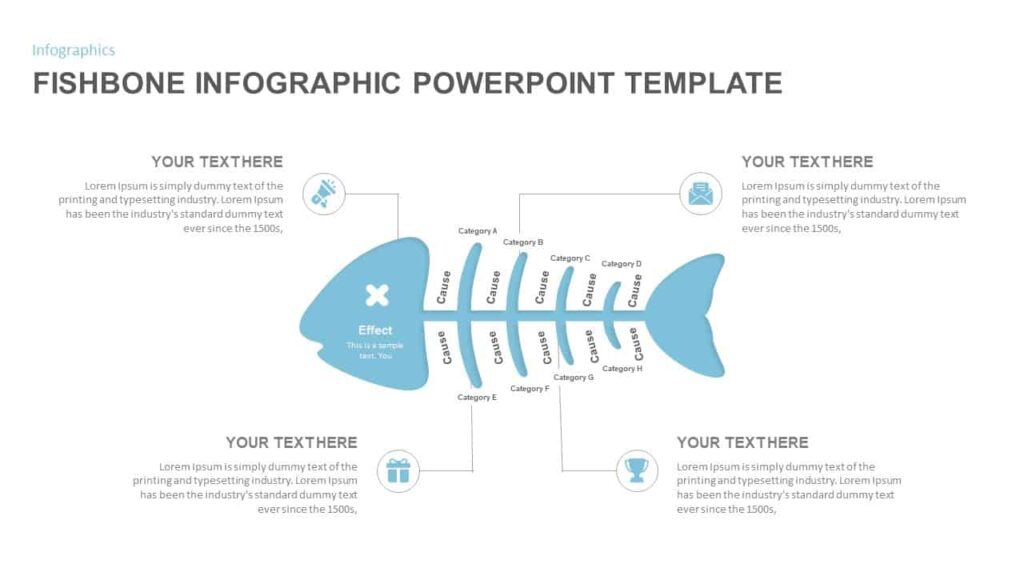
- Fishbone Infographic PowerPoint Template
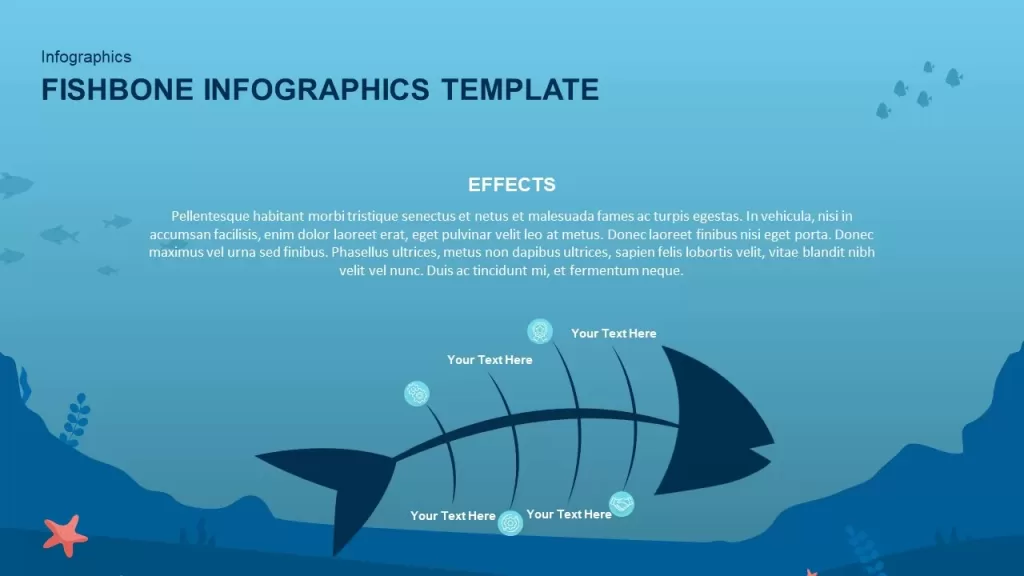
The decorated fishbone diagram with a visual sea effect is an outstanding design for cause and effect analysis presentation. You can provide an impressive data presentation in PowerPoint with the fishbone infographic.
- Fishbone diagram PowerPoint Template
The fishbone illustration is a complete fish structure with a head and tail. The presenters can add causes and multiple sub-causes to show the root of complex issues.
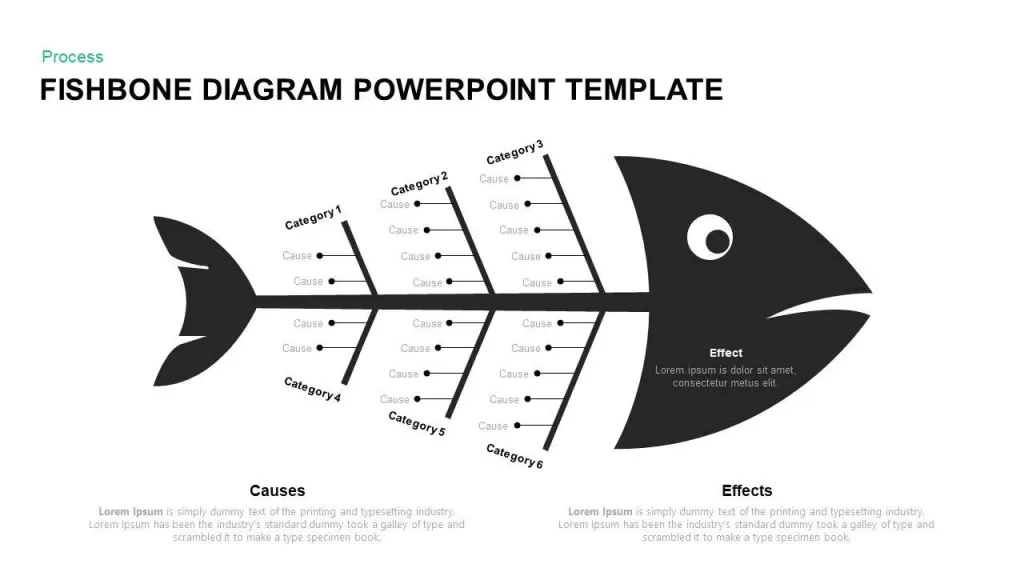
- Cause and effect diagram template for PowerPoint
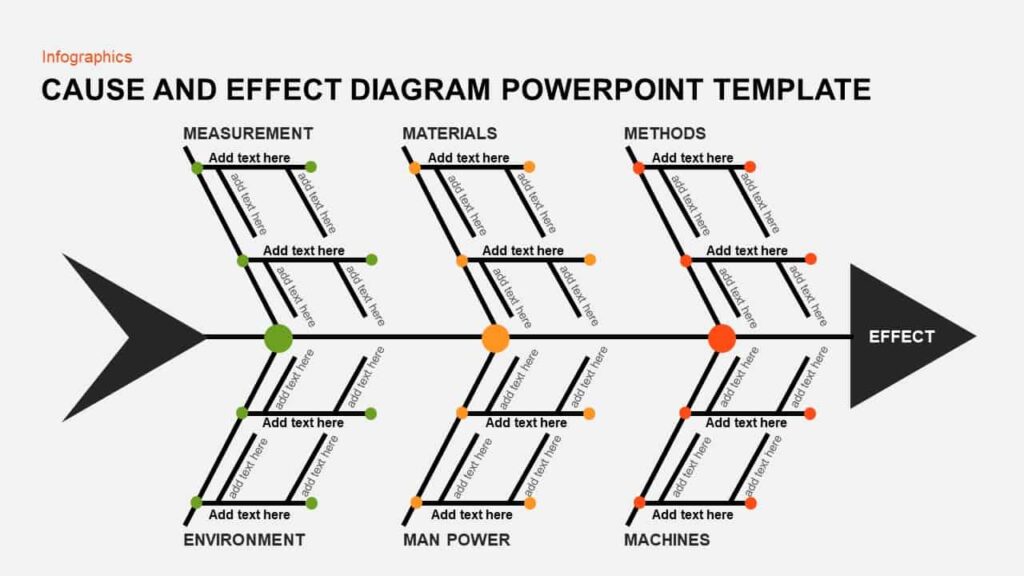
This cause and effect diagram template is a typical skeleton fishbone template depicts multiple causes behind an effect. Here, each bone has branches and sub-branches that allow you to present a complex issue related to your business.
- Fishbone Diagram PowerPoint Template
The presenters can provide logical connections between causes and effects using the fishbone template. This is the minimal presentation design for root cause analysis.
- Fishbone diagram PowerPoint template and keynote slide
The fishbone ppt template can be used if an effect has multiple causes, so the fishbone diagram contains seven bones and two sub-branches on either side. The design helps to categorize various reasons and places the sub-causes in each bone.
Conclusion
A fishbone diagram is a perfect tool for presenting research outcomes of a root cause analysis. Any organization and business can use the diagram where you need to inform all the contributing causes to your teammates and stakeholders. We offer a variety of free Fishbone Diagram PowerPoint Templates designed to represent various concepts. Explore our library for more options.
Related Articles
-
 April 19th, 2021
Dave Ulrich model: solid yardstick for your organization
Blog Post -
 September 17th, 2024
20+ Stunning Presentation Themes for 2026
Blog Post -
 May 23rd, 2024
Top 5 PowerPoint Shape Templates for 2026
Blog Post