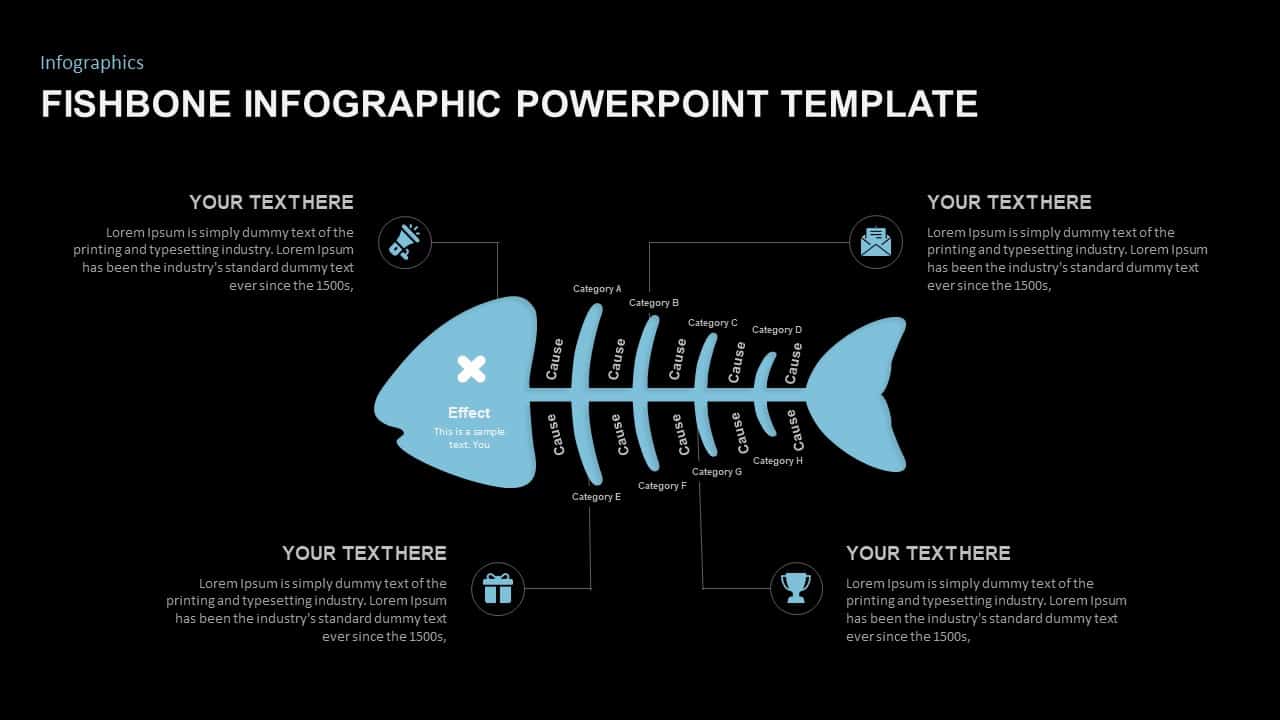
Fishbone Cause and Effect Infographic Template for PowerPoint & Google Slides

Description
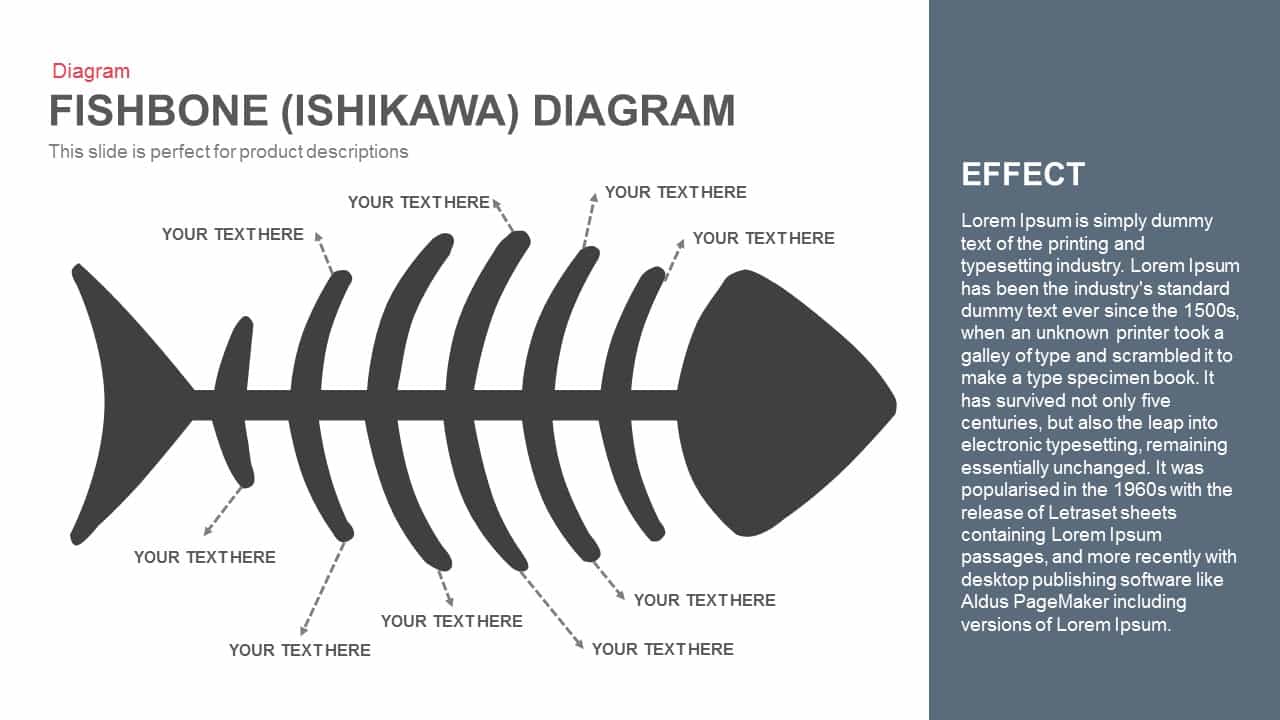
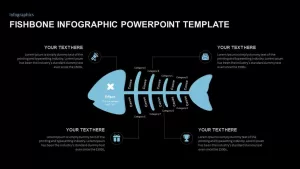
Use this fishbone cause-and-effect diagram slide to conduct root-cause analysis and visually map factors contributing to a problem across eight categories. Centered around a stylized fish skeleton, the infographic features a large “Effect” head placeholder and eight labeled “Cause” ribs, each linked to customizable icon callouts and text boxes for detailed explanations. The clean flat design, with a single dominant blue hue and subtle gray accents, ensures legibility and focus on your content.
Built entirely from vector shapes on master layouts, this template offers rapid customization in both PowerPoint and Google Slides. Swap icons, update category labels, adjust connector lines, or change the effect statement in seconds without misalignment. Preconfigured entrance animations guide your audience through each cause step by step, reinforcing narrative clarity during workshops, team meetings, or problem-solving sessions. Cross-platform compatibility eliminates formatting issues and version-control headaches, enabling seamless collaboration across devices and operating systems.
Ideal for quality-management reviews, project retrospectives, and strategic planning, this fishbone diagram helps teams identify underlying issues—such as equipment failures, process bottlenecks, or communication gaps—and drive data-driven improvements. Use the eight cause categories to structure brainstorming sessions, assign responsibilities, and prioritize corrective actions. The balanced layout also works for training modules on Six Sigma, Lean methodologies, or continuous-improvement frameworks. By combining thematic visuals with editable design features, this slide empowers presenters to deliver impactful root-cause insights and foster collaborative problem resolution.
Who is it for
Quality engineers, operations managers, and process-improvement consultants will benefit from this slide when facilitating fishbone exercises, conducting RCA workshops, or teaching continuous-improvement techniques.
Other Uses
Repurpose this diagram for SWOT analyses, risk-assessment workshops, marketing cause mapping, or organizational gap analyses. The modular structure supports icon swaps and label adjustments to fit any industry or use case.
Login to download this file

Item ID
SB01557
Related Templates

Fishbone Diagram Cause-and-Effect Template for PowerPoint & Google Slides
Process
Cause and Effect Diagram Template for PowerPoint and Google Slide
Process
Fishbone Infographic PowerPoint Template
Process

Cause and Effect Diagram Infographic Template for PowerPoint & Google Slides
Bar/Column
Cause and Effect Template for PowerPoint & Google Slides
Arrow
Fishbone Cause Analysis Diagram Template for PowerPoint & Google Slides
Process
Free Root Cause Analysis PowerPoint Template
Process
Free
5 Why Fishbone Diagram for Root Cause Analysis in PowerPoint & Google Slides
Process
Fishbone Timeline Template
Manufacturing
Root Cause Analysis Infographic Pack Template for PowerPoint & Google Slides
Process
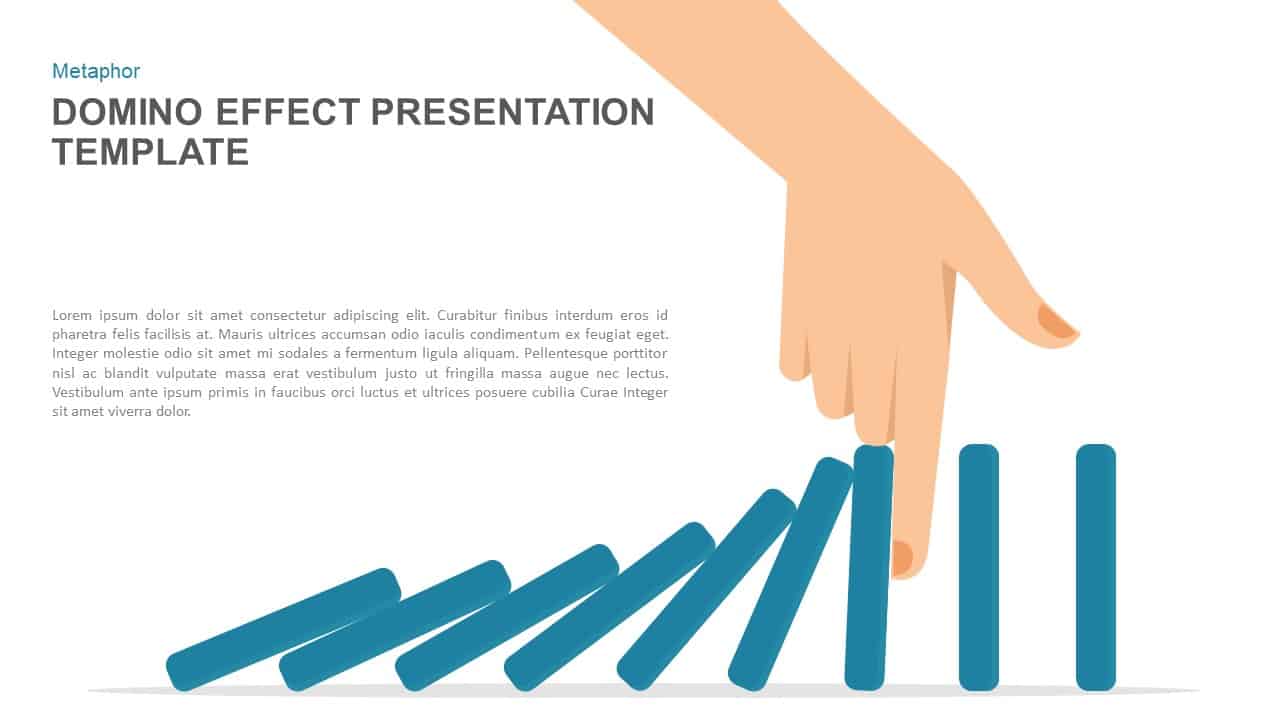
Domino Effect Prevention Presentation Template for PowerPoint & Google Slides
Process
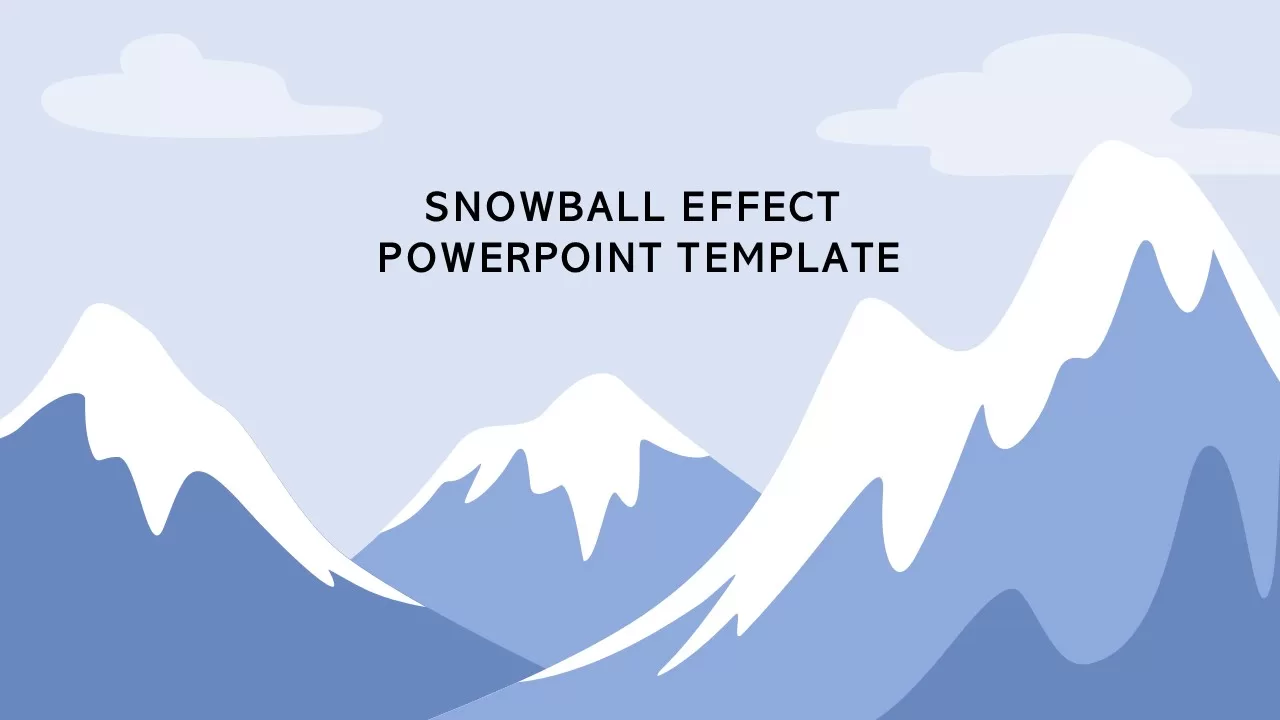
Snowball Effect PowerPoint Template
Process
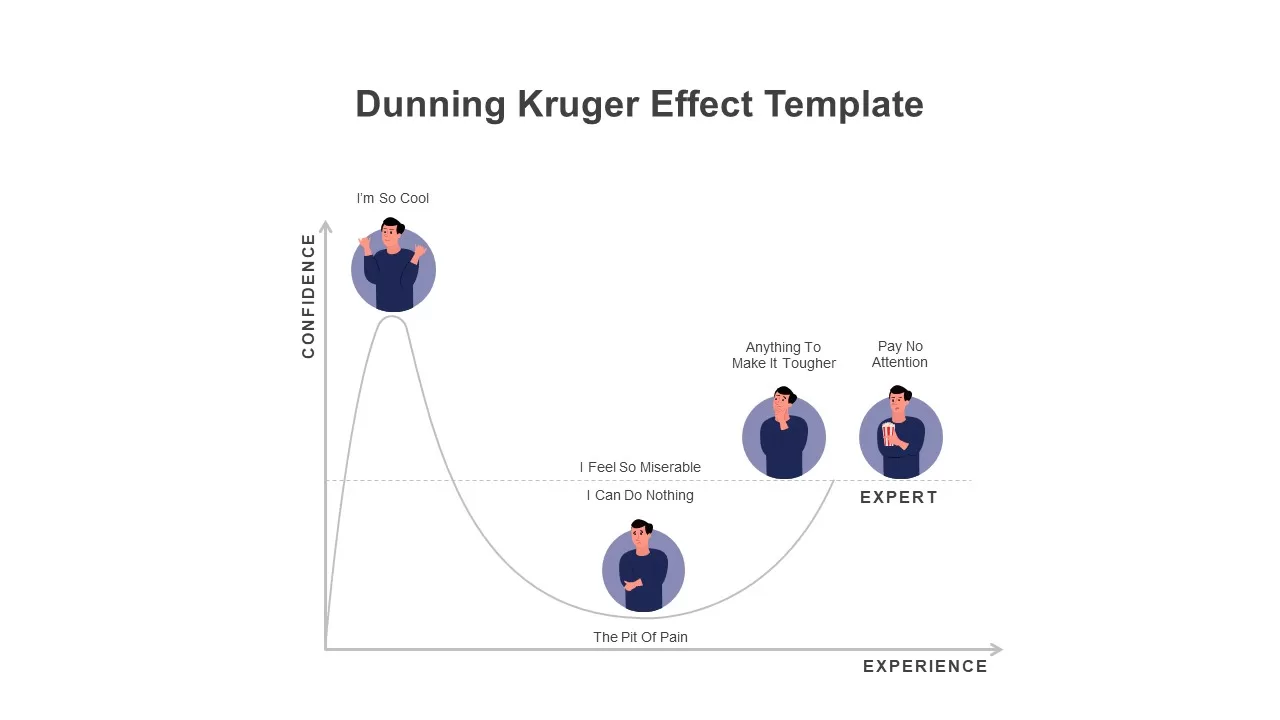
Modern Dunning Kruger Effect Diagram Template for PowerPoint & Google Slides
Business
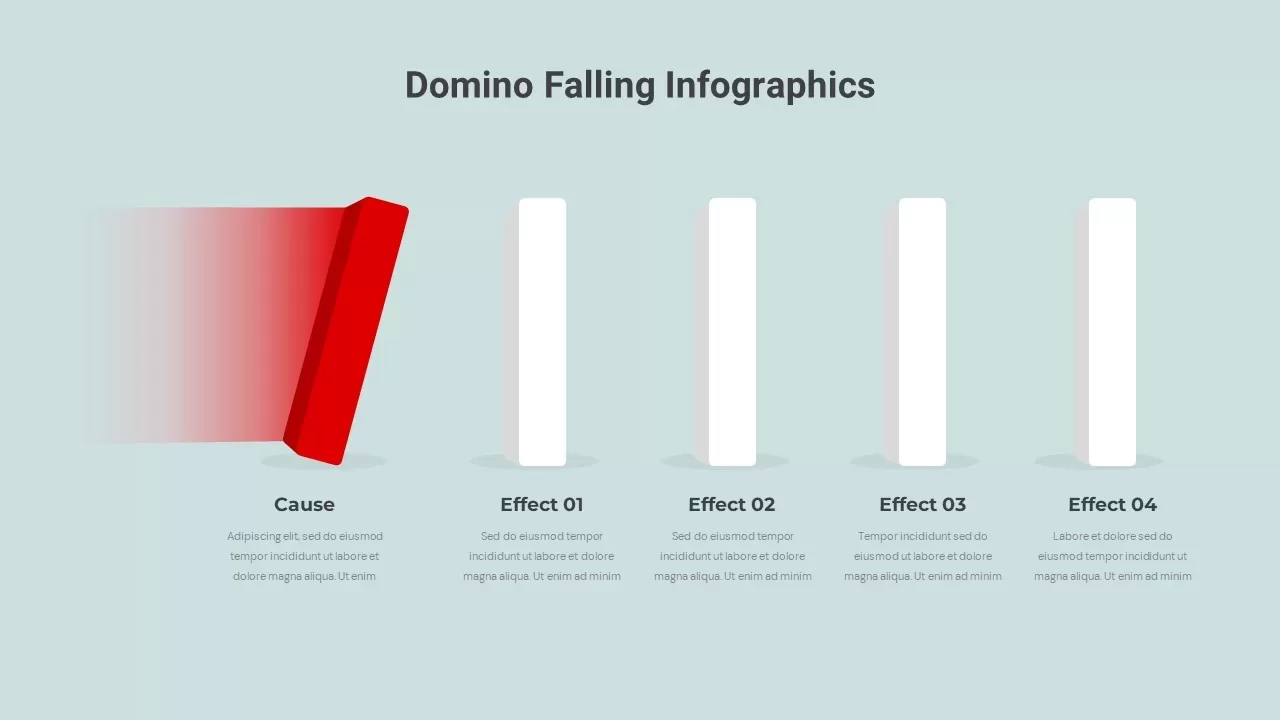
Domino Effect Sequential Infographics Template for PowerPoint & Google Slides
Process
5Cs of Network Effect Circular Diagram Template for PowerPoint & Google Slides
Circular
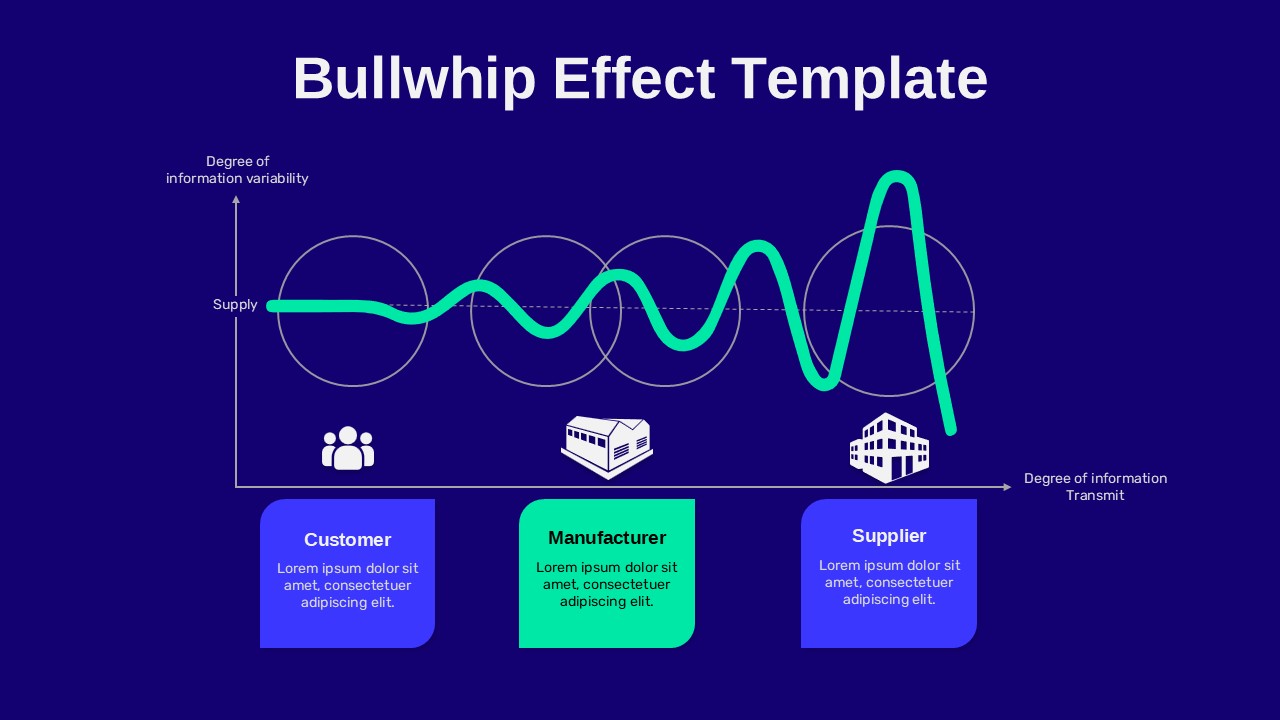
Bullwhip Effect Supply Chain Variability Diagram Template for PowerPoint & Google Slides
Business Models
Three-Section Fishbone Process Diagram template for PowerPoint & Google Slides
Process
Fishbone RCA Diagram Template for PowerPoint & Google Slides
Business Strategy
Fishbone Diagram Overview template for PowerPoint & Google Slides
Infographics
Free Fishbone Diagram PowerPoint Template
Project
Free
Fishbone Diagram Analysis Template for PowerPoint & Google Slides
Flow Charts
Fishbone Template for PowerPoint Presentation
Infographics
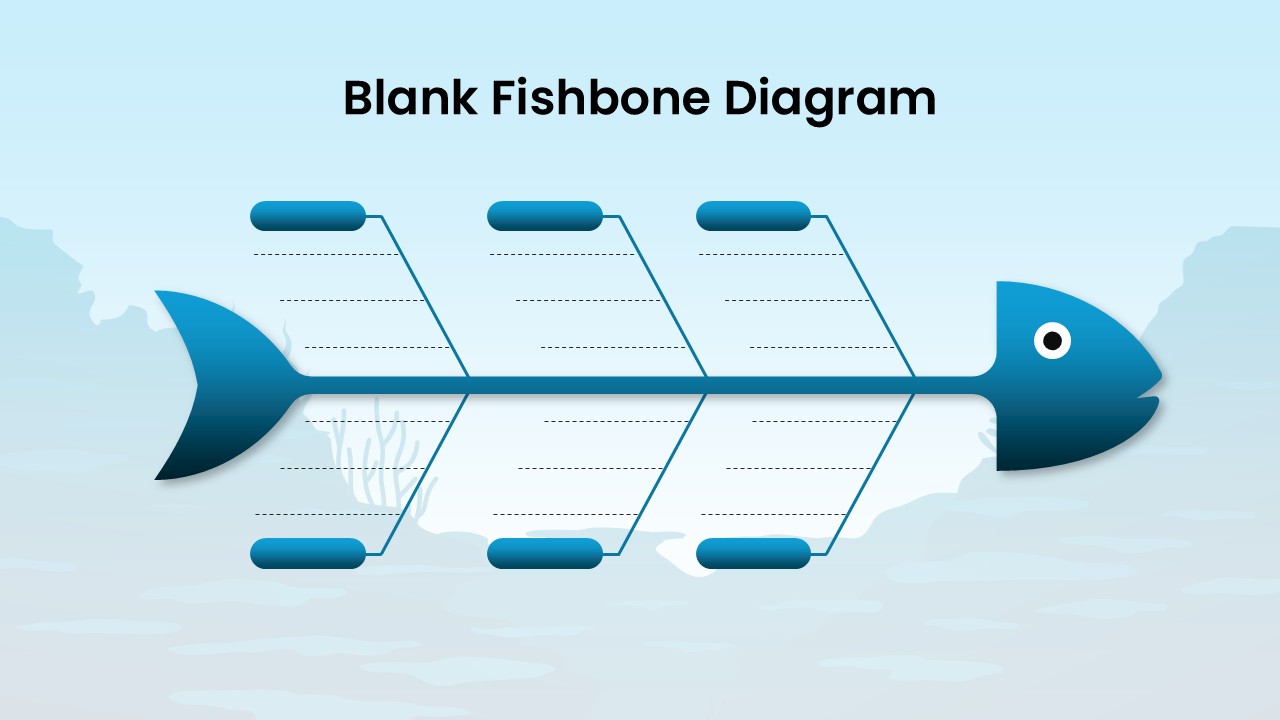
Blank Fishbone Diagram Template for PowerPoint & Google Slides
Process
Root Cause Analysis Template PowerPoint and Google Slides
Business Strategy
Sky and Tree Root Cause Analysis Deck Template for PowerPoint & Google Slides
Opportunities Challenges
Fishbone (Ishikawa) Diagram for PowerPoint & Google Slides
Process
Google Ads Optimization & Performance Infographic Template for PowerPoint & Google Slides
Digital Marketing
SQ3R Study Strategy Infographic Slides Template for PowerPoint & Google Slides
Business Strategy
Double Diamond PowerPoint Template
Process

Sales Process PowerPoint Template
Process
Casino/Poker Chips Infographic Slides template for PowerPoint & Google Slides
Business Strategy
Agenda Infographic Pack of 2 Slides Template for PowerPoint & Google Slides
Agenda
Quad Chart Infographic Pack of 8 Slides Template for PowerPoint & Google Slides
Comparison Chart
Four Options Infographic Slides Template for PowerPoint & Google Slides
Comparison
Game Plan Infographic Slides Pack Template for PowerPoint & Google Slides
Infographics
Teamwork PowerPoint Infographic Template for PowerPoint & Google Slides
Leadership
Kite Infographic PowerPoint Template for PowerPoint & Google Slides
Process
Cladogram Infographic Di Template for PowerPoint & Google Slides Template
Decision Tree
Workflow PowerPoint Template
Process
Free Infographic Deck PowerPoint Pack for PowerPoint & Google Slides
Infographics
Free
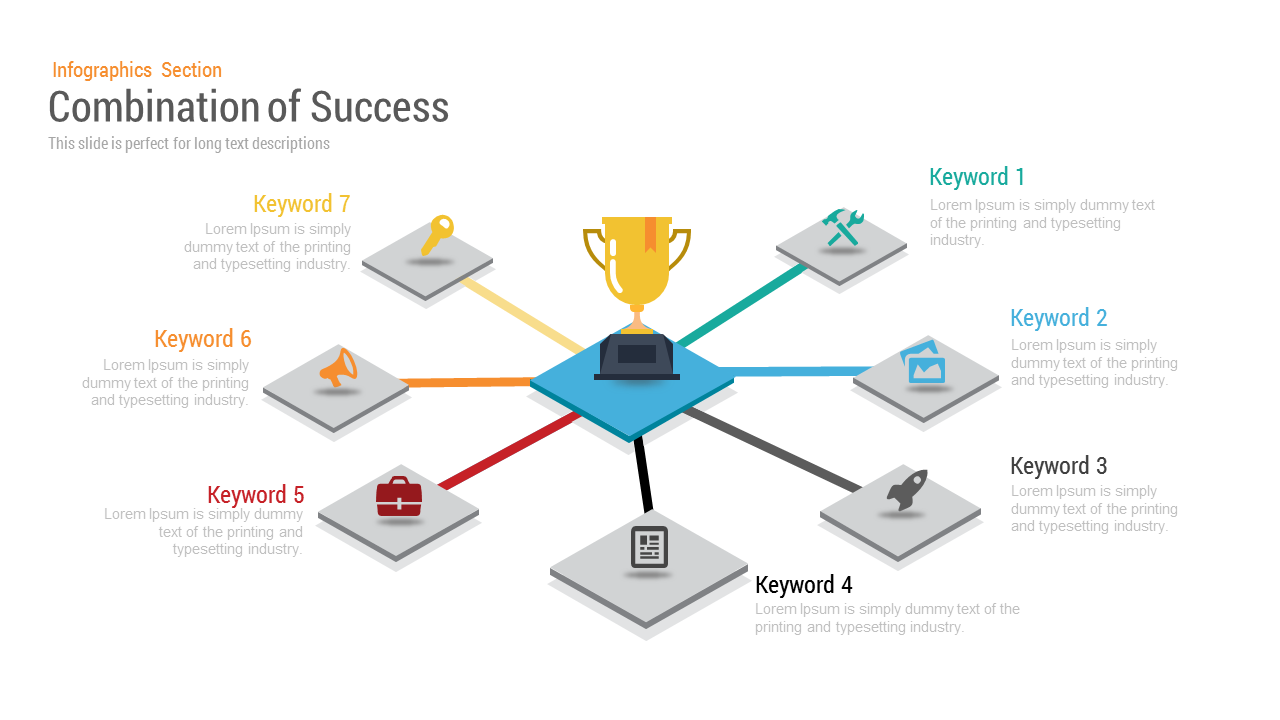
Combination of Success PowerPoint Template
Business Strategy
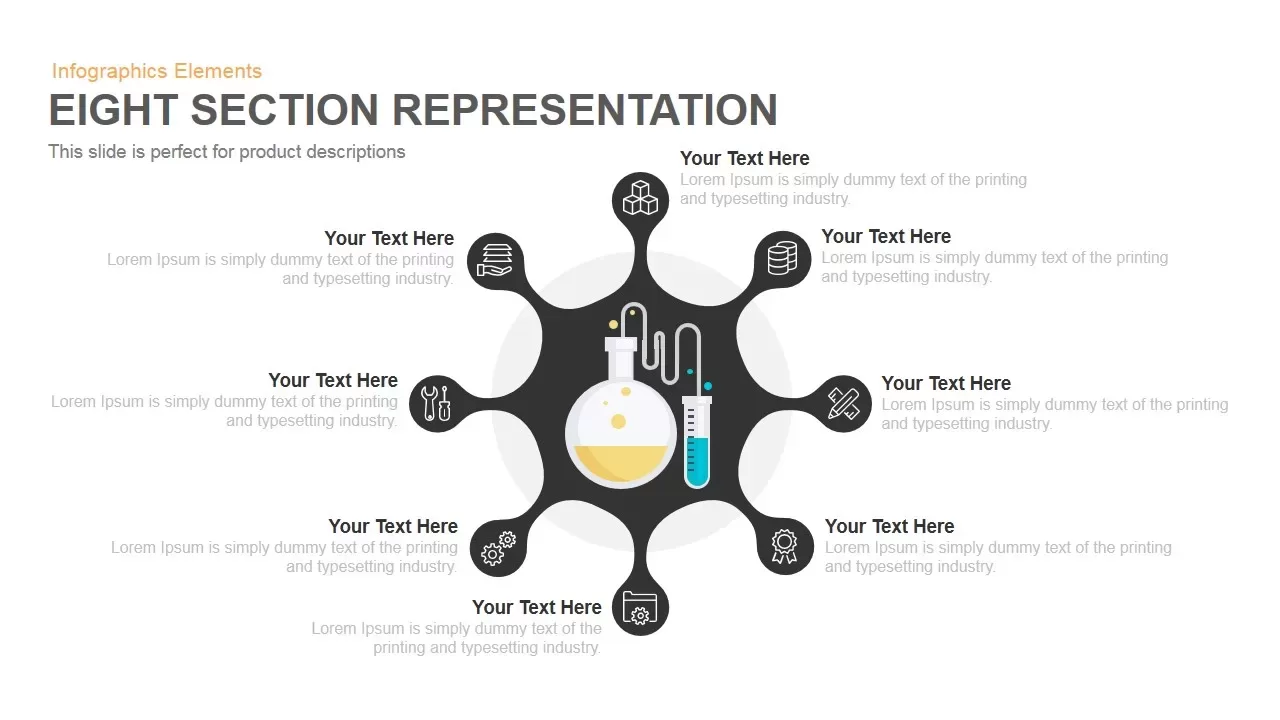
Eight Section Lab Infographic with Icons Template for PowerPoint & Google Slides
Circular
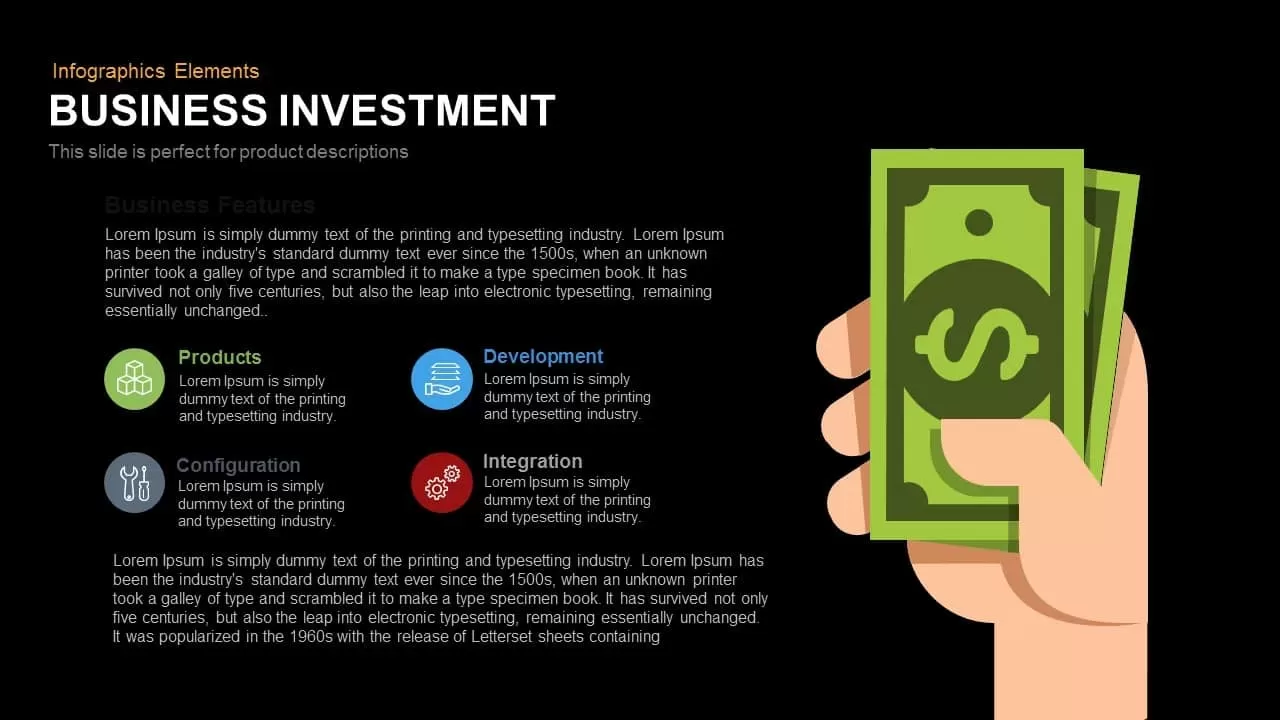
Business Investment Features Infographic Template for PowerPoint & Google Slides
Finance
7-Stage Colorful Timeline Infographic Template for PowerPoint & Google Slides
Timeline
Five Up Arrow Infographic Diagram Template for PowerPoint & Google Slides
Arrow
Three Four Five Stage Timeline Infographic Template for PowerPoint & Google Slides
Timeline
Timeline Hexagon PowerPoint Template
Timeline
Business Pricing Plan Infographic Template for PowerPoint & Google Slides
Finance
Pakistan Provinces Map Infographic Pack Template for PowerPoint & Google Slides
Maps
Modern Bubble Timeline Infographic Template for PowerPoint & Google Slides
Timeline
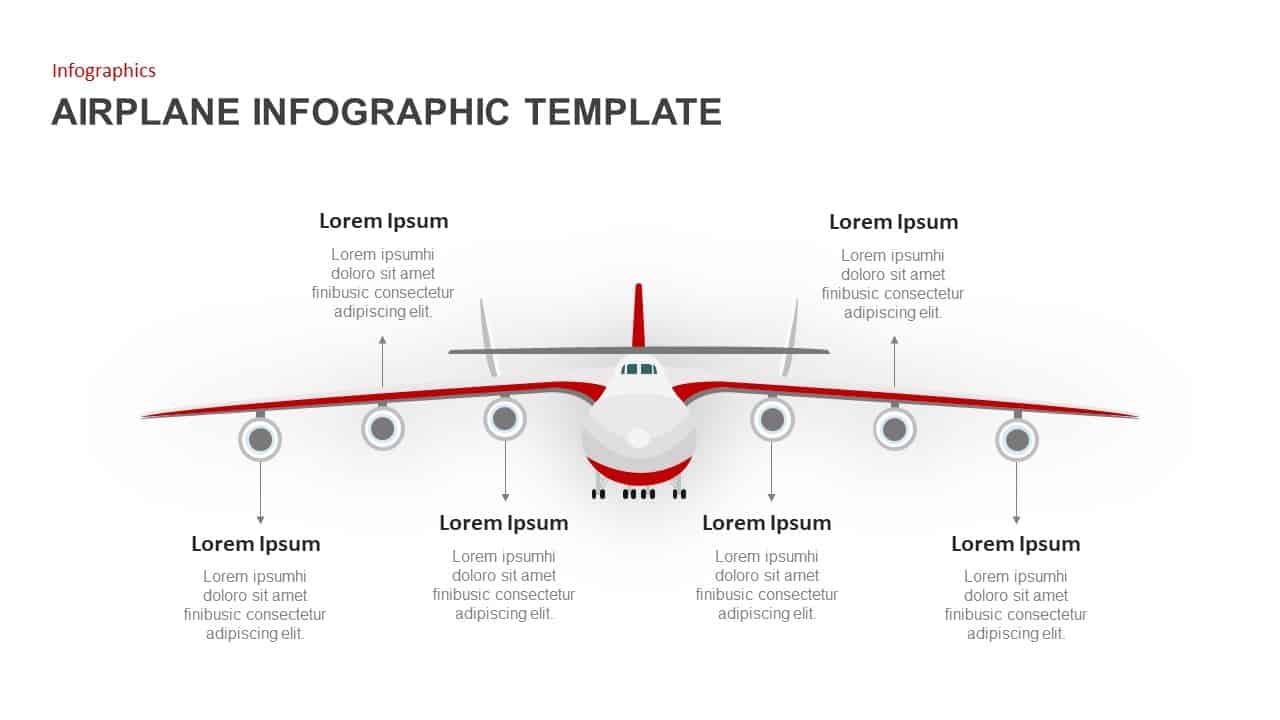
Airplane Front View Callout Infographic Template for PowerPoint & Google Slides
Comparison
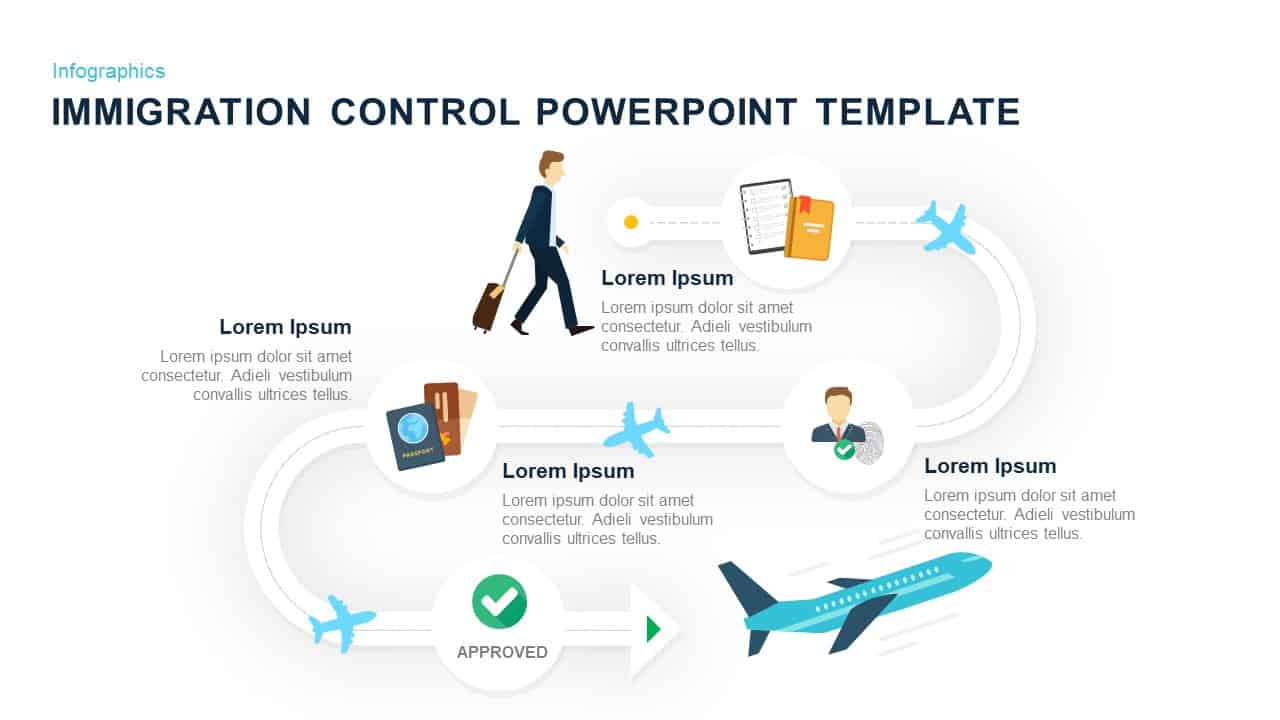
Immigration Control Process Infographic Template for PowerPoint & Google Slides
Process
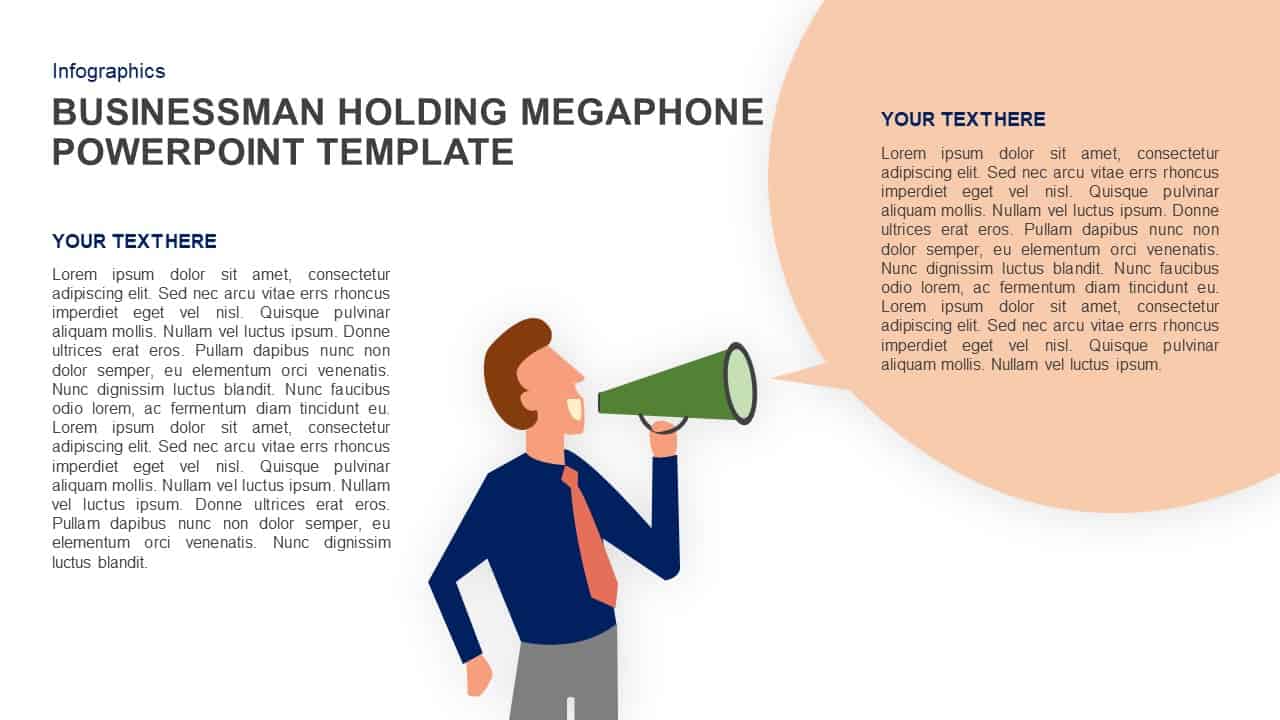
Businessman Megaphone Infographic Template
Goals
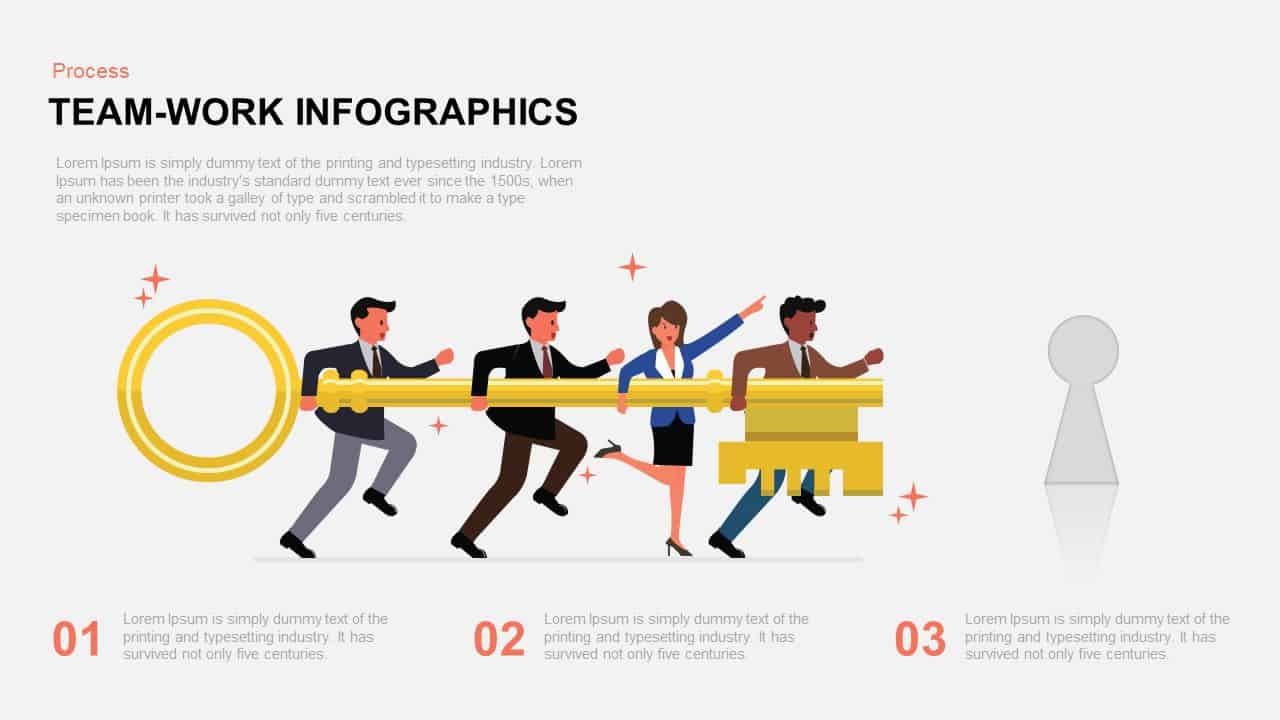
Infographic Teamwork PowerPoint Template and Keynote Slide
Process
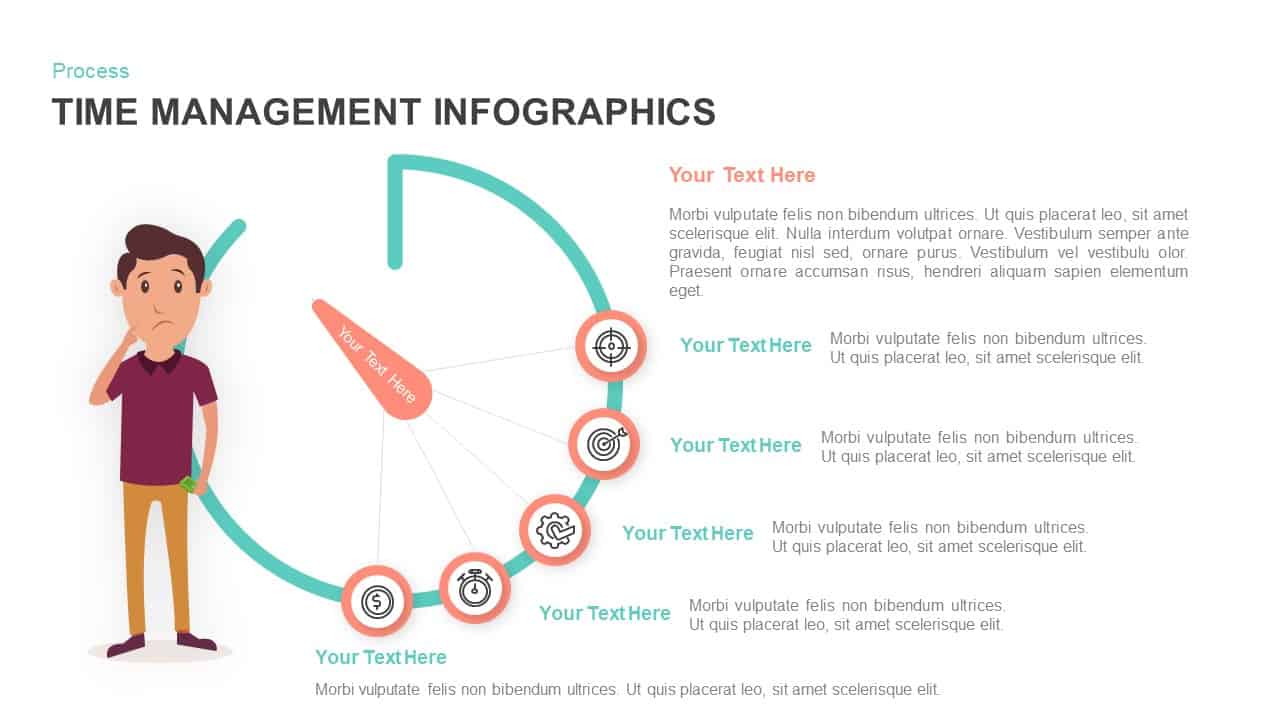
Semicircle Time Management Infographic Template for PowerPoint & Google Slides
Business Strategy
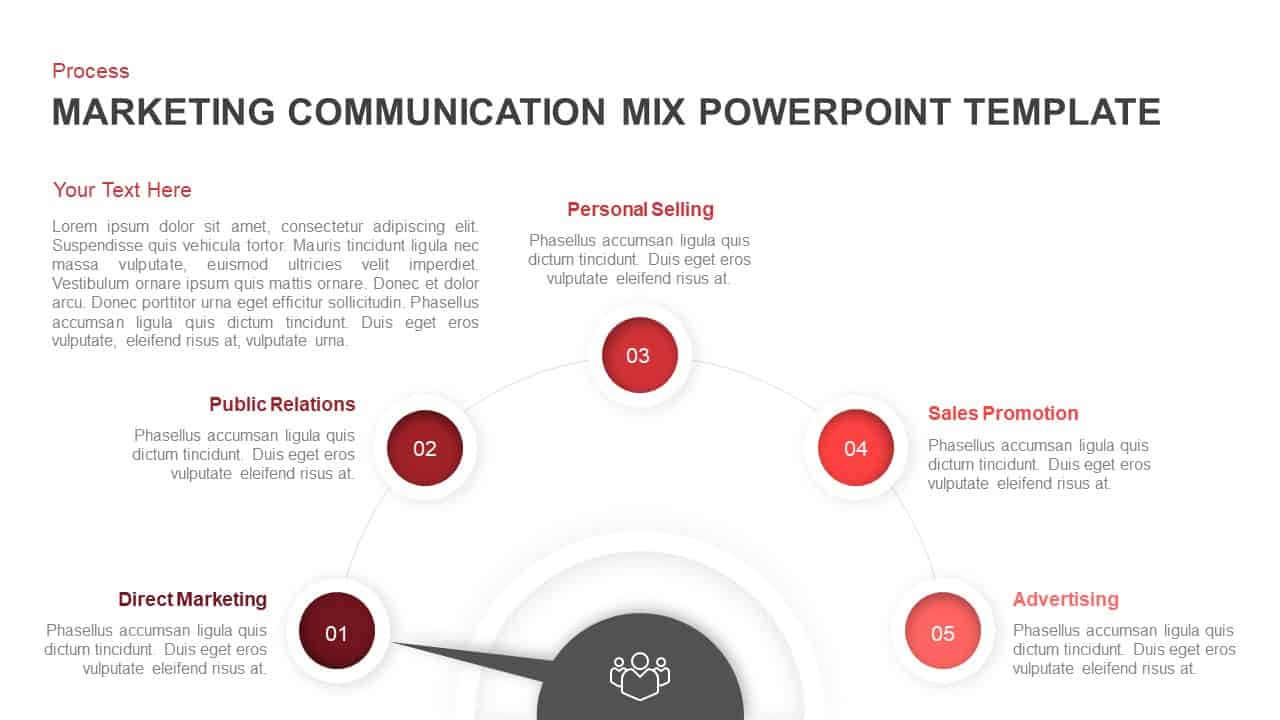
Marketing Communication Mix Infographic Template for PowerPoint & Google Slides
Marketing
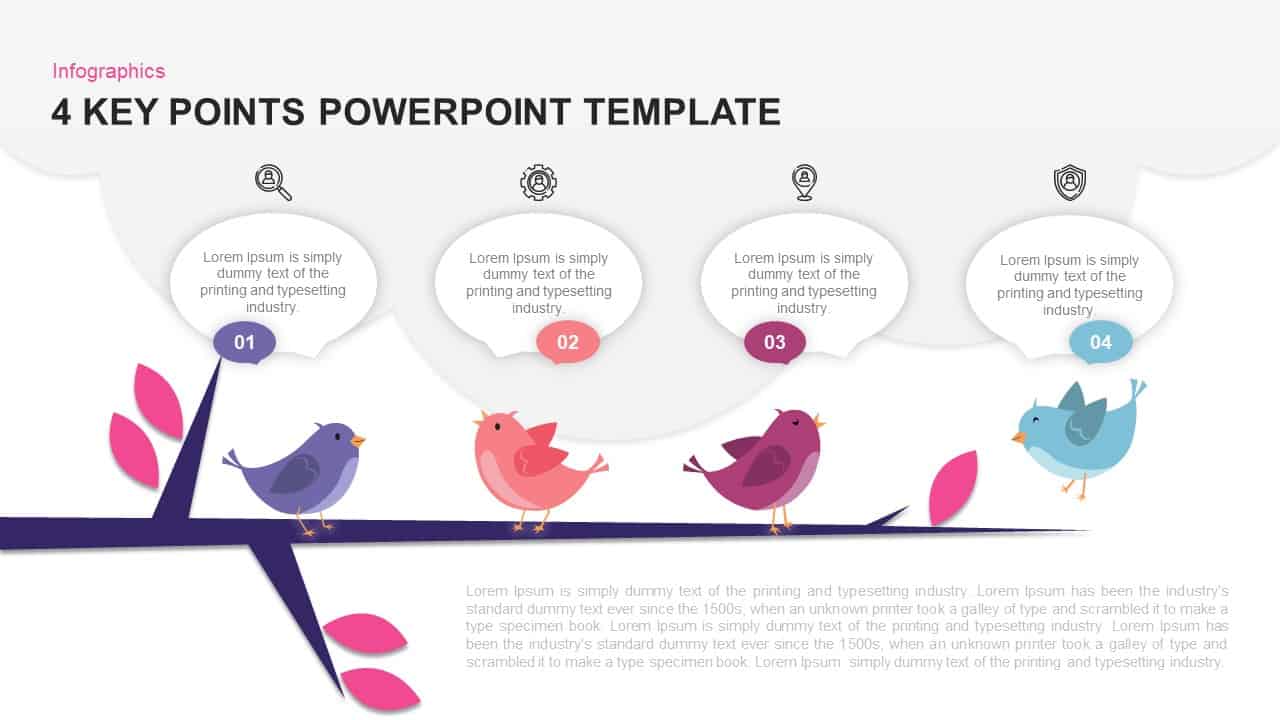
Bird Branch Four Key Points Infographic Template for PowerPoint & Google Slides
Agenda
Business Growth Infographic Metaphor Template for PowerPoint & Google Slides
Revenue
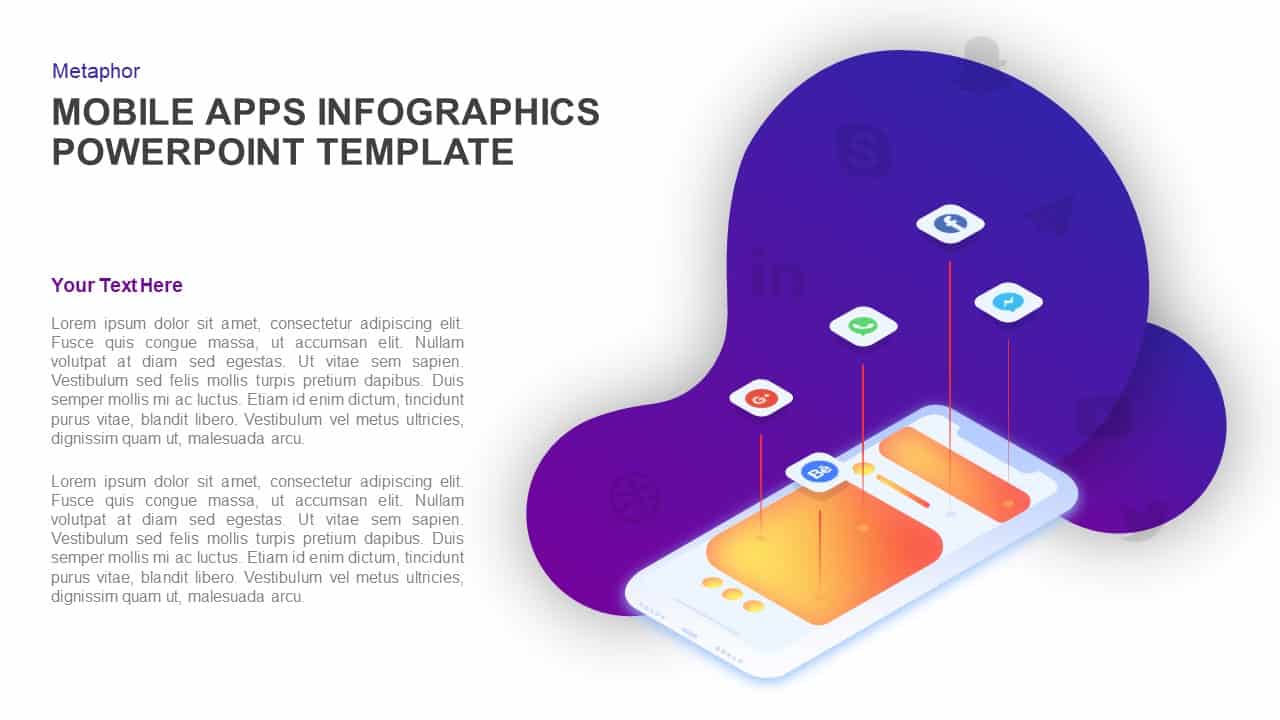
Mobile Apps Infographic Interface Template for PowerPoint & Google Slides
Software Development
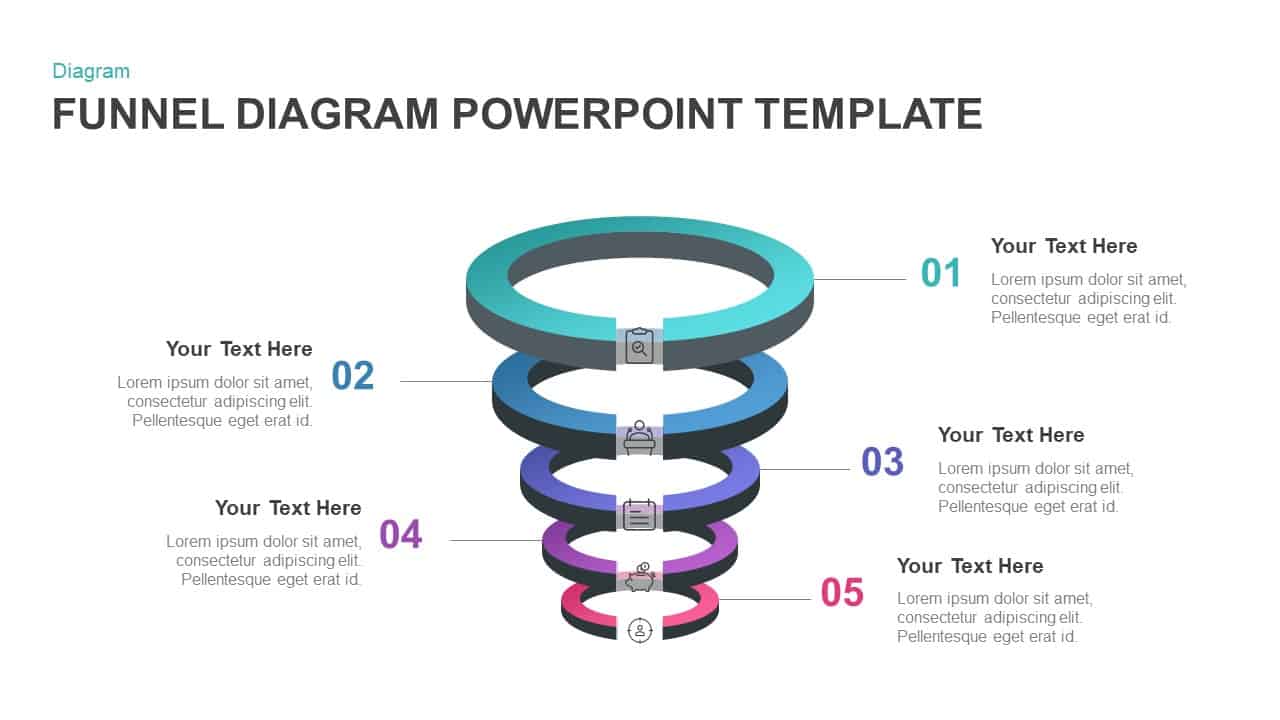
Gradient 5-Stage Funnel Infographic Template for PowerPoint & Google Slides
Funnel
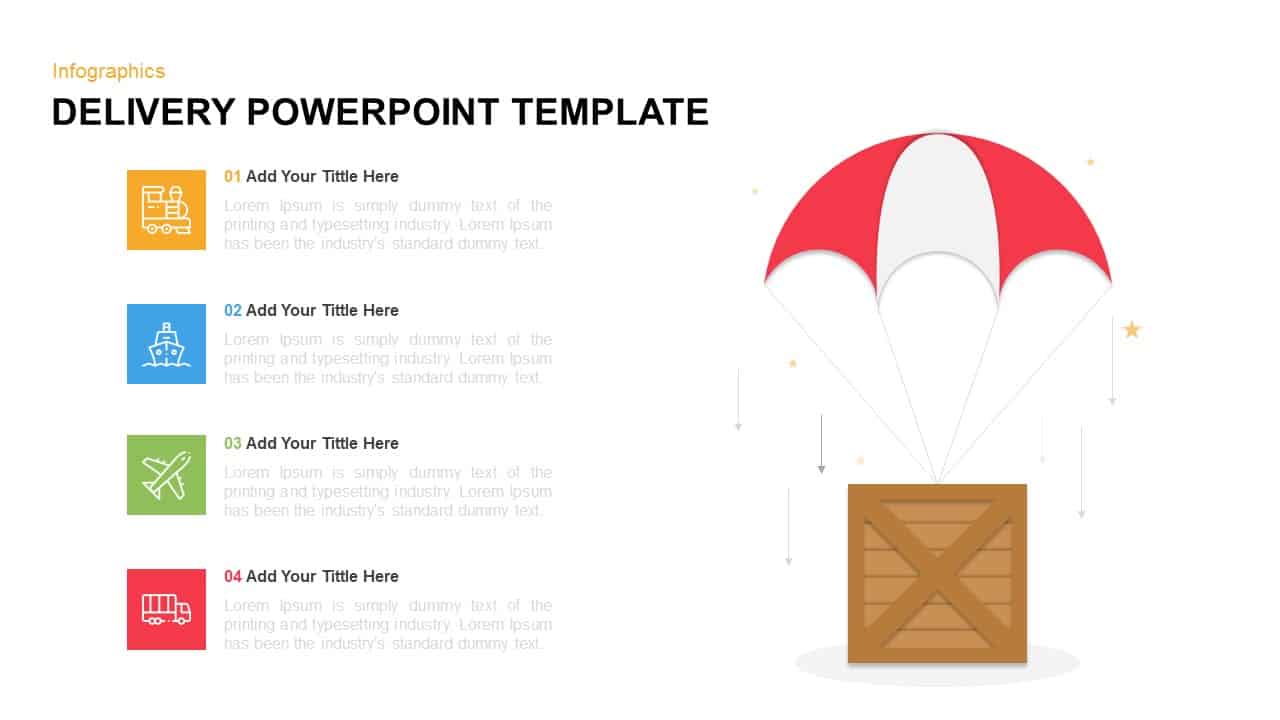
Delivery Logistics Infographic Visual Template for PowerPoint & Google Slides
Process
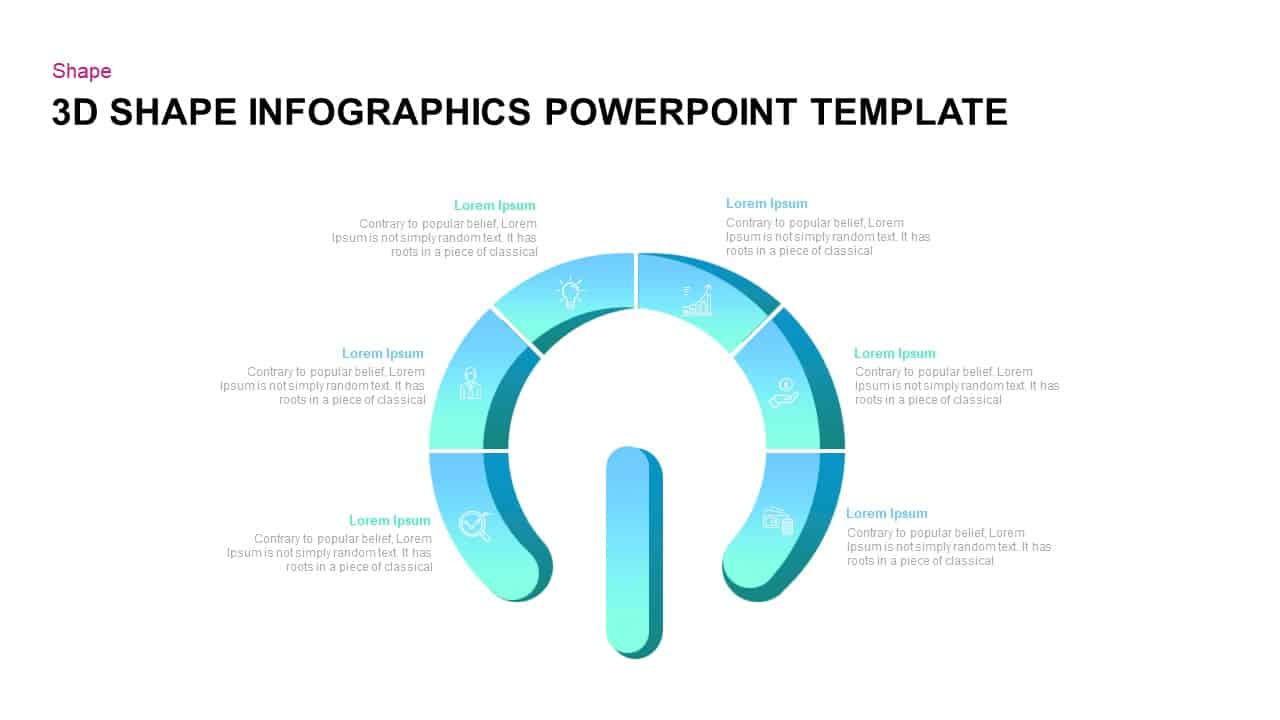
3D Segmented Shape Infographic Template for PowerPoint & Google Slides
Circular
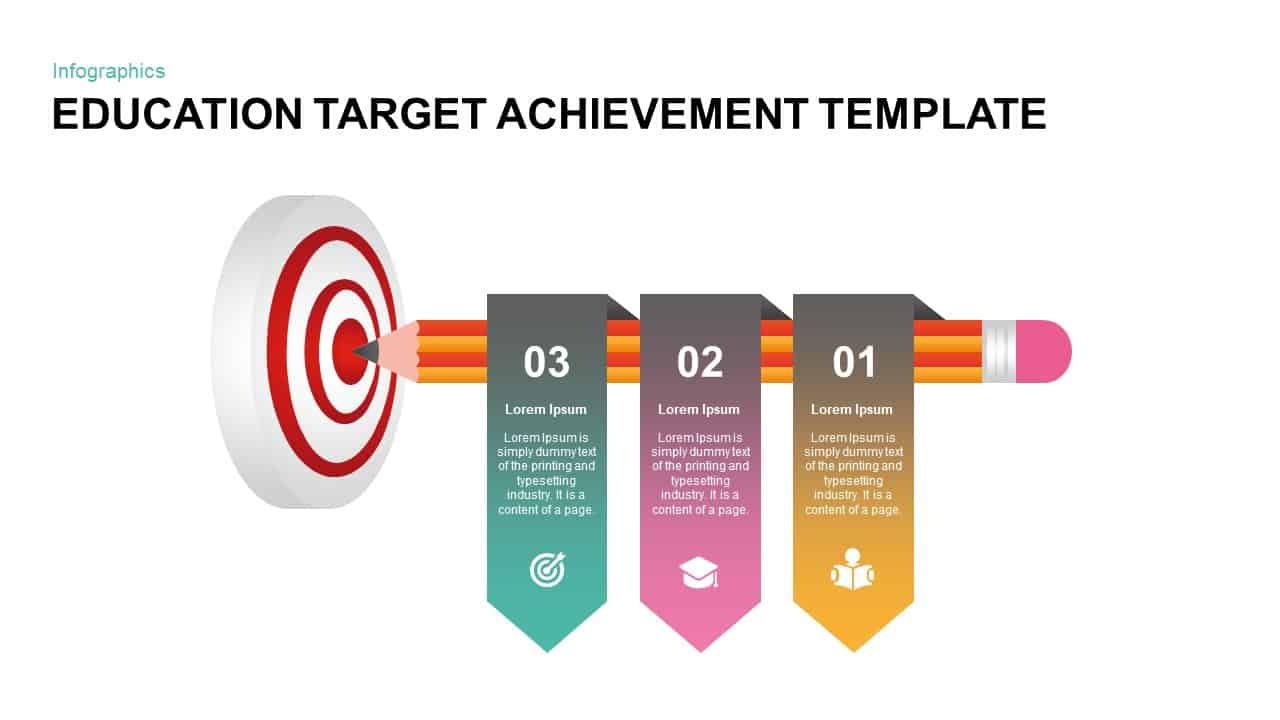
Education Target Achievement Infographic Template for PowerPoint & Google Slides
Goals
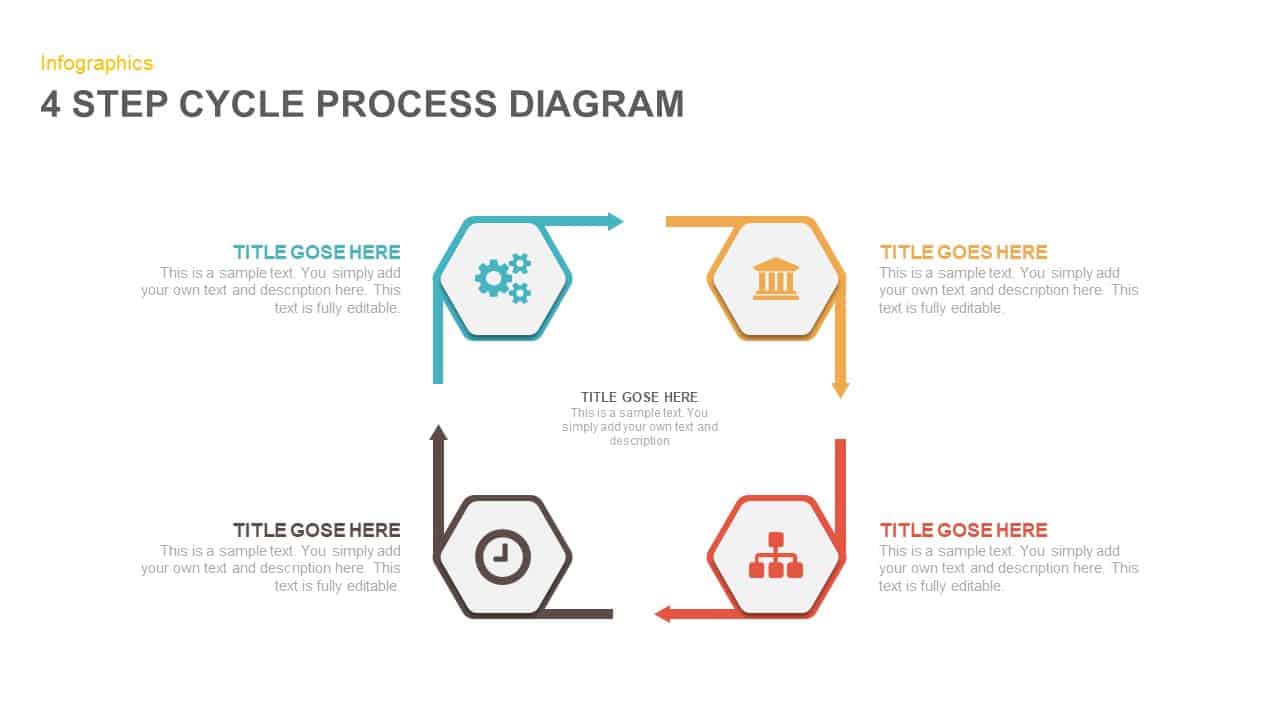
Four-Step Hexagon Process Infographic Template for PowerPoint & Google Slides
Process
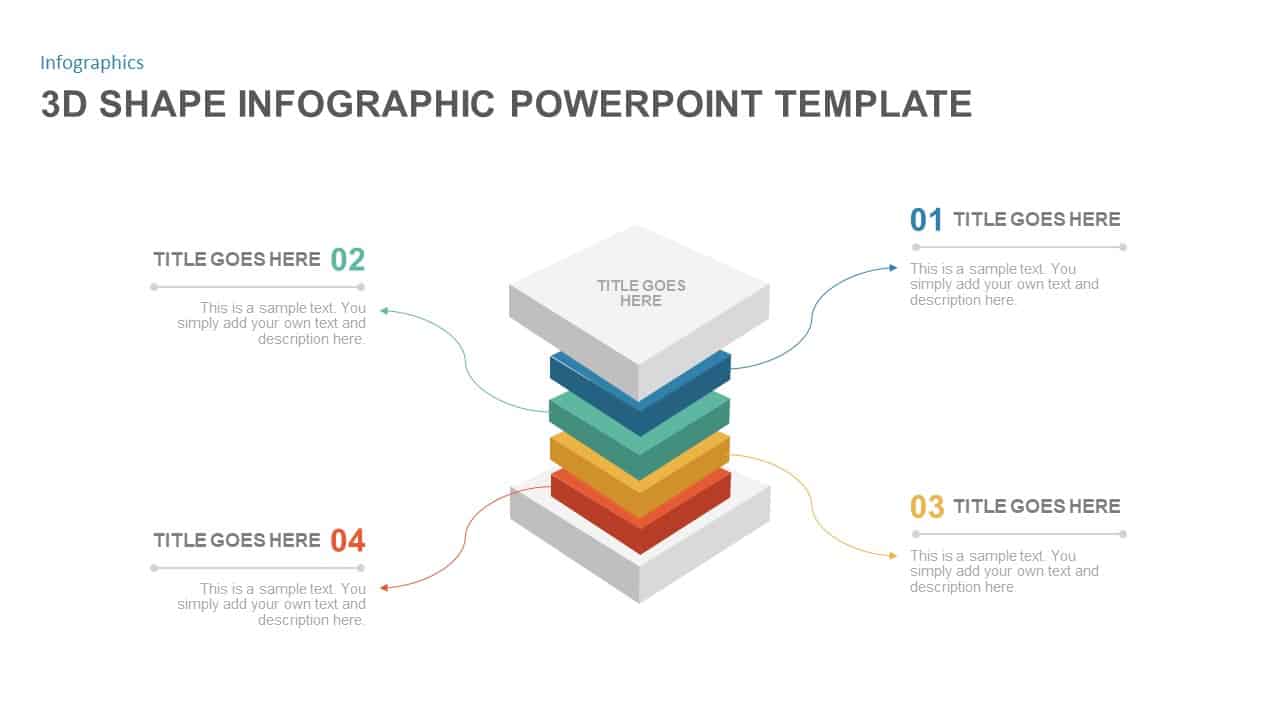
3D Layered Infographic Diagram Template for PowerPoint & Google Slides
Infographics
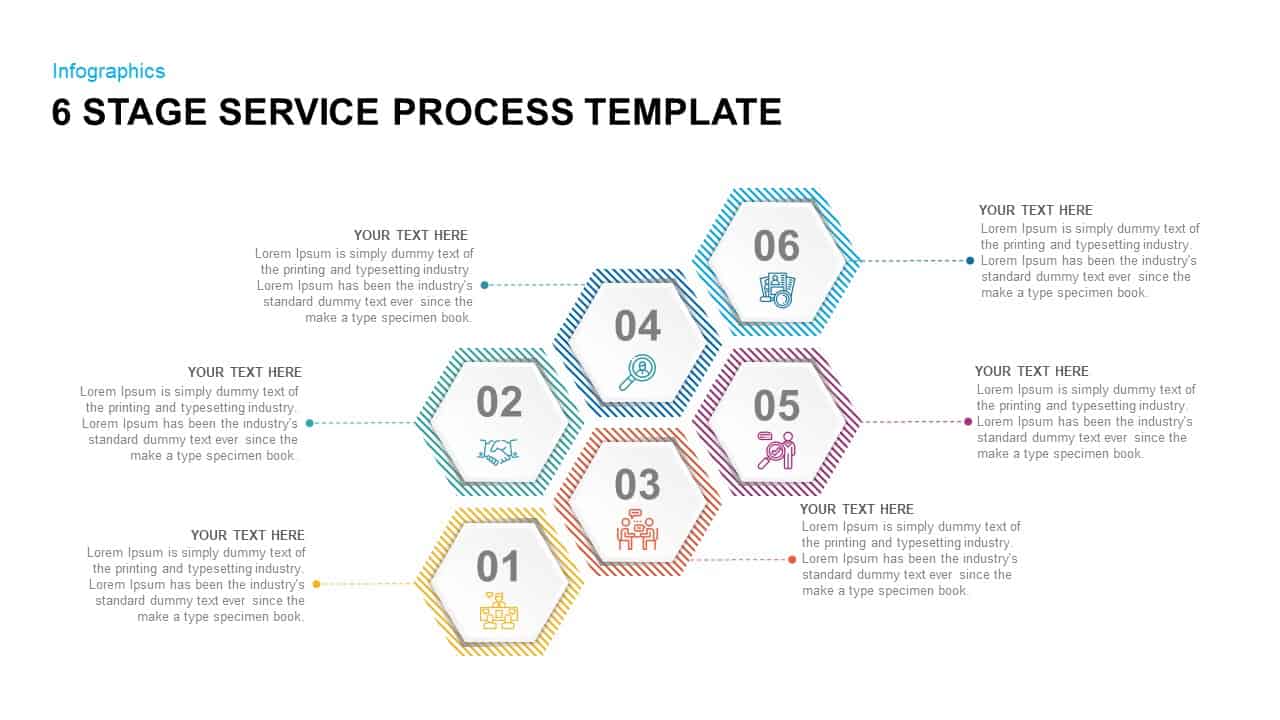
6 Stage Service Process Infographic Template for PowerPoint & Google Slides
Process

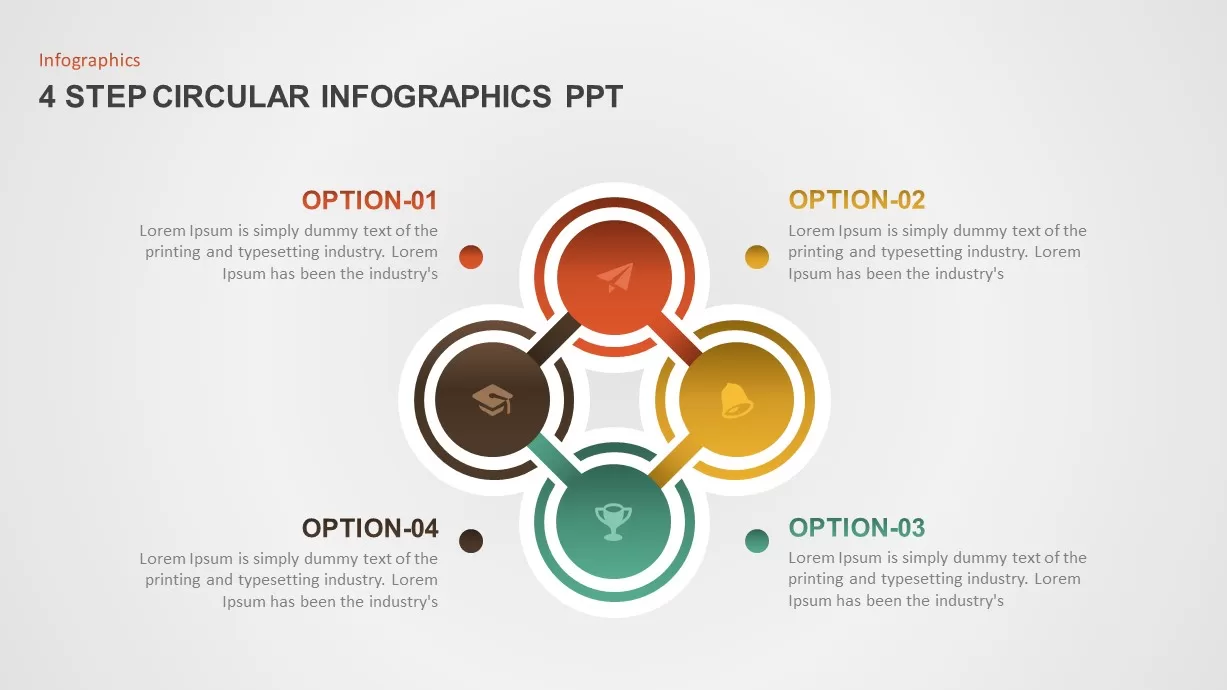
4-Step Circular Infographic Diagram Template for PowerPoint & Google Slides
Circular
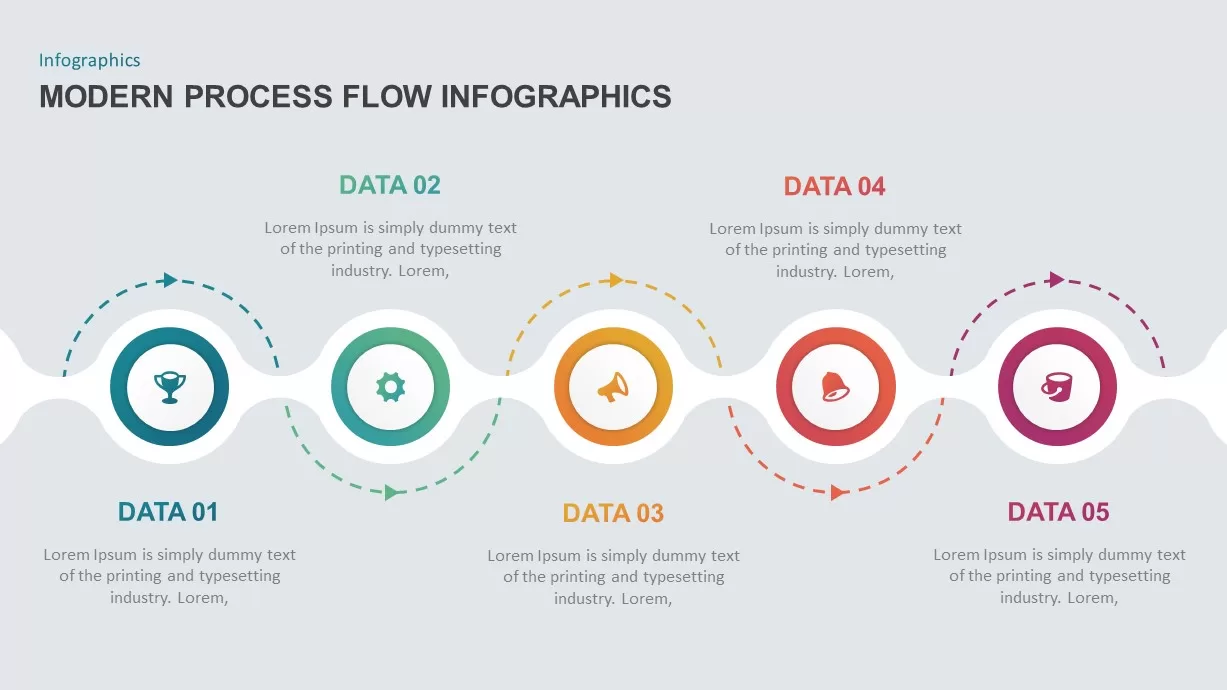
Modern Process Flow Infographic Template
Process
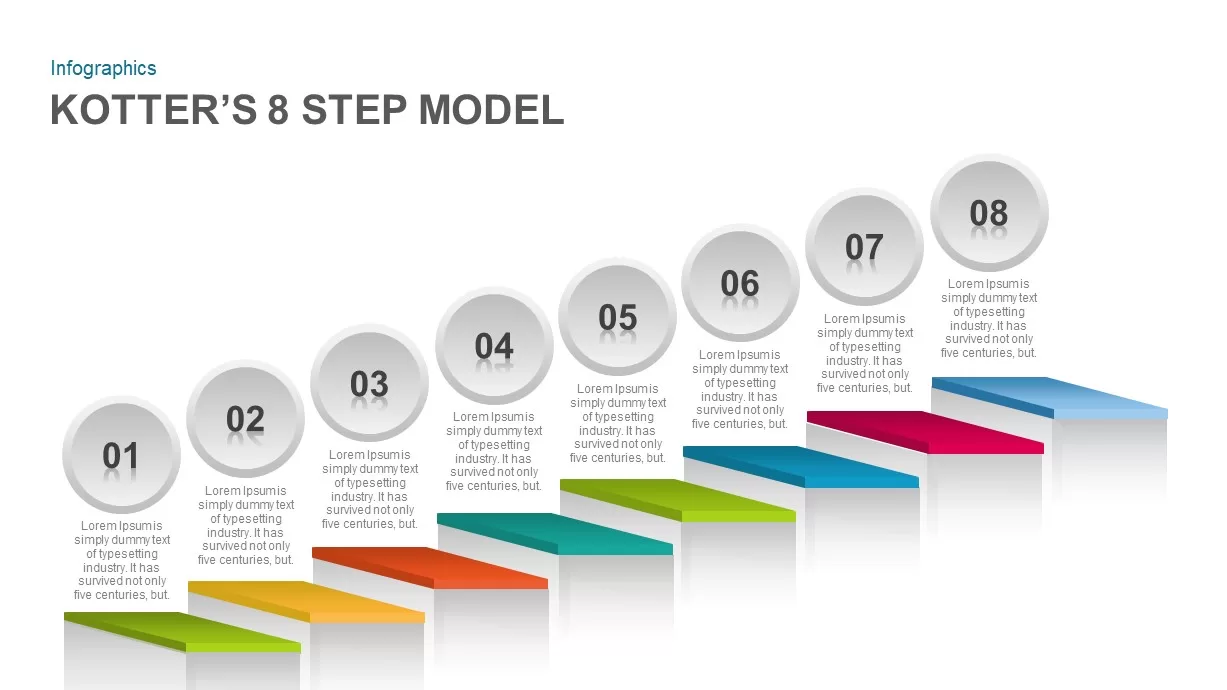
Kotter’s 8-Step Model Infographic Template for PowerPoint & Google Slides
Process
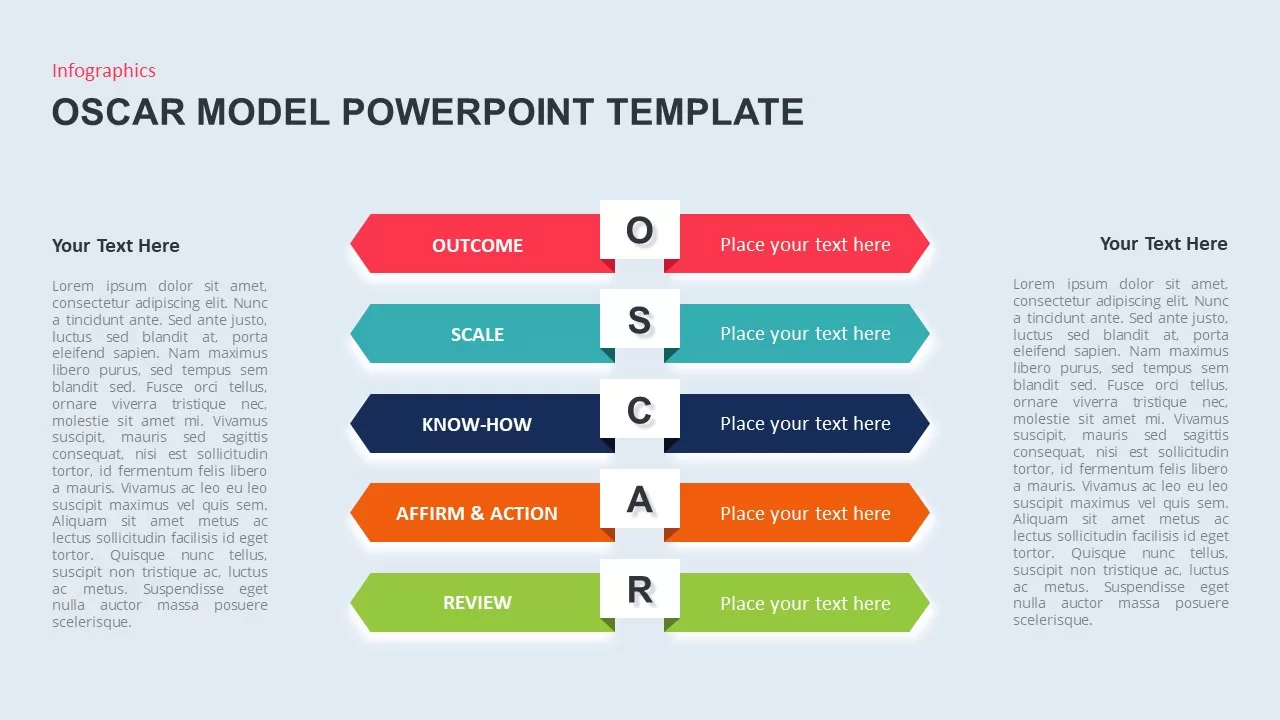
OSCAR Behavior Model Infographic Template for PowerPoint & Google Slides
HR
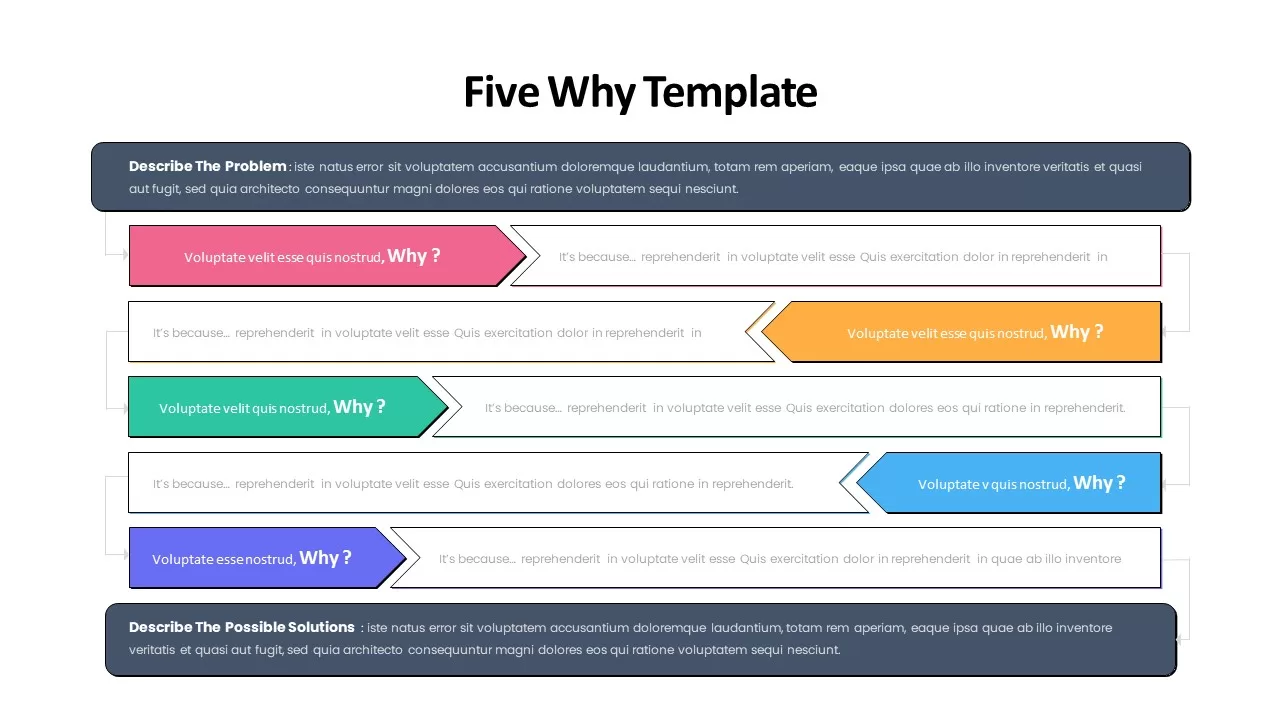
Five Whys Infographic template for PowerPoint & Google Slides
Business
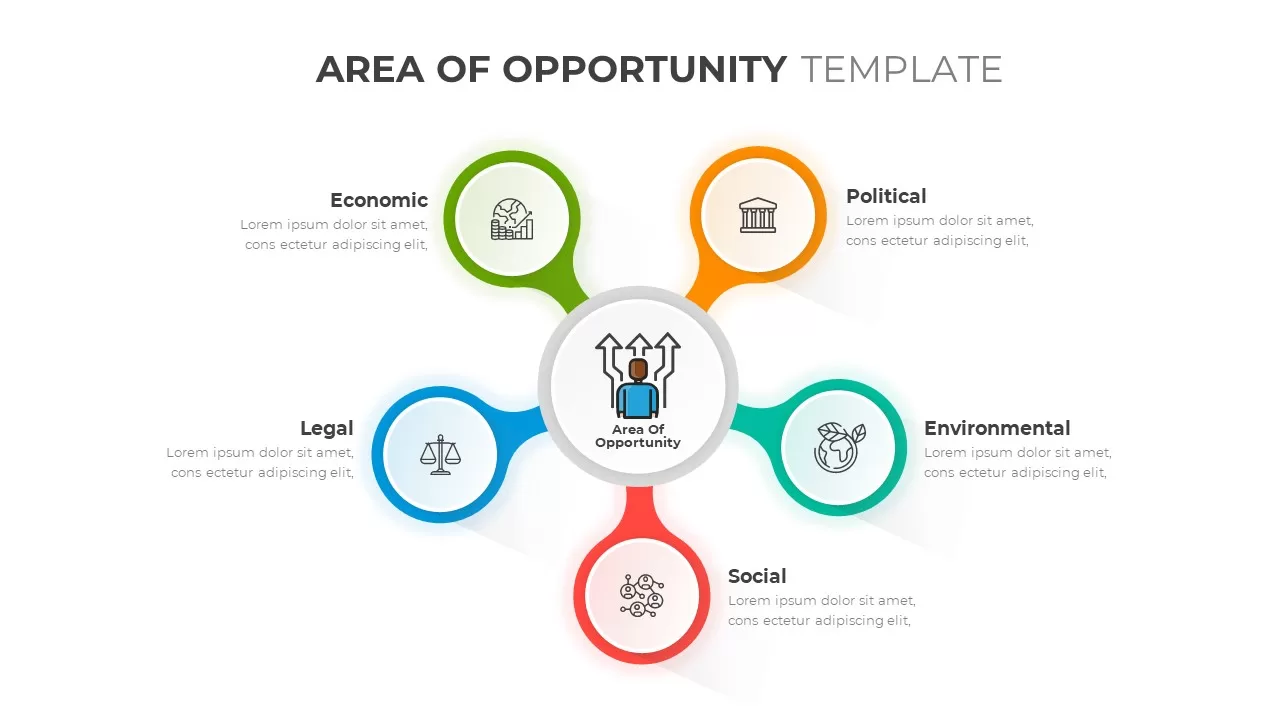
Areas of Opportunity Infographic Template for PowerPoint & Google Slides
Infographics
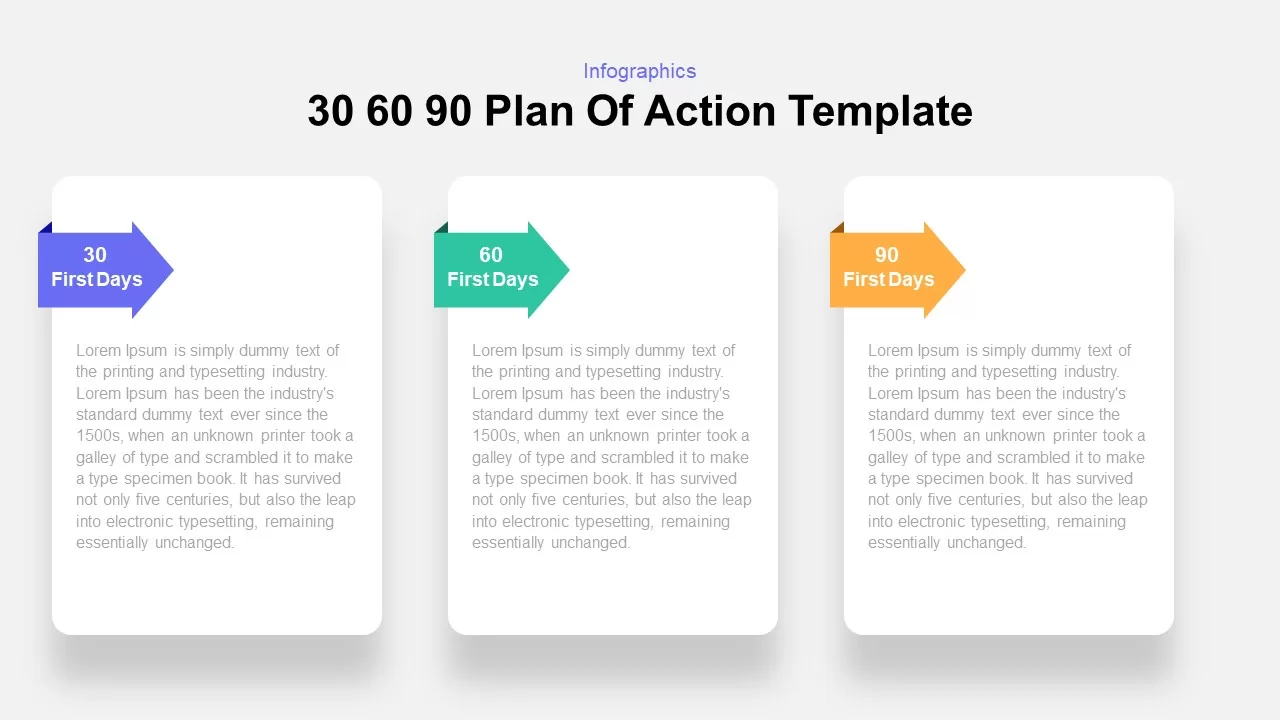
30 60 90 Plan of Action Infographics
Timeline
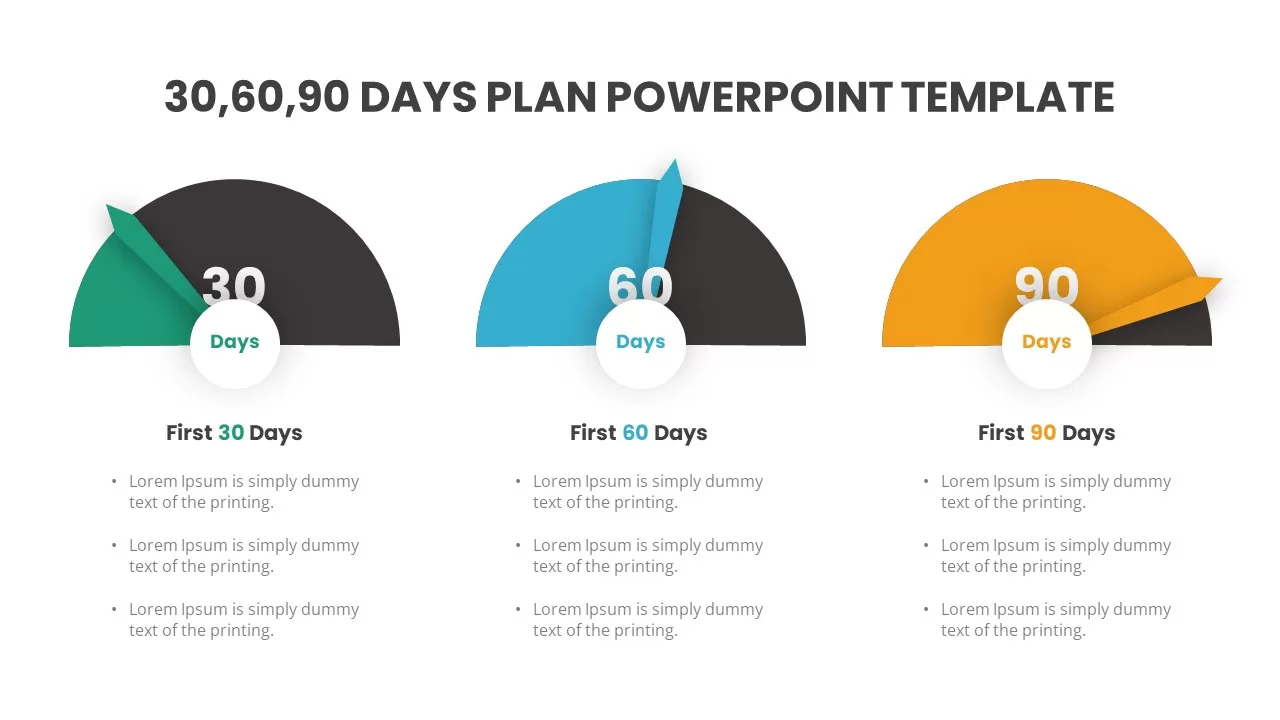
Gauge-Style 30-60-90 Day Plan Infographic Template for PowerPoint & Google Slides
Timeline
5-Day Calendar Event Infographic Template for PowerPoint & Google Slides
Agenda

Free Roadmap Infographics Template
Roadmap
Free
Curved Arrow Template PowerPoint
Process
Three-Path Curved Arrow Infographic Template for PowerPoint & Google Slides
Arrow
Four-Stage Circle Arrow Infographic Template for PowerPoint & Google Slides
Circular
PDCA Plan Do Check Act Cycle Infographic Template for PowerPoint & Google Slides
Process
Four-Stage Circle Arrow Infographic Template for PowerPoint & Google Slides
Circular
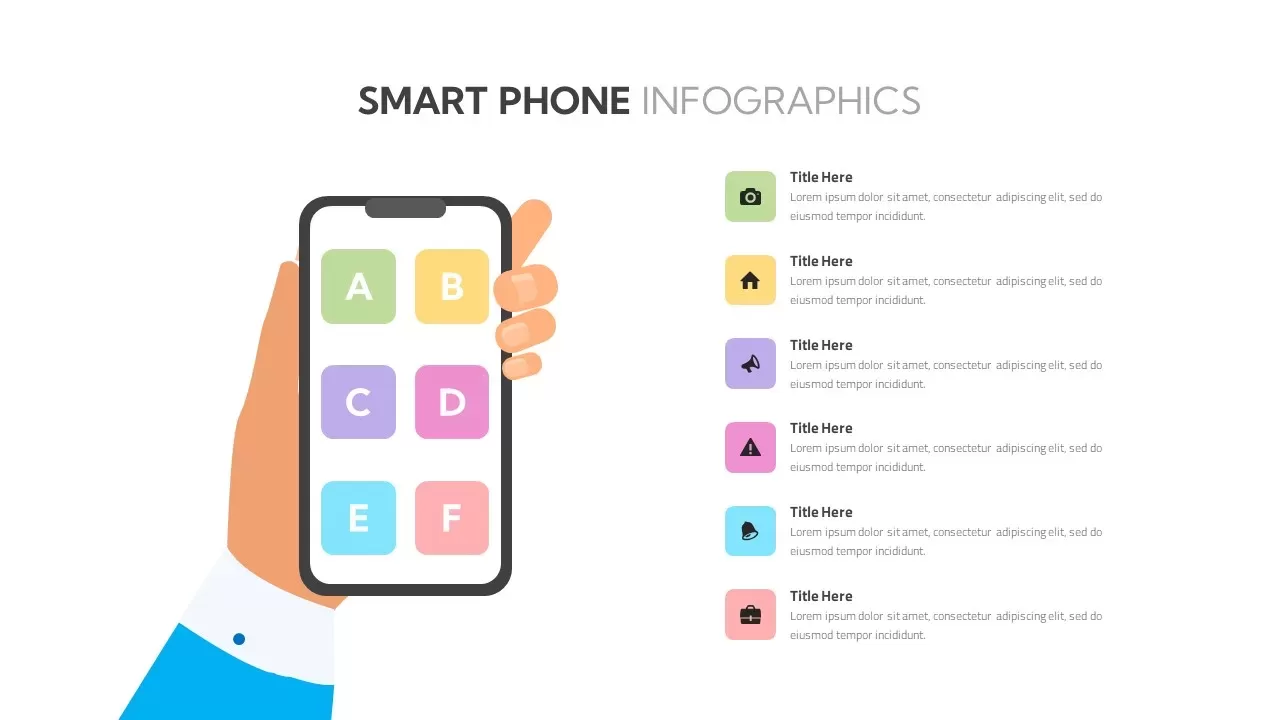
Smartphone Infographic Diagram Template for PowerPoint & Google Slides
Comparison
Dynamic Circular Hub-and-Spoke Infographic Template for PowerPoint & Google Slides
Circular
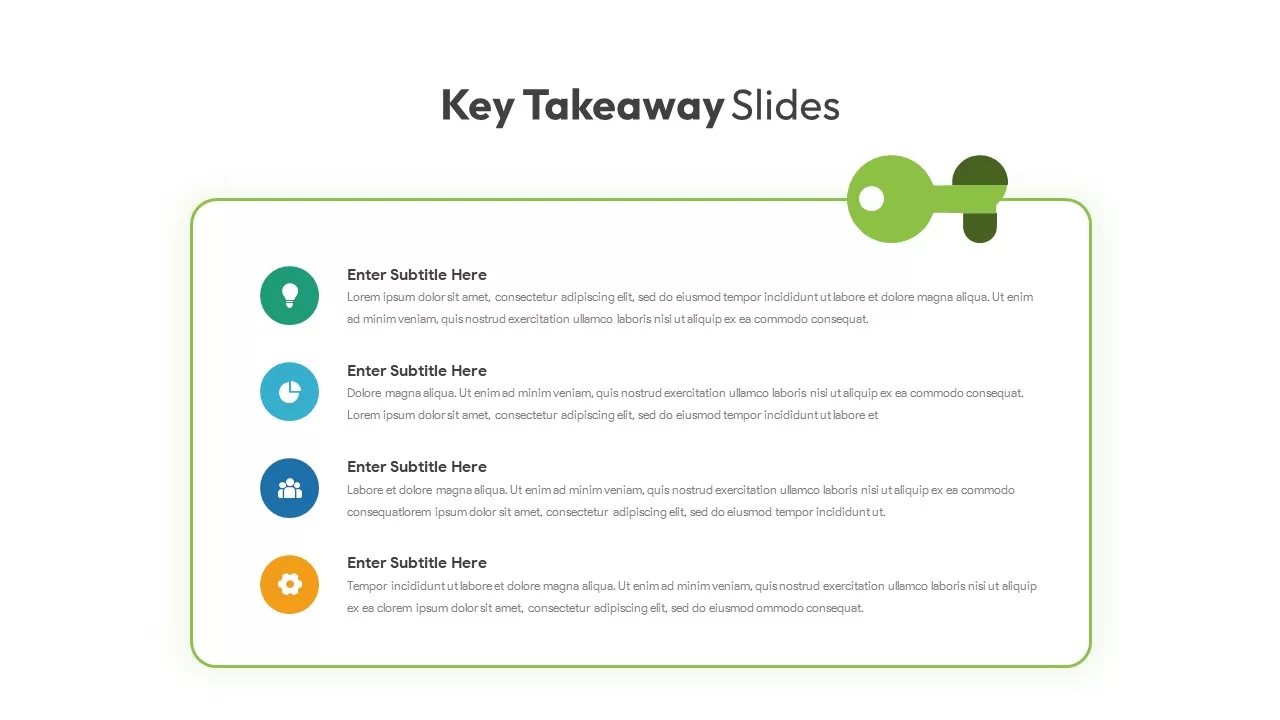
Key Takeaway Slide Infographic Template for PowerPoint & Google Slides
Process
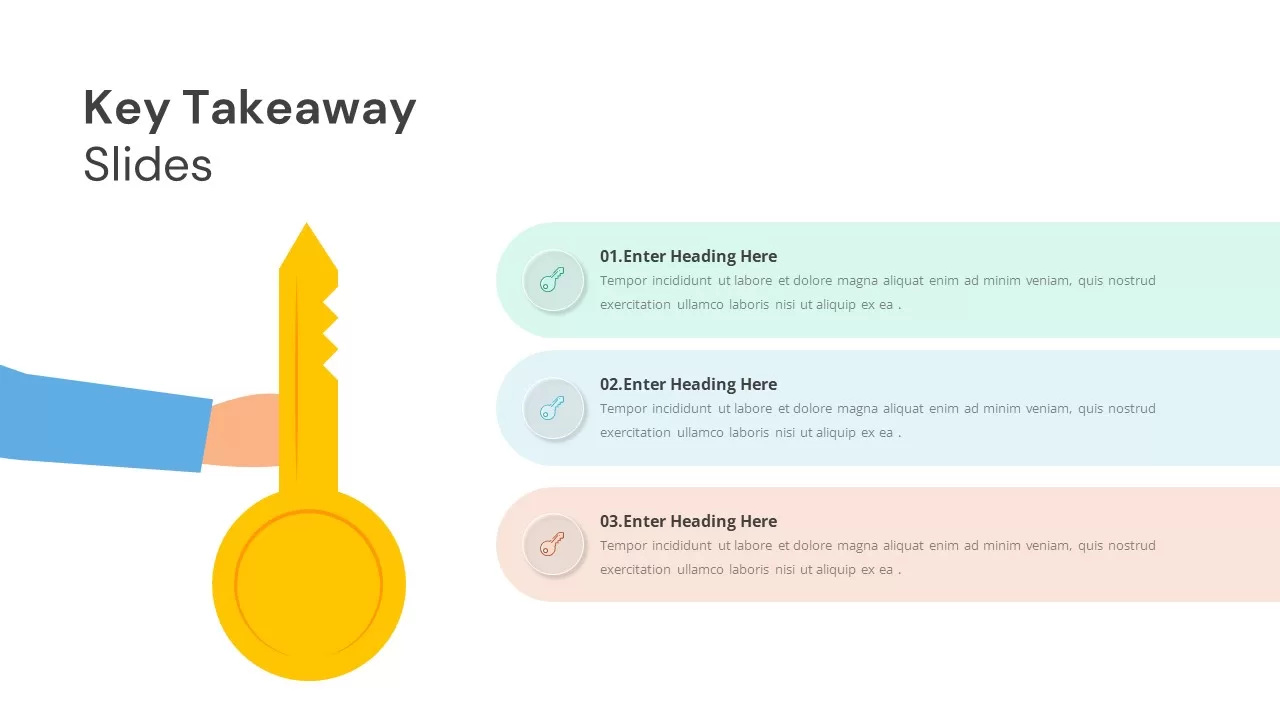
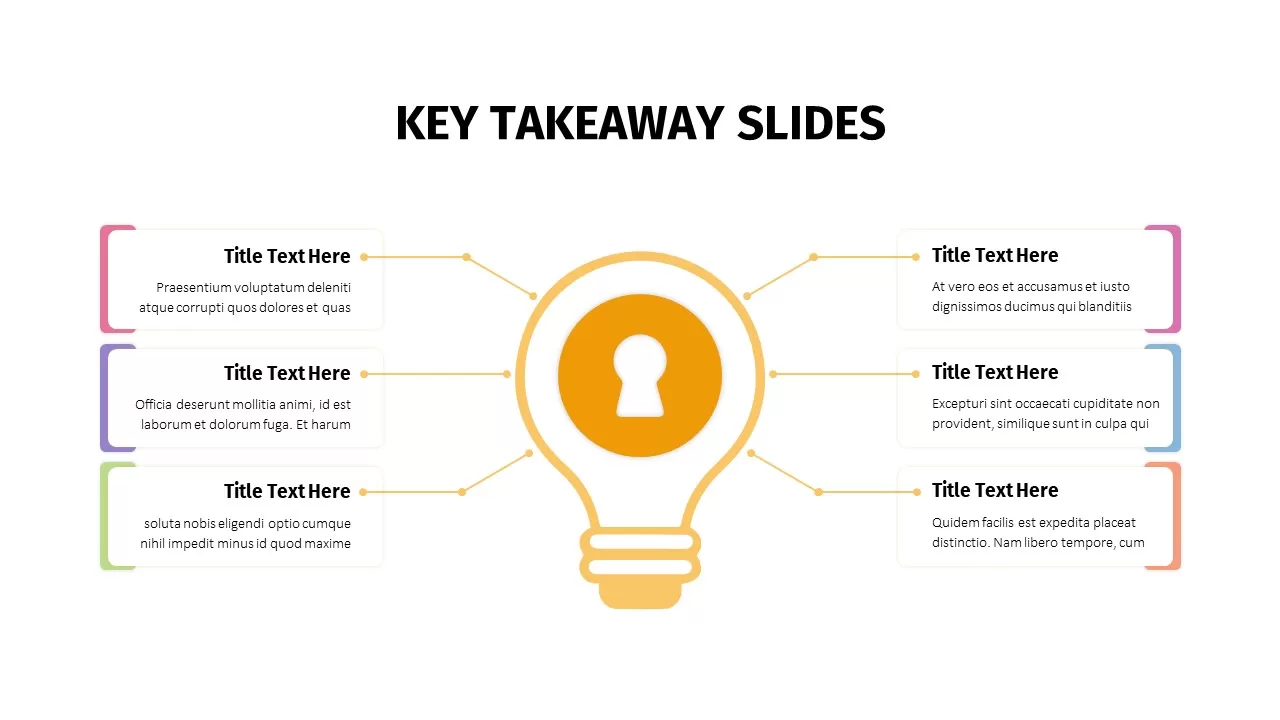
Key Takeaway Keyhole Infographic Slide Template for PowerPoint & Google Slides
Process
Animated Key Takeaway Template
Infographics
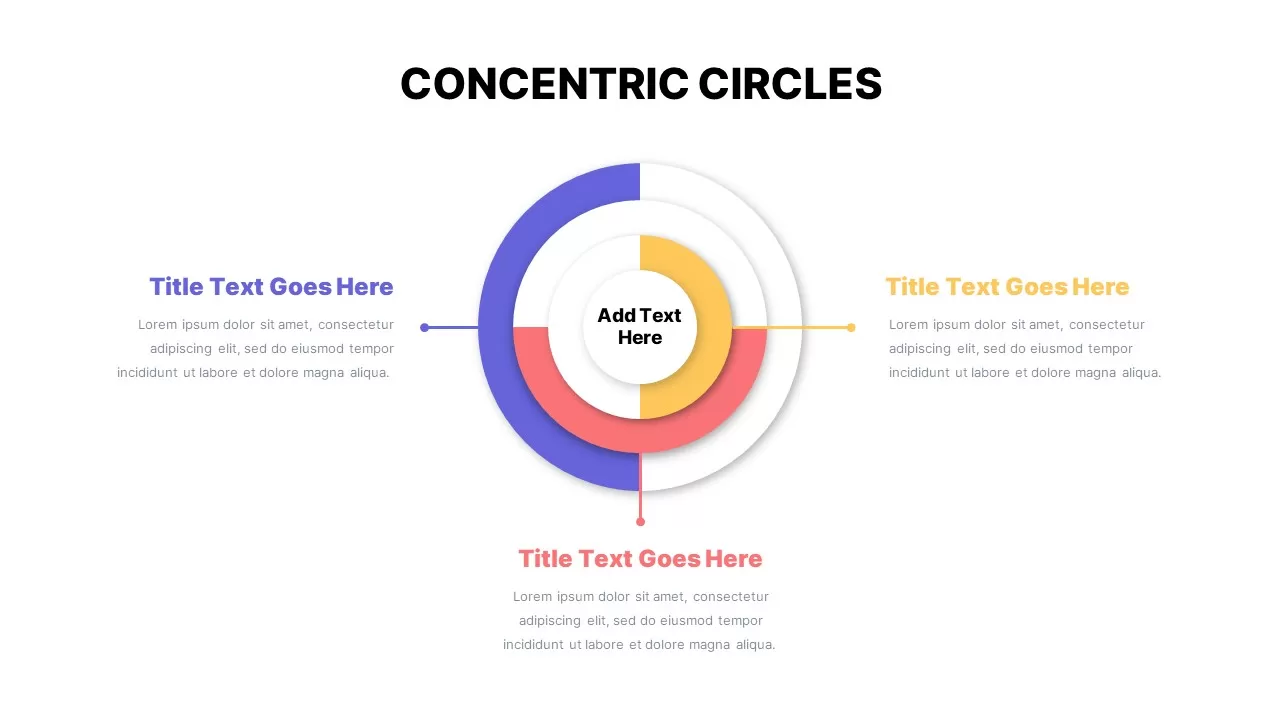
3-Tier Concentric Circles Infographic Template for PowerPoint & Google Slides
Circular
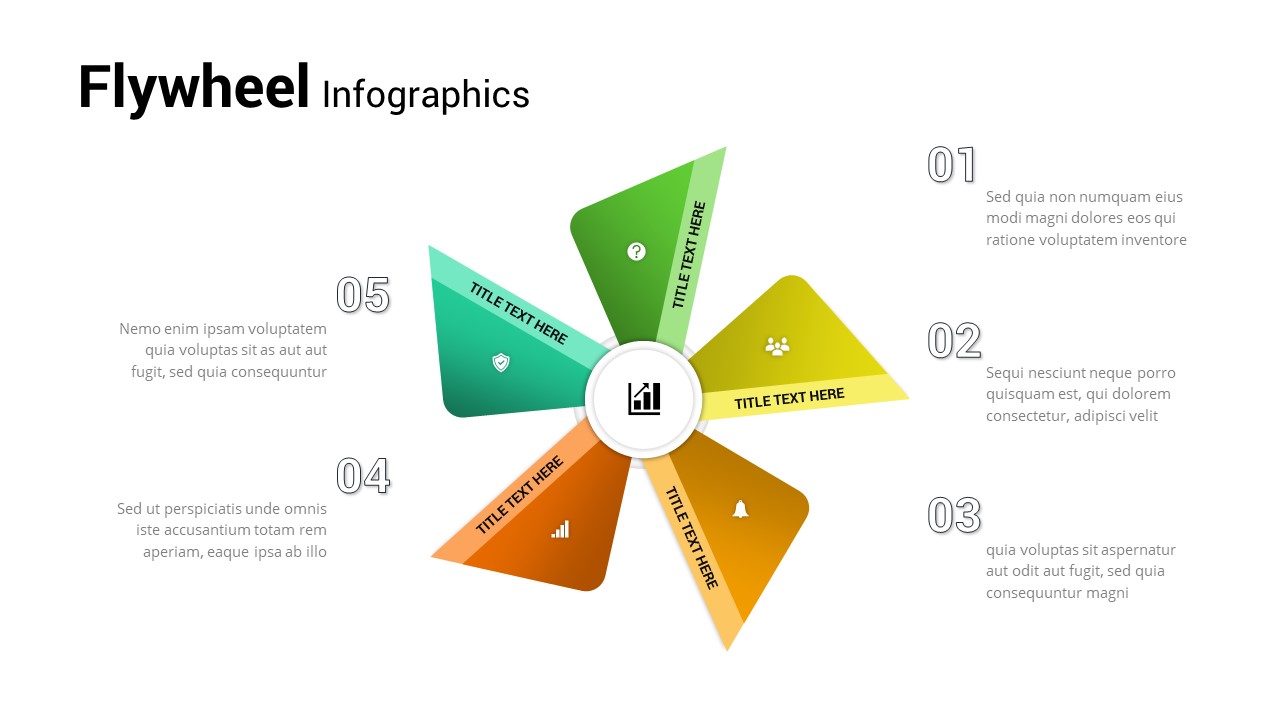
Five-Step Flywheel Infographic Diagram Template for PowerPoint & Google Slides
Process
Mastodon Metrics Infographic Dashboard Template for PowerPoint & Google Slides
Business Report
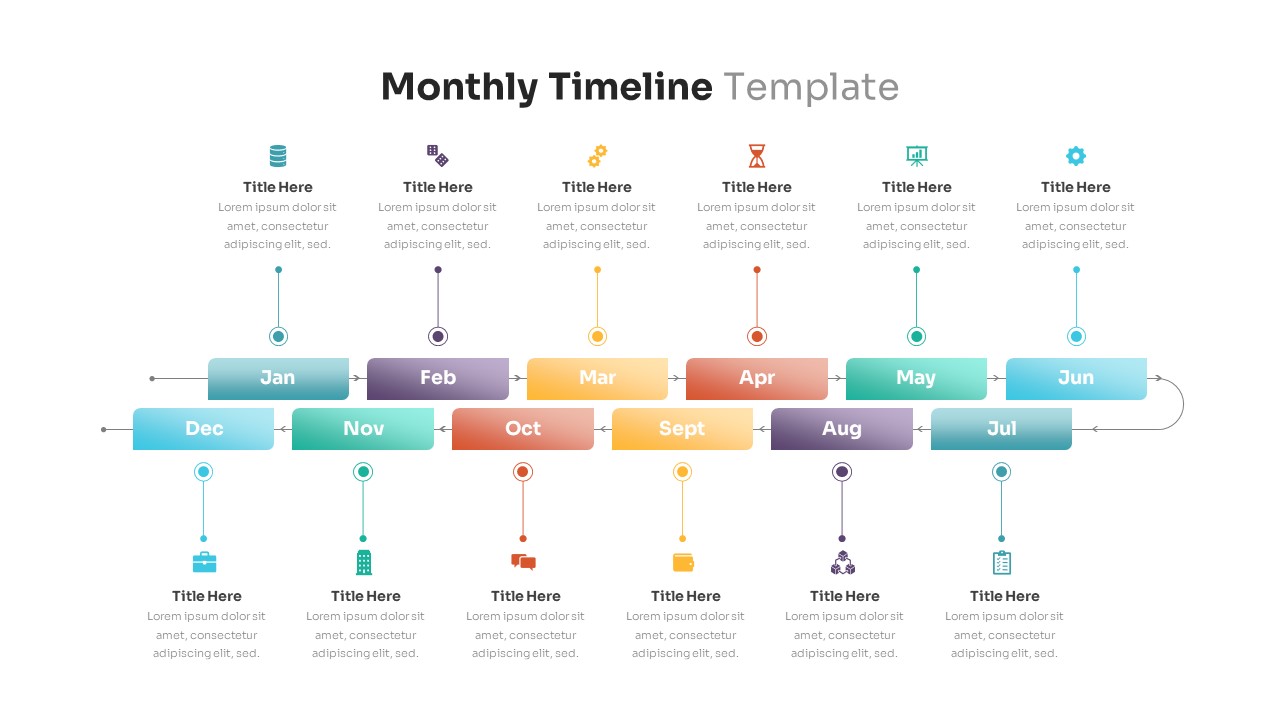
Editable Monthly Timeline Infographic Template for PowerPoint & Google Slides
Timeline
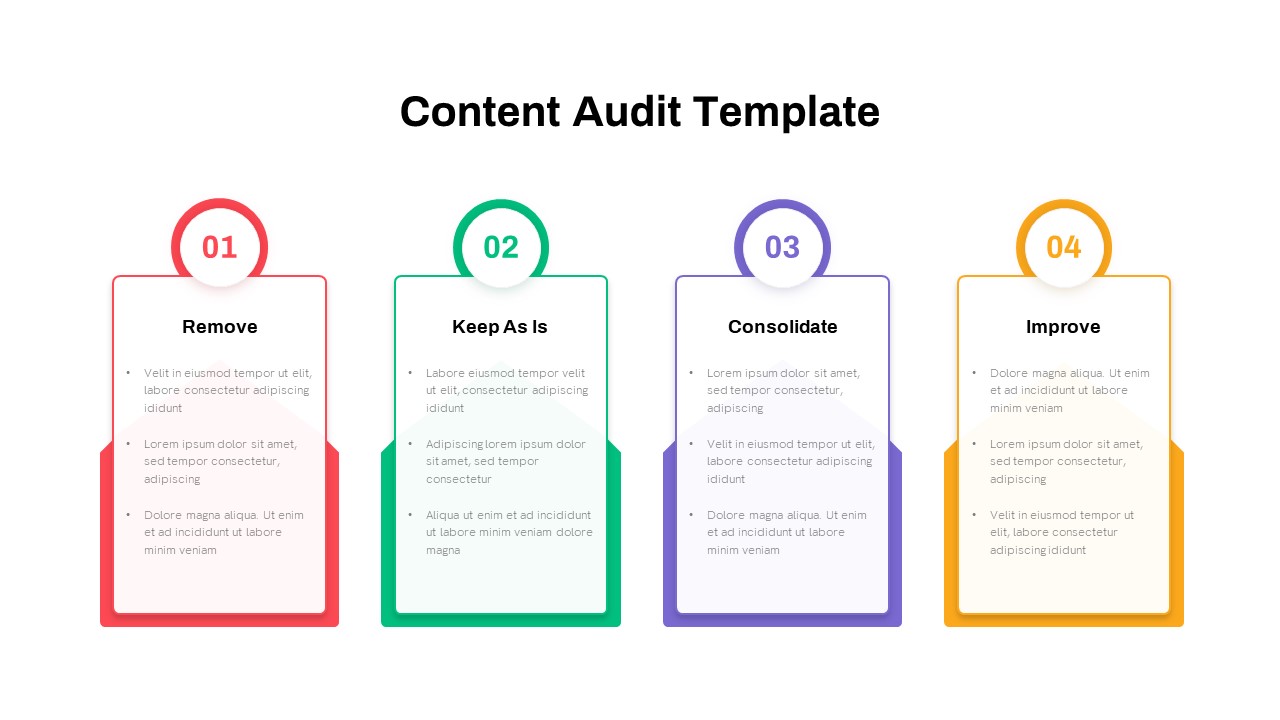
Four-Step Content Audit Infographic Template for PowerPoint & Google Slides
Process
Dynamic Chevron Timeline Infographic Template for PowerPoint & Google Slides
Timeline
Cash Management Infographic Diagram Template for PowerPoint & Google Slides
Circular
Business Intelligence Infographic & Flow Template for PowerPoint & Google Slides
Business Report
Four-Level Food Pyramid Infographic Template for PowerPoint & Google Slides
Pyramid
Free Animated DNA Infographic Diagram Template for PowerPoint & Google Slides
Infographics
Free
Free Multi-Step Funnel Infographic Slide Pack Template for PowerPoint & Google Slides
Funnel
Free
Training Roadmap Infographic Pack Template for PowerPoint & Google Slides
Roadmap
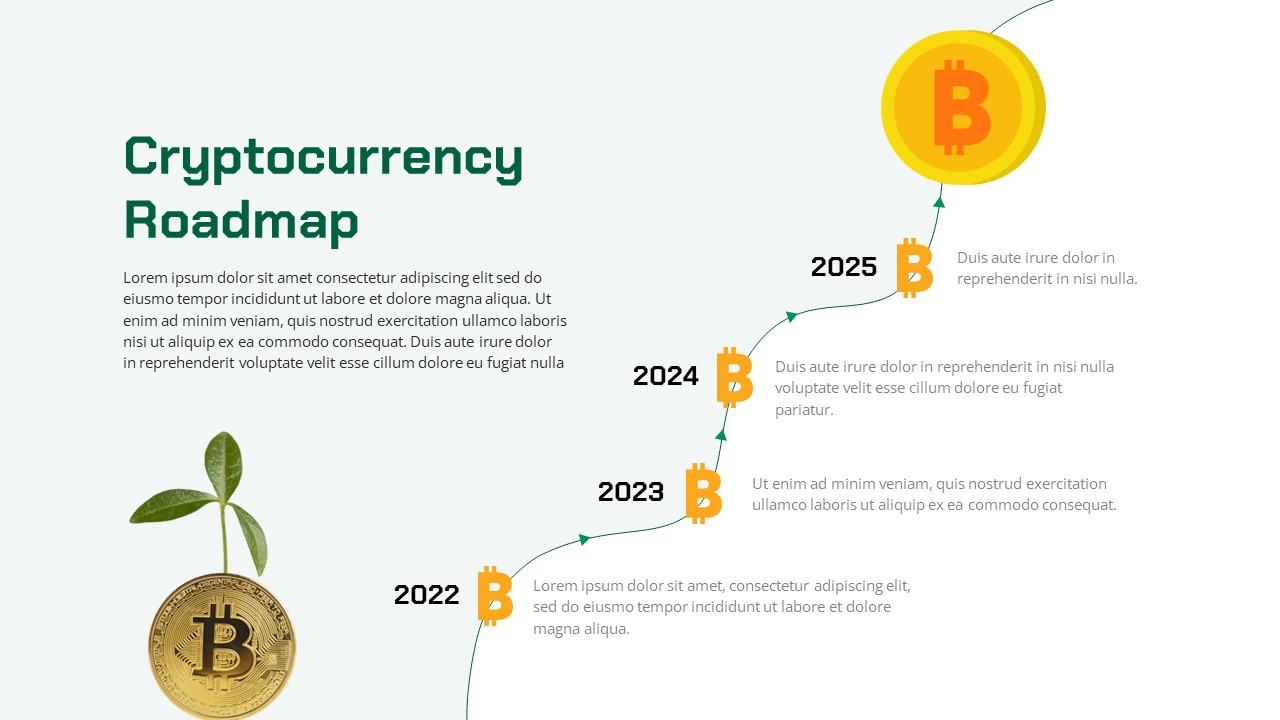
Cryptocurrency Roadmap Infographic Template for PowerPoint & Google Slides
Timeline
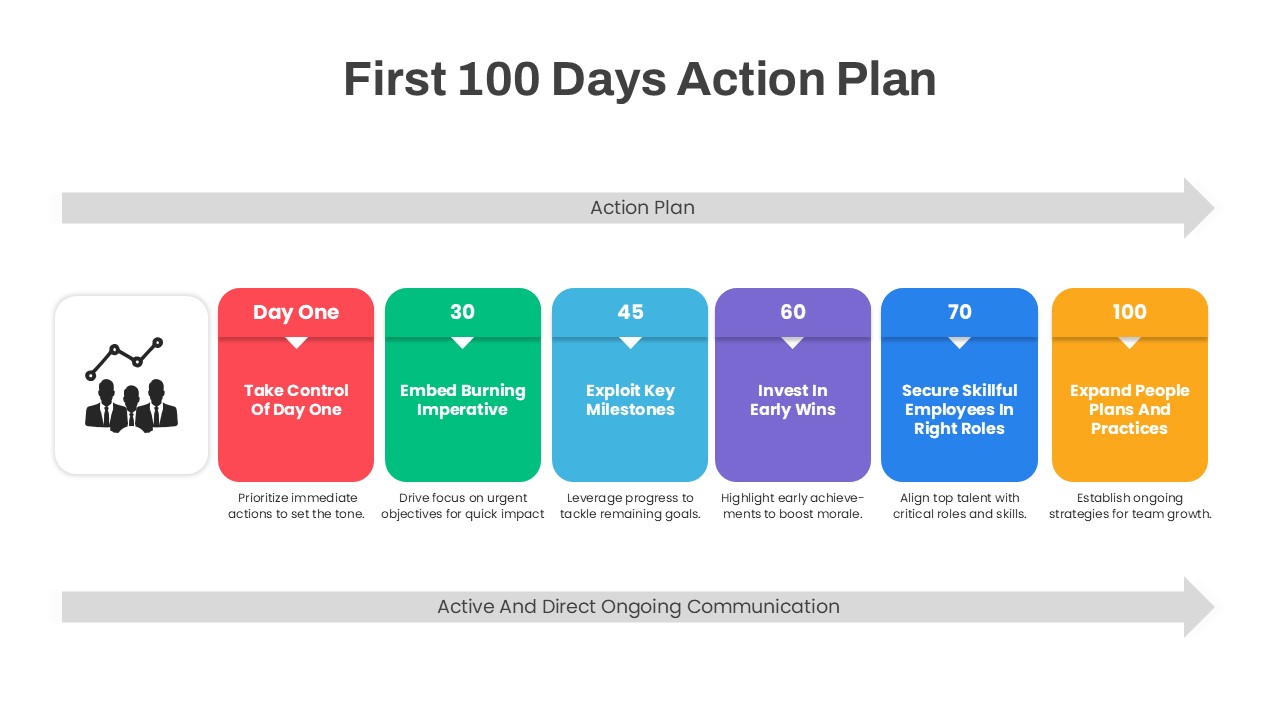
First 100 Days Action Plan PowerPoint Template
Timeline